youth polytechnic students' perception of vocational training in
TRANSCRIPT

264
International Journal of Scientific Research in Education, DECEMBER 2016, Vol. 9(4), 264-310.
Youth Polytechnic Students’ Perception of Vocational
Training in Nandi County, Kenya
Wilson Kipkemboi Mettoi
Department of Educational Communication and Technology
School of Education
Kenyatta University, Kenya.
....................................................................................................................................................................
Abstract
This article investigated Youth Polytechnic Students’ Perception of Vocational
Training in Nandi County, Kenya. The study was guided by five research
questions. A comprehensive literature review was carried. The study adapted
descriptive survey design. A total of 494 respondents participated in the study.
Data was collected using questionnaires, interview schedule, and observation
and document analysis schedule. The study found that there was an urgent need
for the students to change their perceptions towards YPs. Pedagogy is the heart
of teaching; if instructors are armed with all the necessary skills then students
may develop positive perceptions. YPs should be equipped with modern
instructional resources and infrastructure. Instructors for all courses within YPs
curriculum should be availed. Several recommendations were proffered.
Keywords: Youth, Polytechnic Students’, Perception, Vocational Training,
Nandi County, Kenya
Reference to this paper should be made as follows:
Metto, W. K. (2016). Youth Polytechnic Students’ Perception of Vocational
Training in Nandi County, Kenya. International Journal of Scientific Research
in Education, 9(4), 264-310. Retrieved [DATE] from http://www.ijsre.com
....................................................................................................................................................................
Copyright © 2016 IJSRE
INTRODUCTION
All over the world vocational training is recognized as an instrument for economic and social
development. According to International Youth Situational Report, Institutions similar to Youth
Polytechnics (YPs) have been there United Nations Children Education Fund, (UNCEF, 2009).
Every society had its craftsmen. In United States of America (USA), it became popular after
1880; courses in trade schools similar to YPs education that sprang were industrial training, book
keeping, stenography (shorthand) and commercial work. The courses were offered both in

265
private and public institutions. Several laws were enacted in USA, to improve the work force in
industries through skill development on trade schools similar to YPs. In Holland, schools paid
attention to provision of vocational education targeting learners aged 14-16 years.
Italy began vocational education in the 16th century. The Italian architects sought to
make their vocational education professional. Earlier, youth had received training as builders and
stone masons. This did not make them meet the demand of art and sciences. By the end of 18th
century, engineering was established and was being incorporated into technical and industrial
colleges. Africa had different systems of vocational education varying from country to country.
Training was provided in both private and public polytechnics. The West Africa apprenticeship
departments offered the largest opportunity for technical and vocational education. Vocational
training needs not to be overemphasized in Africa because there are many youth who are
unemployed.
In Kenya, youth unemployment has remained a serious problem (UNDP, 2009). Skill-
training programs such as the Youth Polytechnics (YPs) have been initiated to solve this
problem. YPs were established to train primary school leavers in skills for wage and self-
employment (Khiteya, 1996). Since the inception of the 8-4-4 educational reform initiated in
1984, vocational curriculum was emphasized. The aim was to make learners self-reliant upon
completing schooling (Koech, 1999). Vocational training is now widely regarded as an essential
component of any national development policy.
According to Achieng (2012) vocational education is the acquisition of specific skills for
self- employment or career skills such as cookery, dressmaking, carpentry, masonry as well as
working in industries. This type of education is offered to meet needs of individuals and society
as well. The ability of individuals is utilized to the fullest. The YPs in Kenya are institutions that
have the potential to create, develop, mentor and transfer vocational skills and are therefore,
important components where they are situated. As such, the government has seen YPs as agents
for the transfer of vocational skills to the rural communities (Obaka, 2012). Luyali et al. (2015),
studied enrolment trends in YPs in West Pokot. They say that lack of clear curriculum, poorly
trained staff and lack of adequate relevant materials influence enrolment.
Youth constitute the majority of the work force and are hard working. The Directorate of
Youth Affairs (YA) was created on realization that the youth formed the largest segment of the
Kenyan population, yet they faced numerous challenges that prevented them from realizing their
full potential which can be addressed by YPs. These challenges include inadequacy in education
and skills resulting in unemployment and hence crime, HIV/AIDS, drug abuse, political
marginalization, social and economic exclusion (GOK, 2005) as quoted by the former
Government of Youth Affairs (MOYA 2010, December 7th). The skill development exclusion of
young people precludes them from productive contribution to society and the resulting culture of
hopelessness leads to criminal activity among them.
With statistics indicating that persons below the age of 30 constitute majority, it would be
ill advised and imprudent to ignore the potential held by such a group of people (MOYA, 2010).
According to (MOYA, 2010), department of youth training, since its inception, YPs have had
contact with parents, partners, youth serving organizations, youth networks and individual youths
have been contacted in trying to establish a collaborative working relationship in tackling issues
facing the youth of this country. Such consultations are ongoing in various key areas. The
MOYA has concluded work on policy model and curriculum of YPs. While putting together
these data, a lot has been borrowed from the recommendations given by stakeholders in the
provinces, baseline data collected from 200 YPs countrywide and the existing national policies

266
on technical, industrial, vocational and entrepreneurial; training (TIVET) sector locally and
internationally.
However, there are concerns in YPs regarding YPs student perception of vocational
training. Many students feel that they are institutions reserved for academic failures especially
primary school drop outs (Nyerere, 2009). Perception is an idea belief or image created in mind.
According to Mcleod, (2007) & Gregory, (1970), perceptions are a hypothesis created in mind. A
hypothesis is a tentative generalization. Sometimes hypothesis may be followed tested and
verified while occasionally, literal meaning may be taken. Perceptions are formed out of past
experiences, what people know about the idea and beliefs.
This occurs when one’s cherished ideals conflict with underlying ideas. Kenya aims at
being industrialized by 2030 and one of the vehicles of attaining that is through vocational
training. Perception makes learners develop an image and beliefs which become an impediment
to enrolment (MOYA, 2010). There is need for a new national policy on YPs designed to ensure
that such institutions become important skills development centers for the young people. YPs
have in the past not been mainstreamed in the national education and training system and have
hence not received the serious focus they need. But more importantly, many YPs are ill-prepared
for training, as their physical facilities are rundown and equipment are inadequate, obsolete or
not working. More often than not their programs do not allow for horizontal and upward mobility
(MOYA, 2007). It was the intention of the former MOYA to develop modern institutions that
will become every constituency’s centre of excellence. They will provide an effective pathway to
allow KCPE graduates to advance from certificate to degree. Besides that, they will also give an
avenue for a properly harmonized demand driven modular training opportunities for different
target groups in the community.
By changing their perception towards training and subsequently enrolling for the
programs, training will act as the vehicle through which youths are instructed to get the desired
vocational skills, knowledge and attitudes. According to Republic of Kenya (Kamunge, 1988)
report on education, schools in today’s Kenya should emphasize Technical and Vocational
Educational Training. The government has over the last twenty years made attempts to enhance
skill acquisition through the formal school system and in 1985 introduced the 8-4-4 system of
education. This was aimed at increasing the vocationalization of the curriculum and to retain
students in schools longer so as to mature as they leave school and enter the job market. Students
may develop perceptions over the nature of courses, teaching methodologies, instructor
competencies, staff and administration (Nyerere, 2009). Students do those courses that enable
them to get employed. Some students view polytechnics as reservation for those who have
academic challenges.
Further, YPs admit students with low entry behavior and their graduates like others in the
field sometimes may not access ready market for employment. Those hired are also not paid
attractive salaries (Nyerere, 2009). The arguments advanced to rationalize adoption of a
diversified curriculum included the need to alter the negative perception of young people to
manual work and rural livelihood. By improving vocational training, skills acquired will help
reduce rural-urban migration and help integrate schools with communities. Kamau, (2013),
studied the challenges affecting YPs in Kiambu. He says that fees, equipment and curriculum
were some of the challenges affecting YPs training. In 1985 when 8-4-4 was introduced, the
Kenyan government hoped that this would ensure that the graduates of every level had some
scientific and practical knowledge for self-employment, formal employment, or further training
Government of Kenya (GOK, 2005).
267
The Kenya education system often referred to as the 8-4-4 was therefore initiated with a
multi- track diversified curriculum, which combined academic with the pre- vocational and
vocational subjects. Vocational training centers in Kenya known as YPs started as shadow forms
of education. These shadow systems were created as alternative forms of education with the
claim that, due to their flexibility, they were able to be more responsive to the needs of
individuals. Given the period the shadow systems were introduced, they were also considered
as having potential to challenge the formal system, which was not accommodating the masses.
Thus, they were seen as having the potential to act as a catalyst in reforming the formal system.
In Kenya, the shadow system of education referred to as village polytechnics later
became a post-secondary semiformal schooling system. The National Council of Churches of
Kenya (NCCK, 1968) initiated the YPs in 1968 as one of the solutions to the problems of youth
unemployment. In 1971, the government introduced the policy of supporting YPs set up by local
communities and churches. This was a strategy to ensure that school leavers had access to
technical and vocational training. However, questions arise as to why there has been persistent
low enrolment in YPs. It was against this background that the researcher felt the need to
investigate YP students’ perception of vocational training in Nandi County, Kenya.
Statement of the Problem
Despite the rationale for the introduction of YPs to equip the youth with vocational skills, there
are increasing concerns regarding enrolment. Low enrolment in YPs has continuously persisted
despite the fact that the transition rate from primary schools to secondary schools still stands at
only about 70% (MOYA, 2010). According to MOYA, (2010), all YPs register low enrolment
as indicated by statistics in YPs training centers (MOYA, 2010). The main reason as to why YPs
was started was because of the need to instill desired vocational skills to the youth who are
unable to proceed to secondary schools; however, learners are not registering for courses in YPs
creating a vacuum both in theory and practice which informed this research. It is also worthy to
note that learners who failed to proceed to secondary school do not have vocational skills.
Questions arise as to why the learners are not training in these YPs so as to acquire the desired
job related skills.
Majority of class eight leavers who are unable to proceed to secondary school have no
vocational skills thus narrowing their chances of getting jobs. There is no doubt that there is a
close link between skills development and economic growth of any country. The skills acquired
enable a country to spur its industrialization. This implies that we need to prepare the young
people to venture into the informal sector by equipping them with skills that are relevant for the
job market. YPs programs absorb large population of students who cannot progress to the
secondary and higher levels of education. Vision 2030 proposes among other aims intensified
vocationalisation of training. In essence, investing in YPs will provide the impetus for Kenya to
realize vision 2030 of being a newly industrialized nation.
Developed and developing countries such as Japan, Sweden, Brazil and India emphasizes
on acquisition of vocational skills. Currently in Kenya, through the department of Youth Affairs
(YAs), YPs are being revamped with an aim to making them centre’s that offer school leavers
opportunities to acquire competitive skills and knowledge for gainful employment. These
revitalized institutions will also provide alternative paths to attaining higher education in line
with session paper No. 1 of 2005 on Education and Training. It is acknowledged that vocational
training programs in YPs will enhance productivity, competitiveness and stop rural to urban

268
migration in search for jobs. However, for these efforts to bear fruits, potential trainees need to
register in YPs for TIVET courses. But how is their perception of YPs? Further, the skills learnt
should be relevant to the job market and the instructors should be competent. It was against this
background that the researcher felt the need to investigate students’ perception towards
vocational training in YPs in Nandi County, Kenya.
Purpose of the Study
The purpose of this study was to investigate YPs student perception of vocational training in
Nandi County, Kenya. This was in the light of low enrolment registered in YPs over the years
2000-2013. YPs was started so as to absorb those learners completing class eight who cannot
proceed to secondary schools. However, there has been a vacuum created both in theory and
practice because of persistent low enrolment registered in YPs (UNDP, 2009). The independent
variables are institutional, student, examination and career related factors while dependent
variable is student perception. Certification for the courses is the mitigating variable. All the
above factors interact and the outcome is students’ perception
The study was guided by the following objectives:
To investigate YP students’ perception of vocational training;
INDEPENDENT VARIABLES DEPENDANT VARIABLES
INSTITUTIONAL RELATED
Nature of courses offered,
Teaching methodology, Instructors competencies in executing curriculum,
Learning resources, staff
and administration, status of infrastructure.
CAREER RELATED
Availability of opportunities
in the job market,
Openings for upward mobility.
STUDENT RELATED Age influence,
Gender influence
Learner social status, Ability of the learner
EXAMINATION
RELATED
Entry grades into courses,
Final grades.
STUDENTS’
PERCEPTION
ENROLMENT
TEACHING STYLE,
EXAMS AND
CERTIFICATION
INTERACTING
VARIABLES
Figure 1: Dependent and independent variables

269
To ascertain YP students’ perception of instructor competencies;
To establish YP students’ perception of skills learnt;
To investigate YP students’ perception of teaching strategies and methods used in the
training;
To explore YP students’ challenge experienced.
Research Questions
The study attempted to answer the following questions:
What is the YP students’ perception of vocational training?
How is the YP students’ perception of instructor competencies?
What is the YP students’ perception of skills learnt?
What are YP students’ perception of the teaching strategies and methods?
What is the YP students’ challenge experienced?
LITERATURE REVIEW
Theoretical Framework
This study was guided by Mcleod, (2007) and Gregory, (1970) theory of visual perception.
According to Mcleod (2007), we are equipped with sense organs e.g. eye, ear, and nose. Each
sense organ is part of a sensory system which receives sensory inputs and transmits sensory
information to the brain. Sensory inputs are somehow converted into perceptions. He argues that
perception processes are not direct, but depend on the perceiver's expectations and previous
knowledge as well as the information available in the stimulus itself. Prior knowledge can make
one to develop a feeling towards situation at hand. Past experiences, what people have said, what
they say influence one’s image formed. The feeling or image created becomes inbuilt so that one
will retrieve it any time a similar situation arises. Information will be stored in the memory and is
applied when one sees what had been seen and perception built previously. However, sometimes
there could be illusions which may make people interpret situations wrongly. Gregory, (1970)
also says that when we see something it goes to the brain which will interpret it based on prior
knowledge, past experiences and beliefs. Interpretation goes through hypothesis testing.
Sometimes he says that we may get wrong ambiguous interpretation depending on
personality and one’s view. These theories were deemed appropriate compared with other
competing theories because they touched on the field of interest to the researcher. The theories
were deemed appropriate and important to the researcher because they explained how
perceptions are formed in life and its effects. Further, reasons as to why people form perceptions
are brought to light. The theory has correlation with the present study because perceptions are
formed out of past experiences and what people know as described by (Mcleod, 2007) and
(Gregory, 1970). Perceptions as given in the study sometimes are illusions which make learners
feel that skill development may not be formed from such institutions. But in reality learners can
learnt skills in YPs which can make them become useful members of the society.

270
Historical Background of Youth Polytechnics and Related Studies
Historical attempts to upgrade man’s abilities in skill acquisition and knowledge are broad and
varied. They range from the early works of (Skinner, 1961) on stimulus response, (Gagne, 1966)
categories of learning, (Brunner, 1966) theory of instruction and (Hamred, 1967) systematic
instructional product development. Vocational training centers in Kenya known as Youth
Polytechnics (YPs) started as shadow system forms of education. These shadow systems were
created as alternative forms of education with the claim that, due to their flexibility, they were
able to be more responsive to the needs of individuals than the existing educational institutions.
Given the period the shadow systems were introduced, they were also considered as having
potential to challenge the formal system which was not accommodating the masses. Thus, they
were seen as having the potential to act as a catalyst in reforming the formal system. In Kenya
the shadow system of education came to be known as village polytechnics, which later became a
post- secondary semiformal schooling system. The National Council of Churches of Kenya
(NCCK) initiated YPs in 1968 as one of the solutions to the problems of youth unemployment.
In 1971 the Government introduced the concept of supporting YPs set up by local
communities and churches. This was a strategy to ensure that school leavers had access to
technical, entrepreneurial and business skills. This would enable them engage in income
generating activities hence improve the standards of communities in which they live and stem
rural- urban migration. Local communities, religious and other non-governmental organizations
with support from and development partners have, for many years contributed to putting up YPs
in different parts of the country. Between 1966 and 1972 there were more than 53 village
polytechnics involved in training high school graduates in various vocational subjects (e.g.
carpentry, accounts, welding, mechanics and catering) leading to certificate or diploma awards in
Kenya.
Village polytechnics started as low-cost, post primary training centers in rural areas. The
differences between the village polytechnic and formal secondary school system were in terms of
; dimensions, catchments and service, recruitment criteria, capital facilities, curriculum, medium
of instruction, standards, form of instruction, leadership, organization, time period, national
administration and responsibility for graduates. Some of the key differences include; the formal
system was national while village polytechnics were local: - the formal system was expensive
while village polytechnics were low cost, the curriculum in the formal system was standardized
and group- oriented while the village polytechnics were unbounded and individualized and the
medium of instruction was English in the formal system while in the polytechnics it was
vernacular and Swahili. At the time they were created, Kenya was producing about 100,000
primary school graduates each year that could not be employed in the modern sector of the
economy (NCCK, 1968). With the spirit of self-help it was believed that village polytechnics
could be part of solution to the problem presented by formal schooling and as a means to
alleviate unemployment (NCCK, 1968).
As Kenya advanced in trade and industry in 1970s the demand for education and training
increased, prompting many rural communities to build more youth polytechnics. In 1982, there
were about two hundred and ninety YPs under government assistance and several hundred that
were unaided. To date the registered YPS number over seven hundred and fifty. The courses that
YPs offered were designed to meet local needs and typical ones included motor repair, metal
work, tailoring, carpentry and woodwork, food production and animal husbandry. In terms of
enrolment, a 2002 survey in Central Province for example found that of a total enrolment of

271
5634 trainees, 35% were girls and of these girls, 32% enrolled for courses in tailoring and home
economics. Boys on the other hand enrolled in carpentry, masonry, metalwork, leatherwork and
electrical trades (NCCK, 1968).
A recent survey carried out in 279 YPs showed that out of a total enrolment of 16,415
students, only 30% percent were girls (MOYA, 2010). The gender distribution of the courses had
more boys (between 50% and 96%) taking plumbing, painting and sign writing, motor
mechanics and welding as compared to girls. Only a few girls (between 4% and 30%) took
courses in welding and fabrication, carpentry and joinery or masonry. Majority of the girls were
enrolled in tailoring and dressmaking. In brief the administrative structure of the existing YPs
can be categorized as follows; Community owned and Government assisted YPs. Around 370 fit
into this group; Community owned with no government assistance. These are owned by the local
communities but not receiving any support from government, church owned with no government
assistance, privately owned with no government assistance, the economic decline that affected
the country till 2003 had adverse effects on the polytechnics, especially in rural areas, depriving
them of financial and administrative support from the government. Vocational system in general
has also suffered an absence of clear policy at national and local levels leading to decline of the
sector (MOYA, 2007). Kangombe (2012) studied the factors influencing youth enrolment levels
in public youth polytechnics in Mombasa. He says the social- economic and cultural factors
influence enrolment.
Altinyelken, (2004) stated that the World Banks position on TIVET has changed
radically in the past two decades. They emphasize and support TIVET. According to a report
USAID (2007), allocated 72% of total. The government and other stakeholders have engaged
other development partners in realizing donor interventions. The Ministry of Science and
Technology in Kenya formally requested for technical assistance from the Netherlands
Government to strengthen TIVET. Nyerere (2009) states that Technical, Industrial, Vocational
and Entrepreneurship Training (TIVET) in Kenya encompasses technical training institutions ,
MSE training and demonstration centers, YPs and national and youth service skills development
centers . YPs provide TVET with life skill training to young people in order to increase
employment (http/www/leakenya.or.ke, 2013). There are also other institutions that offer TIVET
programs spread across ministries as well as private institutions. According to Government of
Kenya, session paper NO.1, (2005), graduates from TIVET institutions are awarded certificates
and Diploma in various disciplines. Currently two national polytechnics, the Kenya and
Mombasa have been upgraded to University colleges offering degrees in TIVET discipline and
will continue to offer certificate and diploma programs.
The Kenya Education Sector Support Programs (KESSP, 2010) noted that the general
election crisis of December 2007 highlighted the problems of a large population of unskilled
unemployed youth amidst growing poverty. To address some of the underlying causes of the
relentlessness among youth, the government made initiative for skills development through YPs.
KESSP (2010) states the aims and purpose of TIVET in Kenya to include:-Involvement of
stakeholders in the development of national skills training strategy, establishment of mechanism
and appropriate incentives to promote private sector investments in the development of TIVET.
Palmer, (2007) in his study entitled “ what room for skills development in post primary
education took selected countries , Ethiopia, Ghana, Kenya, Rwanda, India, China and Vietnam
and examines what room there is for skills development in post primary education . The study
asserts that in many environments, both formal and informal institutions (school or vocational
centers), Rwanda has the highest enrolment in TIVET at secondary level (35%), followed by

272
Tanzanian 13% and south Africa 5.8%. The study notes that Sub-Sahara Africa had 6.1% and
South and West Asia have little room for TIVET at the post –primary school level.
Given that Africa lags behind the rest of the world in technology and still it continues to
pay little attention to technical education and technological research. The trend is worrying and
so Africa must rise to the occasion by championing learning of TIVET or vocational courses. In
Kenya, there have been deliberate efforts to structure and deliver formal TIVET education
through establishment of YPs institutions either by the government or the private sector. There
were 697 YPs under ministry of youth affairs and sports as at 2012 (MOYA, 2012). Ministry of
Education (MOE) (2013) order given in 2007 to directorate of youth training, to take charge of
YPs training has been changed vie notice no.2/2013 and transferred to MOE.
However, no formal YPs sector just like the informal sector has been neglected by the
government particularly in relation to the organizations of systems and structures. The
Government has policies for the sector but challenges in implementing makes it difficult thus,
enabling the private sector to exploit it. The YPs sector has been generally left to intervene,
which is done at programs levels hence few target groups reached. The Millennium Development
Goals Committee (MDGC, 2007) noted that TIVET is a significant sector in the education that
generates a lot of attention. However in some countries like Kenya, equally a lot of attention
should be given. This would enable trainees engage in income generating activities hence
improve the standards of communities in which they live, and stem rural–urban migration. Local
communities, religious and other non- governmental organizations with support from
government and development partners have for many years contributed to putting up youth
polytechnics in different parts of the country.
In order to overcome the challenge of youth education and training, MOYA plans to
improve the quality of education, make training and education more accessible, strengthen
alternative learning systems and review education training policy and practices and equip the
youth with relevant skills, knowledge and attitudes for labor market as included in the strategic
plan 2007-2012. Towards meeting the objective of improving the relevance of skills being
imparted to youth at YPs, the Ministry is working together with KICD to revise the curriculum.
The objectives of revised curricular are among others to prepare the youth for productive
livelihoods that contribute to sustainable economic development, to impart marketable and
technical skills that respond to contemporary labor market demands by industry as well as to
build on gains acquired in basic primary education for self-employment. In Kenya, several key
actors are involved in the TIVET sector; they undertake activities that include curriculum
development and implementation, industrial training, internship, pupilage attachments, funding
and donation of equipment and exchange of teachers, lecturers within different institution. This
is yet to be fully implemented. The key actors are:-the government, examination bodies like
Kenya National Examinations Council, other training institutions, publishers both private and
public, private sector civil society, NGOS and artisans/local authorities. This web of actors needs
to be regulated and a clear operational plan set, current engagement of these actors has led to
duplication of responsibilities, inefficiencies in management and coordination, wastage of
resources among other problems. The government needs to have a well-defined mechanism that
will streamline and guide the actors towards a desired direction that does not upset the sector.
There is need to have a clear line between actors in the formal education, informal so that
meaningful synergy is developed. Nyerere (2009) noted that for Kenya to enhance transition
from primary to TIVET, the government needs to set the objective of enhancing access to TIVET
programs through improved infrastructure and training. A five year investment program to
273
revitalize YPs is to be provided with funds for purchase of equipment, enhancement of physical
facilities at an estimated cost of ksh.1.2 billion. Many donors currently channel the majority of
their aid for education into achieving the Universal Primary Education and Gender Parity.
Nyerere (2009) says that developed and developing countries such as Italy, Brazil, China,
Sweden and Japan have given more recognition to technical, entrepreneurial and business.
However, in Kenya, the youth polytechnics which offer the same courses have an image
problem. It was against this background that the researcher felt the need to investigate the effect
of perception towards youth polytechnics on enrolment for technical, entrepreneurial and
business skills in Nandi County, Kenya.
Njati (2011) studied the impact of vocational training for rural development in Nyabene
District Kenya and found out that the YPs needed to be equipped with the necessary
infrastructural materials for them to function effectively. Ondigi (2007) in his publication wrote
an article entitled, “Students attitudes towards vocational training in YPs, in Gusii District,
Nyanza province”. The above study has correlation with the study in progress. Perceptions could
be either positive or negative depending on the past, present and future expected experience. He
also further found out that YPs are very important avenues for skill development among the
youth. He called upon the youth to change their perceptions towards training in YPs so as to
acquire the technical skills that can make them self-reliant. Khiteya, (1996) took a research in
the YPs in Kakamega in Kenya on the context of the 8-4-4 system of education. He noted that
the 8-4-4 system at primary level equip learners with vocational skills. However, he said the
skills obtained need to be further sharpened by enrolling for training in YPs. He also found out
that quite a number of the class eight graduates do not go to secondary schools.
He stated that youth unemployment has remained a serious problem in Kenya. Relevant
education system and skill-training programs such as the Youth Polytechnics (YPs) have been
initiated to solve this problem. YPs were established to train primary school leavers in skills for
wage and self-employment. Since the inception of the new 8-4-4 vocational curriculum, it is not
clear as to whether YPs should reinforce the skills given by the primary school or not; hence the
need to investigate YPs student perception of vocational training. According to Owano, (2012)
on education for employment; the contribution of the YPs program to youth employment in
Kenya, he said that youth unemployment has remained a serious problem in many third world
countries during the past three decades. Efforts to solve the problem have included initiation of
education and training programs for youths both in school and out of school. Among these
programs is the YPs Program of Kenya initiated by the National Christian Council of Kenya
(NCCK, l968) and originally known as the Village Polytechnic Program.
A village polytechnic was envisaged as a low cost informal training program initiated,
financed and managed by the local community to impart practical skills for self-employment to
primary school leaver (NCCK, 1968). Okoth, (2009) in his study entitled “A critical analysis of
curriculum offered at Maseno YP, Emuhaya District Western province”, found out that the
curriculum in YPs needed to be mainstreamed in the national system to facilitate standardization.
He also called upon the potential trainees to register for the courses in YPs. This statement
concurs with what the directorate of Youth Affairs (YA) are in the process of doing. They are
developing an improved curriculum with the KICD.
274
Perception and Theories
According to Achieng, (2012), factors affecting acquisition of vocational skills among youth
learners in Maranda Division Siaya, trainees who join technical or vocational centers for training
already have formed opinions, some of which are culturally biased. They are found in some
cultural beliefs and practices among Kenyan communities towards technically industry related
work. Some communities view YPs as places of low status. Masonry, tailoring, carpentry,
driving, dressmaking and metal work are despised. The community in Maranda Division said
these jobs were for other people not their children.
Totally Integrated Quality Education and Training (TIQET) chaired by Government of
Kenya (Koech, 1999) pointed out that one of the hindrance to development of skills is perception
found in some cultural beliefs and practices among a number of Kenyan communities. One
important recommendation of (Koech, 1999) commission was that education be designed to play
a deliberate role of demystifying the negative attitude towards YPs which is equally the same as
perception. Irumbis, (1990) study on the relationship between attitudes and performances in
mathematics found that perception play a vital role in determining the pupils’ performance in the
subject. Pupils with negative perceptions failed.
Perception (from the Latin perceptio, percipio) is the process of attaining awareness or
understanding of the environment by organizing and interpreting sensory information. Munn &
Fernald, (1972:) said that perception aspect has caused considerate concern in education. It
involves the tendency to evaluate something. Perceptions are acquired in life out of conflicts and
a principle underlying the idea or something and one’s cherished ideals. All perception involves
signals in the nervous system, which in turn result from physical stimulation of the sense organs.
For example, vision involves light striking the retinas of the eyes, smell is mediated by odor
molecules and hearing involves pressure waves. According to Banners (1993), perceptions
sometimes change as explained by consistency theory advanced by (Festinger, 1975) this change
can be registered through motivation.
Perception is not the passive receipt of these signals, but can be shaped by learning,
memory and expectation. Perception involves these "top-down" effects as well as the "bottom-
up" process of processing sensory input. Perception depends on complex functions of the
nervous system, but subjectively seems mostly effortless because this processing happens outside
conscious awareness. Since the rise of experimental psychology in the late 19th Century,
psychology's understanding of perception has progressed by combining a variety of techniques.
Psychophysics measures the effect on perception of varying the physical qualities of the input.
Sensory neuroscience studies the brain mechanisms underlying perception. Perceptual systems
can also be studied computationally, in terms of the information they process. Perceptual issues
in philosophy include the extent to which sensory qualities such as sounds, smells or colors exist
in objective reality rather than the mind of the perceiver.
Although the senses were traditionally viewed as passive receptors, the study of illusions
and ambiguous images has demonstrated that the brain's perceptual systems actively and pre-
consciously attempt to make sense of their input. There is still active debate about the extent to
which perception is an active process of hypothesis testing, analogous to science, or whether
realistic sensory information is rich enough to make this process unnecessary. The perceptual
systems of the brain enable individuals to see the world around them as stable, even though the
sensory information may be incomplete and rapidly varying (Gregory, 1970).
275
Human and animal brains are structured in a modular way, with different areas
processing different kinds of sensory information. Some of these modules take the form of
sensory maps, mapping some aspect of the world across part of the brain's surface. These
different modules are interconnected and influence each other. For instance, the taste is strongly
influenced by its odor.
According to Mcleod, (2007) in order to receive information from the environment we
are equipped with sense organs e.g. eye, ear, and nose. Each sense organ is part of a sensory
system which receives sensory inputs and transmits sensory information to the brain. A particular
problem for psychologists is to explain the process by which the physical energy received by
sense organs forms the basis of perceptual experience. Sensory inputs are somehow converted
into perceptions of desks and computers, flowers and buildings, cars and planes; into sights,
sounds, smells, taste and touch experiences.
A major theoretical issue on which psychologists are divided is the extent to which
perception relies directly on the information present in the stimulus. Some argue that perceptual
processes are not direct, but depend on the perceiver's expectations and previous knowledge as
well as the information available in the stimulus itself. This controversy is discussed with respect
to (Gibson, 1966) who has proposed a direct theory of perception which is a 'bottom-up' theory,
and (Gregory, 1970) who has proposed a constructivist (indirect) theory of perception which is a
'top-down' theory. Psychologists distinguish between these two types of processes in perception:
bottom-up processing and top-down processing. Bottom-up processing is also known as data-
driven processing, because perception begins with the stimulus itself. Processing is carried out in
one direction from the retina to the visual cortex, with each successive stage in the visual
pathway carrying out ever more complex analysis of the input. According to (Gregory, 1970),
top-down processing refers to the use of contextual information in pattern recognition. For
example, understanding difficult perceptions is easier when a complete situation is analyzed and
isolated. This is because the meaning of the surrounding words provides a context to aid
understanding.
Psychologist, Gregory (1970) argued that perception is a constructive process which
relies on top-down processing. For him, perception involves making inferences about what we
see and trying to make a best guess. Prior knowledge and past experience, he says, are crucial in
perception. When we look at something, we develop a perceptual hypothesis, which is based on
prior knowledge. The hypotheses we develop are nearly always correct. However, on rare
occasions, perceptual hypotheses can be disconfirmed by the data we perceive. A lot of
information reaches the eye, but much is lost by the time it reaches the brain (Gregory, 1970)
estimates about 90% is lost. Therefore, the brain has to guess what a person sees based on past
experiences. We actively construct our perception of reality.
Gregory (1970) proposed that perception involves a lot of hypothesis testing to make
sense of the information presented to the sense organs. Our perceptions of the world are
hypotheses based on past experiences and stored information. Sensory receptors receive
information from the environment, which is then combined with previously stored information
about the world which we have built up as a result of experience. The formation of incorrect
hypotheses will lead to errors of perception (e.g. visual illusions like the Necker cube). Evidence
to support (Gregory's, 1970) theory. 'Perception allows behavior to be generally appropriate to
non-sensed object characteristics’. For example, we respond to certain objects as though they are
doors even though we can only see a long narrow rectangle as the door is ajar. 'Perceptions can
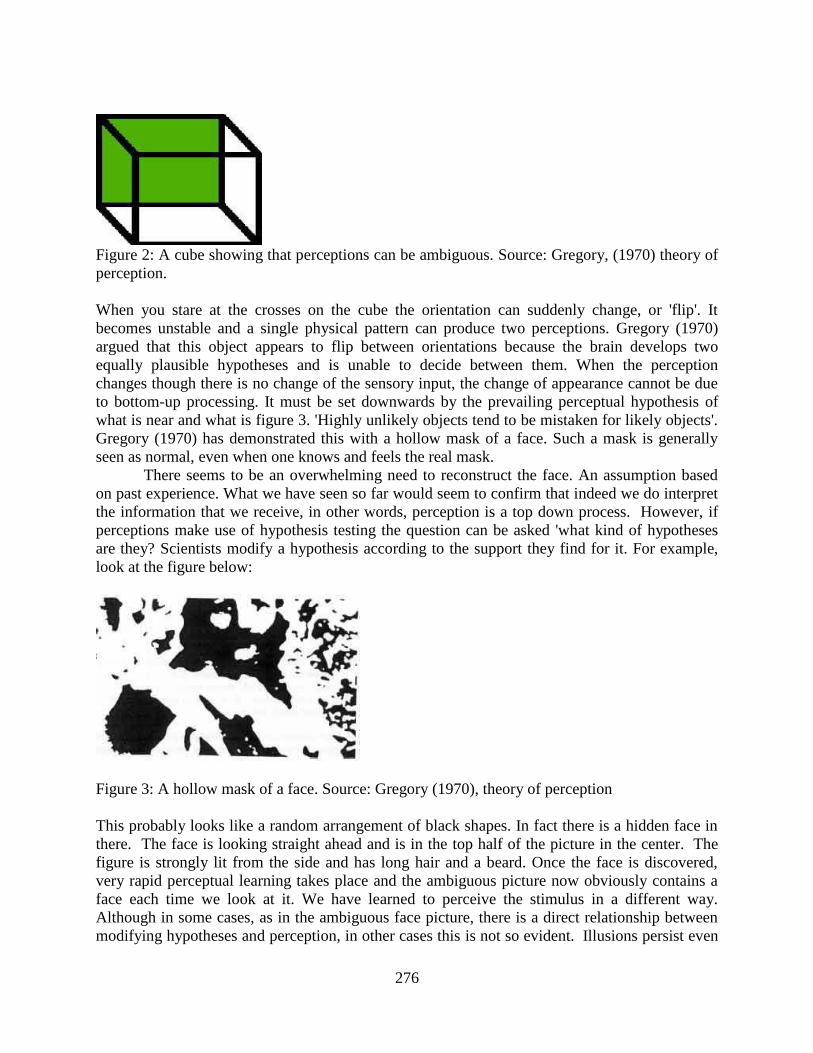
be ambiguous'
276
Figure 2: A cube showing that perceptions can be ambiguous. Source: Gregory, (1970) theory of
perception.
When you stare at the crosses on the cube the orientation can suddenly change, or 'flip'. It
becomes unstable and a single physical pattern can produce two perceptions. Gregory (1970)
argued that this object appears to flip between orientations because the brain develops two
equally plausible hypotheses and is unable to decide between them. When the perception
changes though there is no change of the sensory input, the change of appearance cannot be due
to bottom-up processing. It must be set downwards by the prevailing perceptual hypothesis of
what is near and what is figure 3. 'Highly unlikely objects tend to be mistaken for likely objects'.
Gregory (1970) has demonstrated this with a hollow mask of a face. Such a mask is generally
seen as normal, even when one knows and feels the real mask.
There seems to be an overwhelming need to reconstruct the face. An assumption based
on past experience. What we have seen so far would seem to confirm that indeed we do interpret
the information that we receive, in other words, perception is a top down process. However, if
perceptions make use of hypothesis testing the question can be asked 'what kind of hypotheses
are they? Scientists modify a hypothesis according to the support they find for it. For example,
look at the figure below:
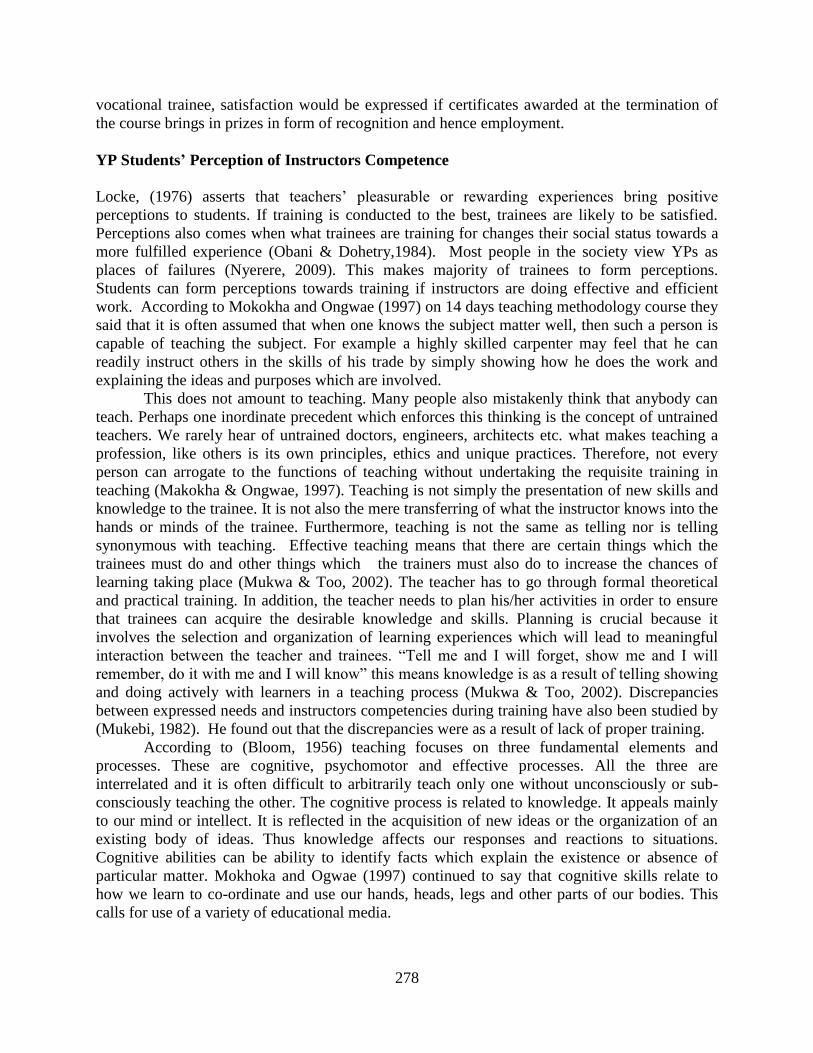
Figure 3: A hollow mask of a face. Source: Gregory (1970), theory of perception
This probably looks like a random arrangement of black shapes. In fact there is a hidden face in
there. The face is looking straight ahead and is in the top half of the picture in the center. The
figure is strongly lit from the side and has long hair and a beard. Once the face is discovered,
very rapid perceptual learning takes place and the ambiguous picture now obviously contains a
face each time we look at it. We have learned to perceive the stimulus in a different way.
Although in some cases, as in the ambiguous face picture, there is a direct relationship between
modifying hypotheses and perception, in other cases this is not so evident. Illusions persist even

277
when we have full knowledge Gregory (1970). One would expect that the knowledge we have
learned (from, say, touching the face and confirming that it is not 'normal') would modify our
hypotheses in an adaptive manner. The current hypothesis testing theories cannot explain this
lack of a relationship between learning and perception.
A perplexing question for the constructivists who propose perception is essentially top-
down in nature is 'how can the neonate ever perceive? If we all have to construct our own worlds
based on past experiences why are our perceptions so similar, even across cultures? Relying on
individual constructs for making sense of the world makes perception a very individual and
chancy process. The constructivist approach stresses the role of knowledge in perception and
therefore is against the natives approach to perceptual development. However, a substantial body
of evidence has been accrued favoring the natives approach, for example: Newborn infants show
shape constancy (Slater & Morison, 1985); they prefer their mother's voice to other voices
(Casper & Fifer, 1980); and it has been established that they prefer normal features to scrambled
features as early as 5 minutes after birth.
Perhaps the major criticism of the constructivists is that they have underestimated the
richness of sensory evidence available to perceivers in the real world (as opposed to the
laboratory where much of the constructivists' evidence has come from). Constructivists like
Gregory frequently use the example of size constancy to support their explanations. That is, we
correctly perceive the size of an object even though the retinal image of an object shrinks as the
object recedes. They propose that sensory evidence from other sources must be available for us
to be able to do this. However, in the real world, retinal images are rarely seen in isolation (as is
possible in the laboratory). There is a rich array of sensory information including other objects,
background, the distant horizon and movement. This rich source of sensory information is
important to the second approach to explaining perception that we will examine, namely the
direct approach to perception as proposed by (Gibson, 1966).
Gibson (1966) argued strongly against the idea that perception involves top-down
processing and criticizes (Gregory, 1970) discussion of visual illusions on the grounds that they
are artificial examples and not images found in our normal visual environments. This is crucial
because Gregory accepts that misperceptions are the exception rather than the norm. Illusions
may be interesting phenomena, but they might not be that informative about the debate. Gibson
(1966) argues that perception is direct, and not subject to hypotheses testing as (Gregory, 1970)
proposed. There is enough information in our environment to make sense of the world in a direct
way. For Gibson (1966), sensation is perception: what you see is what you get. There is no need
for processing (interpretation) as the information we receive about size, shape and distance etc. is
sufficiently detailed for us to interact directly with the environment. For example, support of the
argument that perception is direct is motion parallax.
As we move through our environment, objects which are close to us pass us by faster
than those further away. The relative speed of these objects indicates their distance away from
us. This is evident when we are travelling on a fast moving train. Gibson (1966) argued that
perception is a bottom-up process, which means that sensory information is analyzed in one
direction: from simple analysis of raw sensory data to ever increasing complexity of analysis
through the visual system.
Glimmer and Deci (1977) point out that student will hold favorable perceptions towards
activities they are doing if they provide them with rewards. Therefore, although the above
statement talks about job satisfaction, the same would apply to vocational skills acquisition.
Students would express satisfaction if rewards or other outcomes satisfy them. In the case of
278
vocational trainee, satisfaction would be expressed if certificates awarded at the termination of
the course brings in prizes in form of recognition and hence employment.
YP Students’ Perception of Instructors Competence
Locke, (1976) asserts that teachers’ pleasurable or rewarding experiences bring positive
perceptions to students. If training is conducted to the best, trainees are likely to be satisfied.
Perceptions also comes when what trainees are training for changes their social status towards a
more fulfilled experience (Obani & Dohetry,1984). Most people in the society view YPs as
places of failures (Nyerere, 2009). This makes majority of trainees to form perceptions.
Students can form perceptions towards training if instructors are doing effective and efficient
work. According to Mokokha and Ongwae (1997) on 14 days teaching methodology course they
said that it is often assumed that when one knows the subject matter well, then such a person is
capable of teaching the subject. For example a highly skilled carpenter may feel that he can
readily instruct others in the skills of his trade by simply showing how he does the work and
explaining the ideas and purposes which are involved.
This does not amount to teaching. Many people also mistakenly think that anybody can
teach. Perhaps one inordinate precedent which enforces this thinking is the concept of untrained
teachers. We rarely hear of untrained doctors, engineers, architects etc. what makes teaching a
profession, like others is its own principles, ethics and unique practices. Therefore, not every
person can arrogate to the functions of teaching without undertaking the requisite training in
teaching (Makokha & Ongwae, 1997). Teaching is not simply the presentation of new skills and
knowledge to the trainee. It is not also the mere transferring of what the instructor knows into the
hands or minds of the trainee. Furthermore, teaching is not the same as telling nor is telling
synonymous with teaching. Effective teaching means that there are certain things which the
trainees must do and other things which the trainers must also do to increase the chances of
learning taking place (Mukwa & Too, 2002). The teacher has to go through formal theoretical
and practical training. In addition, the teacher needs to plan his/her activities in order to ensure
that trainees can acquire the desirable knowledge and skills. Planning is crucial because it
involves the selection and organization of learning experiences which will lead to meaningful
interaction between the teacher and trainees. “Tell me and I will forget, show me and I will
remember, do it with me and I will know” this means knowledge is as a result of telling showing
and doing actively with learners in a teaching process (Mukwa & Too, 2002). Discrepancies
between expressed needs and instructors competencies during training have also been studied by
(Mukebi, 1982). He found out that the discrepancies were as a result of lack of proper training.
According to (Bloom, 1956) teaching focuses on three fundamental elements and
processes. These are cognitive, psychomotor and effective processes. All the three are
interrelated and it is often difficult to arbitrarily teach only one without unconsciously or sub-
consciously teaching the other. The cognitive process is related to knowledge. It appeals mainly
to our mind or intellect. It is reflected in the acquisition of new ideas or the organization of an
existing body of ideas. Thus knowledge affects our responses and reactions to situations.
Cognitive abilities can be ability to identify facts which explain the existence or absence of
particular matter. Mokhoka and Ogwae (1997) continued to say that cognitive skills relate to
how we learn to co-ordinate and use our hands, heads, legs and other parts of our bodies. This
calls for use of a variety of educational media.

279
We can manipulate things using our psychomotor abilities such as manual (using hands)
skills in carpentry, Garment- making, motor vehicle mechanics, masonry etc., undertaking any
other trade skill or craft. Affective means feelings and attitudes. Our feelings and attitudes reflect
the values we are associated with. Some values are positive and progressive while others are
negative and archaic. Affective teaching seeks to promote positive values and attitude while at
the same time gradually, but systematically chipping at those which are negative and disruptive.
Attitudes and values greatly influence not only what we do, but also how we do. Carl (1985) said
that effective learning is fostered by masterful teaching. This means teachers should develop
ability for making complex or difficult material simple enough for their learners. Successful
teachers are those who display good mastery of the subject they teach, use language which
learners understand easily., break down the content or lesson into simple manageable yet
systematic blocks, help learners to learn on their own rather than depending wholly on the
teacher, makes learners creative and critical in order to fully understand the idea, art or skill
being taught, ability to review, test and confirm, if not apply what has been taught (Mukwa &
Too, 2002).
YP Students’ Perception of Skills Learnt
Primary school leavers from within immediate community are the trainees recruited to YPs
centers, more so those who have missed form one places (Nyerere, 2009). In most of these
training centers, trainees take a period of two years to complete training. They train in
vocational skills such as masonry, carpentry and joinery, metal work, plumbing and tailoring.
One of the recommendations of the Government of Kenya (Koech’s, 1997) commission was that
the success of YPs depended on the support the government of Kenya gave. Achieng (2012)
holds that YPs must take initiative and develop good strategies and aggressive program for their
students that will alleviate the problems affecting people living in the neighborhood.
A study carried out by Owano (1988) on contribution of YPs in vocational training
centers had it that YPs only cater for a very tiny fraction of the unemployed primary school
leavers and he goes further to assert that a narrow spectrum of skills needed in the rural areas
were being taught. Owano (1988) further said that there should be a close link or cohesion
between YPs and Jua – Kali sectors for providing quality training to the latter in order to
improve quality of products. Achieng, (2012) said that most YPs offer practical skills usually
masonry, carpentry, tailoring dressmaking, knitting, home economics and livestock raising.
According to Nyerere (2009) on TIVET sector mapping in Kenya, Kenya has not been keened to
produce human resources suited to labor market demand. A large number of the trainees are not
effectively trained to offer what the labor market requires. Kenya like a great number of sub-
Sahara Africa has a strong desire to place investment in tertiary education despite the fact that a
majority of Kenya’s economy is composed of the informal sector.
It is noted that in Kenya, the educative and industry sectors exist separately from each
other. The importance of the students is being ignored, discussion of these matter, has failed to
probe deeper, resulting in lack of realistic policy linking school education to the labor market.
Another reason for the low rate of people reaching employment through technical and vocational
education is based on commonly-held belief that technical and vocational education are lower in
value than academic courses . However, the government’s role in TIVET sector is not limited to
the management of vocational training schools to the contrary in order that human resources
effectively contribute to industrial development; only the government has the capacity to carry

280
out the establishment of laws, policies, system and assistance to private human resource
development institutions to deliver on the task.
Some of the emerging issues are:-Mismatch of labor production and the market
requirements, need to enhance employability through practical hands on exposure to actual work
settings by integrating TIVET in the various phases of internship or attachment. The changing
trends globally particularly in ICT and increase in production costs has left the Kenya lagging
behind in TIVET. The sector in the country needs to keep pace with the dynamics in the market
for it to remain relevant and cost effective. This is one of the ways in which TIVET graduate will
call for a well co-ordinate industrial exposure programs for trainees in TIVET institution.
According to Nyerere (2009) the curriculum developers should go a step further and
support access to technical, entrepreneurial and business skill. This is possible if the face of the
YPS is changed completely. Competitive courses market driven should be offered. Quality
orientation and creativity in TIVET, both at micro and macro levels, is important if the sector is
to produce competent labor for both local and international market. There is need to invest in
technologies and exposures that will make these institutions meet international standards.
Employees are yet to appreciate the need for well-trained human resources—legislations that
enhance partnership between the private sector and the TIVET programs should be formulated to
enhance proper planning and implementations of training programs in the country.
Unemployment rate is high among the youth (in crisis). There is need to have a national skills
inventory –based on an efficient labor market information system.
Some of the challenges still facing YPs are inadequate facilities and capacities to cater for
large number of those who complete primary and secondary education and wish to undertake
TIVET.YPs programs are limited in scale due to challenges such as:-Lack of co-ordination of
training leading to disproportionate duplication in the production of skilled personnel across the
entire sector. This results in mismanagement of scarce resources, conflicts jurisdiction and
under-utilization of available training facilities. There is need to train more staff and upgrade
equipment and physical facilities to cope with the dynamic technological development. The
National skills Training Strategy and the revised legal framework will strengthen mechanisms
for the implementation of the necessary TIVET reforms. YP curriculum is said to be weak and
not market driven, research is absent not well documented.
The available data is either outdated, inadequate and though there are ongoing
researchers in different areas of the sector, more remains to be done. Low enrolment in YPs; -
though there has been achievement towards realizing universal primary education in the country.
Lack of clear legal frame work for sector, the absence of legal framework for regulating the
governance of TIVET has resulted in weak, fragmented and ineffective mechanism for
supervision and coordination of TIVET programs that are characterized with unnecessary
duplication and poor resource utilization. The tools are obsolete, not maintained, they have run
down buildings, negative image towards (YPs)-inferior, lack of investment in the capacities of
staff, no labor market oriented linkage between training institutions and industry etc.
UNDP,(2009) defined TIVET as Education which is meant to lead participants to acquire
practical skills, knowhow and understanding necessary for employment in a particular
occupation ,trade or group of occupations. Archoarcna, (2001) said that practical skills, or
knowhow can be provided in a wide range of settings by multiple providers both in the public
and private sector. The role of YPs in furnishing skills required to improve productivity, raise
income levels and improve access to employment opportunities, has been widely recognized.

281
Development in the three decades have made the role of TIVET more decisive; the
globalization process, technological change, productivity among workers in both modern sector
terms and micro and small enterprises. Skills imparted by TIVET leads to leadership, so that
individuals are equipped for productive activities and employment opportunities. Due to global
economic changes, necessitating implementation of structural adjustment programs in
developing countries, workers have been displaced, this poses great challenge, and they need
retraining for new occupations.
The impact of HIV/AIDS has necessitated emphasis on skills lost across a wide range of
occupations AIDS depletes scarce human resources. HIV/AIDS also reduces the capacity of
TIVET systems to deliver their functions, since it decreases the supply of highly trained
personnel and causes deterioration in the quality of the system. According to King (2007),
evidence from East Africa has shown that in the informal economy with higher levels of
education, graduates are more likely to start enterprises and hence the ability to utilize business
psychomotor skills. The government in Session Paper No I of 1965 identified relevant and
quality education as a means of eliminating poverty, disease and ignorance while session paper
No1 of 2005 indicates that TIVET education offered in YPs is not only a welfare indicator, but
also a key determinant of earnings and therefore an important exit route from poverty. According
to the Economic Strategy Program (ESP, 2003), the global economy recorded a growth of 5.2%
in 2007 compared to 5.4% growth registered in 2006. This growth rate can be witness in rural
areas when young people join YPs and acquire skills. Africans economic growth is estimated to
have increased marginally from 5.6% in 2006 to 5.7% in 2007. Although they effectively
enjoyed the opportunities presented by the economic environment, they continue to be
economically marginalized by being kept out of the mainstream development. In vision 2030, the
government focus is to eliminate poverty and empower Kenyans to enjoy quality and decent
livelihoods. Education in YPs is identified as one of the key component in the social pillar of the
government’s strategy of vision 2030 (GOK, 2007).
Vision 2030 appreciates the necessity of dealing with the informal economy that employs
75% of the countries’ workers. The informal economic sector must be supported in ways that
will raise productivity and distribution, increase number of jobs and income and improvement of
access and equity in education. While efforts to improve access and equity are laudable, these on
their own are not sufficient to address poverty alleviation without factoring in the relevance of
the education being offered to labor market. Therefore the policies fail to specifically
acknowledge the importance of TIVET.
According to International Labor Organizations (ILO, 1972), Jua kali sector is very
important. Therefore there is need to utilize polytechnics to train our young people get skills
which they will utilize when they go outside field. National Bureau of Statistics, (1972) observed
that youthful persons completing primary education are very many. Such persons should be
trained on technical and vocational skills acquired from YPs. According to (Unicef, 2009) on
National Youth Situation Analysis, it states that, we dream of a community whose education
imparts practical skills that will make us competitive in the job market and prepare us adequately
to meet the various challenges of life. The training can be equally realized in YPs. Across all age
groups education was ranked as the most important issue. The Economic Recovery Strategy
Programs (ERSP, 2003) have it that education is acknowledged as a means for transforming and
empowering communities. The youth especially gain skills, knowledge and attitudes to enable
them became productive members of the society.
282
Education contributes to sustainable development and is recognized in Kenya as a
priority area of development intervention as is reflected in policy documents. The development
of Education, National Reports of Kenya presidential circular No. 1/2008 asserts that Kenya has
embraced inclusive education that provides quality education to all children, youth and adults
through targeted support to specific or vulnerable groups moving away from the traditional view
of inclusive education of providing education for children with special needs (GOK, 2005).
Beyond inclusion, education is considered a fundamental right to every citizen and is provided
free of charge in primary and secondary levels. A curriculum has recently been developed to
cater for learners who attend non-formal schools where science laboratories and other science
education facilities are not in place. To support education in TIVET sector, the government is
providing incentives to promote private sector investments in the development of TIVET
facilities, has an increased bursary budget to enhance access to TIVET taking into account
marginalized groups such as female students and the physically handicapped.
YP Students’ Perception of Teaching Strategies and Methods of Training
Mukwa and Too (2002) gave the teaching strategies as heuristic (where learners learn through
discovery and expository in which the learners are exposed to the material of learning). A
method is a technique of doing something effectively and efficiently. Lawrence, (1975) argues
that a strategy is well thought out, systematic and discretional; teaching methodology means,
techniques and procedures which govern the instructional process. He continued to say that
teaching methodology is not abstract, but practical and real. It arises from deliberate choice and
practical experience of the teacher/instructor. It facilitates the acquisition of knowledge, skills
and values by the learners. It helps to build the bridges between the known experience and the
unknown. There are four factors which influence teaching methodology. These are the purpose
of what shall be taught, objective of the lesson, subject matter itself, the instructional materials to
be used and the learners themselves. About instruction, Lawrence (1975) says that the techniques
we adopt for teaching are directly influenced by the choice of instructional materials. The
interesting thing is that instructional materials are varied and often depend on what and why we
teach. Makokha and Ongwae (1997) said that the purpose or main objective of what we want to
teach dictates on the suitable teaching methodology. Amongst other things, one of the cardinal
aims of technical education as practiced in YPs in this country is the preparation of learners for
self-reliance through appropriate training and further education.
The ultimate projection is to see learners acquire skills which can enable them become
self-employed in order to earn their living without looking up to the government or the private
sector for white collar jobs. To a great extent, subject matter has a direct bearing on the choice of
teaching methodology. The simple logic here is to select methods which will ensure that teaching
proceeds from the simple matters to complex matters of content, but in a sequential fashion.
Learning by its nature is gradual and systematic. Makokha and Ongwae (1997) also said that a
methodology which ensures a breakdown of content into manageable steps makes it easier not
only for the teacher to teach but also for the learners to understand easily. He talks of a rule with
simplicity. That the choice of method should be determined by the extent to which it helps to
simplify the material to be taught. Different learners bring to a learning situation much diversity.
The vast difference in the learners otherwise called entry behavior is manifested in the form of
varied experiences, aptitudes, skills, feelings, responses. They said that experienced instructor’s
283
needs to do a delicate balancing act. Learning requires that both the teacher and learners have to
contribute.
But for each and every learner to do this brings to a learning situation unique knowledge,
skills and experience and that each and every learner can benefit from other’s knowledge, skills
and attitudes just as much as they learn from the teacher. The difference is that the methodology
employed should enable both the teacher and learner to share whatever they have in order to
promote meaningful learning. Hence this calls for methodology which allows for equal
participation of learners in the teaching learning. Bwika (1997) observed that the instructor must
apply the principles, methods and techniques of instruction and evaluation in the classroom. This
involves speaking clearly, repeating and emphasizing key points in such a way that they stand
chance of being understood and remembered. Encouraging trainee participation through good
questioning and conducting demonstration competently. Any facility for training should equip
the learners with the necessary knowledge base and professional skills to enable them perform
the tasks effectively. Existing literature on training suggests that training is a necessary
precondition for effective performance of the roles and responsibilities (Smith, 2003) and that
performance improves significantly once they are trained (Maranga,1993). Research indicates
that training has significantly positive impacts on the learner with reliable methodology and
sufficient knowledge to the content. Smith, (2003) said that from professional perspective, highly
qualified learners who have received training enables them not only to know the subject matter,
but also to learn to make decisions informed by feedback from the school. She further points out
that there is a positive connection between subject matter preparation of the instructor and the
learner performance.
Bosire (1996) studied the effects of training on interaction analysis in teaching patterns of
the learners and established that all other things being equal, trainees trained in particular skills
perform better than those who have not received any training. Hence the need to have in place
training programs that are tailored to meet job requirements and subsequent need to evaluate the
current enrolment status in YPs. It has been noted that enrolment in YPs has fallen short and will
continue to decline unless there is better coordination of professional development. Bosire
(1996) emphasizes the need for training and points out that a program for training should include
content theory, which must be linked to real situations by practice. The training programs aims at
enabling learner to manipulate materials and apply the theory to reflect on the practice (Cross,
1995). Namach (1990) studied the factors that affect the implementation of 8-4-4 system of
education and cited perception as one of the possible factors. He said that when 8-4-4 was
started, it was supposed to instill vocational skills on the learners but that has never been. The
above, he attributed to perception among the community, learners and the job market. Further, he
said learners who when to form six have high regard as opposed to those who go through 8-4-4
system of education. The above concurs with low enrolment rates in YPs which might be as a
result of lack of interest among the learners. He noted lack of motivation by those to be trained
as a result of perception as a factor affecting enrolment.
YP Students’ Challenge Experienced
According to Gachira, (2009) the current YPs curriculum is weak and not flexible enough to
meet the technological changes and diverse needs of different clients. Furthermore the quantity
of TIVET graduates has declined in recent years due to poor instructional methods, outmoded
equipment and lack of meaningful work experience and supervision during attachment. The

284
graduates of TIVET have experienced technological shock when they finally enter the job
market.
Enrolment in the traditional engineering and building course is dwindling very fast,
whole enrolment in applied sciences and business/commerce oriented courses are growing
steadily. Trainers lack necessary industry based technological skills updated. Perception has a
negative impact on an institution (Nyerere, 2009).This was demonstrated by enrolment registered
over the years as per the table given below.
Table 1: Enrolment in Youth Polytechnics over the years 2003-2007
YEAR MALE FEMALE TOTAL
2003 7171 13,255 20426
2004 8605 13,918 22,523
2005 8691 14,196 22,887
2006 8741 14,210 22951
2007 9528 15,489 25017
Source Nyerere, (2009) on YPs in Kenya
The above show that less 30,000 students enroll for the program although very many fail to
proceed to secondary school. Kenya Technical Training College, KTTC has shifted from its
original mandate as producer of trainers and is now competing to offer program similar to
national polytechnics. This to a great extent compromises quality education especially when
resources are lacking. It has been observed that teachers in the technical institutions rarely go for
refresher courses which put them at the mercy of their students who are more exposed (Nyerere,
2009).
Nyerere (2009) also noted that dramatic budget cuts followed by structural adjustment
programs adversely affected enrolment for TIVET courses in YPS. For instance, in sub-Sahara
Africa, as a result of budget cuts, it curtailed investments in TIVET systems making facilities
and equipments to decay. Recurrent budget reduction has also negatively affected the number,
qualifications, pay, morale and motivation of teachers and administration. Most of the TIVET
institutions were grossly underfunded resulting to poor service delivery and poor image.
Majority of the trainees enrolled in TIVET institutions are self-sponsored with very few
receiving any or other charitable sponsorship.
Gachira (2009) said that TIVET skills are lacking in Kenya’s education systems.
Teaching TIVET skills may enhance quality of work among learners and this will prepare them
for industry and self-reliance at an early stage of schooling. The historical injustice TIVET has
experienced in the education sector has had far reaching consequences. In Kenya TIVET has
always been associated with that colonial education system, trained Africans who were
considered weak in class in skills so that they could provide cheap labor, there has been no
improvement after independence. Today, the notion of TIVET being preserve for the less bright
learners still holds and with the new development of the polytechnics being under -utilized, it is
feared that the government policy may be confirming this perception.
Gachira (2009) said that most of the private training YPs institutions are faced with
almost same problems as those encountered by the public institutions. The quality of TIVET in
the entrepreneurial education private training institutions is affected further by:-over
concentration on light vocational skills, business, commercial and service courses because of the

285
high investment associated with technology based courses. Employment of part-time instructors,
paid less, burdened with large classes with less facilities and proliferation of unregistered
institutions likely to offer low quality.
From literature reviewed it emerged that no study on YPs student perception of
vocational training has been carried out yet YPs has persistently continued to record low
enrollment. Various studies have been carried on YPs but no study addressing the above field has
done. Achieng (2012) study on factors affecting acquisition of vocational skills among YPs
learners in Maranda District and Ondigis (2007) study on YPs students’ attitudes towards
vocational training in Gusii, Nyanza have correlation with above study. However, the two did
not address the reasons for dwindling enrolment in YPs. None of the studies investigated YPs
student perception of vocational training leaving a gap both in theory and practice which the
researcher set out to fill.
METHODOLOGY
Research Design
The study adapted descriptive survey design to investigate perception of YPs students towards
vocational training in YPs in Nandi County, Kenya. The design was appropriate because it
enabled the researcher to collect relevant information from respondents within a short time.
Descriptive design was applied because it is used in preliminary and exploration studies to allow
researchers to get information, summarize, present and interpret it for the purpose of clarification
(Orodho, 2002). Borg and Gall (1989) note that “descriptive survey research is intended to
produce statistical information about aspects of education that interest policy makers and
educators”. The design was also deemed appropriate because it enabled researcher to describe
the state of affairs as it exists. Further, descriptive survey is not restricted to fact findings but
may often result in formulation of important principles of knowledge. Lastly, the design
facilitated the use of questionnaires, interview schedules and documentary analysis to investigate
perceptions.
Both quantitative and qualitative data was collected. Quantitative and qualitative data is
that which can be expressed in figures and words respectively. In the study, quantitative data was
obtained from questionnaires, observation rating scales and documentary analysis schedule.
Qualitative data included the ones that were obtained from interview schedules, past research,
books, internet, journals, newspaper articles and magazines. Besides that, the researcher used
rating scales on interview, questionnaires and observation to collect quantitative data.
Target Population
The target population were the respondents which the researcher used to collect the data.The
study targeted a total population of 1586 as follows students-1521, instructors-32, HOD’s-27 and
Principal Managers-6 in YPs in Nandi County, Kenya. Nandi County comprises of five sub
counties with twelve registered YPs as follows; Nandi South: Serem, Kipsebwo, Kemeloi and
Mugen, Nandi North: Tangaratwet, Kurgung, Cheptarit and Kabiyet, Nandi East: Sigilai, Nandi
Central: Kaplamai and Kaptel and Tinderet : Meteitei

286
Sampling Techniques and Sample Size
Sampling Techniques and Sample Size are the ways that were used to get a representative
sample and the number of respondents to participate in the study respectively. This was in the
light of the fact that YPs and the study population have diversities in terms of resource
endowment, courses done, instructor professional qualification, terms of service, types of
learners and location.
Sampling Size
A total of 494 respondents participated in the study. Out of these, 457 students were sampled
from a total population of 1521 as per the Ministry of Youth statistics (Nandi County) as at the
time of study representing 30%. For instructors and HODs, 50% translated to 17 from a total of
32 and 14 from 27 HODs respectively; this was because the total populations in these cases were
small. There were 12 registered YPs in the county. However, 6 participated representing 50%.
Sampling Techniques
Purposive and cluster sampling techniques were used to sample the institutions, principal
managers, HODs, instructors, and students. Thirty percent of the YPs in the above case meant 4
but 6 were picked representing 50% because the total number of registered YPs was few.
Samples were selected based on resource endowment such that those with best, average and low
were proposionately included. This was because some YPs were well established while others
were not and this brought variations. County YPs Officer in Nandi County was consulted to rate
YPs. A rating scale was developed so as to facilitate classification. The instrument developed
was based on availability of resources and infrastructural facilities. Visiting of all the YPs was
done prior to carrying out purposive sampling. The results obtained were harmonized and a list
was drawn. All HODs were picked in the six selected YPs. About the instructors, a sample of
50% was selected purposively from the 32 instructors which translated to 17. There were 1521
students in YPs in Nandi County as at 2014, the time of study; however 30% of this meant 457.
A cluster of 10 was later developed which translated to 45 groups with homogenous
characteristics based on courses done. Information from instructors and trainees was collected
largely from those willing and could spare their time for the same.
Table 2: Number of YPs and Sample Size
Sub-Counties Number of YPs Sample Size
Nandi-North 2 1
Nandi-South 3 1
Nandi-East 2 1
Nandi-Central 4 2
Tinderet 1 1
Totals 12 6

287
Table 3: Students and Sample Size
Sub-Counties Number of YPs Sample Size 50%
Nandi-North 2 203
Nandi-South 3 405
Nandi-East 2 200
Nandi-Central 4 610
Tinderet 1 103
Totals 12 1521
Table 4: Instructors and Sample Size
Sub-Counties Number of YPs Instructors Sample Size 50%
Nandi-North 2 6 3
Nandi-South 3 8 4
Nandi-East 2 4 2
Nandi-Central 4 12 6
Tinderet 1 4 1
Totals 12 34 17
Table 5: Principals’ and Sample Size
Sub-Counties Number of YPs Principals Sample Size 50%
Nandi-North 2 2 1
Nandi-South 3 3 1
Nandi-East 2 2 1
Nandi-Central 4 4 2
Tinderet 1 1 1
Totals 12 12 6
Table 6: HODs and Sample Size
Sub-Counties Number of YPs Hods Sample Size 50%
Nandi-North 2 6 3
Nandi-South 3 5 3
Nandi-East 2 2 1
Nandi-Central 4 11 5
Tinderet 1 3 2
Totals 12 27 14
Data Collection Instruments
Data was collected using questionnaires, interview schedule, and observation and document
analysis schedule. Primary data was obtained using questionnaires while secondary data was
collected from library, reading past research, checking at the internet, journals and books.
Students’ Questionnaire
Open and closed ended questionnaires were used in the study. These were used to collect
information on students’ perceptions towards vocational training, skills learned, curriculum,
teaching methodologies and challenges encountered. The respondents filled the forms assisted by

288
the researcher and research assistant. It was expected that some of the trainees were not in a
position to answer the questionnaires alone. As such they were assisted by research assistants
and the researcher. After filling the questionnaires, those which had errors were corrected before
collection. The questionnaires were distributed to all sampled institutions under research and
collected within two weeks duration.
The questions were simplified to enable respondents understand and respond to them
because their level of education was low. Questionnaires for 457 students sampled from a total of
about 1571 were prepared based on the objectives of the study. The researcher clarified some of
the questions to the students who encountered difficulties. Further, interviewees were subjected
to some of the students sampled from the sampled population of 457(10%) students. Students
were given about one hour to respond to questions, thereafter they were collected which was too
soon to have gotten lost.
Instructors’ Questionnaire
There were about 32 instructors in the YPs. However 17 were sampled for the study. They were
given questionnaires and were also subjected to interview. Instructors’ level of education ranged
from Certificate to Degree. Research assistant ant clarified some of the questions to them in case
of those who encountered difficulty. Questionnaires for instructors were administered the same
day those of students were given out; hence all the work was done within a period of two weeks.
The questionnaires were carrying questions on students’ perceptions towards training,
instructors’ competence, skills learned, teaching methodologies and challenges encountered in
YPs.
Interview Schedule
A list of questions guided the collection of data in the above exercise. The questions were written
based on the objectives of the study. Questionnaires were filled by the researcher using the
questions given to the respondents: instructors, trainees, HODS, and principal managers. This
was because most of the trainees could have found writing work so challenging. The questions
were elaborated before the respondents were allowed to respond.
Principals’ Interview Guide
YPs are managed by principal managers. Therefore the principal managers were targeted
because of the information they had on all objectives of the study. As such they were interviewed
and asked to respond to questionnaires also. Both questionnaires and interview schedule had
open ended and closed ended questions
HOD’s Interview Guide
YPs have also heads of departments. The departments are on Carpentry, Masonry, Tailoring,
Electricity, and Auto Motive Engineering, Metal Work, Plumbing and wood work. They were all
given questionnaires and asked to respond to interview questions. The information gained out of
experience in the field of study was believed to be paramount to the study. The information
collected from them was as per the objectives of the study and literature review.

289
Observations Schedule
The researcher prepared observation schedules to meet some of the objectives. The schedules
were guided by research objectives. Besides that, student population, infrastructural facilities and
equipment; availability of instructors, learner needs were also observed such as housing and
teaching materials. Observation rating scales were prepared and filled when the exercise was
going on. The above works were done only by the researcher.
Document Analysis
This includes checking registers to verify enrolment over the years, for various courses offered,
skills learned and type of training activities, registration for various national exams over the
years. Overall instructor’s lesson plan, schemes of work and lesson notes were checked. The
above work was done by the researcher.
Piloting
The researcher carried out testing of the research instruments in the YPs in Kericho County. This
was because Kericho County is far from Nandi County and could not make the respondents alter
their response because of knowing what was being investigated. Purposive and cluster sampling
technique was used to pick one YP from a total of 17 registered YPs for pilot study. Records
from Kericho County YPs Director’s Office were used. Polytechnics were put into clusters based
on their resource endowment. A YP that acted as representative for all was taken for piloting
study. The YP had 87 students, 6 HODs and 8 instructors. Thirty percent the students and 50% of
instructors and HODs were sampled. Principal Manager was purposesively picked while the
students were put into homogenous clusters based on courses done. Each group was then
subjected to questionnaires, interview and documentary analysis. For HODs and instructors, they
were purposively picked based on willingness and convenience of the respondents to participate.
A coefficient of 80% was calculated based on respondent’s ability to understand and respond to
the research instruments administered and was taken as reliable. The reason for testing the
instruments (piloting) was to ensure that they were valid and reliable prior to being administered
in the field.
Validity
Validity is the extent to which an instrument measures what it is supposed to measure. It is also a
test of how well an instrument measures what it is supposed to measure. Supervisors at Kenyatta
University in the department of Educational Communication and Technology and other
departments were asked to make suggestions on content of the instruments. Further, the content
validity was ensured by consulting supervisors. A panel of three supervisors competent in the
area being investigated was requested to assess the relevance of the content used.
Reliability
Reliability is a measure of the degree to which a research instrument gives consistent results after
repeated trials. The reliability of the instruments was ascertained by carrying out test, retest of

290
questionnaires, interview schedule, observation and documentary analysis through a pilot. The
respondents were asked to comment on relevance and clarity of the questions. Respondent’s
suggestions were used to improve on, clear vagueness’s and ambiguities in some parts of
questionnaires. Thus test-retest was carried out with a reliability coefficient of 80% taken. This
was calculated by rating consistency of the instruments to trigger a similar understanding of what
was being asked. A coefficient of 80% implied that instruments could be used with minimum
errors. All data were analyzed at level of significance of 95% ∂ =0.05
Data Collection Procedure
Permission of all those YPs that participated was requested through a formal letter. The identities
of principal managers, instructors and HODs were kept confidential. All the instruments were
administered during a period of two weeks. The data collection instruments were designed such
that the objectives guided its content. The participants in the exercise were given well-
constructed research instruments that elicited required responses. The students’ questionnaire
instruments were administered to sampled students within a period of two weeks for all the YPs.
The above exercise largely depended on the willingness of the respondents to participate. All the
student participants who encountered difficulties in responding to questions were guided.
It was expected that some students could find the exercise laborious and as such they
were assisted by being shown how to fill questionnaires. Instructors filled their questionnaires
within a period one day for each YP that was visited. The questionnaires were later checked for
errors before being taken. The Researcher expected instructors not to encounter major difficulties
answering questions because the questions were self-explanatory. About interview a list of
questions was administered to HODs, some students and Principal Managers. The questions were
written based on the objectives of the study. Responses were captured through oral interview in
which the researcher took notes of all the key points given by respondents within a period of two
weeks for the sampled YPs. Prior permission was sought from Principal Managers through a
formal means of communication for all YPs sampled. Thereafter, interview was administered
based on the availability of time and their willingness. The exercise was carried and concluded
within a period of two weeks. The questions were simplified so that the principal managers could
understand them so easily.
The HODs interviewed were heading Carpentry, Masonry, Tailoring, Electricity, Metal
work, Wood work and Plumbing. They were all subjected to interview. The questions were
structured such that they elicited the required responses. Interview took a period of two weeks.
The researcher alone did the interviewing and note taking. Those who participated were
interviewed on their most convenient time within formal working hours. Observation schedules
were rating scales prepared to be used while collecting data under the guidance of research
objectives. The researcher did observation during the period of distributing questionnaires to
students and instructors. The exercise was carried out prior to interview for HODs and Principal
Managers. This enabled him to get a picture of YPs and areas which needed more clarifications
were identified. A rating scale was prepared guided by research objectives and literature review.
The rating scales were filled during the observation. Under document analysis instructor
professional documents were checked. The principal managers were requested to give registers
which were used to verify enrolment over the years, for various courses offered, skills learnt and
type of training activities. Lesson plans, schemes of work and lesson notes were also examine.
The above work was done within a period of two weeks.

291
Data Analysis
An analysis of data was done using Statistical Packages for Social Sciences (SPSS). Data from
questionnaires and interview schedules was analyzed based on objectives of study through
coding, tabulation and then drawing statistical inferences. The researcher grouped data from both
closed and open ended questionnaire and interview schedules under broad themes and converted
them into frequency counts. Quantitative data was condensed into few manageable groups and
tables for analysis. Both descriptive and inferential statistics was used. Data obtained from
documentary analysis and observation was also analyzed through tabulation and drawing
statistical inferences. Qualitative data was also condensed and converted into frequency counts.
Under descriptive analysis measures of central tendencies such as mean, mode and median were
calculated. For observation and document analysis, they were tabulated for easy analysis.
RESULTS AND DISCUSSION
Demographic Information
Table 7: Summary of the Youth Polytechnics (YPs) sampled
Name of Youth Polytechnic District Total Percentages Representing all
YPs sampled (N=6)
Cheptarit Nandi North
Serem Nandi South 6(50%)
Kapchemoiwo Nandi Central
Kaplamai Nandi Central
Sigilai Nandi East
Meteitei Tinderet
Table 7 above shows that 6 YPs were sampled for the study representing half of the total YPs in
the County. The YPs picked were Kaplamai and Kapchemoiwo representing Nandi Central;
Cheptarit, Nandi North, Sigilai, Nandi East; Meteitei, Tinderet and Serem, Nandi South.
Table 8: Background information on the instructors’ bio data
Almost half 17(32) instructors were picked from YPs representing (53%) being male 10(17) 58%
and female 7(17) 42% respectively as shown on table 8. As a general observation it was noted
that there were many male instructors compared with the female. However most of them were
specialized on areas such as tailoring, fashion design and food technology.
Gender Total% % (n=17)
M 10(17) 58(100)
F 7(17) 42(100)
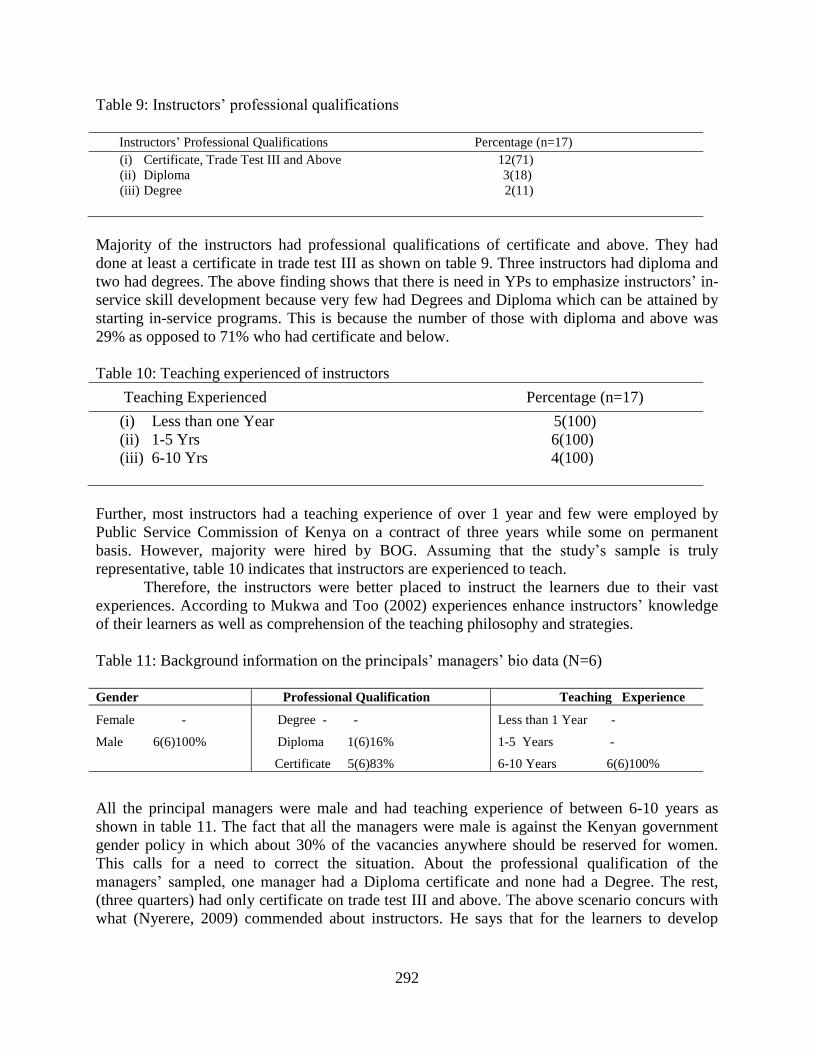
292
Table 9: Instructors’ professional qualifications
Instructors’ Professional Qualifications Percentage (n=17)
(i) Certificate, Trade Test III and Above 12(71)
(ii) Diploma 3(18)
(iii) Degree 2(11)
Majority of the instructors had professional qualifications of certificate and above. They had
done at least a certificate in trade test III as shown on table 9. Three instructors had diploma and
two had degrees. The above finding shows that there is need in YPs to emphasize instructors’ in-
service skill development because very few had Degrees and Diploma which can be attained by
starting in-service programs. This is because the number of those with diploma and above was
29% as opposed to 71% who had certificate and below.
Table 10: Teaching experienced of instructors
Teaching Experienced Percentage (n=17)
(i) Less than one Year 5(100)
(ii) 1-5 Yrs 6(100)
(iii) 6-10 Yrs 4(100)
Further, most instructors had a teaching experience of over 1 year and few were employed by
Public Service Commission of Kenya on a contract of three years while some on permanent
basis. However, majority were hired by BOG. Assuming that the study’s sample is truly
representative, table 10 indicates that instructors are experienced to teach.
Therefore, the instructors were better placed to instruct the learners due to their vast
experiences. According to Mukwa and Too (2002) experiences enhance instructors’ knowledge
of their learners as well as comprehension of the teaching philosophy and strategies.
Table 11: Background information on the principals’ managers’ bio data (N=6)
Gender Professional Qualification Teaching Experience
Female -
Male 6(6)100%
Degree - -
Diploma 1(6)16%
Certificate 5(6)83%
Less than 1 Year -
1-5 Years -
6-10 Years 6(6)100%
All the principal managers were male and had teaching experience of between 6-10 years as
shown in table 11. The fact that all the managers were male is against the Kenyan government
gender policy in which about 30% of the vacancies anywhere should be reserved for women.
This calls for a need to correct the situation. About the professional qualification of the
managers’ sampled, one manager had a Diploma certificate and none had a Degree. The rest,
(three quarters) had only certificate on trade test III and above. The above scenario concurs with
what (Nyerere, 2009) commended about instructors. He says that for the learners to develop

293
confidence about the YPs the instructors should be well trained. Ayot and Patel (1992) also
emphasized on experience as a yardstick that can be used to gauge teaching and learning.
Table 12: Frequencies and percentages of the nature of schooling
Variable F% (n=6) Total
Boarding 3(6) 50(100)
Day /Boarding 3(6) 50(100)
Six being 50% of YPs had boarding facilities while the remaining half had both boarding and
day. This is in line with the government’s directive of trying to make most institutions to be both
boarding and day so as to accommodate learners from weak families. Further, it should be noted
that all of them were mixed. The governments’ policy of trying to separate boys and girls
institutions seems not possible in YPs because of the nature of courses done that favours mostly
male learners. (see table 12)
Table 13: Student participants (n=457)
Student Male % Female % Total
310(457) 68 147(457) 32 457(1521)
Cluster of 10 based on courses done - 45
Four hundred and fifty seven (30%) of the students participated in the study. These students were
later put into homogenous groups based on the courses done. In total there were 1521(100%)
students as shown on Table 13 above. When the participants were put on clusters there were 45
groups.
Table 14: A table showing resource endowment in YPs that participated in terms of ranking
Name of youth Polytechnic (YPs)
n=6 Ranking in terms of resources
Percentages on resource
endowment
Sigilai Moderate 60%
Cheptarit Lack resources/ instructors 50%
Meteitei Lack resources/ instructors 50%
Kapchemoiwo Lack resources/ instructors 48%
Kaplamai Lack resources/ instructors 45%
Serem Lack resources/ instructors 43%
The YPs that participated in Nandi County were picked based on ranking in terms of resource
endowment as shown in table 14 above. The ranking was done based on availability of basic
facilities within the given school. Table 14 shows resource endowment in the six YPs that
participated. Their resources were rated based on availability of instructional equipments,
classrooms and any other teaching material. Sigilai YP scored 60% and was ranked as the most
endowed with resources followed by Cheptarit (50%) which was characterized by lack of
resources and instructors. Meteitei (50%), Kapchemoiwo (48%), Kaplamai (45%) and Serem
(43%) both had problems in resource allocation. The two last polytechnics Serem and Kaplamai
had very few instructors employed by the government. The above scenario is in agreement with

294
what is in former (MOYA, 2007) Vijana Magazine issue No. 1 which had it those resources in
YPs are old and obsolete.
Findings for Objective One: YP Students’ Perception of Training
The first objective sought to find out YPs student’s perception of vocational training in Nandi
County, Kenya. To achieve this objective, respondents (students, instructors and principal
managers) were asked to answer some given statements as well as rankings their opinions.
Further, principal managers were subjected to interview to ascertain student’s enrolment. The
respondents were asked to state whether most potential trainees like to enroll for courses in YPs.
Their responses are shown on table 15 below.
Table 15: Instructor’s responses’ on students’ perception (n=17)
Variable Agree(Frequency)
F F/n %
Disagree(Frequency)
F
F/n % Total
Most potential trainees like to enrol
for courses in YPs 8 8(17) 47 9
9(17)
53
17
Many potential trainees have no
interest in joining YPs 11 11(17) 65 6
6(17)
35 17
Image about YPs is the main cause
as to why potential trainees fail to
enroll for courses in YPs
12 12(17) 71 5
5(17)
29 17
About 53% of the instructors indicated that trainees did not like to train in YPs while 47% said
they do. Instructors were also asked to state, if many potential trainees had interest in joining
YPs and about two third said they did not have while the remaining a third said they had. On the
issue of perception, more than a third of the instructors agreed that it was the main cause of
trainees failing to enroll for courses.
Table 16: Trainees’ responses on perception of training activities
Variable Response n=45
Good(F) Percentage(%) Poor(F) Percentage(%) Total
Most potential trainees
like to enroll for
courses in YPs
125(452) 27% 327(452) 72% 452(100%)
From the table 16 above, 27% of trainees said that they liked training activities while about 72%
said they disliked. The responses from the instructors concurs with what (Nyerere, 2009)
commented. He said that potential trainees and the society do not like YPs.

295
Table 17: Students’/ Instructors' responses on perception of training in YPs
Nature Of Courses Offered Good Poor Total
Student Instructors Student Instructors Student Instructors
205(45%) 6(54%) 247(54%) 11(64%) 452(100%) 17(100%) Courses offered
Learning resources 325(72%) 11(64%) 127(28%) 6(54%) 452(100%) 17(100%)
Staff and administration 50(11%) 7(42%) 402(88%) 10(58%) 452(100%) 17(100%)
Instructors’ competencies 192(42%) 8(47%) 260(58%) 9(53%) 452(100%) 17(100%)
Teaching Methodologies 62(14%) 9(53%) 390(86%) 7(41%) 452(100%) 17(100%)
Teaching Methodology
Training 60(13%) 10(59%) 392(87%) 2 452(100%) 17(100%)
Entry grades into the courses 102(23%) 5(29) 350(77%) 12(71%) 452(100%) 17(100%)
Final grades 286(63%) 15(88%) 166(37%) 1(05%) 452(100%) 17(100%)
Ability of the student 150(33%) 4(23%) 302(67%) 13(76%) 452(100%) 17(100%)
Student Related 100(22%) 2(11%) 352(79%) 15(88%) 452(100%) 17(100%)
Attitudes
Age influence 215(47%) 5(29%) 237(52%) 12(71%) 452(100%) 17(100%)
Sex influence 237(53%) 6 (35%) 215(48%) 11(65%) 452(100%) 17(100%)
Career Related
Learner mobility opening in
furthering studies
240(53%) 7(41%) 212(47%) 10(59%) 452(100%) 17(100%)
History of graduates on career
progress after graduation
312(69%) 15(88%) 140(31%) 2(12%) 452(100%) 17(100%)
Skills acquired in making
learners to be self reliant
271(59%) 14(82%) 181(41%) 3(18%) 452(100%) 17(100%)
Table 17 above shows the summary of the perception of learners and instructors towards various
variables. An analysis in table 17 revealed that learners had negative attitude towards YPs. This
was demonstrated by perception in which 79% of the students said it was not good while 88% of
the instructors also said they were not good. An analysis of the enrolment over the last four years
was done also on the six sampled YPs and the findings were as follows:

296
Table 18: Enrolment over the last four years in the four sampled YPs
YPs Year Male Female Total YPs capacity Percentage
1.
Sigilai
2013 179 34 213 300 70
2012 71 23 94 300 31
2011 70 25 95 300 31
2010 39 15 54 300 18
Average 89 24 114 300 38
2. Cheptarit 2013 93 19 112 250 44
2012 92 22 114 250 45
2011 91 20 111 240 44
2010 77 22 99 240 41
Average 88 21 81 245 43
3. Meteitei 2013 100 40 141 300 47
2012 98 33 131 300 32
2011 102 27 129 300 30
2010 108 36 144 300 48
Average 102 34 136 300 39
4. Kapchemoiwo 2013 111 45 156 300 52
2012 137 41 178 300 59
2011 142 38 180 300 43
2010 131 36 167 300 55
Average 130 40 170 300 45
5 Kaplamai 2013 88 26 114 300 38
2012 91 34 125 300 42
2011 100 15 115 300 38
2010 97 20 117 300 39
Average 94 24 117 300 39
6 Serem 2013 5 6 11 300 40
2012 14 3 17 300 40
2011 23 4 27 300 40
2010 3 13 16 300 40
Average 11 6 18 300 40
Source, Nandi County Records on YPs 2013
Table 18 shows enrolment and capacity of students which YPs can accommodate. Sigilai had the
highest enrolment as at 2013 of about 70% of the carrying capacity. It was followed by
Kapchemoiwo 52(100), Meteitei 47(100) Cheptarit which 44(100). The others were Serem
38(100) and Kaplamai 40(100) respectively. The above information concurs with what (Nyerere,
2009) observed, when he said that enrolment in YPs is below capacity.
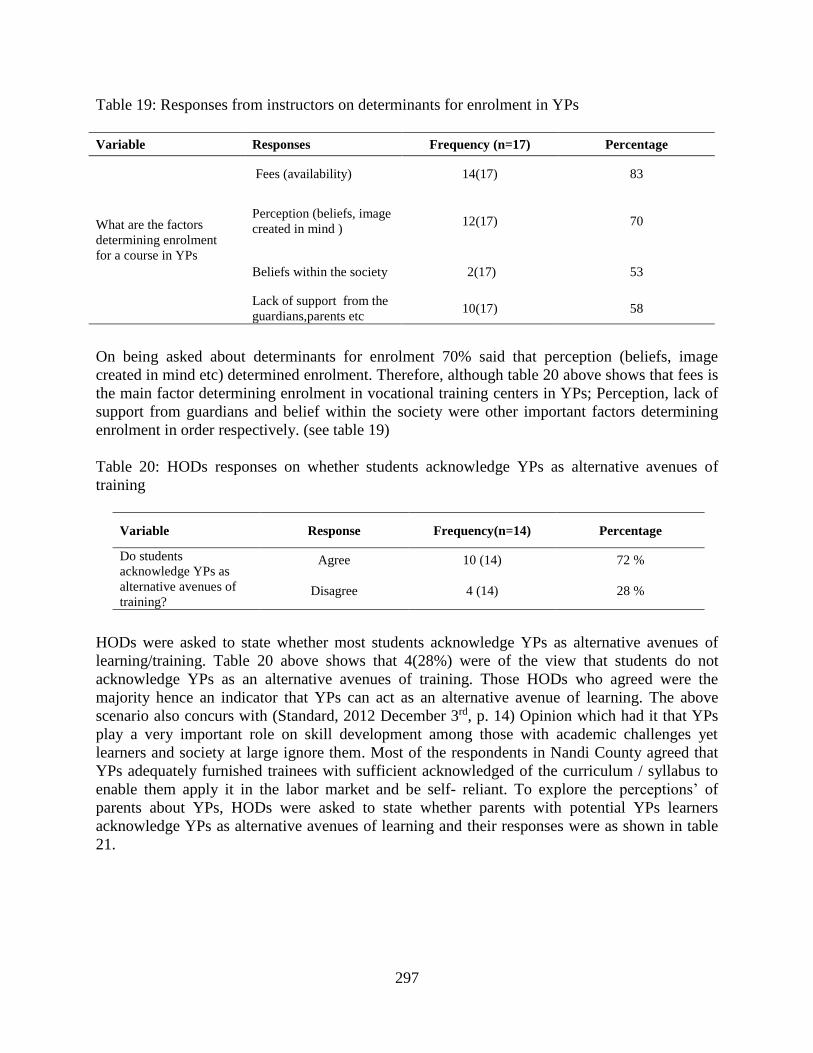
297
Table 19: Responses from instructors on determinants for enrolment in YPs
Variable Responses Frequency (n=17) Percentage
What are the factors
determining enrolment
for a course in YPs
Fees (availability) 14(17) 83
Perception (beliefs, image
created in mind ) 12(17) 70
Beliefs within the society 2(17) 53
Lack of support from the
guardians,parents etc 10(17) 58
On being asked about determinants for enrolment 70% said that perception (beliefs, image
created in mind etc) determined enrolment. Therefore, although table 20 above shows that fees is
the main factor determining enrolment in vocational training centers in YPs; Perception, lack of
support from guardians and belief within the society were other important factors determining
enrolment in order respectively. (see table 19)
Table 20: HODs responses on whether students acknowledge YPs as alternative avenues of
training
Variable Response Frequency(n=14) Percentage
Do students
acknowledge YPs as
alternative avenues of
training?
Agree 10 (14) 72 %
Disagree 4 (14) 28 %
HODs were asked to state whether most students acknowledge YPs as alternative avenues of
learning/training. Table 20 above shows that 4(28%) were of the view that students do not
acknowledge YPs as an alternative avenues of training. Those HODs who agreed were the
majority hence an indicator that YPs can act as an alternative avenue of learning. The above
scenario also concurs with (Standard, 2012 December 3rd, p. 14) Opinion which had it that YPs
play a very important role on skill development among those with academic challenges yet
learners and society at large ignore them. Most of the respondents in Nandi County agreed that
YPs adequately furnished trainees with sufficient acknowledged of the curriculum / syllabus to
enable them apply it in the labor market and be self- reliant. To explore the perceptions’ of
parents about YPs, HODs were asked to state whether parents with potential YPs learners
acknowledge YPs as alternative avenues of learning and their responses were as shown in table
21.
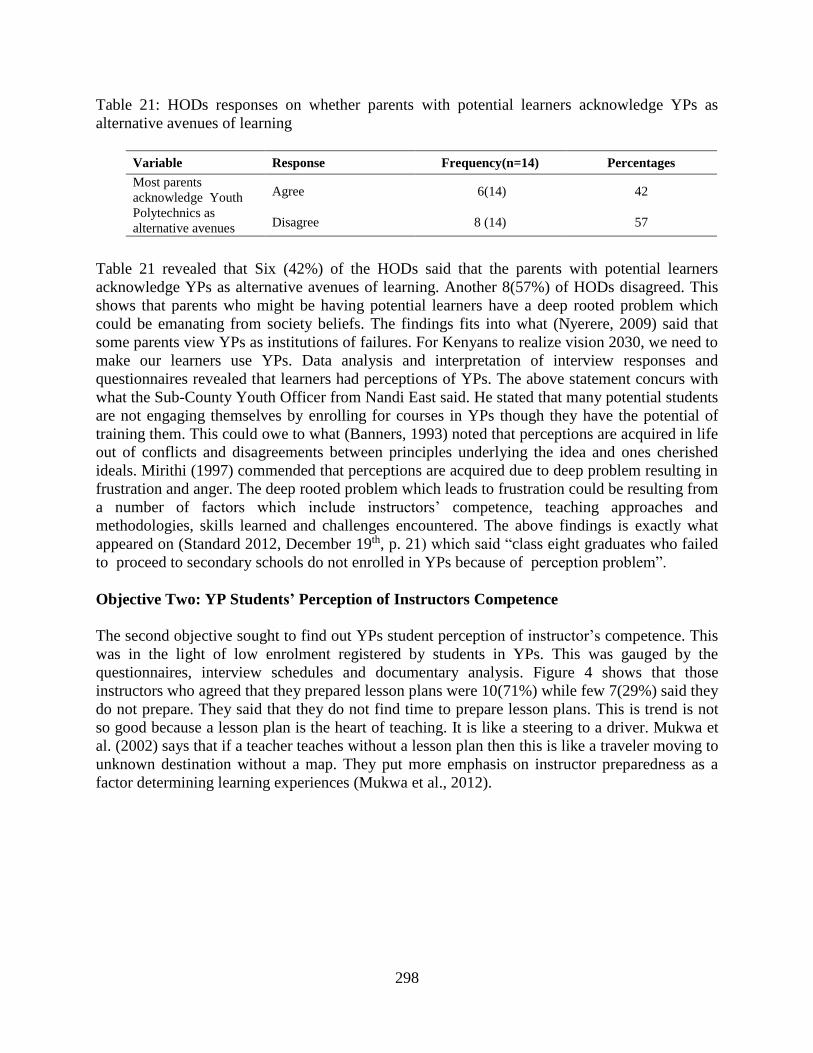
298
Table 21: HODs responses on whether parents with potential learners acknowledge YPs as
alternative avenues of learning
Variable Response Frequency(n=14) Percentages
Most parents
acknowledge Youth
Polytechnics as
alternative avenues
Agree 6(14) 42
Disagree 8 (14) 57
Table 21 revealed that Six (42%) of the HODs said that the parents with potential learners
acknowledge YPs as alternative avenues of learning. Another 8(57%) of HODs disagreed. This
shows that parents who might be having potential learners have a deep rooted problem which
could be emanating from society beliefs. The findings fits into what (Nyerere, 2009) said that
some parents view YPs as institutions of failures. For Kenyans to realize vision 2030, we need to
make our learners use YPs. Data analysis and interpretation of interview responses and
questionnaires revealed that learners had perceptions of YPs. The above statement concurs with
what the Sub-County Youth Officer from Nandi East said. He stated that many potential students
are not engaging themselves by enrolling for courses in YPs though they have the potential of
training them. This could owe to what (Banners, 1993) noted that perceptions are acquired in life
out of conflicts and disagreements between principles underlying the idea and ones cherished
ideals. Mirithi (1997) commended that perceptions are acquired due to deep problem resulting in
frustration and anger. The deep rooted problem which leads to frustration could be resulting from
a number of factors which include instructors’ competence, teaching approaches and
methodologies, skills learned and challenges encountered. The above findings is exactly what
appeared on (Standard 2012, December 19th, p. 21) which said “class eight graduates who failed
to proceed to secondary schools do not enrolled in YPs because of perception problem”.
Objective Two: YP Students’ Perception of Instructors Competence
The second objective sought to find out YPs student perception of instructor’s competence. This
was in the light of low enrolment registered by students in YPs. This was gauged by the
questionnaires, interview schedules and documentary analysis. Figure 4 shows that those
instructors who agreed that they prepared lesson plans were 10(71%) while few 7(29%) said they
do not prepare. They said that they do not find time to prepare lesson plans. This is trend is not
so good because a lesson plan is the heart of teaching. It is like a steering to a driver. Mukwa et
al. (2002) says that if a teacher teaches without a lesson plan then this is like a traveler moving to
unknown destination without a map. They put more emphasis on instructor preparedness as a
factor determining learning experiences (Mukwa et al., 2012).
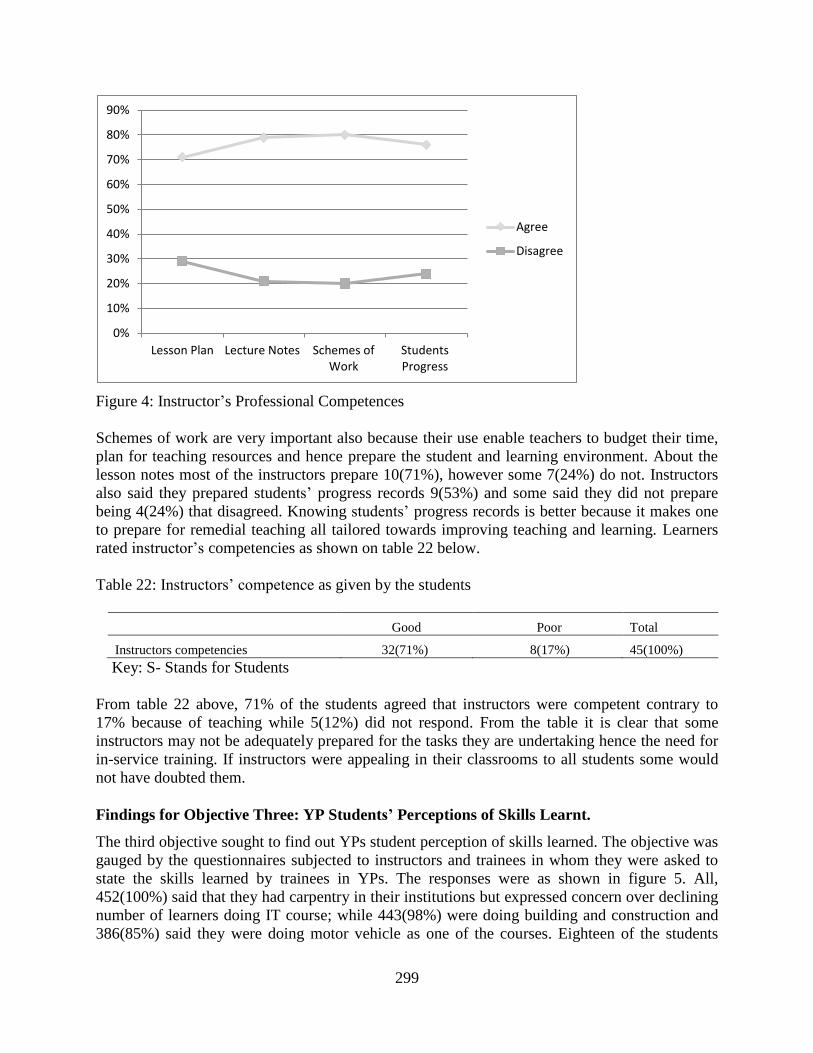
299
Figure 4: Instructor’s Professional Competences
Schemes of work are very important also because their use enable teachers to budget their time,
plan for teaching resources and hence prepare the student and learning environment. About the
lesson notes most of the instructors prepare 10(71%), however some 7(24%) do not. Instructors
also said they prepared students’ progress records 9(53%) and some said they did not prepare
being 4(24%) that disagreed. Knowing students’ progress records is better because it makes one
to prepare for remedial teaching all tailored towards improving teaching and learning. Learners
rated instructor’s competencies as shown on table 22 below.
Table 22: Instructors’ competence as given by the students
Good Poor Total
Instructors competencies 32(71%) 8(17%) 45(100%)
Key: S- Stands for Students
From table 22 above, 71% of the students agreed that instructors were competent contrary to
17% because of teaching while 5(12%) did not respond. From the table it is clear that some
instructors may not be adequately prepared for the tasks they are undertaking hence the need for
in-service training. If instructors were appealing in their classrooms to all students some would
not have doubted them.
Findings for Objective Three: YP Students’ Perceptions of Skills Learnt.
The third objective sought to find out YPs student perception of skills learned. The objective was
gauged by the questionnaires subjected to instructors and trainees in whom they were asked to
state the skills learned by trainees in YPs. The responses were as shown in figure 5. All,
452(100%) said that they had carpentry in their institutions but expressed concern over declining
number of learners doing IT course; while 443(98%) were doing building and construction and
386(85%) said they were doing motor vehicle as one of the courses. Eighteen of the students
0%
10%
20%
30%
40%
50%
60%
70%
80%
90%
Lesson Plan Lecture Notes Schemes ofWork
StudentsProgress
Agree
Disagree

300
were doing IT. This does not concur with vision 2030 which has it that Kenya should be
industrialized by then. Electrical engineering was being done by 225(49%), however 78(17%)
were doing welding and while 45(09%) plumbing respectively.
Figure 5: Skills learnt
From figure 4 above, although there are many good courses in YPs very few students were doing
them. This concurs with what (Ondigi, 2007) observed when he said that there was low
enrolment in YPs as a result of attitudes. These attitudes are almost similar to perceptions within
the society.
Findings for Objective Four: YP students’ perception of teaching strategies and
methodologies
The fourth objective attempted to find out YPs student perception of the teaching strategies and
methodologies in YPs. The above objective was gauged through questionnaires, interview
schedule exposed to trainee, instructors and HODs. The respondents were asked to state some of
the teaching strategies and methods used to teach. The responses are tabulated as shown on table
23 below. The students were asked to identify the type of teaching strategy used by instructors
between expository and heuristic and 335(74%) identified expository.
Table 23: Teaching strategy as given by students
Teaching strategy Percentage(n=45)
Expository-(Instructor lectures) 335(74%)
Heuristic (Learning through discovery, assignments) 117(25%)
0%
20%
40%
60%
80%
100%

301
From table 23, some students 117(25%) identified heuristic method as used. Maranga,(1993)
emphasizes the use of hands on experience because it reinforces teaching and learning hence
making learning concrete and enjoyable experience.
Key: H=Heu. 6(35%), E=Exp.11(65%)
Figure 6: Teaching strategies as given by instructors
Instructors were also asked to give the method of training and 11(65%) said they were using
expository method while 6(35%) talked of heuristic figure 6. The trend similar to the one given
by learners was replicated. This meant that although YPs teaches practical skills, lecture method
which is of low value on learner skill acquisition was being widely used. This calls for in-service
training for instructors. Mukwa et al. (2002), said that learners can learn most through heuristic
method contrary to what is revealed by the finding as given in figure 5 in which expository
seems to be widely used.
Table 24: Students’ responses on teaching methods used
Method Percentage %
Teaching theory and practice 443 (98%)
Workshops 380 (84%)
Assignments 361 (80%)
Demonstration 316(70%)
Project tasks 241(53%)
Hands on experience 226(50%)
Lecture 109(24%)
Students were asked to give the method used by the instructors to teach and 443(98%) said that
teaching theory/ practice was used. They identify workshops as the second most used 380(84%)
and lecture tasks as the least used. It should however be noted that project tasks are a very
important way of teaching and need not to be underestimated as shown by students responses in
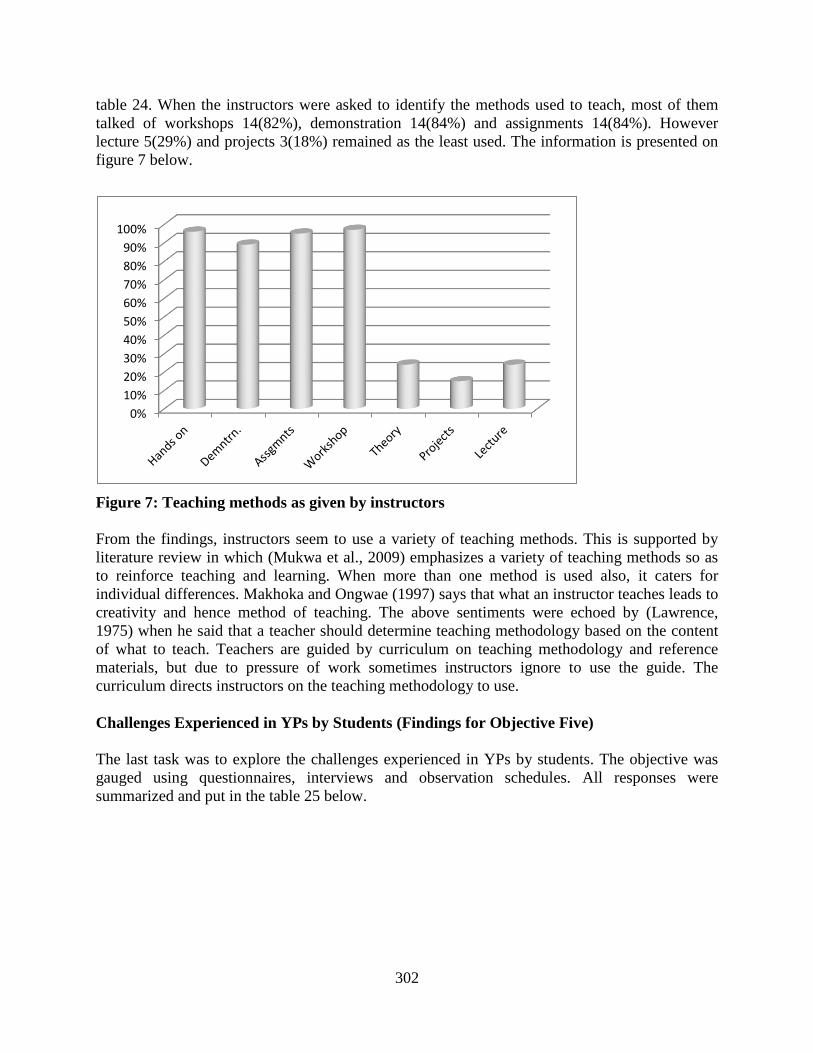
302
table 24. When the instructors were asked to identify the methods used to teach, most of them
talked of workshops 14(82%), demonstration 14(84%) and assignments 14(84%). However
lecture 5(29%) and projects 3(18%) remained as the least used. The information is presented on
figure 7 below.
Figure 7: Teaching methods as given by instructors
From the findings, instructors seem to use a variety of teaching methods. This is supported by
literature review in which (Mukwa et al., 2009) emphasizes a variety of teaching methods so as
to reinforce teaching and learning. When more than one method is used also, it caters for
individual differences. Makhoka and Ongwae (1997) says that what an instructor teaches leads to
creativity and hence method of teaching. The above sentiments were echoed by (Lawrence,
1975) when he said that a teacher should determine teaching methodology based on the content
of what to teach. Teachers are guided by curriculum on teaching methodology and reference
materials, but due to pressure of work sometimes instructors ignore to use the guide. The
curriculum directs instructors on the teaching methodology to use.
Challenges Experienced in YPs by Students (Findings for Objective Five)
The last task was to explore the challenges experienced in YPs by students. The objective was
gauged using questionnaires, interviews and observation schedules. All responses were
summarized and put in the table 25 below.
0%
10%
20%
30%
40%
50%
60%
70%
80%
90%
100%
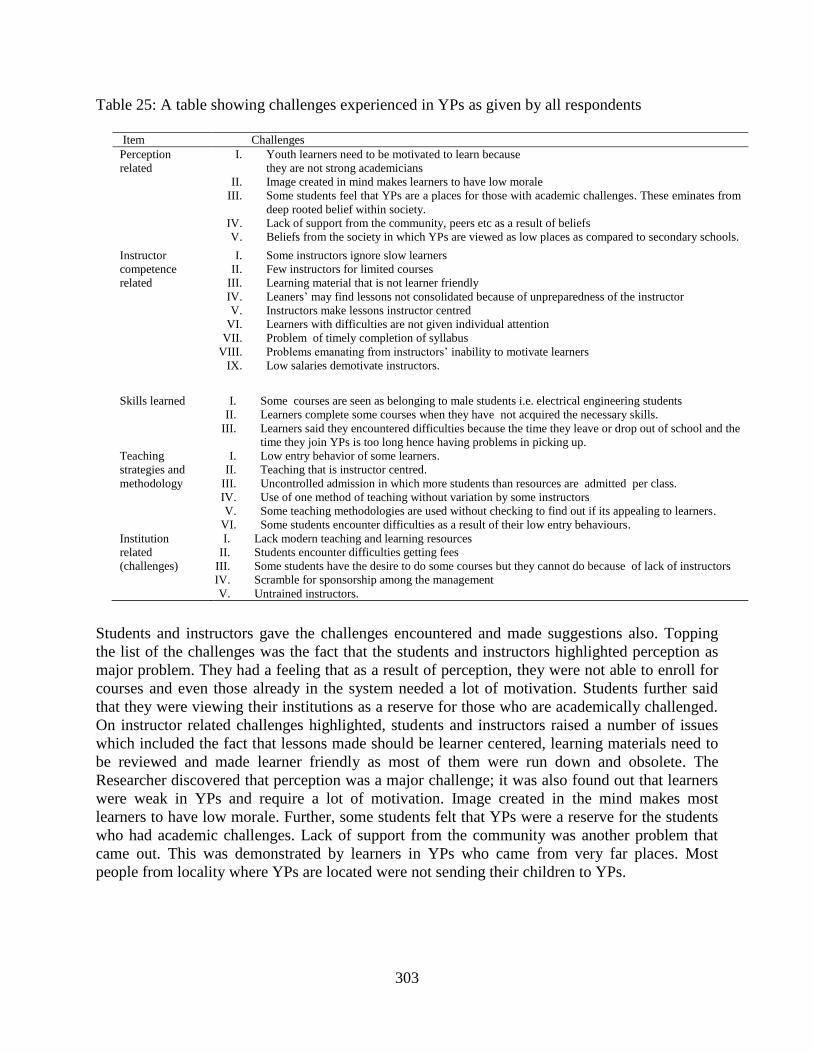
303
Table 25: A table showing challenges experienced in YPs as given by all respondents
Item Challenges
Perception
related
I. Youth learners need to be motivated to learn because
they are not strong academicians
II. Image created in mind makes learners to have low morale
III. Some students feel that YPs are a places for those with academic challenges. These eminates from
deep rooted belief within society.
IV. Lack of support from the community, peers etc as a result of beliefs
V. Beliefs from the society in which YPs are viewed as low places as compared to secondary schools.
Instructor
competence
related
I. Some instructors ignore slow learners
II. Few instructors for limited courses
III. Learning material that is not learner friendly
IV. Leaners’ may find lessons not consolidated because of unpreparedness of the instructor
V. Instructors make lessons instructor centred
VI. Learners with difficulties are not given individual attention
VII. Problem of timely completion of syllabus
VIII. Problems emanating from instructors’ inability to motivate learners
IX. Low salaries demotivate instructors.
Skills learned I. Some courses are seen as belonging to male students i.e. electrical engineering students
II. Learners complete some courses when they have not acquired the necessary skills.
III. Learners said they encountered difficulties because the time they leave or drop out of school and the
time they join YPs is too long hence having problems in picking up.
Teaching
strategies and
methodology
I. Low entry behavior of some learners.
II. Teaching that is instructor centred.
III. Uncontrolled admission in which more students than resources are admitted per class.
IV. Use of one method of teaching without variation by some instructors
V. Some teaching methodologies are used without checking to find out if its appealing to learners.
VI. Some students encounter difficulties as a result of their low entry behaviours.
Institution
related
(challenges)
I. Lack modern teaching and learning resources
II. Students encounter difficulties getting fees
III. Some students have the desire to do some courses but they cannot do because of lack of instructors
IV. Scramble for sponsorship among the management
V. Untrained instructors.
Students and instructors gave the challenges encountered and made suggestions also. Topping
the list of the challenges was the fact that the students and instructors highlighted perception as
major problem. They had a feeling that as a result of perception, they were not able to enroll for
courses and even those already in the system needed a lot of motivation. Students further said
that they were viewing their institutions as a reserve for those who are academically challenged.
On instructor related challenges highlighted, students and instructors raised a number of issues
which included the fact that lessons made should be learner centered, learning materials need to
be reviewed and made learner friendly as most of them were run down and obsolete. The
Researcher discovered that perception was a major challenge; it was also found out that learners
were weak in YPs and require a lot of motivation. Image created in the mind makes most
learners to have low morale. Further, some students felt that YPs were a reserve for the students
who had academic challenges. Lack of support from the community was another problem that
came out. This was demonstrated by learners in YPs who came from very far places. Most
people from locality where YPs are located were not sending their children to YPs.
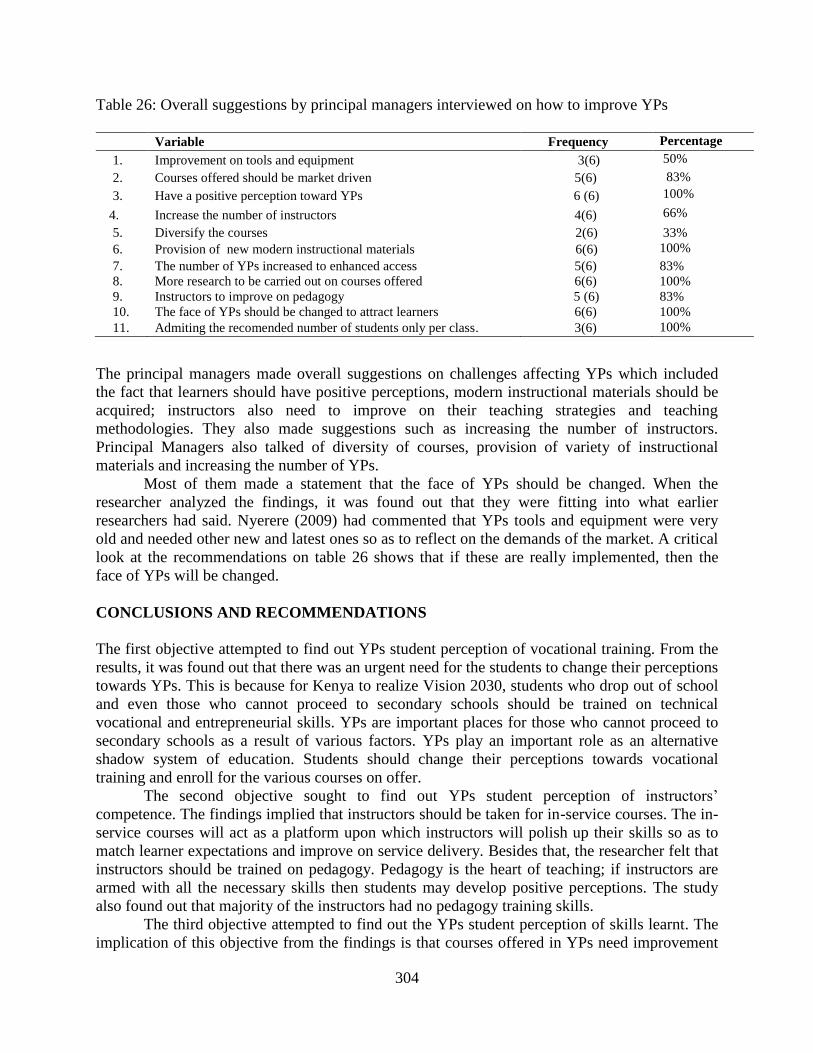
304
Table 26: Overall suggestions by principal managers interviewed on how to improve YPs
Variable Frequency Percentage
1. Improvement on tools and equipment 3(6) 50%
2. Courses offered should be market driven 5(6) 83%
3. Have a positive perception toward YPs 6 (6) 100%
4. Increase the number of instructors 4(6) 66%
5. Diversify the courses 2(6) 33%
6. Provision of new modern instructional materials 6(6) 100%
7. The number of YPs increased to enhanced access 5(6) 83%
8. More research to be carried out on courses offered 6(6) 100%
9. Instructors to improve on pedagogy 5 (6) 83%
10. The face of YPs should be changed to attract learners 6(6) 100%
11. Admiting the recomended number of students only per class. 3(6) 100%
The principal managers made overall suggestions on challenges affecting YPs which included
the fact that learners should have positive perceptions, modern instructional materials should be
acquired; instructors also need to improve on their teaching strategies and teaching
methodologies. They also made suggestions such as increasing the number of instructors.
Principal Managers also talked of diversity of courses, provision of variety of instructional
materials and increasing the number of YPs.
Most of them made a statement that the face of YPs should be changed. When the
researcher analyzed the findings, it was found out that they were fitting into what earlier
researchers had said. Nyerere (2009) had commented that YPs tools and equipment were very
old and needed other new and latest ones so as to reflect on the demands of the market. A critical
look at the recommendations on table 26 shows that if these are really implemented, then the
face of YPs will be changed.
CONCLUSIONS AND RECOMMENDATIONS
The first objective attempted to find out YPs student perception of vocational training. From the
results, it was found out that there was an urgent need for the students to change their perceptions
towards YPs. This is because for Kenya to realize Vision 2030, students who drop out of school
and even those who cannot proceed to secondary schools should be trained on technical
vocational and entrepreneurial skills. YPs are important places for those who cannot proceed to
secondary schools as a result of various factors. YPs play an important role as an alternative
shadow system of education. Students should change their perceptions towards vocational
training and enroll for the various courses on offer.
The second objective sought to find out YPs student perception of instructors’
competence. The findings implied that instructors should be taken for in-service courses. The in-
service courses will act as a platform upon which instructors will polish up their skills so as to
match learner expectations and improve on service delivery. Besides that, the researcher felt that
instructors should be trained on pedagogy. Pedagogy is the heart of teaching; if instructors are
armed with all the necessary skills then students may develop positive perceptions. The study
also found out that majority of the instructors had no pedagogy training skills.
The third objective attempted to find out the YPs student perception of skills learnt. The
implication of this objective from the findings is that courses offered in YPs need improvement

305
to reflect lab our market. If the courses are such that on completion students can access
employment then they will change their perception. Further research on courses that are market
driven ought to be carried out. The courses on offer were however able to make learners self-
reliant despite the fact that most of the potential students were not enrolling for the same. Image
of YPs can be improved by offering a curriculum that is appealing to learners and the community
at large. Instructors for all courses should be availed and in-service refresher courses on
pedagogy provided. YPs should be equipped with modern instructional resources and
infrastructure. Instructors for all courses within YPs curriculum should be availed.
The fourth objective established the YPs student perception of the teaching
methodologies. The study found out that instructors needed to vary their teaching methodologies.
Learners get bored so easily and may not be able to follow the lesson well if one method is used.
All educationists recommended the use of variety of methods to teach. The learners also said that
most of the teaching strategies were instructor centered. A lesson that is instructor centered is not
learner friendly. However the instructors can make their lessons appealing by shifting their focus
to the students. About the teaching methodologies students said that they were able to follow
lessons when instructors used hands on experience. Learners therefore learn most when such
methods are used.
The last objective identified the challenges encountered in YPs by the learners. From the
findings, YPs institutions are lacking modern infrastructure, apart from that they also lack
modern equipments. Instructors also were missing in some courses. ICT which is a very
important course should be taught. Infrastructure in YPs should be improved and modern
equipments supplied. This is because resources facilitate learning. The researcher felt that the
rundown and obsolete resources observed could be part of causes of perception on the side of
students. It was further suggested that YPs be supplied with:- A curriculum that would lead to
university education, better infrastructure in terms of buildings, tools and equipment and
instructors for all courses.
Recommendations
In light of the research findings, the following recommendations were made:
Students need to change their perception of vocational training in YPs. The public should
be sensitized about the importance of YPs. All those who fail to proceed to secondary
schools should enroll for courses in YPs. Potential trainees need to be sensitized about
the importance of taking courses in YPs.
Instructors in YPs should take in-service courses on pedagogy. Instructors should also
take some in-service training. More instructors hired should be on full time as opposed to
contract.
The curriculum offered in YPs should be improved so as to offer competitive courses that
are market driven and address unemployment challenges. The teaching – learning
resources (including textbooks) in YPs should be reviewed and revised to reflect realities
of new trends in teaching.
Remedies on challenges affecting learners should be provided. This includes taking care
of learner needs such as motivation. Learners in YPs are not strong academicians,
therefore they should be motivated.
Modern facilities and infrastructure should be provided in YPs.
306
The government should give more funding to YPs.
Policy Recommendations
YPs play an important role as shadow institutions of learning for those with academic
challenges hence all learners who fail to proceed to secondary schools should be enroll
for various courses of their interest.
YPs should be mainstreamed in the educational system. The curriculum offered should
address the realities of unemployment faced by youth learners.
Instructors need to polish up their skills by attending in-service courses. Facilities need to
be modernized as they are old and run down.
YPs students being slow learners need to be motivated.
Public needs a lot of sensitization to change their perceptions and view YPs as alternative
avenues of education.
Recommendations for further Research
The study be replicated in other parts of the country;;
A study on determinants of skill acquisition in YPs learner be carried out;
A study on availability and use of teaching and learning resources in YPs be carried out;
A similar study on adequacy of YPs curriculum in equipping learners with desired skills
be carried out.
REFERENCES
Achieng, R. (2012). Factors Affecting Acquisition of Vocational Skills among Youth Learners in
Maranda, District. Unpublished Thesis, UON.
Akinnawonu, B. M. (2008). Philosophical Challenges of Science and Technology in
Contemporary Africa. The Nigerian Experiment Journal of Social Sciences, 4(2), 148.
Altinyelkien, K. H. (2004). Technical and Vocational Training in Developing Countries
Atchoerena, D. D. (2001). Revisiting Technical and Vocational Education in Sub-Saharan
Africa: An Update on Trends Innovations and Challenges. Paris
Anderson, R. J. (1985). Cognitive Psychology and its Implication (2nd Ed.). New York: H.H.
Freeman and Company.
Atkinson, J. N. (1967). Modern Teaching Aids. London: Maclean and Son’s .
Ayot, H. O., & Patel, M. M. (1992). Instructional Methods. Nairobi: ERAP Baker.
Balyage, Y. (1990). Evaluation of Curriculum Unpublished. Reading Report. Philippine Union
College.
Bell, J. (1993). Doing Your Research Project. Backinghem: Open University Press.
Banners, P. (1993). From Novice to Expert: Excellence and Power. Addison- Wesley, Merlo
Park CA.
Bloom, B. (1956). Taxonomy of Educational Objectives. Wikipedia
Borg,W. R., & Gall, M. D. I. (1989).Review Educational Research. An Introduction User
Review- Fitrian Prila-Godreads.
Bosire, E. S. (1996). Proposals for Improvement of Training of English. Primary Schools
Teachers in Kenya. Unpublished Thesis, Moi University. Eldoret.

307
Bruce, T. W. (1978). Conducting Educational Research. New York: Harcous Press.
Brunner, J. S. (1966). The Sensible Teaching of Social Science or Matbetics. Revised, USA:
Instruction National Society.
Brumfit, C. (1979). Intergrating Theory and Practice. Susan Holden (Ed.), Teacher Training.
London: Modern English Publications.
Bwika, M. (1997). Instructor Training Hand Outs. Nairobi.
Carl, S. (1985). Excellence in Teaching. Michigan: Baker Book House.
Casper, A., & Fifer, W. (1980). Science. New Series. America.
Cochran, S.M. (2003). Research-Based Characteristic of High Quality: Teacher Preparation.
ASCD Research Brief 1(4),
Cohen, L., & Marion, L. (1986). Research Methods in Education: New York.
Council Conclusion on the Role of Education and Training in the implementation of the Europe
2020 Strategy (2011).www.europe.enc
Cross, W. E. (1995). The Psychology of Nigrescene. Revising.The Cross Models. A Handbook
of Multicultural Counseling. Thousands Oaks:CA: Sage.
Koech, D. (1999). Wikipedia, the Encyclopedia
Edling, V. (1970). Individual and Instruction. Oregon State University.
ERSP, (2003). Kenya Education Sector Support Programm. Ministry of Education Science and
Technology. Nairobi: Government Press.
Festinger, L. (1975). Visual Perception during Smooth Pursuit Eye-Movements. Vision
Research.
Flangan, J. C. (1968). Project Plan in Technology and Innovation in Education. New York:
Peason.
Fernand, P. (1972). Wikipedia
Gachira, R. (2002). Ensuring Relevance and Quality in TVET and Entrepreneurship
Education.Nairobi Kenya.
Gachira, R. (2009). Youth Polytechnic. Nairobi.
Gagne,R (1966). The conditions of learning (1st Ed.). New York: Holt, Rinehart &Winston.
Gibson, J. J. (1966). Introduction to Psychology: The Senses Considered as Considered as
Perceptual Systems. Boston: Houghton Mifflin.
Glimmer, B., & Deci(1977). Industrial and Organizational Psychology. 4th Ed. Newyork: Mc
Graw –Hill Book Company.
Government of Kenya (1999). Koech’s Report on Curriculum. Nairobi: Goverments Press.
Government of Kenya (2005). 7th Dec. Report on Reasons for Starting the Ministry of Youth
Affairs and Sports.
Government of Kenya (2007). Governments Strategy on Vision 2030. Nairobi. Government
Press.
Gregory, R. (1970). Theory of Perception as Hypothesis. Phil. Trans. R. Soc. Lond. Bzao.
Hamred, P. (1967). Systematic Instructional Product Development. USA.
Helmholtz, H. (1962). Concerning Perceptions in General. New York. Dover.
Horn, R. E. (1969). Information Mapping for References. Massachusetts: Resources Lexington.
Http/ www.leakenya. Or. Ke publications/doc-detais/19-Unicef-Youth-review-investment
ILO (1972). General Survey on the Reports Relating to Employment. Labour Conference, 57th
Session.
Irumbi, M. (1990). The Relationship between Mathematics and Attitude. Unpublished Thesis.

308
Luyali.E., Olel, A., & Lucas (2015). Enrolment Trends in YPs in West Pokot. Journal of
Education and Practice, 6(10),
Kamau, S. M. (2013). Challenges affecting TIVET Training in YPs in Kiambu County.
International Journal of Human Resource and Procurement, 7(5),
Kangombe, J. (2012). Factors influencing youth enrolment levels in public Youth Polytechnics
in Mombasa.
Khiteya, M. (1996). The Youth Polytechnic Programme in the Context of the 8-4-4 System
Education. A Case of Kakamega District. Kenyatta University MED Thesis.
Kenya Session Paper No. 1 (2005). Ministry of Higher Education Science and technology
MOHEST. Nairobi: Government Press .
KESSP (2010). Kenya Education Sector Support Programme. International Labour Organisation
King, E. K., & Buchman, R. (2007). Educating out of Poverty? A Synthesis Report on Ghana,
India, Kenya, Rwanda, Tanzania and South Africa. Edinburburgh.
Lawrence, S. (1975). An Introduction to Curriculum Research and Development. London:
Heinmann Educational Books.
Lock, J. (1976). Wikipedia the free encyclopedia.
Mac. A. (2009). Positioning The Learning Portfolio as A Key Component in Organizations
Management Strategy. Performance Improvement.
Marger, F. (1963). Developing Attitudes towards Learning. California. Belmont.
Makokha & Ongwae (1997). 14 Days Training Hand Out Book. Nairobi
Maranga J. S. (1993). Improving Teaching, Learning, Administration and Supervision: Future
Perspectives on Preparation for Basic Education for all the 21st Century. Basic
Educational Forum 3. Nairobi: Basic Education Resource Center.
Mcleod, C. (2007). Visual Perceptions. London. Oxford Press.
Ministry of Youth Affairs and Sport MOYA (2007). Vijana Magazine Issue No. 1: Nairobi.
Ministry of Youth Affairs and Sport MOYA (2010). Session Paper 1. The Important
Contribution to Human Capital Development. Nairobi: Government Press.
Ministry of Higher Education Science And technology MOHEST (1966). Report on Youth
Polytechnics. Nairobi. Government Press.
Mukhebi, A. W. (2011). Food Crisis in Eastern Africa: Lessons Learned From Past and way
forward. Addis Ababa, Ethiopia
Mukwa, W & Too, J. (2002). General Instructional Methods. Eldoret: Moi Unversity Press.
Munn, N. L., & Fernald, L. D (1972). Intoduction to Psychology. 3rd Edition. Calcutta: Oxford
Publishing House.
Muriithi, N. (1997). Case for removal of KCPE Exam. Capital Blog.
Ministry of Education (MOE) (2013). Order of 2007 given to youth training vie executive order
No. 2 /2013.
Namach, S. K. (1990). A Study of Factors Which Affect the Implementatation of 8-4-4 Primary
English in Selected Schools in Funyula Division of Busia District. Unpublished Thesis,
Kenyatta University.
National Bureau of Statistics (NBC) (1972). UNDP Report on Kenya National Human
Development.
National Council Churches of Kenya (NCCK) (1968). Youth Polytechnics. Nairobi.
Njati, C. (2011). The Impact of Vocational Training for Rural Development in Nyambene
District Kenya. A Case of Muthara Youth Polytechnic. Kenyatta University MED Thesis.

309
Nyerere, J. (2009). Technical and Vocational Sector Mapping in Kenya for the Dutch Scholand
VET. Nairobi.
Obaka, M. (2012). The Dissemination of Technology for Rural Development in Kenya. A Case
Study of Ngiya Youth Polytechnic. Kenyatta University M.Ed Thesis.
Obani, T., & Doherty, J. (1984). A study on some factors influencing attitudes to teaching
handicapped among Nigeria students’. International Journal of Educational Development
Okoth, P. (2009). A Critical Analysis of Curriculum Offering at Maseno Youth Polytechnic,
Emuhaya District Province. Maseno University M.Ed. Thesis.
Ondigi, R. S. (1998). Students Attitudes,Values and Beliefs towards Vocational Training in
Kenya. A Case study of four Youth Polytechnics in Gusii. Nyanza. P.hD. Thesis
Orodho J. A. (2002).Access and Participation in School Education In Kenya. Emerging Issues
and Policy Implications. JA Orodho Institute of Policy.
Oso, Y. W., & Onen, D. (2005). General Guide to Writing Proposal and Report, Kisumu. Kenya.
Option Press and Publishers.
Owano, A. (1988). Contribution of Youth Polytechnics. Unpublished MED Thesis.
Palmer, J. (2010). What Room for Education in Post Primary? Nairobi.
Republic of Kenya (1976). Gachati Report of National Committee on Educational Objectives
and Policies. Nairobi: Government Printer.
Republic of Kenya, (1964). Ominde Report on Educational Commission. Nairobi: Government
Printer.
Republic of Kenya (1988). Kamunge Report, the Presidential Session Paper. Nairobi.
Government Printer.
Palmer, P. (2007).Technical and Vocational Education and Training (TVET) Sector Mapping in
Kenya.
Scott, R.L & Shultz, R.E (1979), Instructional Product Development, New York: Van No. Strand
Reinhold.
Seymour, W. Y. (1968). Skills Analysis Training. London. Edinburgh. Oliver and Boyd.
Skinner, B. F. (1961). The Science of Learning and the Art of Teaching. Harvard. Harvard
educational Press.
Slater, A., & Morison, B. (1985). The Scope and Methods of Development Psychology.
Shulman, L. (1987). Knowledge and Teaching Founding of New Reform. Harvard: Educational
Review.
Smith, M. (2003). Research Based Characteristics of High Quality Teachers Preparation. ASCD
Research Brief, 1(4).
Standard Newspaper of 3rd (2012). The importance of Youth Polytechnics. Nairobi: Standards
Press.
Standard Newspaper of 19th (2012). Attitudes towards Youth Polytechnics. Nairobi: Standards
Press
Taylor, P. J. (1971). Educational Aspects of Simulation. London: MC Graw Hill.
Twoli, N. W. (2007). Teaching Secondary School Chemistry. A Textbook for Chemistry
Teachers in Developing Countries. Nairobi: Nehema Publishers.
UNDP (2009). Inspiring Kenyans Greatest Resource the Young People. National Youth Week
10th To 15th August.
UNDP (2009). Kenya National Human Development Report. Nairobi.
UNESCO (1995). Educational Challenges in the 21st Century. Nairobi.
UNICEF (2009). National Youth Situational Report. Nairobi.

310
Walkin, L. (1987). Instructional Techniques and Practice. Great Britain: The Bath Press.
©IJSRE --------------------------------------------------------------------------------------------------------------------------- i Wilson Kipkemboi Metto is of the Department of Educational Communication and Technology, School of
Education, Kenyatta University, Kenya. He can be reached via email at [email protected].