young people and education directorate scorecard
TRANSCRIPT

Children, Young People and Education Performance Management
Children, Young People and Education Directorate Scorecard
Produced by: Management Information & Intelligence, KCC
Publication Date: 16th August 2021
June 2021

This page is intentionally blank

Guidance Notes
POLARITY DATA PERIOD
H The aim of this indicator is to achieve the highest number/percentage possible R12ML The aim of this indicator is to achieve the lowest number/percentage possible MST The aim of this indicator is to stay close to the target that has been set YTD
QRAG RATINGS A
RED
AMBER CYPE Children, Young People and Education Directorate Scorecard
GREEN EY Early Years Scorecard
NEET NEET Monthly Scorecard
DIRECTION OF TRAVEL (DOT) SEND Special Educational Needs & Disabilities Scorecard
Performance has improved ICS Intensive EH and CSWS Monthly Performance Report
Performance has worsened
Performance has remained the same
INCOMPLETE DATA KEY TO ABBREVIATIONSN/A Data not available
Data to be supplied CIC Children in CareCSWT Children's Social Work Teams
Data in italics indicates previous reporting year CYP Children and Young PeopleDWP Department for Work and PensionsEY Early Years
MANAGEMENT INFORMATION CONTACT DETAILS EYFE Early Years Free EntitlementEYFS Early Years Foundation Stage
Wendy Murray 03000 419417 FF2 Free For TwoMaureen Robinson 03000 417164 FSM Free School MealsMatt Ashman 03000 417012 NEET Not in Education, Employment or TrainingChris Nunn 03000 417145 SCS Specialist Children's Services
SEN Special Educational Needs
Floor Standard* has not been achieved CHILDREN, YOUNG PEOPLE AND EDUCATION SCORECARDS
Children, Young People and Education Directorate Scorecard
Monthly Rolling 12 monthsMonthly SnapshotYear To DateQuarterlyAnnual
Notes: Please note that there is no 2019‐20 Education attainment or absence data due to the impact of Coronavirus (COVID‐19) and there are no plans for 2020‐21 data to be published. Figures for indicator CYPE8 (Rate of proven re‐offending by CYP) shown in red have not been published by the Minstry of Justice (MoJ) but are included for information in this scorecard.Please note that not all Children's Social Work indicators can be shown broken down by District for the associated CSWS team, as caseloads relating to these indicators are held by Area and Kent LA level teams. Cases included in a dataset are based on the Service working with the child and not the child's geographical residence. For new Teams/Services that are created within CSWS or EH, there will be no historical data shown initially, as it is only available from the point at which the new Team/Service begins.
MIIntensiveEH&[email protected]
* Floor Standards are set in Directorate Business Plans and if not achieved must result in management action
Target has been achieved
Floor Standard* achieved but Target has not been met
MIEducation&[email protected]
Page 1

Children, Young People and Education Performance Management June 2021
Directorate Scorecard ‐ Kent Activity/Volume
as at May 2021 130,080 pupils in 459 primary schools as at Jun 2021 Rate of Early Help Unit Referrals as at Jun 2021 Open cases22.9 % with free school meals (17.7%) per 10,000 of the 0‐17 population
(inclusive, rolling 12 months) Intensive Early Help 3,033 (Families)107,308 pupils in 101 secondary schools Open Social Work Cases 11,67217.7 % with free school meals (15.9%) Including:
• Child Protection 1,2405,271 pupils in 24 special schools • Children in Care 1,76241.8 % with free school meals (39.9%) • Care Leavers 2,041
as at Jun 2021 Ofsted good or outstanding as at Jun 2021 Rate of referrals to Children's Social as at Jun 2021 Number of First Time Entrants into Work Services per 10,000 of the 0‐17 the Youth Justice system
EY providers 97.8% (96%) population (inclusive, rolling 12 months)Primary 94.1% (88%)Secondary 87.4% (76%)Special 90.9% (90%)
as at Jun 2021 Requests for SEND statutory assessment as at Jun 2021 Activity at the Front Door (children) Open Access Indicators
Total contacts 7,291 To be added in 2021Number resolved at FD 3,424Number to CSWS 1,729Number to EH Units 1,428
• Figures shown in brackets are National averages• Ofsted Na onal averages are as at 31st March 2021, except for EY Providers, which is as at 31st August 2020• Free School Meal averages are as at January 2020 school census and based on state funded schools only
585.3569.2
549.8 554.2568.8
596.6 600.1
594.6572.8
558.2 562.9 568.8581.6
575.1264
259255
270 271 269
260
295 299 308
445
277
389
348
Dec 2020 to June 2021
Dec 2020 to June 2021
Dec 2020 to June 2021 Dec 2020 to June 2021
Management Information, CYPE, KCC
Page 2

Children, Young People and Education Performance Management June 2021
Directorate Scorecard ‐ Kent KPIs
Pola
rity
Data
Per
iod
QPR Latest
Month DOT Target 2021-22
RAG 2021-22
Kent Outturn 2020-21
Target 2020-21
RAG 2020-21
Benchmark Group 2019-
20
England 2019-20
Linked to SDP?
Dec-20 Jan-21 Feb-21 Mar-21 Apr-21 May-21 Jun-21 SN or SE
SCS03 Percentage re-referrals to Children's Social Work Services within 12 months of a previous referral (R12M) L R12M 29.0 29.0 28.8 28.0 27.5 26.6 25.5 25.0 AMBER 28.0 25.0 AMBER 26 22.6
SCS08 Percentage of Returner Interviews completed for those with SCS Involvement H R12M 93.9 94.5 94.3 94.4 94.3 93.8 91.9 90.0 GREEN 94.4 90.0 GREEN N/A N/A
SCS13 Percentage of children becoming subject to a child protection plan for the second or subsequent time T R12M 23.3 23.5 22.6 22.2 21.8 22.0 20.5 20.0 GREEN 22.2 20.0 GREEN 23.4 21.9
SCS18 Children in Care in same placement for the last two years (for those in care for two and a half years or more) H MS 71.3 70.9 68.7 67.2 67.3 68.2 66.8 70.0 AMBER 67.2 70.0 AMBER 60 N/A
SCS19 Percentage of CIC Foster Care in KCC Foster Care/Rel & Friends placements (exc UASC) H MS 80.2 80.5 79.8 79.3 79.3 79.5 79.4 85.0 AMBER 79.3 85.0 AMBER N/A N/A
SCS29 Average number of days between becoming a child in care and moving in with an adoptive family L R12M 255.1 266.0 281.8 274.3 274.5 279.7 280.7 426.0 GREEN 274.3 426.0 GREEN N/A N/A
SCS34 Percentage of care leavers in education, employment or training (of those KCC is in touch with) H R12M 61.6 60.4 59.4 60.0 59.8 59.5 59.3 65.0 AMBER 60.0 65.0 AMBER N/A N/A
SCS37 Percentage of Case File Audits graded good or outstanding H R12M 81.2 80.3 80.3 80.1 80.5 80.2 80.2 80.0 GREEN 80.1 80.0 GREEN N/A N/A
SCS40 Percentage of case holding posts filled by permanent qualified social workers H MS 93.5 92.9 91.8 92.5 93.0 91.1 92.6 85.0 GREEN 92.5 85.0 GREEN N/A N/A
SCS42 Average caseloads in the CIC Teams L MS 13.8 14.2 13.7 13.5 13.2 13.2 13.1 15.0 GREEN 13.5 15.0 GREEN N/A N/A
SCS43 Average caseloads in the CSWT Teams L MS 20.7 20.2 20.0 21.0 21.0 21.4 21.2 18.0 AMBER 21.0 18.0 AMBER N/A N/A
EH72-F Percentage of referrals to an Early Help Unit where a previous episode ended within 12 months L R12M 26.0 26.8 27.6 28.1 28.1 28.1 28.0 25.0 AMBER 28.1 25.0 AMBER 22 N/A Yes
EH52-F Percentage of EH Assessments completed in the given month, within 6 weeks of allocation H MS 71.3 74.4 76.3 78.3 80.9 82.4 83.5 80.0 GREEN 78.3 70.0 GREEN N/A N/A Yes
Percentage of EH Unit Case Audits rated good or outstanding H R12M 75.2 73.1 73.1 72.3 76.1 75.8 75.8 80.0 AMBER 72.3 80.0 AMBER N/A N/A
EH16-F Percentage of EH cases closed with outcomes achieved that come back to EH or CSWS in 3 mths L R12M 14.9 14.5 14.0 13.6 13.3 13.2 13.3 15.0 GREEN 13.6 15.0 GREEN N/A N/A
Average Caseload within EH Units (Families) L MS 14.0 13.2 13.2 13.1 13.1 14.6 15.3 15.0 AMBER 13.1 15.0 GREEN N/A N/A
Pola
rity
Data
Per
iod
QPR Latest
Quarter DOT Target 2021-22 RAG
Kent Outturn 2020-21
Target 2020-21
RAG 2020-21
Benchmark Group as at May 2021
England & Wales as at May 2021
Linked to SDP?
Q2 20-21 Q3 20-21 Q4 20-21 Q1 21-22 SN or SE
CYPE8 Rate of proven re-offending by CYP L Q 36.2 35.7 34.2 32.4 35.0 GREEN 34.2 38.4 GREEN 38.3 37.8
Integrated Children's Services Quarterly Indicators Quarterly Trends
Integrated Children's Services Monthly Indicators Monthly Trends
Management Information, CYPE, KCC Page 3
Children, Young People and Education Performance Management June 2021
Directorate Scorecard ‐ Kent KPIs
Pola
rity
Data
Per
iod
QPR Latest
Month DOT Target 2020-21 RAG
Kent Outturn 2019-20
Target 2019-20
RAG 2019-20
Benchmark Group 2019-
20
England 2019-20
Linked to SDP?
Dec-20 Jan-21 Feb-21 Mar-21 Apr-21 May-21 Jun-21 SN or SE
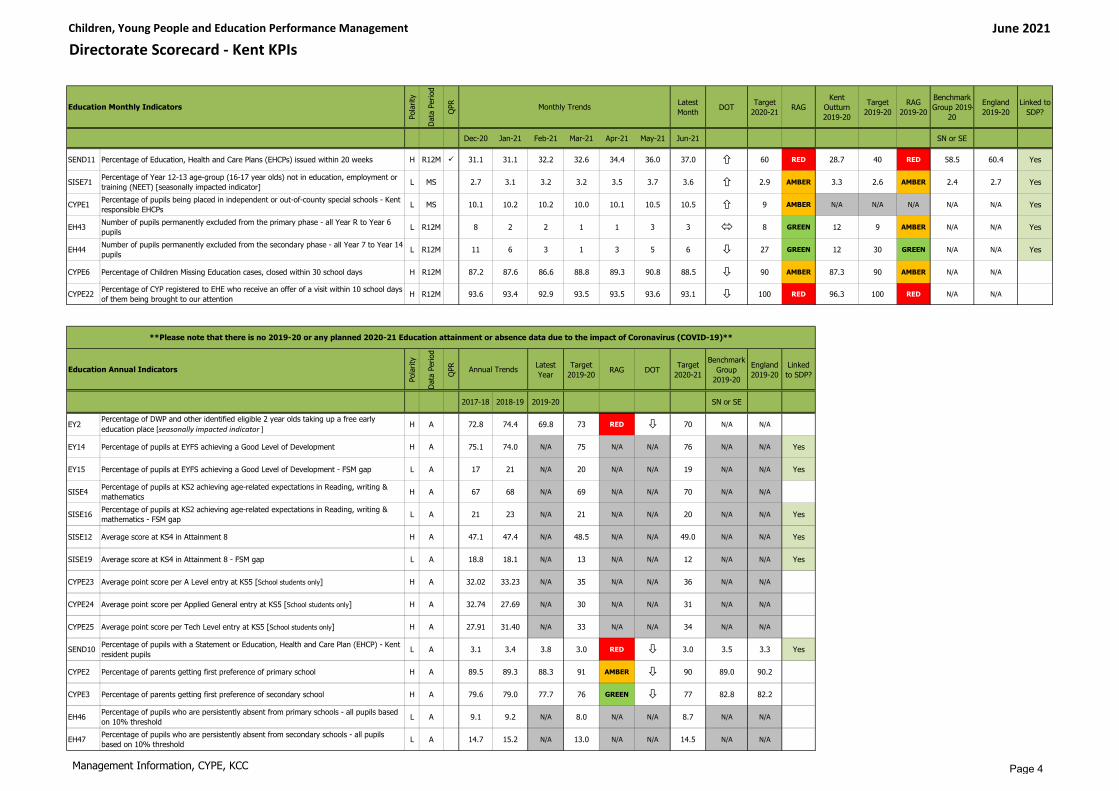
SEND11 Percentage of Education, Health and Care Plans (EHCPs) issued within 20 weeks H R12M 31.1 31.1 32.2 32.6 34.4 36.0 37.0 60 RED 28.7 40 RED 58.5 60.4 Yes
SISE71 Percentage of Year 12-13 age-group (16-17 year olds) not in education, employment or training (NEET) [seasonally impacted indicator] L MS 2.7 3.1 3.2 3.2 3.5 3.7 3.6 2.9 AMBER 3.3 2.6 AMBER 2.4 2.7 Yes
CYPE1 Percentage of pupils being placed in independent or out-of-county special schools - Kent responsible EHCPs L MS 10.1 10.2 10.2 10.0 10.1 10.5 10.5 9 AMBER N/A N/A N/A N/A N/A Yes
EH43 Number of pupils permanently excluded from the primary phase - all Year R to Year 6 pupils L R12M 8 2 2 1 1 3 3 8 GREEN 12 9 AMBER N/A N/A Yes
EH44 Number of pupils permanently excluded from the secondary phase - all Year 7 to Year 14 pupils L R12M 11 6 3 1 3 5 6 27 GREEN 12 30 GREEN N/A N/A Yes
CYPE6 Percentage of Children Missing Education cases, closed within 30 school days H R12M 87.2 87.6 86.6 88.8 89.3 90.8 88.5 90 AMBER 87.3 90 AMBER N/A N/A
CYPE22 Percentage of CYP registered to EHE who receive an offer of a visit within 10 school days of them being brought to our attention H R12M 93.6 93.4 92.9 93.5 93.5 93.6 93.1 100 RED 96.3 100 RED N/A N/A
Pola
rity
Data
Per
iod
QPR Latest
YearTarget
2019-20 RAG DOT Target 2020-21
Benchmark Group
2019-20
England 2019-20
Linked to SDP?
2017-18 2018-19 2019-20 SN or SE
EY2 Percentage of DWP and other identified eligible 2 year olds taking up a free early education place [seasonally impacted indicator ] H A 72.8 74.4 69.8 73 RED 70 N/A N/A
EY14 Percentage of pupils at EYFS achieving a Good Level of Development H A 75.1 74.0 N/A 75 N/A N/A 76 N/A N/A Yes
EY15 Percentage of pupils at EYFS achieving a Good Level of Development - FSM gap L A 17 21 N/A 20 N/A N/A 19 N/A N/A Yes
SISE4 Percentage of pupils at KS2 achieving age-related expectations in Reading, writing & mathematics H A 67 68 N/A 69 N/A N/A 70 N/A N/A
SISE16 Percentage of pupils at KS2 achieving age-related expectations in Reading, writing & mathematics - FSM gap L A 21 23 N/A 21 N/A N/A 20 N/A N/A Yes
SISE12 Average score at KS4 in Attainment 8 H A 47.1 47.4 N/A 48.5 N/A N/A 49.0 N/A N/A Yes
SISE19 Average score at KS4 in Attainment 8 - FSM gap L A 18.8 18.1 N/A 13 N/A N/A 12 N/A N/A Yes
CYPE23 Average point score per A Level entry at KS5 [School students only] H A 32.02 33.23 N/A 35 N/A N/A 36 N/A N/A
CYPE24 Average point score per Applied General entry at KS5 [School students only] H A 32.74 27.69 N/A 30 N/A N/A 31 N/A N/A
CYPE25 Average point score per Tech Level entry at KS5 [School students only] H A 27.91 31.40 N/A 33 N/A N/A 34 N/A N/A
SEND10 Percentage of pupils with a Statement or Education, Health and Care Plan (EHCP) - Kent resident pupils L A 3.1 3.4 3.8 3.0 RED 3.0 3.5 3.3 Yes
CYPE2 Percentage of parents getting first preference of primary school H A 89.5 89.3 88.3 91 AMBER 90 89.0 90.2
CYPE3 Percentage of parents getting first preference of secondary school H A 79.6 79.0 77.7 76 GREEN 77 82.8 82.2
EH46 Percentage of pupils who are persistently absent from primary schools - all pupils based on 10% threshold L A 9.1 9.2 N/A 8.0 N/A N/A 8.7 N/A N/A
EH47 Percentage of pupils who are persistently absent from secondary schools - all pupils based on 10% threshold L A 14.7 15.2 N/A 13.0 N/A N/A 14.5 N/A N/A
Education Annual Indicators Annual Trends
Education Monthly Indicators Monthly Trends
**Please note that there is no 2019-20 or any planned 2020-21 Education attainment or absence data due to the impact of Coronavirus (COVID-19)**
Management Information, CYPE, KCC Page 4

Children, Young People and Education Performance Management June 2021
Directorate Scorecard ‐ Kent KPIs
Commentary on Integrated Children's Services Indicators:
Children's Social CareAMBER: The percentage re‐referrals to Children's Social Work Services within 12 months of a previous referral was 25.5% for June 21 which is now just above the Target of 25.0%. The rates of referals have been decreasing, reducing down from 29.0% in December 2020. The reductions in performance are more evident within the rolling 3 month figures, which for June 2021 was 21.4%. This compares to the latest published England average of 22.6%, 23.9% for Kent’s Statistical Neighbours and 26.0% for the South East (all comparative rates are for 2019/20 performance).
AMBER: The percentage of Children in Care in same placement for the last two years (for those in care for two and a half years or more) is 66.8%. Performance is normally around the Target of 70.0% so the reasons for the latest decrease is being analysed. Despite this decrease Kent's current performance remains above the latest published the average for Kent’s Statistical Neighbours of 64.7% and the average for the South East of 65.0%. It is now slightly below the England average of 68.0% (comparative data is for 2019/20).
AMBER: The percentage of CIC Foster Care in KCC Foster Care/Rel & Friends placements (excluding UASC) is 79.4% which is below the target of 85.0%. Performance for the last 12 months has averaged 79.9%, remaining static over the past year. Information regarding the availability of in‐house foster placements is continually reviewed to ensure that foster carer capacity is fully utilised and that children and young people are placed in the most suitable placement and there is a continued focus on recruiting and retaining Kent Foster Carers.
AMBER: The percentage of care leavers in education, employment or training (of those KCC is in touch with) is 59.3%. Performance for this measure over the last 12 months has averaged 60.2% so has remained fairly static.
AMBER: The average caseload in the Children's Social Work Teams (CSWT) is 21 cases, which is above the target caseload of no more than 18 children/young people.
GREEN: Percentage of Returner Interviews completed for those with Children's Social Work Involvement is 91.9% which exeeeds the target of 90.0%
GREEN: The percentage of children becoming subject to a child protection plan for the second or subsequent time is 20.5% which is within the target range of 17.5% ‐ 22.5% and compares to average rates for England of 21.9%, Statistical Neighbours 22.7% and the South East 23.4% (2019/20).
GREEN: The average number of days between becoming a child in care and moving in with an adoptive family is 281 days, which remains significantly below the nationally set target of 426 days. The definition for this measure has been amended for 2021/22 reporting following a change by the DfE to make an adjustment for foster carer adoptions. All of the figures contained within this report have been provided based on that new definition, but previous versions of this report will have used the previous definition.
GREEN: The percentage of Children's Social Work Case File Audits graded good or outstanding is 80.2%, just above the 80.0% Target.
GREEN: The percentage of case holding posts filled by permanent qualified social workers is 92.6%, remaining significantly above the target of 85.0% (which is based on the national average for Agency Social Workers of 15%)
GREEN: The average caseloads in the Children in Care (CIC) Teams is 13 cases, remaining below the target caseload of no more than 15 children/young people.
Intensive Early HelpAMBER: The percentage of referrals to an Early Help Unit where a previous episode ended within 12 months is 28.0%, which is above the target of 25.0%. Work to review the re‐referrals to EH Units is being undertaken alongside an analysis of re‐referrals for Children's Social Care teams.
AMBER: The percentage of cases open to Intensive Early Help that were audited and graded as good or outstanding is 75.8% which is below the 80.0% target.
AMBER: The average caseload within Early Help Units is 15.3 families which has risen just about the the Target of no more than 15 families.
GREEN: The percentage of EH Assessments completed in the given month, within 6 weeks of allocation, has continued to improve and in June 2021 was 83.5%,. The Target of 80.0% was achieved in April 2021 and performance has remained above Target for the last 3 months.
GREEN: The Percentage of EH cases closed with outcomes achieved that come back to EH or CSWS in 3 months is 13.3%, remaiing below the Target of 15.0%
Commentary on Education Indicators:
The majority of eduction indicators are annual. Commentary has only been provided for indicators where new data has been published since the last scorecard was issued
RED: Based on the rolling 12‐month average, 37.0% of EHCPs were issued within 20 weeks (958 out of 2,589). In the single month of June this increased to 44.6% with 127 of plans out of 285 being issued within timescale. This percentage increase is in the context of an overall increase in the number of EHC plans issued each month. The Service remains focused on clearing the backlog of assessments over 20 weeks with the number reduced from 460 at the end of March to 250 at the end of June. The number of requests for Statutory Assessment (EHC needs assessment) remains high, with an average of 338 request per month over the last quarter.
RED: The percentage of CYP registered to EHE who receive an offer of a visit within 10 school days of them being brought to our attention at 93.1% remains below the target of 100%
AMBER: The Percentage of Year 12‐13 age‐group (16‐17 year olds) not in education, employment or training (NEET) is a seasonally impacted indicator increasing over the Summer months. In the month of June, it was 3.6%, worse than the target of 2.9% but broadly in line with the performance for the same time last year (3.7%). However Local Authorities are judged by the DfE on the 3‐month rolled figure (for December, January, and February) which in 2019/20 was 3.3%, below our target and in the fourth quintile (second from bottom) of all LAs.
AMBER: The percentage of Children Missing Education cases, closed within 30 school days, at 88.5% is just below the target of 90%. Despite the COVID pandemic and the limitations the team have experienced, they have managed to sustain the service, tracing high numbers of children and young people and returning them to education.
GREEN: Three primary aged pupils were permanently excluded from school during the last 12 months, fewer than the target (of 8). Exclusions from Kent schools remain lower than the national figure (reported as a rate of the school population).
GREEN: The number of permanent exclusions from secondary schools at six pupils is well below the target of 27. The reduction is related to the restriction of year groups returning to the school classroom following the Covid‐19 ‘National Lockdown 1.0’ school closures last year and the recent ‘National Lockdown 3.0’ school closures which resulted in 39 school days lost to all pupils with exception to 'key worker' and 'vulnerable' children from 5 January 2021 to 5 March 2021.
Education and Early Help targets have been reviewed as they were out of date. Many of the targets were set when new measures were introduced, without any trend or comparative data to support this process. Targets now take into account the national position, where this is available, and the year on year improvements seen to date, and seek to drive continuous improvement.
Management Information, CYPE, KCC Page 5
Children, Young People and Education Performance Management June 2021
Directorate Scorecard ‐ Kent KPIs ‐ Vulnerable Learners
Pola
rity
Data
Per
iod
QPR Latest Year
Target 2019-20 RAG DOT Target
2020-21
Benchmark Group
2019-20
England 2019-20
Linked to SDP?
2017-18 2018-19 2019-20 SN or SE
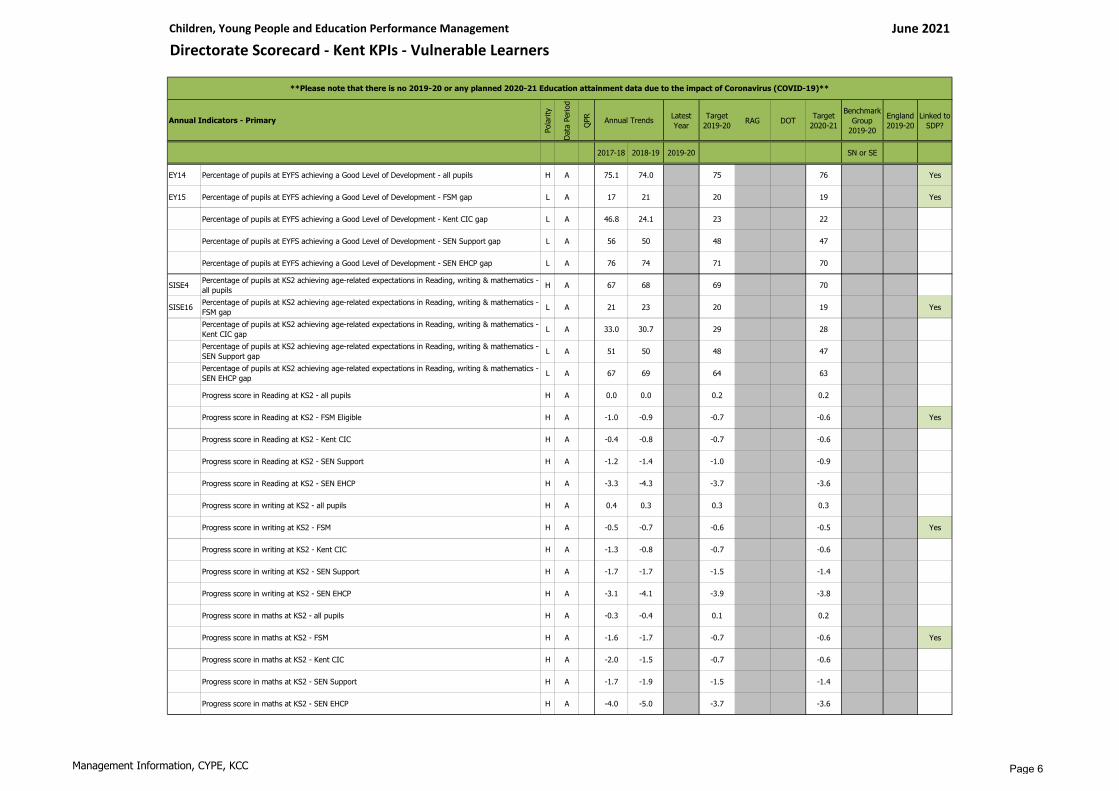
EY14 Percentage of pupils at EYFS achieving a Good Level of Development - all pupils H A 75.1 74.0 75 76 Yes
EY15 Percentage of pupils at EYFS achieving a Good Level of Development - FSM gap L A 17 21 20 19 Yes
Percentage of pupils at EYFS achieving a Good Level of Development - Kent CIC gap L A 46.8 24.1 23 22
Percentage of pupils at EYFS achieving a Good Level of Development - SEN Support gap L A 56 50 48 47
Percentage of pupils at EYFS achieving a Good Level of Development - SEN EHCP gap L A 76 74 71 70
SISE4 Percentage of pupils at KS2 achieving age-related expectations in Reading, writing & mathematics - all pupils H A 67 68 69 70
SISE16 Percentage of pupils at KS2 achieving age-related expectations in Reading, writing & mathematics - FSM gap L A 21 23 20 19 Yes
Percentage of pupils at KS2 achieving age-related expectations in Reading, writing & mathematics - Kent CIC gap L A 33.0 30.7 29 28
Percentage of pupils at KS2 achieving age-related expectations in Reading, writing & mathematics - SEN Support gap L A 51 50 48 47
Percentage of pupils at KS2 achieving age-related expectations in Reading, writing & mathematics - SEN EHCP gap L A 67 69 64 63
Progress score in Reading at KS2 - all pupils H A 0.0 0.0 0.2 0.2
Progress score in Reading at KS2 - FSM Eligible H A -1.0 -0.9 -0.7 -0.6 Yes
Progress score in Reading at KS2 - Kent CIC H A -0.4 -0.8 -0.7 -0.6
Progress score in Reading at KS2 - SEN Support H A -1.2 -1.4 -1.0 -0.9
Progress score in Reading at KS2 - SEN EHCP H A -3.3 -4.3 -3.7 -3.6
Progress score in writing at KS2 - all pupils H A 0.4 0.3 0.3 0.3
Progress score in writing at KS2 - FSM H A -0.5 -0.7 -0.6 -0.5 Yes
Progress score in writing at KS2 - Kent CIC H A -1.3 -0.8 -0.7 -0.6
Progress score in writing at KS2 - SEN Support H A -1.7 -1.7 -1.5 -1.4
Progress score in writing at KS2 - SEN EHCP H A -3.1 -4.1 -3.9 -3.8
Progress score in maths at KS2 - all pupils H A -0.3 -0.4 0.1 0.2
Progress score in maths at KS2 - FSM H A -1.6 -1.7 -0.7 -0.6 Yes
Progress score in maths at KS2 - Kent CIC H A -2.0 -1.5 -0.7 -0.6
Progress score in maths at KS2 - SEN Support H A -1.7 -1.9 -1.5 -1.4
Progress score in maths at KS2 - SEN EHCP H A -4.0 -5.0 -3.7 -3.6
**Please note that there is no 2019-20 or any planned 2020-21 Education attainment data due to the impact of Coronavirus (COVID-19)**
Annual Indicators - Primary Annual Trends
Management Information, CYPE, KCC Page 6

Children, Young People and Education Performance Management June 2021
Directorate Scorecard ‐ Kent KPIs ‐ Vulnerable Learners
Pola
rity
Data
Per
iod
QPR Latest Year
Target 2019-20 RAG DOT Target
2020-21
Benchmark Group
2018-19
England 2018-19
Linked to SDP?
2017-18 2018-19 2019-20 SE Region
SISE12 Average score at KS4 in Attainment 8 - all pupils H A 47.1 47.4 48.5 49.0 Yes
SISE19 Average score at KS4 in Attainment 8 - FSM gap L A 18.8 18.1 13.5 13.0 Yes
Average score at KS4 in Attainment 8 - Kent CIC gap L A 25.0 26.7 23.5 23.0
Average score at KS4 in Attainment 8 - SEN Support gap L A 16.2 15.8 14.5 14.0
Average score at KS4 in Attainment 8 - SEN EHCP gap L A 37.2 38.9 35.5 35.0
Average score at KS4 in Progress 8 - all pupils H A -0.08 -0.12 -0.01 0.00
Average score at KS4 in Progress 8 - FSM H A -0.81 -0.86 -0.40 -0.35 Yes
Average score at KS4 in Progress 8 - Kent CIC H A -0.91 -1.58 -0.70 -0.60
Average score at KS4 in Progress 8 - SEN Support H A -0.62 -0.68 -0.40 -0.35
Average score at KS4 in Progress 8 - SEN EHCP H A -1.20 -1.45 -1.00 -0.95
**Please note that there is no 2019-20 or any planned 2020-21 Education attainment data due to the impact of Coronavirus (COVID-19)**
Annual Indicators - Secondary Annual Trends
Management Information, CYPE, KCC Page 7

Children, Young People and Education Performance Management June 2021
Data Sources for Current Report
Code Indicator Source Description Latest data DescriptionLatest data release date
CYPE10 Number of Primary Schools MI School Census Database Summer 2021 School Census July 2021CYPE11 Number of Secondary Schools MI School Census Database Summer 2021 School Census July 2021CYPE12 Number of Special Schools MI School Census Database Summer 2021 School Census July 2021CYPE13 Total pupils on roll in Primary Schools MI School Census Database Summer 2021 School Census July 2021CYPE14 Total pupils on roll in Secondary Schools MI School Census Database Summer 2021 School Census July 2021CYPE15 Total pupils on roll in Special Schools MI School Census Database Summer 2021 School Census July 2021CYPE16 Percentage of Primary School pupils eligible for Free School Meals MI School Census Database Summer 2021 School Census July 2021CYPE17 Percentage of Secondary School pupils eligible for Free School Meals MI School Census Database Summer 2021 School Census July 2021CYPE18 Percentage of Special School pupils eligible for Free School Meals MI School Census Database Summer 2021 School Census July 2021EY8 Percentage of EY settings with Good or Outstanding Ofsted Judgements - Overall Effectiveness (non-domestic premises) MI Ofsted Database Inspections as at end of June 2021 July 2021SISE35 Percentage of Primary Schools with Good or Outstanding Ofsted Judgements - Overall Effectiveness MI Ofsted Database Inspections as at end of June 2021 July 2021SISE36 Percentage of Secondary Schools with Good or Outstanding Ofsted Judgements - Overall Effectiveness MI Ofsted Database Inspections as at end of June 2021 July 2021SISE37 Percentage of Special Schools with Good or Outstanding Ofsted Judgements - Overall Effectiveness MI Ofsted Database Inspections as at end of June 2021 July 2021CYPE19 Number of requests for SEND statutory assessment Synergy reporting Snapshot data as at end of June 2021 July 2021EH71-C Rate of notifications received into Early Help per 10,000 of the 0-17 population (inclusive, rolling 12 months) Early Help module Rolling 12 months up to end of June 2021 July 2021SCS02 Rate of referrals to Children's Social Work Services per 10,000 of the 0-17 population (inclusive, rolling 12 months) Liberi Rolling 12 months up to end of June 2021 July 2021FD01-C Number of contacts processed in the Front Door Early Help module Children referred during the month of June 2021 July 2021FD14-C Number of Information, Advice and Guidance contacts processed in the Front Door Early Help module Children referred during the month of June 2021 July 2021FD02-C Number of contacts processed in the Front Door which met the threshold for CSWS involvement Early Help module Children referred during the month of June 2021 July 2021FD03-C Number of contacts processed in the Front Door which proceeded to Early Help Early Help module Children referred during the month of June 2021 July 2021EH05-F Number of cases open to Early Help Units Early Help module Snapshot data as at end of June 2021 July 2021SCS01 Number of open Social Work cases Liberi Snapshot data as at end of June 2021 July 2021
Number of Child Protection cases Liberi Snapshot data as at end of June 2021 July 2021Number of Children in Care Liberi Snapshot data as at end of June 2021 July 2021Number of Care Leavers Liberi Snapshot data as at end of June 2021 July 2021
EH35 Number of First Time Entrants into the Youth Justice system MI monthly reporting (CareDirector Youth) Rolling 12 months up to June 2021 July 2021
SCS03 Percentage re-referrals to Children's Social Work Services within 12 months of a previous referral (R12M) Liberi Rolling 12 months up to June 2021 July 2021SCS08 Percentage of Returner Interviews completed for those with SCS Involvement Liberi Rolling 12 months up to June 2021 July 2021SCS13 Percentage of children becoming subject to a child protection plan for the second or subsequent time Liberi Rolling 12 months up to June 2021 July 2021SCS18 Children in Care in same placement for the last two years (for those in care for two and a half years or more) Liberi Snapshot as at June 2021 July 2021SCS19 Percentage of CIC Foster Care in KCC Foster Care/Rel & Friends placements (exc UASC) Liberi Snapshot as at June 2021 July 2021SCS29 Average number of days between becoming a child in care and moving in with an adoptive family Liberi Rolling 12 months up to June 2021 July 2021SCS34 Percentage of care leavers in education, employment or training (of those KCC is in touch with) Liberi Rolling 12 months up to June 2021 July 2021SCS37 Percentage of Case File Audits graded good or outstanding Liberi Rolling 12 months up to June 2021 July 2021SCS40 Percentage of case holding posts filled by permanent qualified social workers Area Staffing Spreadsheets Snapshot as at June 2021 July 2021SCS42 Average caseloads in the CIC Teams Liberi / Area Staffing Spreadsheets Snapshot as at June 2021 July 2021SCS43 Average caseloads in the CSWT Teams Liberi / Area Staffing Spreadsheets Snapshot as at June 2021 July 2021EH72-F Percentage of referrals to an Early Help Unit where a previous episode ended within 12 months Early Help module Snapshot as at June 2021 July 2021EH52-F Percentage of EH Assessments completed in the given month, within 6 weeks of allocation Early Help module Snapshot as at June 2021 July 2021
Percentage of EH Unit Case Audits rated good or outstanding Early Help module Snapshot as at June 2021 July 2021EH16-F Percentage of EH cases closed with outcomes achieved that come back to EH or CSWS in 3 mths Early Help module Snapshot as at June 2021 July 2021
Average Caseload within EH Units (Families) Early Help module Snapshot as at June 2021 July 2021CYPE8 Rate of proven re-offending by CYP MOJ quarterly reporting Data for Oct 2018 to Sep 2019 cohort July 2021
Activity-Volume Measures
Key Performance Indicators
Management Information, CYPE, KCC Page 8

Children, Young People and Education Performance Management June 2021
Data Sources for Current Report
Code Indicator Source Description Latest data DescriptionLatest data release date
SEND11 Percentage of Education, Health and Care Plans (EHCPs) issued within 20 weeks Synergy - monthly reported data Snapshot as at June 2021 July 2021SISE71 Percentage of Year 12-13 age-group (16-17 year olds) not in education, employment or training (NEET) Monthly submission to DfE via NCCIS for KCC Snapshot as at June 2021 July 2021CYPE1 Percentage of pupils being placed in independent or out-of-county special schools - Kent responsible EHCPs Synergy - monthly reported data Snapshot as at June 2021 July 2021EH43 Number of pupils permanently excluded from the primary phase - all Year R to Year 6 pupils Synergy - monthly reported data Rolling 12 months up to June 2021 July 2021EH44 Number of pupils permanently excluded from the secondary phase - all Year 7 to Year 14 pupils Synergy - monthly reported data Rolling 12 months up to June 2021 July 2021CYPE6 Percentage of Children Missing Education cases, closed within 30 school days Fair Access Team Synergy reporting Rolling 12 months up to June 2021 July 2021
CYPE22 Percentage of CYP registered to EHE who receive an offer of a visit within 10 school days of them being brought to our attention Fair Access Team Synergy reporting Rolling 12 months up to June 2021 July 2021
EY2 Percentage of DWP and other identified eligible 2 year olds taking up a free early education place FF2 Team in Early Years & Childcare Snapshot as at 23rd December 2019 Dec 2019EY14 Percentage of pupils at EYFS achieving a Good Level of Development End of year assessments based on EYFSP framework 2018-19 DfE published Oct 2019EY15 Percentage of pupils at EYFS achieving a Good Level of Development - FSM Eligible achievement gap End of year assessments based on EYFSP framework 2018-19 DfE published Nov 2019SISE4 Percentage of pupils at KS2 achieving age-related expectations in Reading, writing & mathematics Test/TA results for end of academic year 2018-19 DfE published (LA) MI Calcs (Distr) Dec 2019SISE16 Percentage of pupils at KS2 achieving age-related expectations in Reading, writing & mathematics - FSM gap Test/TA results for end of academic year 2018-19 DfE published (LA) MI Calcs (Distr) Dec 2019SISE12 Average score at KS4 in Attainment 8 Test results for end of academic year 2018-19 DfE published (LA) NPD Dataset (Distr) Feb 2020SISE19 Average score at KS4 in Attainment 8 - FSM gap Test results for end of academic year 2017-18 DfE published (LA), MI Calcs (Distr) Feb 2020CYPE23 Average point score per A Level entry at KS5 [School students only] Test results for end of academic year 2018-19 DfE published (LA) NPD Dataset (Distr) Jan 2020CYPE24 Average point score per Applied General entry at KS5 [School students only] Test results for end of academic year 2018-19 DfE published (LA) NPD Dataset (Distr) Jan 2020CYPE25 Average point score per Tech Level entry at KS5 [School students only] Test results for end of academic year 2018-19 DfE published (LA) NPD Dataset (Distr) Jan 2020SEND10 Percentage of pupils with a Statement or Education, Health and Care Plan (EHCP) - Kent resident pupils DfE annual snapshot based on school census Snapshot as at January 2020 July 2020CYPE2 Percentage of parents getting first preference of primary school Admissions school places offered for start of academic year Offers data for academic year 2020-21 April 2020CYPE3 Percentage of parents getting first preference of secondary school Admissions school places offered for start of academic year Offers data for academic year 2020-21 April 2020EH46 Percentage of pupils who are persistently absent from primary schools - all pupils based on 10% threshold Provisional data for academic year 2018-19 2018-19 MI Calculations Jan 2020EH47 Percentage of pupils who are persistently absent from secondary schools - all pupils based on 10% threshold Provisional data for academic year 2018-19 2018-19 MI Calculations Jan 2020
Key Performance Indicators (Continued)
Management Information, CYPE, KCC Page 9

Children, Young People and Education Performance Management
Indicator Definitions
Code Indicator Definition
CYPE10 Number of Primary Schools The number of Kent maintained Primary schools (excluding Nurseries) and Primary academies (including Free Schools). Total is as at the latest available termly school census.
CYPE11 Number of Secondary Schools The number of Kent maintained Secondary schools and Secondary academies (including Free Schools). Total is as at the latest available termly school census.
CYPE12 Number of Special Schools The number of Kent maintained Special schools and Special academies. Total is as at the latest available termly school census.
CYPE13 Total pupils on roll in Primary Schools The number of pupils on roll in Kent maintained Primary schools (excluding Nurseries) and Primary academies (including Free Schools). Total excludes guest and subsidiary pupils and is as at the latest available termly school census.
CYPE14 Total pupils on roll in Secondary Schools The number of pupils on roll in Kent maintained Secondary schools and Secondary academies (including Free Schools). Total excludes guest and subsidiary pupils and is as at the latest available termly school census.
CYPE15 Total pupils on roll in Special Schools The number of pupils on roll in Kent maintained Special schools and Special academies. Total excludes guest and subsidiary pupils and is as at the latest available termly school census.
CYPE16 Percentage of Primary School pupils eligible for Free School MealsThe number of pupils eligible for Free School Meals in Kent maintained Primary schools (excluding Nurseries) and Primary academies (including Free Schools) as a proportion of all pupils on roll. Totals for both numerator and denominator are for statutory aged pupils only and excludes guest and subsidiary pupils. Data is as at the latest available termly school census.
CYPE17 Percentage of Secondary School pupils eligible for Free School MealsThe number of pupils eligible for Free School Meals in Kent maintained Secondary schools and Secondary academies (including Free Schools) as a proportion of all pupils on roll. Totals for both numerator and denominator are for statutory aged pupils only and excludes guest and subsidiary pupils. Data is as at the latest available termly school census.
CYPE18 Percentage of Special School pupils eligible for Free School MealsThe number of pupils eligible for Free School Meals in Kent maintained Special schools and Special academies as a proportion of all pupils on roll. Totals for both numerator and denominator are for statutory aged pupils only and excludes guest and subsidiary pupils. Data is as at the latest available termly school census.
EY8 Percentage of EY settings with Good or Outstanding Ofsted Judgements - Overall Effectiveness (non-domestic premises)
The percentage of Kent Early Years settings (non-domestic premises only), judged good or outstanding for overall effectiveness in their latest inspection, as a proportion of all inspected Kent Early Years settings (non domestic premises only).
SISE35 Percentage of Primary Schools with Good or Outstanding Ofsted Judgements - Overall Effectiveness The percentage of Kent maintained Primary schools and Primary academies judged good or outstanding for Overall Effectiveness in their latest inspection, as a proportion of all inspected Kent maintained Primary schools and Primary academies.
SISE36 Percentage of Secondary Schools with Good or Outstanding Ofsted Judgements - Overall EffectivenessThe percentage of Kent maintained Secondary schools and Secondary academies judged good or outstanding for Overall Effectiveness in their latest inspection, as a proportion of all inspected Kent maintained Secondary schools and Secondary academies.
SISE37 Percentage of Special Schools with Good or Outstanding Ofsted Judgements - Overall Effectiveness The percentage of Kent maintained Special schools and Special academies judged good or outstanding for Overall Effectiveness in their latest inspection, as a proportion of all inspected Kent maintained Special schools and Special academies.
CYPE19 Number of requests for SEND statutory assessment The number of initial requests for assessment for Education, Health and Care Plans (EHCPs) for 0-25 year olds in Kent LA.
EH71-C Rate of notifications received into Early Help per 10,000 of the 0-17 population (inclusive, rolling 12 months) The total number of referrals to an Early Help Unit completed during the corresponding reporting month per 10,000 (Population figures are updated upon reciept of the latest ONS Mid Year population estimates). This is a child level indicator.
SCS02 Rate of referrals to Children's Social Work Services per 10,000 of the 0-17 population (inclusive, rolling 12 months)This indicator shows the rate of referrals received by Children's Social Work Services. Numerator: Number of referrals (rolling 12 month period). Denominator: child population figure divided by 10,000 (Population figures are updated upon receipt of the latest ONS Mid Year Estimates).
FD01-C Number of contacts processed in the Front DoorThe total number of notifications received during the corresponding reporting month that were processed by the Front Door. District and Area splits are not available for this indicator. The data includes all contact reasons processed by the Front Door. This is a child level indicator.
FD14-C Number of Information, Advice and Guidance contacts processed in the Front DoorThe total number of notifications with a contact outcome of "Information, Advice & Guidance" received during the corresponding reporting month that were processed by the Front Door. District and Area splits are not available for this indicator. The data includes all contact reasons processed by the Front Door. This is a child level indicator.
Activity-Volume Measures
Management Information, CYPE, KCC Page 10

Children, Young People and Education Performance Management
Indicator Definitions
Code Indicator Definition
FD02-C Number of contacts processed in the Front Door which met the threshold for CSWS involvementThe total number of notifications with a contact outcome of "Threshold met for CSWS" received during the corresponding reporting month that were processed by the Front Door. District and Area splits are not available for this indicator. The data includes all contact reasons processed by the Front Door. This is a child level indicator.
FD03-C Number of contacts processed in the Front Door which proceeded to Early HelpThe total number of notifications with a contact outcome of "Proceed to Early Help Unit" received during the corresponding reporting month that were processed by the Front Door. District and Area splits are not available for this indicator. The data includes all contact reasons processed by the Front Door. This is a child level indicator.
EH05-F Number of cases open to Early Help Units The number of open cases as at the end of the corresponding reporting month. The data includes all cases sent to units at Early Help Record stage prior to the end of the month. This is a family level indicator.
SCS01 Number of open Social Work cases The total caseload figures for Children's Social Work Services.
Number of Child Protection cases The number of Children who have a Child Protection Plan as at the end of the corresponding reporting month.
Number of Children in Care The number of Children in Care as at the end of the corresponding reporting month.
Number of Care Leavers The number of Care Leavers as at the end of the corresponding reporting month.
EH35 Number of First Time Entrants into the Youth Justice systemFirst time entrants are defined as young people (aged 10 – 17 years) who receive their first substantive outcome (relating to a Youth Caution with or without an intervention, or a Conditional Caution or a Court disposal for those who go directly to Court without a Youth Caution or Conditional Caution).
SCS03 Percentage re-referrals to Children's Social Work Services within 12 months of a previous referral (R12M) The percentage of referrals to SCS in the last 12 months where the previous referral date (if any) is within 12 months of the new referral date.
SCS08 Percentage of Returner Interviews completed for those with SCS Involvement The percentage of returner interviews completed in the last 12 months where the case was open to SCS at the point the child went missing and the child was aged under 18 at the point of going missing.
SCS13 Percenatge of children becoming subject to a child protection plan for the second or subsequent time The percentage of children who become subject to a Child Protection Plan during the last 12 months who have been subject to a previous plan.
SCS18 Children in Care in same placement for the last two years (for those in care for two and a half years or more)The percentage of Children in Care aged under 16 at the snapshot date who had been looked after continuously for at least 2.5 years who were living in the same placement for at least 2 years, or are placed for adoption and their adoptive placement together with their previous placement together last for at least 2 years.
SCS19 Percentage of CIC Foster Care in KCC Foster Care/Rel & Friends placements (exc UASC) The percentage of Kent Children in Care at the snapshot date who are in Foster Care and are placed with KCC Foster Carers or with Relatives and Friends. UASC are excluded
SCS29 Average number of days between becoming a child in care and moving in with an adoptive family The average number of days between becoming a Looked After Child and moving in with Adoptive Family (for children who have been Adopted in the last 12 months)
SCS34 Percentage of care leavers in education, employment or training (of those KCC is in touch with) The percentage of relevant and former relevant care leavers who we were in contact with in a 4 month window around their birthday who were aged 17, 18, 19, 20 or 21 and were in education, employment or training.
SCS37 Percentage of Case File Audits graded good or outstanding The percentage of all completed case audits in the last 12 months where the overall grading was good or outstanding
Key Performance Indicators
Activity-Volume Measures (Continued)
Management Information, CYPE, KCC Page 11
Children, Young People and Education Performance Management
Indicator Definitions
Code Indicator Definition
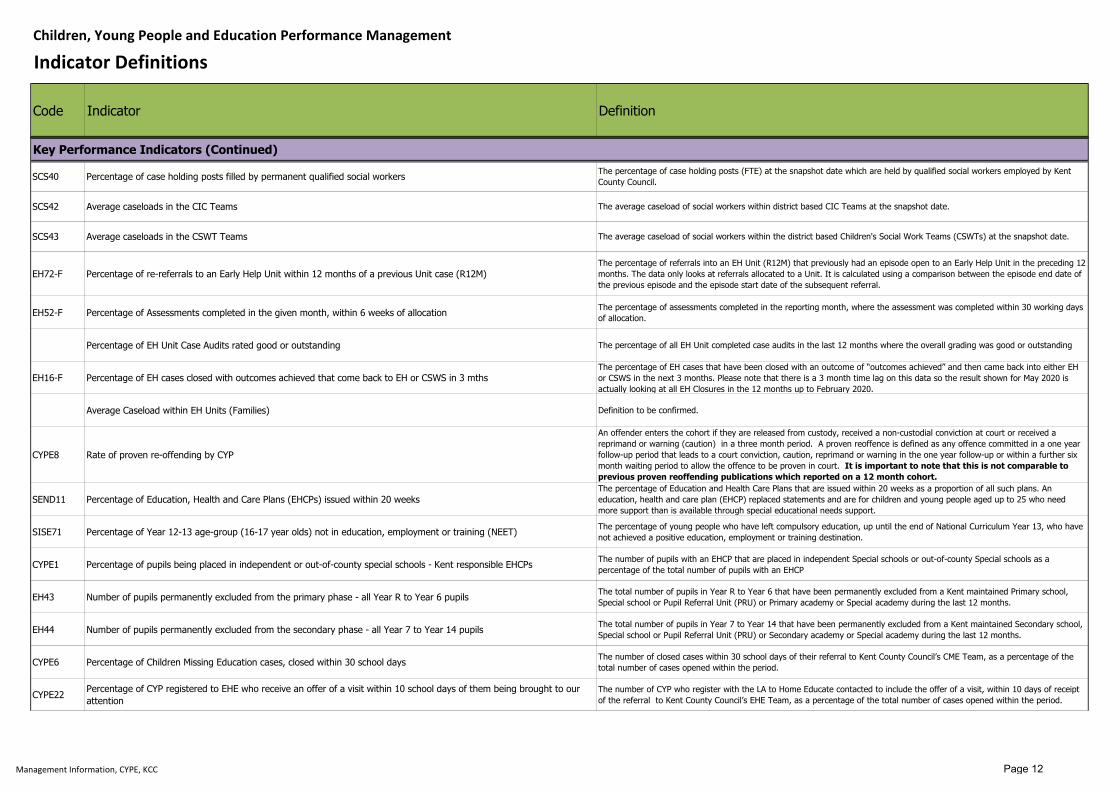
SCS40 Percentage of case holding posts filled by permanent qualified social workers The percentage of case holding posts (FTE) at the snapshot date which are held by qualified social workers employed by Kent County Council.
SCS42 Average caseloads in the CIC Teams The average caseload of social workers within district based CIC Teams at the snapshot date.
SCS43 Average caseloads in the CSWT Teams The average caseload of social workers within the district based Children's Social Work Teams (CSWTs) at the snapshot date.
EH72-F Percentage of re-referrals to an Early Help Unit within 12 months of a previous Unit case (R12M)The percentage of referrals into an EH Unit (R12M) that previously had an episode open to an Early Help Unit in the preceding 12 months. The data only looks at referrals allocated to a Unit. It is calculated using a comparison between the episode end date of the previous episode and the episode start date of the subsequent referral.
EH52-F Percentage of Assessments completed in the given month, within 6 weeks of allocation The percentage of assessments completed in the reporting month, where the assessment was completed within 30 working days of allocation.
Percentage of EH Unit Case Audits rated good or outstanding The percentage of all EH Unit completed case audits in the last 12 months where the overall grading was good or outstanding
EH16-F Percentage of EH cases closed with outcomes achieved that come back to EH or CSWS in 3 mthsThe percentage of EH cases that have been closed with an outcome of “outcomes achieved” and then came back into either EH or CSWS in the next 3 months. Please note that there is a 3 month time lag on this data so the result shown for May 2020 is actually looking at all EH Closures in the 12 months up to February 2020.
Average Caseload within EH Units (Families) Definition to be confirmed.
CYPE8 Rate of proven re-offending by CYP
An offender enters the cohort if they are released from custody, received a non-custodial conviction at court or received a reprimand or warning (caution) in a three month period. A proven reoffence is defined as any offence committed in a one year follow-up period that leads to a court conviction, caution, reprimand or warning in the one year follow-up or within a further six month waiting period to allow the offence to be proven in court. It is important to note that this is not comparable to previous proven reoffending publications which reported on a 12 month cohort.
SEND11 Percentage of Education, Health and Care Plans (EHCPs) issued within 20 weeksThe percentage of Education and Health Care Plans that are issued within 20 weeks as a proportion of all such plans. An education, health and care plan (EHCP) replaced statements and are for children and young people aged up to 25 who need more support than is available through special educational needs support.
SISE71 Percentage of Year 12-13 age-group (16-17 year olds) not in education, employment or training (NEET) The percentage of young people who have left compulsory education, up until the end of National Curriculum Year 13, who have not achieved a positive education, employment or training destination.
CYPE1 Percentage of pupils being placed in independent or out-of-county special schools - Kent responsible EHCPs The number of pupils with an EHCP that are placed in independent Special schools or out-of-county Special schools as a percentage of the total number of pupils with an EHCP
EH43 Number of pupils permanently excluded from the primary phase - all Year R to Year 6 pupils The total number of pupils in Year R to Year 6 that have been permanently excluded from a Kent maintained Primary school, Special school or Pupil Referral Unit (PRU) or Primary academy or Special academy during the last 12 months.
EH44 Number of pupils permanently excluded from the secondary phase - all Year 7 to Year 14 pupils The total number of pupils in Year 7 to Year 14 that have been permanently excluded from a Kent maintained Secondary school, Special school or Pupil Referral Unit (PRU) or Secondary academy or Special academy during the last 12 months.
CYPE6 Percentage of Children Missing Education cases, closed within 30 school days The number of closed cases within 30 school days of their referral to Kent County Council’s CME Team, as a percentage of the total number of cases opened within the period.
CYPE22 Percentage of CYP registered to EHE who receive an offer of a visit within 10 school days of them being brought to our attention
The number of CYP who register with the LA to Home Educate contacted to include the offer of a visit, within 10 days of receipt of the referral to Kent County Council’s EHE Team, as a percentage of the total number of cases opened within the period.
Key Performance Indicators (Continued)
Management Information, CYPE, KCC Page 12

Children, Young People and Education Performance Management
Indicator Definitions
Code Indicator Definition
EY2 Percentage of DWP and other identified eligible 2 year olds taking up a free early education place The number of two year old children accessing a free early education place at an early years provider as a proportion of the total number of families identified as potentially eligible for funding by the Department for Work and Pensions (DWP).
EY14 Percentage of pupils at EYFS achieving a Good Level of Development Percentage of pupils assessed as achieving Expected or Exceeding in all Prime Learning Goals and all literacy and mathematics Early Learning Goals at the end of reception year, based on the Early Years Foundation Stage framework.
EY15 Percentage of pupils at EYFS achieving a Good Level of Development - FSM Eligible achievement gapThe difference between the achievement of non-FSM eligible pupils and FSM eligible pupils in terms of percentage assessed as achieving Expected or Exceeding in all Prime Learning Goals and all literacy and mathematics Early Learning Goals at the end of reception year, based on the Early Years Foundation Stage framework.
SISE4 Percentage of pupils at KS2 achieving age-related expectations in Reading, writing & mathematics The percentage of pupils at the end of Key Stage 2 working at the Expected Standard in all of Reading, Writing & maths. Includes Kent maintained schools and academies.
SISE16 Percentage of pupils at KS2 achieving age-related expectations in Reading, writing & mathematics - FSM gap The difference between the achievement of non-FSM eligible pupils and FSM eligible pupils in terms of percentage working at the Expected Standard in all of Reading, Writing & maths at KS2. Includes Kent maintained schools and academies.
SISE12 Average score at KS4 in Attainment 8The average Attainment 8 score for pupils at end of Key Stage 4. Attainment 8 is a point score based on attainment across eight subjects which must include English; mathematics; three other English Baccalaureate (EBacc) subjects (sciences, computer science, geography, history and languages); and three further subjects, which can be from the range of EBacc subjects, or can be any other approved, high-value arts, academic, or vocational qualification.
SISE19 Average score at KS4 in Attainment 8 - FSM gap The difference between the Attainment 8 score of non-FSM eligible pupils and FSM eligible pupils at the end of KS4 (see above definition for SISE12a). Includes Kent maintained schools and academies.
CYPE23 Average point score per A Level entry at KS5 [School students only] The total number of points achieved in A-Level qualifications by pupils at the end of Key Stage 5 divided by the total number of entries made in all A-Level qualifications. Outcomes are for Kent maintained schools and academies only.
CYPE24 Average point score per Applied General entry at KS5 [School students only] The total number of points achieved in Applied General qualifications by pupils at the end of Key Stage 5 divided by the total number of entries made in all Applied General qualifications. Outcomes are for Kent maintained schools and academies only.
CYPE25 Average point score per Tech Level entry at KS5 [School students only] The total number of points achieved in Tech Level qualifications by pupils at the end of Key Stage 5 divided by the total number of entries made in all Tech Level qualifications. Outcomes are for Kent maintained schools and academies only.
SEND10 Percentage of pupils with a Statement or Education, Health and Care Plan (EHCP) - Kent resident pupilsPercentage of pupils with a statement of Special Educational Needs or an Education, Health and care Plan (EHCP) as a proportion of all pupils on roll in all schools as at January school census. Includes maintained schools and academies, Pupil Referral Units, Free schools and Independent schools (DfE published data).
CYPE2 Percentage of parents getting first preference of primary school The percentage of parents who got their first preference of Primary school (out of their three ordered preferences) for their child.
CYPE3 Percentage of parents getting first preference of secondary school The percentage of parents who got their first preference of Secondary school (out of their three ordered preferences) for their child.
EH46 Percentage of pupils who are persistently absent from primary schools - all pupils based on 10% threshold The percentage of pupils that have been persistently absent from a Kent maintained Primary school or a Primary academy for 10% or more of their expected sessions over the reported time period.
EH47 Percentage of pupils who are persistently absent from secondary schools - all pupils based on 10% threshold The percentage of pupils that have been persistently absent from a Kent maintained Secondary school or a Secondary academy for 10% or more of their expected sessions over the reported time period.
Key Performance Indicators (Continued)
Management Information, CYPE, KCC Page 13