yenisey foldbelt riphean-craton margin riphean, assessment ... · 12070101 yenisey foldbelt...
TRANSCRIPT

Undiscovered Resources Largest Undiscovered Field
MFS Prob. Oil (MMBO)
(0-1) F95 F50 F5 Mean F95 F50 F5 Mean F95 F50 F5 Mean F95 F50 F5 Mean
Oil Fields 5 147 1,007 2,979 1,213 695 4,864 15,456 6,054 40 282 958 362 52 264 1,116 374
Gas Fields 30 1,109 9,284 26,350 10,929 49 407 1,232 492 381 2,039 7,569 2,709
Total 1.00 147 1,007 2,979 1,213 1,804 14,147 41,806 16,983 88 689 2,190 854
1.00
Yenisey Foldbelt Riphean-Craton Margin Riphean, Assessment Unit 12070101Assessment Results Summary
[MMBO, million barrels of oil. BCFG, billion cubic feet of gas. MMBNGL, million barrels of natural gas liquids. MFS, minimum field size assessed (MMBO or BCFG). Prob., probability (including both geologic and accessibility probabilities) of at least one field equal to or greater than the MFS. Results shown are fully risked estimates. For gas fields, all liquids are included under the NGL (natural gas liquids) category. F95 represents a 95 percent chance of at least the amount tabulated. Other fractiles are defined similarly. Fractiles are additive under the assumption of perfect
positive correlation. Shading indicates not applicable]
Field Type Gas (BCFG) NGL (MMBNGL) (MMBO or BCFG)

12070101Yenisey Foldbelt Riphean-Craton Margin Riphean
Monte Carlo Results
Forecast: Oil in Oil Fields
Summary:Display range is from 0.00 to 4,000.00 MMBOEntire range is from 21.70 to 6,995.51 MMBOAfter 50,000 trials, the standard error of the mean is 4.07
Statistics: ValueTrials 50000Mean 1,212.65Median 1,006.53Mode ---Standard Deviation 909.85Variance 827,818.09Skewness 1.12Kurtosis 4.36Coefficient of Variability 0.75Range Minimum 21.70Range Maximum 6,995.51Range Width 6,973.82Mean Standard Error 4.07
Frequency Chart
MMBO
.000
.006
.012
.018
.024
0
301
602
903
1204
0.00 1,000.00 2,000.00 3,000.00 4,000.00
50,000 Trials 471 Outliers
Forecast: Oil in Oil Fields
Page 1

12070101Yenisey Foldbelt Riphean-Craton Margin Riphean
Monte Carlo Results
Forecast: Oil in Oil Fields (cont'd)
Percentiles:
Percentile MMBO100% 21.70
95% 146.9690% 231.2285% 316.2980% 403.1275% 495.0770% 586.9165% 681.7760% 782.6955% 892.3350% 1,006.5345% 1,129.4540% 1,258.7635% 1,402.3830% 1,557.8325% 1,729.2020% 1,922.8215% 2,162.8710% 2,481.60
5% 2,978.840% 6,995.51
End of Forecast
Page 2

12070101Yenisey Foldbelt Riphean-Craton Margin Riphean
Monte Carlo Results
Forecast: Gas in Oil Fields
Summary:Display range is from 0.00 to 20,000.00 BCFGEntire range is from 81.88 to 46,006.11 BCFGAfter 50,000 trials, the standard error of the mean is 21.41
Statistics: ValueTrials 50000Mean 6,053.69Median 4,863.73Mode ---Standard Deviation 4,786.58Variance 22,911,394.72Skewness 1.33Kurtosis 5.20Coefficient of Variability 0.79Range Minimum 81.88Range Maximum 46,006.11Range Width 45,924.23Mean Standard Error 21.41
Frequency Chart
BCFG
.000
.006
.013
.019
.025
0
313.7
627.5
941.2
1255
0.00 5,000.00 10,000.00 15,000.00 20,000.00
50,000 Trials 766 Outliers
Forecast: Gas in Oil Fields
Page 3

12070101Yenisey Foldbelt Riphean-Craton Margin Riphean
Monte Carlo Results
Forecast: Gas in Oil Fields (cont'd)
Percentiles:
Percentile BCFG100% 81.88
95% 695.4390% 1,109.6185% 1,512.1080% 1,934.9075% 2,376.1270% 2,819.9465% 3,277.0760% 3,771.9155% 4,287.7150% 4,863.7345% 5,465.1740% 6,143.7735% 6,851.2030% 7,651.5925% 8,552.1520% 9,592.1615% 10,854.8310% 12,574.54
5% 15,455.890% 46,006.11
End of Forecast
Page 4

12070101Yenisey Foldbelt Riphean-Craton Margin Riphean
Monte Carlo Results
Forecast: NGL in Oil Fields
Summary:Display range is from 0.00 to 1,200.00 MMBNGLEntire range is from 3.92 to 2,830.98 MMBNGLAfter 50,000 trials, the standard error of the mean is 1.35
Statistics: ValueTrials 50000Mean 362.38Median 282.27Mode ---Standard Deviation 301.49Variance 90,898.55Skewness 1.55Kurtosis 6.36Coefficient of Variability 0.83Range Minimum 3.92Range Maximum 2,830.98Range Width 2,827.06Mean Standard Error 1.35
Frequency Chart
MMBNGL
.000
.007
.013
.020
.026
0
327.5
655
982.5
1310
0.00 300.00 600.00 900.00 1,200.00
50,000 Trials 1,020 Outliers
Forecast: NGL in Oil Fields
Page 5

12070101Yenisey Foldbelt Riphean-Craton Margin Riphean
Monte Carlo Results
Forecast: NGL in Oil Fields (cont'd)
Percentiles:
Percentile MMBNGL100% 3.92
95% 39.7790% 63.3085% 86.8380% 111.4575% 136.5170% 163.4865% 190.2660% 218.0755% 249.8350% 282.2745% 317.7640% 357.1235% 400.1230% 448.9425% 505.5220% 572.6315% 654.5510% 766.06
5% 957.900% 2,830.98
End of Forecast
Page 6
12070101Yenisey Foldbelt Riphean-Craton Margin Riphean
Monte Carlo Results
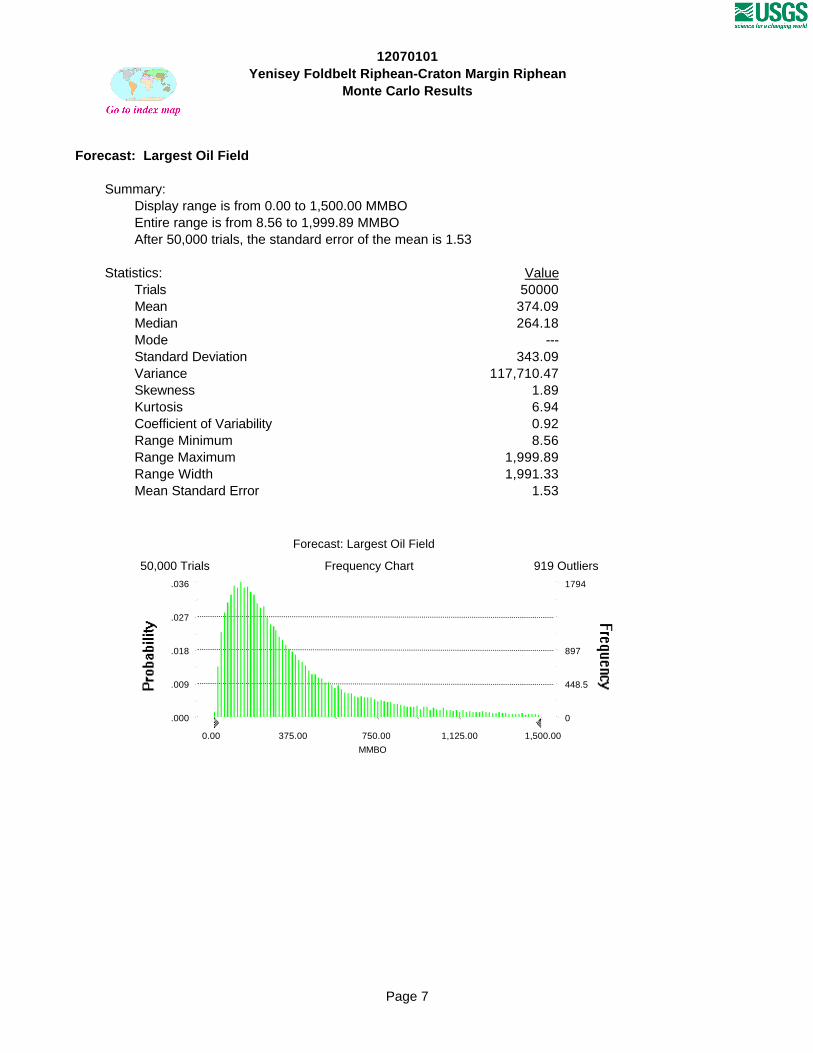
Forecast: Largest Oil Field
Summary:Display range is from 0.00 to 1,500.00 MMBOEntire range is from 8.56 to 1,999.89 MMBOAfter 50,000 trials, the standard error of the mean is 1.53
Statistics: ValueTrials 50000Mean 374.09Median 264.18Mode ---Standard Deviation 343.09Variance 117,710.47Skewness 1.89Kurtosis 6.94Coefficient of Variability 0.92Range Minimum 8.56Range Maximum 1,999.89Range Width 1,991.33Mean Standard Error 1.53
Frequency Chart
MMBO
.000
.009
.018
.027
.036
0
448.5
897
1794
0.00 375.00 750.00 1,125.00 1,500.00
50,000 Trials 919 Outliers
Forecast: Largest Oil Field
Page 7

12070101Yenisey Foldbelt Riphean-Craton Margin Riphean
Monte Carlo Results
Forecast: Largest Oil Field (cont'd)
Percentiles:
Percentile MMBO100% 8.56
95% 51.9090% 76.9485% 99.2180% 120.7675% 142.1170% 163.6465% 185.9960% 210.4155% 236.2250% 264.1845% 295.5840% 330.9335% 372.0230% 419.4625% 480.3720% 559.4515% 669.6210% 824.62
5% 1,115.980% 1,999.89
End of Forecast
Page 8
12070101Yenisey Foldbelt Riphean-Craton Margin Riphean
Monte Carlo Results
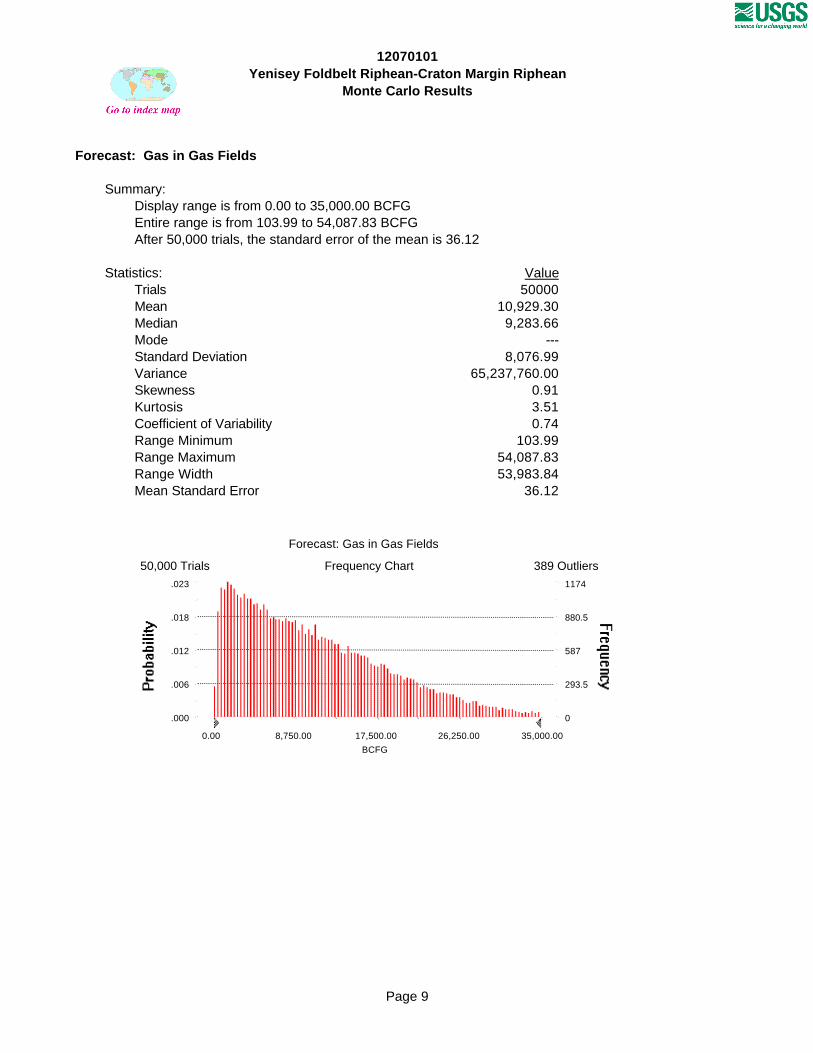
Forecast: Gas in Gas Fields
Summary:Display range is from 0.00 to 35,000.00 BCFGEntire range is from 103.99 to 54,087.83 BCFGAfter 50,000 trials, the standard error of the mean is 36.12
Statistics: ValueTrials 50000Mean 10,929.30Median 9,283.66Mode ---Standard Deviation 8,076.99Variance 65,237,760.00Skewness 0.91Kurtosis 3.51Coefficient of Variability 0.74Range Minimum 103.99Range Maximum 54,087.83Range Width 53,983.84Mean Standard Error 36.12
Frequency Chart
BCFG
.000
.006
.012
.018
.023
0
293.5
587
880.5
1174
0.00 8,750.00 17,500.00 26,250.00 35,000.00
50,000 Trials 389 Outliers
Forecast: Gas in Gas Fields
Page 9

12070101Yenisey Foldbelt Riphean-Craton Margin Riphean
Monte Carlo Results
Forecast: Gas in Gas Fields (cont'd)
Percentiles:
Percentile BCFG100% 103.99
95% 1,108.6990% 1,865.4185% 2,654.5480% 3,483.0175% 4,321.1270% 5,235.8665% 6,165.9160% 7,185.5055% 8,237.1450% 9,283.6645% 10,430.9840% 11,615.8935% 12,901.7530% 14,352.6525% 15,882.8520% 17,667.7715% 19,764.5310% 22,418.78
5% 26,349.980% 54,087.83
End of Forecast
Page 10

12070101Yenisey Foldbelt Riphean-Craton Margin Riphean
Monte Carlo Results
Forecast: NGL in Gas Fields
Summary:Display range is from 0.00 to 1,500.00 MMBNGLEntire range is from 4.35 to 2,845.95 MMBNGLAfter 50,000 trials, the standard error of the mean is 1.70
Statistics: ValueTrials 50000Mean 491.62Median 406.56Mode ---Standard Deviation 380.28Variance 144,615.31Skewness 1.11Kurtosis 4.27Coefficient of Variability 0.77Range Minimum 4.35Range Maximum 2,845.95Range Width 2,841.60Mean Standard Error 1.70
Frequency Chart
MMBNGL
.000
.006
.012
.017
.023
0
287.7
575.5
863.2
1151
0.00 375.00 750.00 1,125.00 1,500.00
50,000 Trials 901 Outliers
Forecast: NGL in Gas Fields
Page 11

12070101Yenisey Foldbelt Riphean-Craton Margin Riphean
Monte Carlo Results
Forecast: NGL in Gas Fields (cont'd)
Percentiles:
Percentile MMBNGL100% 4.35
95% 48.6390% 81.5485% 115.8680% 151.1275% 188.1970% 227.4065% 269.3260% 313.0655% 359.3250% 406.5645% 458.1340% 512.5035% 570.7230% 633.3925% 706.0920% 789.0315% 890.1710% 1,023.88
5% 1,231.820% 2,845.95
End of Forecast
Page 12

12070101Yenisey Foldbelt Riphean-Craton Margin Riphean
Monte Carlo Results
Forecast: Largest Gas Field
Summary:Display range is from 0.00 to 9,000.00 BCFGEntire range is from 36.77 to 11,998.48 BCFGAfter 50,000 trials, the standard error of the mean is 10.09
Statistics: ValueTrials 50000Mean 2,709.32Median 2,039.17Mode ---Standard Deviation 2,256.05Variance 5,089,758.61Skewness 1.55Kurtosis 5.40Coefficient of Variability 0.83Range Minimum 36.77Range Maximum 11,998.48Range Width 11,961.71Mean Standard Error 10.09
Frequency Chart
BCFG
.000
.007
.013
.020
.027
0
336.5
673
1346
0.00 2,250.00 4,500.00 6,750.00 9,000.00
50,000 Trials 1,323 Outliers
Forecast: Largest Gas Field
Page 13

12070101Yenisey Foldbelt Riphean-Craton Margin Riphean
Monte Carlo Results
Forecast: Largest Gas Field (cont'd)
Percentiles:
Percentile BCFG100% 36.77
95% 380.8090% 583.4885% 761.1680% 932.0775% 1,101.8570% 1,271.0765% 1,448.5660% 1,637.5655% 1,832.9450% 2,039.1745% 2,270.4140% 2,531.0535% 2,817.0730% 3,163.7725% 3,590.6120% 4,132.6015% 4,839.8610% 5,853.49
5% 7,569.200% 11,998.48
End of Forecast
Page 14

12070101Yenisey Foldbelt Riphean-Craton Margin Riphean
Monte Carlo Results
Assumptions
Assumption: Number of Oil Fields
Triangular distribution with parameters:Minimum 3Likeliest 4Maximum 60
Selected range is from 3 to 60Mean value in simulation was 22
Assumption: Sizes of Oil Fields
Lognormal distribution with parameters: Shifted parametersMean 52.48 57.48Standard Deviation 175.95 175.95
Selected range is from 0.00 to 1,995.00 5.00 to 2,000.00Mean value in simulation was 49.29 54.29
3 17 32 46 60
Number of Oil Fields
Page 15

12070101Yenisey Foldbelt Riphean-Craton Margin Riphean
Monte Carlo Results
Assumption: Sizes of Oil Fields (cont'd)
Assumption: GOR in Oil Fields
Triangular distribution with parameters:Minimum 2,500.00Likeliest 5,000.00Maximum 7,500.00
Selected range is from 2,500.00 to 7,500.00Mean value in simulation was 4,993.97
0.13 432.63 865.14 1,297.64 1,730.15
Sizes of Oil Fields
2,500.00 3,750.00 5,000.00 6,250.00 7,500.00
GOR in Oil Fields
Page 16

12070101Yenisey Foldbelt Riphean-Craton Margin Riphean
Monte Carlo Results
Assumption: LGR in Oil Fields
Triangular distribution with parameters:Minimum 30.00Likeliest 60.00Maximum 90.00
Selected range is from 30.00 to 90.00Mean value in simulation was 59.90
Assumption: Number of Gas Fields
Triangular distribution with parameters:Minimum 3Likeliest 3Maximum 95
Selected range is from 3 to 95Mean value in simulation was 34
30.00 45.00 60.00 75.00 90.00
LGR in Oil Fields
Page 17

12070101Yenisey Foldbelt Riphean-Craton Margin Riphean
Monte Carlo Results
Assumption: Number of Gas Fields (cont'd)
Assumption: Sizes of Gas Fields
Lognormal distribution with parameters: Shifted parametersMean 314.88 344.88Standard Deviation 1,055.68 1,055.68
Selected range is from 0.00 to 11,970.00 30.00 to 12,000.00Mean value in simulation was 290.59 320.59
3 26 49 72 95
Number of Gas Fields
0.78 2,595.81 5,190.83 7,785.86 10,380.89
Sizes of Gas Fields
Page 18

12070101Yenisey Foldbelt Riphean-Craton Margin Riphean
Monte Carlo Results
Assumption: LGR in Gas Fields
Triangular distribution with parameters:Minimum 25.00Likeliest 45.00Maximum 65.00
Selected range is from 25.00 to 65.00Mean value in simulation was 44.97
End of Assumptions
Simulation started on 4/26/99 at 12:44:26Simulation stopped on 4/26/99 at 13:26:51
25.00 35.00 45.00 55.00 65.00
LGR in Gas Fields
Page 19