yeast alcohol dehydrogenase: … alcohol dehydrogenase: molecular weight, coenzyme binding, and...
TRANSCRIPT

YEAST ALCOHOL DEHYDROGENASE: MOLECULAR WEIGHT, COENZYME BINDING, AND REACTION EQUILIBRIA*
BY JOSEPH E. HAYES, JR.,t AND SIDNEY F. VELICK
(From the Department of Biological Chemistry, Washington University School of Medicine, St. Louis, Missouri)
,(Received for publication, July 10, 1953)
The alcohol dehydrogenases (ADH) crystallized from yeast (1, 2) and from horse liver (3) differ in many of their properties. The mammalian enzyme forms a complex with reduced diphosphopyridine nucleotide in which the absorption band of the coenzyme at 340 rnp is shifted to 325 rnh (4). This permitted the direct study by Theorell and Chance (5) of the stoichiometry and dissociation constant of the complex and the kinetics of its formation. The oxidized form of the coenzyme (DPN) did not form a spectrophotometrically identifiable complex with the protein.
The molecular weight of the yeast enzyme is about twice that of the mammalian ADH and it is about 100 times more active. Neither DPN nor DPNH exhibits gross spectral shifts in the presence of the yeast en- zyme. In order to study the coenzyme interactions of yeast ADH we have used the ultracentrifugal separation method which we had employed in previous studies with glyceraldehyde-3-phosphate dehydrogenases of rabbit muscle (6) and yeast (7). It was possible to detect complexes of yeast ADH with both DPN and DPNH and to measure their stoichiometry and apparent dissociation constants. The binding of DPN and DPNH by the yeast enzyme is competitive and the dissociation constants are in general agreement with the values derived from over-all reaction kinetics and competitive inhibition. There are still relatively few instances in which such correlations have been attempted and in two cases the reported Michaelis constant has been found to differ from the dissociation constant by more than two powers of 10 (5, 6). At high concentrations of yeast ADH the equilibrium of the oxidation reaction is shifted. The direction and magnitude of the shift may be accounted for by the formation of enzyme complexes with DPN, DPNH, and acetaldehyde.
Methods
The enzyme was prepared from dried bakers’ yeast (Anheuser-Busch strain SCC) by the method of Racker (2). It was found that the homo-
* This work was aided by a grant from the American Cancer Society on the recom- mendation of the Committee on Growth of the National Research Council.
t Predoctoral Fellow of the National Cancer Institute of the United States Public Health Service. From the dissertation submitted by Joseph E. Hayes, Jr., in par-
225
by guest on May 31, 2018
http://ww
w.jbc.org/
Dow
nloaded from

226 YEAST ALCOHOL DEHYDROGENASE
geneity of the product was improved if the crystallization procedure was modified. Instead of raising the ammonium sulfate concentration from 0.35 to 0.G saturation over a period of 2 hours in order to obtain the first crystals, the first crystals were allowed to form in 0.35 saturated ammo- nium sulfate at 0” over a period of 10 hours. The crystals from 300 gm. of dried yeast were dissolved in 10 ml. of water and recrystallized by addi- tion of an amount of saturated ammonium sulfate calculated to make the solution 0.35 saturated. After 8 to 10 hours the recrystallization step was repeated with yields of 130 to 300 mg. of enzyme per 300 gm. of dried yeast.
The DPN was assayed spectrophotometrically as DPNH after reduc- tion with ethanol and ADH at pH 7.9 in the presence of 0.1 M semicarbazide and also after reduction with glyceraldehyde-3-phosphate and arsenate in the presence of glyceraldehyde-3-phosphate dehydrogenase. Standard solutions of ethanol were made by dilution of a concentrated stock solution prepared from absolute ethanol. Semicarbazide hydrochloride was puri- fied through the acetone derivative (8).
Electrophoretic mobility measurements were carried out in the Tiselius apparatus (9) by the scanning method of Longsworth (10) for recording the positions and shapes of the concentration gradients. All buffers were of ionic strengt>h 0.1. The dialyses were originally carried out for 20 hours with external stirring only. Afterit was found that irreversible changes occurred during dialysis, all dialyses were carried out in an apparatus designed for rapid attainment of equilibrium with stirring inside the di- alysis sac for 4 hours.
Sedimentation velocity measurements were carried out in the Spinco model E refrigerated ultracentrifuge. The temperature of the rotor was measured at the beginning and at the end of each run. Diffusion measure- ments were made in the long center cell of the Tiselius apparatus and the coefficients were calculated by the maximal ordinate method (11). Partial specific volumes were measured in density gradient tubes of the type de- scribed by Jacobsen and Linderstrom-Lang (12).
The ultracentrifugal separation method used in the study of coenzyme binding has been described (6). Ultracentrifugation for 2 hours at 214,000 X g served to separate the protein and its complexes from the free enzyme. Analyses for DPN in arbitrary “layers” of the ultracentrifuged solutions were made by enzymatic reduction with ADH and ethanol. Analyses for DPNH were made by direct measurement of its absorption band at 340 mp. Contrary to the findings of Burton and Wilson (13), DPN was stable in the presence of high concentrations of yeast ADH. The DPNH,
tial fulfilment of the requirements for the degree of Doctor of Philosophy, Wash- ington University, June, 1953.
by guest on May 31, 2018
http://ww
w.jbc.org/
Dow
nloaded from

J. E. HAYES, JR., AND S. F. VELICK 227
however, without added substrate, underwent two slow reactions in the presence of high concentrations of enzyme. One was a slow oxidation and the other was an irreversible change resulting in the disappearance of the absorption band at 340 rnp. Both of these reactions were completely inhibited by 0.01 M semicarbazide. The binding measurements were therefore carried out in solvents which contained 0.01 M semicarbazide, which was also present in solutions used for kinetic measurements. Con- trol experiments showed that the semicarbazide did not affect the initial rates of reduction of DPN by ethanol.
The kinetics of the reaction
(1) CHpCHzOH + DPN ADH
___f CH&HO + DPNH + H+
were studied by following the rate of appearance of the absorption band of DPNH at 340 rnp. The reaction mixtures were made up immediately before use from fresh stock solutions and the reaction was initiated by the addition of enzyme at zero time. The initial rates were calculated from the changes in optical density that occurred during the first 20 second in- terval. The rates in all but the two lowest DPN concentrations studied remained constant through the 40 second reading. The dilute stock en- zyme solutions contained 10 y of enzyme per ml. and 0.1 per cent bovine serum albumin as a protecting colloid. Even when kept in an ice bath, such solutions lost up to 15 per cent of their activity in an hour. In measuring reaction rates at a series of concentrations of a substrate the first activity measurements were repeated at the end of the series in order to determine the activity loss. The results in each case were corrected to a standard enzyme activity on the assumption that the activity loss was linear with time.
Results
Electrophoretic Anal@-Between pH 5 and 8.3 electrophoretic dia- grams of the enzyme preparations showed two peaks. The relative amounts of the two components, from area analysis, did not change sys- tematically with recrystallization. The mobilities of the two components and their approximate isoelectric points in 0.1 ionic strength acetate buffer are shown in Table I. A sample of the component which migrated more rapidly at pH 5, isolated in a separation cell after 540 minutes of electro- phoresis, was found to be totally inactive, while the more slowly migrating component showed high activity. An examination of the variables re- vealed that the amount of inactive component, was a function of the age of the solution and the duration of the preliminary dialysis. Preparations which had been kept in solution for several days showed up to 60 per cent of the inactive second component. Fresh preparations dialyzed for 16 to
by guest on May 31, 2018
http://ww
w.jbc.org/
Dow
nloaded from
228 YEAST ALCOHOL DEHYDROGENASE
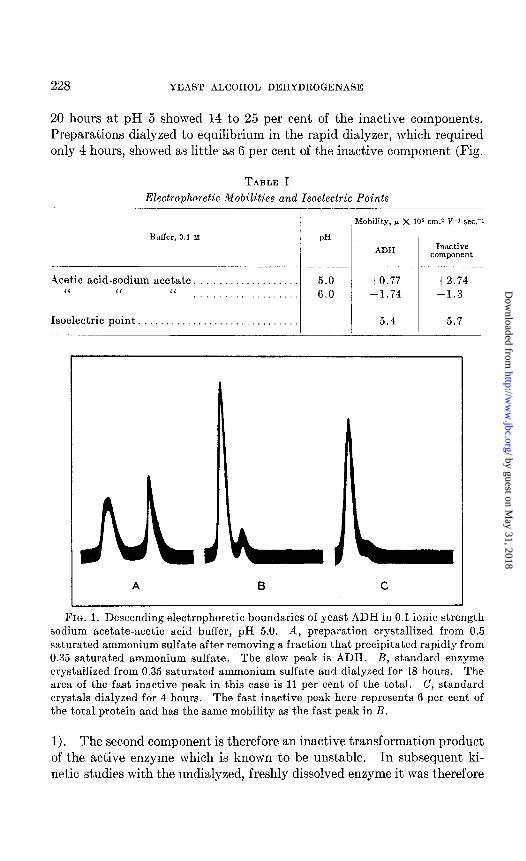
20 hours at pH 5 showed 14 to 25 per cent of the inactive components. Preparations dialyzed to equilibrium in the rapid dialyzer, which required only 4 hours, showed as little as 6 per cent of the inactive component (Fig.
TABLE I
Electrophoretic Mobilities and Isoelectric Points
Buffer, 0.1 Y PH
Bcetic acid-sodium acetate. “ “ “
Isoelectric point. .
5.0 / 6.0
Mobility, p X 105 cm.2 V-1 sec.-1
ADH Inactive component
+0.77 $2.74 -1.74 -1.3
5.4 5.7
I ALL
A B C
FIG. 1. Descending electrophoretic boundaries of yeast ADH in 0.1 ionic strength sodium acetate-acetic acid buffer, pH 5.0. A, preparation crystallized from 0.5 saturated ammonium sulfate after removing a fraction that precipitated rapidly from 0.35 saturated ammonium sulfate. The slow peak is ADH. B, standard enzyme crystallized from 0.35 saturated ammonium sulfate and dialyzed for 18 hours. The area of the fast inactive peak in this case is 11 per cent of the total. C, standard crystals dialyzed for 4 hours. The fast inactive peak here represents 6 per cent of the total protein and has the same mobility as the fast peak in R.
1). The second component is therefore an inactive transformation product of the active enzyme which is known to be unstable. In subsequent ki- netic studies with the undialyzed, freshly dissolved enzyme it was therefore
by guest on May 31, 2018
http://ww
w.jbc.org/
Dow
nloaded from

J. E. HAYES, JR., AND S. F. VELICK 229
assumed that there was only a few per cent of inactive impurity. In the binding experiments by the ultracentrifugal separation method which re- quired several hours the inactive component may have risen in some cases to about 10 per cent.
Absorption Coeficient-The protein concentration of a solution of ADH exhaustively dialyzed against distilled water was measured by drying triplicate samples of the solution to constant weight. Measurements of optical density, D, were made on aliquots diluted in 0.08 M glycine, pH 8.1. The DwJD~,x ratio was 1.82. An optical density of 1.00 at 280 rnp., effective band width 2.5 to 3 rnp on a Beckman DU spectrophotom- eter, corresponded to a protein concentration of 0.792 mg. per ml. For a molecular weight of 150,000 this corresponded to a molar absorption co- efficient, E28,,, of 1.89 X 10⁵, where E is defined by t’he following relation: concentration (mole liter-‘) = (l/EL) log10 (io/i) (L = optical path length in cm.).
Xedimentatiwn Constant-All measurements for the molecular weight were carried out in 0.1 ionic strength acetate buffer, pH 5.9. The sedi- mentation constant, determined at 0” in buffer and corrected to 20” in water (s~O,~), was extrapolated to infinitely dilute protein solution and found to be 6.72 X lo-l3 sec.-l. This is 12 per cent lower than the value 7.81 X lo-i3 obtained by Pedersen with the oil-turbine ultracentrifuge at Upsala, as reported by Theorell and Bonnichsen (4). Taylor (14) reports 8 to 10 per cent lower values for bovine serum albumin in the Spinco machine, compared with figures from Upsala. In the concentration range studied (Fig. 2) there was no indication of dissociation of the protein into subunits.
Diffusion Measurements--A solution of ADH in 0.1 ionic strength ace- tate buffer, pH 5.9, was dialyzed in the rapid dialyzer for 2 hours against each of four 1500 ml. portions of buffer. After clarification by high speed centrifugation the protein concentration, determined spectrophotomet- rically, was 0.874 per cent. The protein was allowed to undergo free dif- fusion in the Tiselius a.pparatus at 2” for 73 hours. At the end of this time there was turbidity in the cell and the experiment was terminated. Enlarged tracings of the schlieren scanning pictures taken during the course of the experiment were analyzed by the maximal ordinate method (11). In this method the diffusion coefficient, D, is given by the expression D = p2/2t, where p is a qua,ntity proportional to the standard deviation of the protein concent,ratjion at the boundary and t is the t)ime, corrected for ini- tial boundary disturbances. The plot of p2 versus 2t was linear. I)rc, ,?(. was found to be (1.70 f 0.03) X low7 cm.2 sec.-‘.
Partial Specific Volwne~--A solution of ADH was dialyzed a,gainst the standard buffer. The densities of the buffer and protein solution \vere de-
by guest on May 31, 2018
http://ww
w.jbc.org/
Dow
nloaded from

230 YEAST ALCOHOL DEHYDROGENASE
termined in duplicate in each of two density gradient tubes (12). The density of the buffer was 1.00236 and of the protein solution 1.00481 at 20”. Triplicate dilutions of the protein solution were made for optical density measurements. The protein concentration was 0.0107 gm. per ml. The partial specific volume was calculated from the relation 7 = (g - (d - &))/&g, where 7 is the partial specific volume, d is the density of the protein solution, do is the density of the buffer, and g is the protein concentration in gm. per ml. (15). The value obtained was P = 0.769 ml. per gm.
Molecular Weight-The molecular weight (M) of yeast ADH, calculated from the relation M = RTs/D(l - v&J, is 150,000. The ratio of the frictional resistance of flow df> encountered by the molecule to that which would be encountered by an anhydrous sphere of the same weight and density, f/f0 (16), is 1.27.
0.2 &&l~, G.%O ML.
0.8
FIG. 2. The sedimentation constant of yeast ADH in acetate buffer, pH 5.9, as a function of protein concentration.
Riding of DPNH-Standard solutions of the enzyme containing vari- ous concentrations of DPNH and control tubes containing protein alone and DPNH alone were spun in the ultracentrifuge at O-5” for 2 hours. Aliquots of the supernatant layers were analyzed spectrophotometrically for protein and DPNH. The DPNH bound to the protein under a given set of conditions is obtained from the ratio of sedimented DPNH to sedi- mented protein after correction for the small independent sedimentation of DPNH in the control tube which contained no protein. The details and results of such experiments are shown in Table II. It may be seen that the coenzyme is strongly bound and that a saturation value is ap- proached. If the binding sites are equivalent and independent, the bind- ing is described by the expression
where [C,] and [C,] are concentrations of free and bound coenzyme and
by guest on May 31, 2018
http://ww
w.jbc.org/
Dow
nloaded from

J. E. ITAYES, JR., AND S. F. VELICK 231
[P] is the concentration of protein containing n binding sites per molecule. Equation 2 may be put in the form
where i; = [CJ/[P], the number of coenzyme molecules bound per molecule of protein. When 7 is plotted against f/[C,], a straight line is obtained in which K and n appear in separate terms with K as a regression coefficient
TABLE II Binding of DPNH by Yeast ADH Measured by Ultracentrifugal Separation Method
Tube A Tube B Tube C Tube D Tube E
Initial concentrations, moles per 1. X lo6
Calculated concentrations, moles per 1. X lo6
DPNH, free.. . 0.49 1.24 1.59 4.77 7.23 “ bound..... 2.50 4.75 6.39 7.21 7.74
f.................. 0.97 1.84 2.48 2.79 3.0 K’ x 106.. 1.61 1.55 1.07 2.3 2.4
The separation was carried out at O-5’ in a medium containing 0.005 M sodium pyrophosphate, 0.013 M glycine, and 0.01 M semicarbaxide, pH 7.8. Free DPNH is the DPNH in the supernatant solution after correction for independent DPNH sedimentation. Bound DPNH is the difference between total DPNH, before separa- tion, and free DPNH. i; is bound DPNH per sedimented protein. The apparent dissociation constant is
K, = [free DPNH][3.6ADH - bound DPNH] [bound DPNH]
(17, 18). K will be referred to as a dissociation constant, although it is more properly a coefficient, since the activity coefficients are not known. The properties of this plot facilitate the analysis of both direct and com- petitive binding experiments and an analogous equation is used in the sec- tion on kinetics.
A plot of 5 versus i;l[C;] from the results of several DPNH-binding ex- periments is shown in Fig. 3. Most of the experimental points fall on a straight line reasonably well. The line has the parameters n = 3.6 and K = 1.3 X 1O-5 mole liter’. Since the value of n should be an integer, the question arises whether there are three or four binding sites. Control experiments showed no evidence of destruction of the nucleotide under the
by guest on May 31, 2018
http://ww
w.jbc.org/
Dow
nloaded from

232 YE.4ST ALCOHOL DEHYDROGENASl?
conditions of the binding experiments and so provide no explanation for a high result. On t’he other hand, the presence of a few per cent of the in- active second component could easily result in an observed value of n which is 10 per cent too low. The number of binding sites is therefore con- sidered to be four per molecule of protein.
Binding of DPN-In the ultracentrifugal separation method binding is determined from the diRerence between an initial and a final concentra-
I 0.4 0.8 I.2 1.6 2.0
~;/[DPNHI , L.M? Ix@‘)
FIG. 3. The binding of DPNH by yeast ADH. P, the number of molecules of DPNH bound per molecule of protein, is plotted against ?/[C,], where [C,] is the concentration of free DPYH. Curve A, binding of DPNH alone; Curve B, binding of DPSH in the presence of a constant high concentration of DPN (see Fig. 5 and the text).
tion. When I< is very small, of the order of lOV, as in the case of glycer- aldehyde-3-phosphate dehydrogenase and DPN (5), the concentration of free DPN may be at the lower limit of the analytical method. In such a case the stoichiometry of binding is easy to measure, but K may be rela- tively inaccurate or determinable only as an upper limit. At intermediate levels of K, 1OF to 1O-5 M, as in the case of DPNH and yeast ADH, both K and n can be measured and the chief limiting factors in the accuracy of the results are the stability and purity of the materials. When K becomes still larger, the concentration of bound DPN may become a small fraction of the total DPN and the accuracy of K again diminishes. Under such conditions, only a limited portion of the titration curve may be examined
by guest on May 31, 2018
http://ww
w.jbc.org/
Dow
nloaded from

J. E. HAYES, JR., AKD S. F. VELICK 233
and the determinations of n and K involve a relatively long extrapolation. This is the situation in the binding of DPN by yeast ADH. In Fig. 4, P is plotted against ?/[Cf]. Because of the scatter of the points the values of n and K obtained by graphical treatment are uncertain. The mean of the K values calculated separately for all of the points that, have been obtained is (2.6 f 0.8) X 10-4, assuming that n is 3.6. It is apparent that from ex- periments of this type alone (Fig. 4) a value of n = 3.6 is reasonable but
t=/[DPNl L.M-‘(~10~)
FIG. 4. The binding of DPN by yeast ADH. The scatter of points in different experiments is too large to permit accurate extrapolation. The line shown falls on points obtained in a single experiment and extrapolates to the same value of P ob- tained in DPNH-binding experiments (Fig. 3) and in the competitive binding of DPN and DPNH (Fig. 5).
by no means certain. We therefore justify this figure on the grounds (a) that it is in the range indicated by direct experiment and (b) that it is sup- ported by the competitive binding experiments to be described.
Competition between DPN and DPNH-The test for competition be- tween DPN and DPNH was obtained by differential analysis of ultra- centrifuged solutions containing protein and both forms of coenayme. The DPNH concentrations were determined from optical density measure- ments at 340 rnp and the DPN concentrations from measurements at t,he same wave-length after reduction with ethanol a,nd ADH. The result,s of such an experiment are shown graphically in Fig. 5 where rI)PN and rDPNII at constant’ total DPN concentration are plotted against the total concen-
by guest on May 31, 2018
http://ww
w.jbc.org/
Dow
nloaded from

234 YEAST ALCOHOL DEHYDROGENASE
tration of DPNH which was varied. For the three central pairs of points, which are the most accurate, the sum of the bound DPN and DPNH is close to 3.6 per molecule of protein and small increments of DPNH are seen to displace bound DPN as would be expected from the relative values of K.
FIG. 5. Competition in the binding of DPN and DPNH by yeast ADH. The DPN concentration in each tube was 5.79 X 10e4 mole per liter. Small increments of DPNH were added to successive tubes. The concentration of the protein that was sedimented (decrease in concentration in the upper layer after sedimentation) was 2.19 X 10-b mole per liter. Curve A, binding of DPNH; Curve B, binding of DPN. The total coenayme bound in the three middle tubes of the series is 3.5,3.66, and 3.59 moles per mole of sedimented protein.
The expression for competitive binding, a modification of the equation of Klotz et al. (19), is
where [CJ and [Cz] are the concentrations of the uncombined forms of the coenzyme, KI and KS are the respective dissociation constants, and TI and r2 are the number of molecules of each bound per molecule of protein. Thus, if r versus r/[C], plotted for simple binding, is compared with a simi- lar plot for binding in the presence of a competitor, the line should have the same intercept on the r axis but the competitive plot should have the greater slope. Curve B in Fig. 3 shows the DPNH-binding points from the competitive experiment. The parameters of Curve B are n = 3.8 and K* = 2.4 X 10⁻⁵, compared to n = 36 and K = 1.3 X low5 for sim- ple binding, Curve A.
by guest on May 31, 2018
http://ww
w.jbc.org/
Dow
nloaded from

J. E. HAYES, JR., AND S. F. VELICK 235
It can be shown that under the conditions of the present experiment
(5) Kz = K1lCzlr1llCllrz
When the value 1.3 X 1(Y6 for KDPNH is used, a value of 3.1 X 1e4 is obtained from Equation 5 for K,,,. This is in rough agreement with the value obtained when DPN binding was studied alone.
Kinetics-The reported Michaelis constants for DPN with glyceralde- hyde-3-phosphate dehydrogenase and for DPNH with the mammalian ADH were found to be more than 200 times greater than the directly de- termined dissociation constants of the corresponding enzyme-coenzyme complexes (6, 5). Possible explanations for such differences based upon the kinetics of the formation and dissociation of the intermediates could be formulated along the lines originally proposed by Briggs (20). The ex- periments described below are an extension over a wider concentration range of the kinetic work of Negelein and Wulff (1) with yeast ADH.
If the enzymatic reaction occurs through a ternary complex, ethanol- ADH-DPN, and both reactants combine with the enzyme and dissociate independently of each other and at rates much greater than the intra- molecular oxidation rate, then the general expression for the initial velocity, v, of the reaction (21) is
03 VlCl [Sl
v = (IL + lSI)(& + [Cl)
where V is the maximal velocity at high concentrations of both coenzyme and substrate [Xl, respectively, and K, and K, are Michaelis constants. Under the conditions defined, the K figures characterize the simple dis- sociation equilibria of the intermediary complexes and may be calculated from initial velocity measurements by the relations
(7) v = V’, - K,(v/[C])
(8) v = V’, - ~*WW
where V’, is the limiting velocity at large [C] for a given [S], and V’, is the limiting velocity at large [X] for a given [Cl. If suitable values of V’c and V’, are obtained, K values may also be derived from the relations
(9) V’, = v - K,(V’,/[S])
(10) V’, = v - K,(V’,/[C])
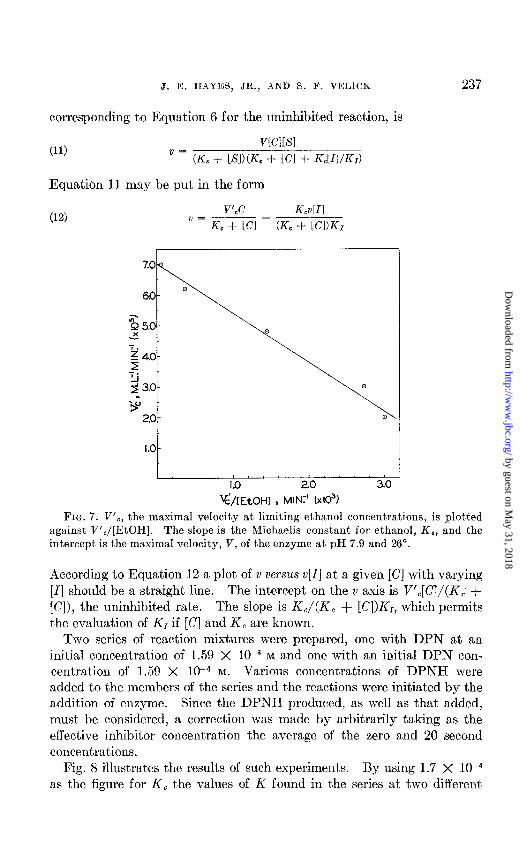
In Fig. 6, v is plotted against v/[DPN] for a series of five ethanol con- centrations. The lines are essentially parallel and indicate no significant effect of ethanol concentration upon K,. The values of V’, from the in- tercepts in Fig. 6 are plotted against V’,/[EtOH] in Fig. 7. This yields a value for K, and V. K, and V’, were also obtained from plots of v ver- sus v/[EtOH]. The V’, values so obtained, plotted against V’,/[DPN],
by guest on May 31, 2018
http://ww
w.jbc.org/
Dow
nloaded from

2% YEAST ALCOHOL DEHYDROGES.ZSF:
yielded again K, and V. The values of V, K,, and K, obtained in these ways are summarized in Table III. The consistency of the results over a wide concentration range shows the applicability of the kinetic conditions upon which the treatment is based.
V/IDPNI , MIN?
FIG. 6. Initial reaction rates as a function of DPN concentration at each of the following initial ethanol concentrations: Curve A, 0.00667; Curve B, 0.011; Curve C, 0.033; Curve D, 0.167 mole per liter. The points, X, were obtained in 1.09 Methanol.
The reaction mixture (pH 7.9, 26”) contained the following substances, in moles per liter: sodium pyrophosphate, 0.05; glycine 0.013; semicarbazide, 0.01; cysteine, 0.001. The reactions were initiated by the addition of enzyme. All activities were corrected to an enzyme concentration of 2.6 X lo+ mole per liter. The slopes of the lines give the Michaelis constant for DPN.
Inhibition by DPNH-The interaction of an inhibitor, I, with an en- zyme can be expressed in terms of a dissociation constant, K,, of an en- zyme-inhibitor complex. If the competitive binding observed with DPN and DPNH on yeast ADH occurs at a catalytic sit.e on the enzyme, then KI for DPNH in the reduction of DPN by ethanol should be the same as K I3 PNH in the binding experiments.
An expression for the initial velocity of a single substrate reaction as a function of the concentration of the substrate and a competitive inhibitor was derived by Lineweaver and Burk (22). The analogous expression,
by guest on May 31, 2018
http://ww
w.jbc.org/
Dow
nloaded from
J. E. HAYES, JR., AND S. F. VELICK
corresponding to Equation 6 for the uninhibited reaction, is
(11) v~cl[sl
v = (KS + [SI)(K, + [Cl + KJIIIKr)
Equation 11 may be put in the form
(12) V’,C GUI
’ = K, - (Kc + [Cl&
237
I . I b, b, 0
1.0 2.0 3.0 V;/[EtOH] , MINT’ (x103)
FIG. 7. V’,, the maximal velocity at limiting ethanol concentrations, is plotted against V’,/[EtOH]. The slope is the Michaelis constant for ethanol, K,, and the intercept is the maximal velocity, V, of the enzyme at pH 7.9 and 26”.
According to Equation 12 a plot of v versus v[I] at a given [C] with varying [I] should be a straight line. The intercept on the v axis is V’,[C]/(K,’ + [Cl), the uninhibited rate. The slope is K,/(K, + [Cl)&, which permits the evaluation of K1 if [C] and K, are known,
Two series of reaction mixtures were prepared, one with DPN at an initial concentration of 1.59 X 1p3 M and one with an initial DPN con- centration of 1.59 X 10e4 M. Various concentrations of DPNH were added to the members of the series and the reactions were initiated by the addit.ion of enzyme. Since the DPNH produced, as well as that added, must be considered, a correction was made by arbitrarily taking as the effective inhibitor concentration the average of the zero and 20 second concentrations.
Fig. 8 illustrates the results of such experiments. By using 1.7 X 1O-4 as the figure for K, the values of K found in the series at two different
by guest on May 31, 2018
http://ww
w.jbc.org/
Dow
nloaded from

238 YEAST ALCOHOL DEHYDROGENASE
DPN concentrations are 2.2 and 2.5 X 10⁻⁶. The agreement among these values obtained at DPN concentrations in the range K, to lOK, is kinetic evidence that DPN and DPNH compete for the same catalytic sites.
TABLE III
Kinetic Constants for DPN and Ethanol with Yeast ADH
From v = V’c - &WlDVNl) From o = V’s - K,(o/[EtOHI) -
EtOH Kc V’C
af 24 x 10’ min.-’
0.0067 1.7 7,600 0.011 2.0 11,400 0.033 1.8 18,500 0.167 1.5 23,700 1.09 2.0 26,800
From V’c = V - K&“&EtOHI)
DPN
M M min.’
5 0.019 6,400 15 0.021 13,400 25 0.020 17,300 35 0.016 17,600 45 0.015 19,200
From V’a = V - KJV’~IlDFW
Kc
I I
V
1.4 27,000
KS V
0.016 26,000
The experiments were carried out at 26’. The experiments were carried out at 26’.
V’.
4.0- , ( ~ ( , 4o4 1.0 2.0 3.0
v[DPNHI , M? IL” MIN:' (xios) v[DPNHI , M?L"MIN:' (xlOs)
FIG. 8. The inhibitor constant, Kr, for DPNH in the reduction of DPN by eth- anol. The initial velocities, 21, are plotted against s[DPNH] according to Equation 12. The initial ethanol concentration was 0.167 mole per liter and the initial DPN concentration was 1.59 X IOW mole per liter. Other experimental conditions as in Fig. 6. Kr from the slope is 2.2 X 10-E. In a similar experiment at one-tenth the initial DPN concentration, KI was found to be 2.5 X lo+.
by guest on May 31, 2018
http://ww
w.jbc.org/
Dow
nloaded from

J. E. HAYES, JR., AND S. F. VELICK 239
Equilibrium Shills-Theorell and Bonnichsen (4) observed that the value of K’ in the equilibrium
(13) K, = [DPNHlKXMXOl[H+l
[DPNl[CH&H,OHl
was greatly increased when the concentration of the mammalian ADH was raised from the very low levels sufficient to establish good reaction rates to concentrations in the range of the total coenzyme concentration. They attributed this effect qualitatively to the more extensive complex forma-
TABLE IV
Effect of Yeast ADH Concentration on Equilibrium CH&HSOH + DPN f CHpCHO + DPNH + H+
ADH, moles per 1. x 10’ DPN’
0.12 0.20 0.21 0.99 1.04 1.98 3.97 7.93
11.9 19.8 39.7
10.8 27.7 99,700 7.82 1.08 10.5 28.0 99,700 7.82 1.13 19.9 15.5 99,500 7.91 1.49 14.2 24.3 49,900 7.81 1.29 10.9 24.5 49,800 7.91 1.36 14.2 24.3 49,800 7.81 1.29 21.0 17.5 15,500 7.78 1.61 28.7 9.82 2,480 7.72 2.59 31.3 7.25 990 7.70 3.39 32.4 6.12 494 7.65 5.24 31.4 7.08 493 7.50 10.2
DPNH’
- I CHKH~OH* PH K’ x 10”
These experiments were carried out at 26”. * Moles per liter X IO6 at equilibrium.
tion of the enzyme with DPNH than with DPN. This would tend to drive the reaction in the direction of increased DPNH formation. It was assumed that a DPN-enzyme complex, although not directly observed, was formed, but alcohol and aldehyde complexes with the enzyme were not considered. Theorell and Chance (5) formulated the kinetics of the reac- tion with mammalian ADH wit’hout postulaOing enzyme complexes with ethanol or acetaldehyde at all.
The results of a series of equilibrium measurements with the yeast ADH are shown in Table IV. The initial DPN concentrations were constant and the ethanol and enzyme concentrations were varied. The pH of each reaction mixture was measured, after equilibrium was reached. It may be seen that large shifts in K’ occurred at the higher enzyme concentrations and that a maximum was not reached.
by guest on May 31, 2018
http://ww
w.jbc.org/
Dow
nloaded from

240 YEAST ALCOHOL DEHYDROGENARE
The over-all equilibrium may be formulated as
(14) K [D~~NH~ICI-I~CH~ICZ~~
ea. = [D~N~H,CH~~HI
x fJPN9:;'" _ K,fyNyly. DPN ale DPN do
where the quantities in brackets are total molar concentrations and aH is the hydrogen ion activity. As a first approximation we may assume that the activity coefficients of the free reactants are either unity or constant. The f coefficients in Equation 14 are then the fractions of the total con- centrations of the reactants that are present in the free form. Under suit- able conditions the equilibrium shifts may then be used to evaluate the apparent dissociation constants of the complexes formed between reac- tants and enzyme (23). In the present case complex formation was studied independently and it was thus possible to find out to what extent the bind- ing of the reactants was responsible for the shifts in the reaction equilib- rium.
It is to be observed that at enzyme concentrations between 0.02 and 3.97 X 1OF mole per liter the value of K’ shows no significant shift. As the enzyme concentration is increased further, the value of K’ begins to increase. The productfUpNHfaid. thus increases more rapidly thanfDPNfaie.. Values for fDPNH and fDpN may be obtained from the relations
W-3
km - [Cal)([Ctl - [Cd = K [cbl
c
[Cd - [Cbl [C,l = jc
where n, the number of binding sites per molecule of undialyzed enzyme is taken as 4 and subscripts b and t refer to bound and total, respectively. At high enzyme concentrations the total concentration of binding sites was in excess of the total coenzyme concentration and greatly in excess of the DPNH produced in the reaction. Competition of DPNH thus could not greatly affect the binding of DPN. As a first approximation, therefore, the presence of DPNH could be neglected in the calculation of the con- centrat#ion of bound DPN and of fDPN. In applying the equations to DPKH the concentration of available binding sites was t’aken as the total binding sites minus those occupied by DPN. Qualitatively it makes little difference whether the K values determined by the kinetic or the direct binding method are used in the calculations, because with the yeast en- zyme, unlike the liver enzyme, they are approximately the same. The K figures from kinetic experiments were used because they were determined at 26”. The values for fDpN and fDPNK, calculated from Equations 15 and 16 described above, are shown in Table V for three equilibrium points.
If the ratio faid./jaio. is assumed to be unity and the calculated values of
by guest on May 31, 2018
http://ww
w.jbc.org/
Dow
nloaded from

J. E. HAYES, JR., AND S. F. VELICK 241
fDPNH and fDpN are substituted into Equation 14, Keq. still shows a signifi- cant increase at high enzyme concentration. From the concentrations of ethanol employed and the Michaelis constant for ethanol it is unlikely that
f ale . could be far from unity. The residual increase in K,,. may thus be due to the binding by the enzyme of the acetaldehyde produced in the re- action. Values of fald. on this assumption may be computed from the re- lation f&ld. = (Keq.fDPN)/(KlfDPNH), where K,,. = 1.3 X lO+. These values are shown in Column 4 of Table V. Values of Kald., the dissocia- tion constant of the aldehyde-enzyme complex, computed from fald. are given in Column 5. The mean value of K&H. = 1.8 X 10⁻⁴, whereas the Michaelis constant reported for acetaldehyde (1) is 1.1 X 10⁻⁴. Alter-
TABLE V Apparent Dissociation Constant of Yeast ADH-Acetaldehyde Complex Calculated from
Equilibrium Shift at High Enzyme Concentration
ADH, moles per 1. X 106
Below 4 11.9 19.8 39.7
K’ x lo”* jDPNHt
(1) (2)
1.3 f 0.111 1 3.39 0.38 5.24 0.26
10.2 0.14
fDPNt fe.1d.t
(3) (4)
1 1 0.81 0.82 0.73 0.70 0.53 0.48
2.0 1.8 1.4
Ke,. X lOl’$?
(6)
1.3 1.25 1.31 1.6
* From Table IV. t Calculated from Equations 15 and 16 with KDPN = 1.7 X lo+ and KDPNH
= 2.3 X 10⁻⁵. $ Calculated as described in the text. $ From Equation 14. jl Average of eight determinations.
natively, if one calculates fald. from an assumed K&H. of 1.8 X 1O-4 and substitutes the values in Equation 14 together with the f coefficients for the coenzyme, the calculated values of K,,. are now found to be essentially constant over the entire range of enzyme concentrations studied. The results thus indicate that acetaldehyde is bound to the enzyme. That it is bound at a catalytic site to form a complex intermediary in the enzymatic reaction may be inferred from the agreement between Kald. calculated from the equilibrium shift and Kald. determined as a Michaelis constant.
DISCUSSION
The physical characterization of yeast ADH and its interaction with co- enzyme and substrate are summarized in Table VI, together with per- tinent information on the mammalian enzyme. The combining weight of both enzymes for 1 mole of DPN is approximately 37,000 gm., but the
by guest on May 31, 2018
http://ww
w.jbc.org/
Dow
nloaded from

242 YEAST ALCOHOL DEHYDROGENASE
150,000 73,000 6.72 x lo-‘3 4.88 x 10⁻¹⁸ 4.70 x 10-T 6.5 X lo-” 0.769 0.751 4 2 1.89 x 10⁶ 0.332 x 10⁶
molecular weight of the yeast enzyme is twice that of mammalian ADH. The absorption coefficients at 280 rnp indicate that the yeast enzyme has
TABLE VI Physical Properties of ADH Crystallized from Yeast and from Horse Liver
-
Yeast ADH Liver ADH
Present work NegeIeinC;rd Wulff Theme11 et al. (4, 5) -
Mol. wt.. . . . . . . . . . . s~~.~, sec.-l.. . . . , . Dzo.lo. cm.2 sec.-l. . . . . . . . . . 7, cm.a Sm.+. . . . , . . Catalytic sites per molecule. E 280 mp, cm.2 male-1..
Michaelis constants, moles per liter, at 26’
I pH 7.9 pH 7.9 pH7
KDpN ....................... 1.7 x 10-d 0.9 x 10-a 1.3 x 10-s KDPNE ...................... 2.3 X 10-c* 3.0 x 10-s* 1.2 x 10-s KE~OH ....................... 1.8 x 10-Z 2.4 X 10-Z 5.4 X 1O-4 (pH 8.2) K aeeta,dehy& ................. 1.1 x 10-d 1.2 x 10-b
Apparent dissociation constants, moles per liter (binding, equilibrium shift)
K’ Dp*K ...................... 1.3 x lo-6f 1 x lo-‘$ FnPN. ..................... 2.6 X 10⁻⁴t K’seetal,+&yde ................. 1.8 x l@-‘$
Maximal velocities (26’)
pH 7.9 pH 7.9 I
pH 8.2
EtOH oxidation.. . . . 6700 9,350 90 Acetaldehyde reduction. . . 15,600 2700
D and s were determined at 2” in buffer. The values for 20” in water were ob- tained by applying temperature and viscosity corrections (15). Maximal velocities are expressed as reactions per minute per catalytic site.
* Inhibitor constants. t By ultracentrifugal separation at O-5”. $ By spectrophotometric titration. 8 From equilibrium shift at 26’.
a much higher content of aromatic amino acids. The partial specific vol- umes suggest that the mammalian ADH has a higher content of amino acids with polar side chains. The specific activity per cakalytic site is
by guest on May 31, 2018
http://ww
w.jbc.org/
Dow
nloaded from
J. E. HAYES, JR., AND S. F. VELICK 243
about 100 times greater for the yeast than for the mammalian enzyme and this may be correlated with the observation that the K values for the dis- sociation of the coenzyme complexes are of the order of 100 times larger for yeast ADH. In both cases the ADH-DPNH complex has a smaller dissociation constant than the ADH-DPN complex.
The maximal velocities in the forward and reverse direction, the Mi- chaelis constants, and the equilibrium constant in an enzyme-catalyzed reaction are related to each other in a manner determined by the reaction mechanism (24). With the yeast ADH the results, at the one pH in- vestigated, fit fairly closely the relation
(17) K*w. = VfKDpivH&d.
~~KDPN&o.
where Kxk,. is the equilibrium constant of the over-all reaction divided by the hydrogen ion activity, V, and V, are maximal velocities in the direc- tion of ethanol oxidation and acetaldehyde reduction, respectively, and K the. Michaelis constant. This relation is the one expected from the kinet- ics. Alberty (24), using the results of Theorell and coworkers for the mammalian ADH, found that the relationships which best fit the results contained higher powers of V. Qualitative differences in the mechanisms by which the two enzymes catalyze the same over-all reaction are thus in- dicated. Similarly, the absence of the spectral shift in the yeast ADH- DPNH complex suggests that the two enzymes activate DPNH in a dif- ferent way. Whether the mechanisms by which the two enzymes catalyze the same over-all reaction differ in any fundamental way remains to be established.
SUMMARY
1. The molecular weight of alcohol dehydrogenase (ADH) crystallized from yeast is 150,000, calculated from sedimentation velocity and diffusion measurements. This is approximately twice the molecular weight of the ADH crystallized from horse liver. The partial specific volume of the yeast enzyme is 0.769, which is somewhat larger than that of the liver enzyme.
2. From binding measurements by the ultracentrifugal separation method, yeast ADH binds 4 molecules of DPN or DPNH per molecule of protein. The binding is competitive and the dissociation constant of the ADH-DPNH complex is about one-tenth that of the ADH-DPN complex. The four binding sites appear to be equivalent.
3. The Michaelis constants for the reduced and oxidized forms of the coenzyme are of the same order of magnitude as the directly deternnned dissociation constants of their complexes with the enzyme.
by guest on May 31, 2018
http://ww
w.jbc.org/
Dow
nloaded from

244 YEAST ALCOHOL DEHYDROGENARE
4. As a result of the difference in the affinities of yeast ADH for the substrates and products of t,he oxidation reaction, the apparent equilib- rium constant is increased at high enzyme concentration. The magnitude of the shift may be partially accounted for by the dissociation constants of the ADH-DPNH and the ADH-DPN complexes. The full magnitude of the equilibrium shift can be accounted for if one assumes the formation of an ADH-acetaldehyde complex with a dissociation constant of about 1.8 x 1Ck4, a value which is in agreement with the Michaelis constant for acetaldehyde.
5. The properties of the yeast and mammalian ADH enzymes are com- pared.
BIBLIOGRAPHY
1. Negelein, E., and Wulff, H. J., Biochem. Z., 289, 436 (1937). 2. Racker, E., J. Biol. Chem., 184, 313 (195O)J 3. Bonnichsen, R. K., and WassBn, A. M., Arch. Biochem., 18, 361 (1948). 4. Theorell, H., and Bonnichsen, R. K., Acta them. &and., 6, 1105 (1951). 5. Theorell, H., and Chance, B., Ada &em. Stand., 5, 1127 (1951). 6. Velick, S. F., Hayes, J. E., Jr., and Harting, J., J. Biol. Chem., 203, 527 (1953). 7. Velick, S. F., J. Biol. Chem., 203, 563 (1953). 8. Thiele, J., and Stange, O., Ber. ckem. Ges., 27, 31 (1894). 9. Tiselius, A., Tr. Faraday Sot., 33, 524 (1937).
10. Longsworth, L. G., J. Am. Chem. Sot., 61, 529 (1939). 11. Neurath, H., Chem. Rev., 30, 357 (1942). 12. Jacobsen, C. F., and Linderstr@m-Lang, K., Acta physiol. Stand., 1, 149 (1940). 13. Burton, K., and Wilson, T. H., Biochem. J., 64, 86 (1953). 14. Taylor, J. F., Arch. Biochem. and Biophys., 36,357 (1952). 15. Svedberg, T., and Pedersen, K. O., The ultracentrifuge, Oxford (1940). 16. Oncley, J. L., Ann. New York Acud. SC., 41, 121 (1941). 17. Eadie, G. S., J. BioZ. Chem., 146, 85 (1942). 18. Scatchard, G., Ann. New York Acad. SC., 61,660 (1949). 19. Klotz, I. M., Triwush, H., and Walker, F. M., J. Am. Chem. Sot., 70, 2935 (1948). 20. Haldane, J. B. S., Enzymes, Monographs on biochemistry, London and New York,
82 (1930). 21. Laidler, K. J., and Soquet, I. M., J. Phys. and Colloid Ckem., 64, 530 (1950). 22. Lineweaver, H., and Burk, D., J. Am. Ckem. Sot., 56, 658 (1934). 23. Alberty, R. A., J. Am. Chem. Sot., 75, 1925 (1953). 24. Alberty, R. A., J. Am. Chem. Sot., 76, 1928 (1953).
by guest on May 31, 2018
http://ww
w.jbc.org/
Dow
nloaded from

Joseph E. Hayes, Jr. and Sidney F. VelickEQUILIBRIA
BINDING, AND REACTIONMOLECULAR WEIGHT, COENZYME
YEAST ALCOHOL DEHYDROGENASE:
1954, 207:225-244.J. Biol. Chem.
http://www.jbc.org/content/207/1/225.citation
Access the most updated version of this article at
Alerts:
When a correction for this article is posted•
When this article is cited•
alerts to choose from all of JBC's e-mailClick here
tml#ref-list-1
http://www.jbc.org/content/207/1/225.citation.full.haccessed free atThis article cites 0 references, 0 of which can be by guest on M
ay 31, 2018http://w
ww
.jbc.org/D
ownloaded from