year in trade 2013 - usitc.gov · provides congress with factual information on trade policy and...
TRANSCRIPT

United States International Trade Commission
The Year in Trade 2013 Operation of the Trade Agreements Program
65th Report
July 2014 Publication Number: 4481

United States International Trade Commission
Commissioners Meredith M. Broadbent, Chairman
Dean A. Pinkert
Irving A. Williamson
David S. Johanson
F. Scott Kieff
Rhonda K. Schmidtlein
Robert B. Koopman Director, Office of Operations
Nannette Christ Acting Director, Office of Economics
Address all communications to Secretary to the Commission
United States International Trade Commission Washington, DC 20436

United States International Trade Commission
The Year in Trade 2013 Operation of the Trade Agreements Program
65th Report
July 2014 Publication Number: 4481

United States International Trade Commission
This report was prepared principally by:
Project Leader Cathy Jabara, Office of Industries
Deputy Project Leader Joanne Guth, Office of Economics
Office of Economics Dylan Carlson, Justino De La Cruz, William Greene,
Jeffrey Horowitz, Lin Jones, Alissa Tafti, and Edward Wilson
Office of General Counsel William W. Gearhart
Office of Industries Logan Cobb and Laura Rodriguez
Office of Investigations Edward Petronzio
Office of Tariff Affairs and Trade Agreements Naomi Freeman and Daniel Shepherdson
Office of Unfair Import Investigations David Lloyd
Office of Analysis and Research Services Russell Duncan and Jeremy Wise
Content Reviewer Katherine Linton
Office of Economics Intern Kimberly Lovejoy
Special Assistance Peg Hausman and Cynthia Payne
Help Desk and Customer Service Division
Under the direction of Arona Butcher, Chief
Country and Regional Analysis Division

Preface This report is the 65th in a series of annual reports submitted to the U.S. Congress under section 163(c) of the Trade Act of 1974 (19 U.S.C. 2213(c)) and its predecessor legislation. Section 163(c) of the Trade Act of 1974 states that “the International Trade Commission shall submit to the Congress at least once a year, a factual report on the operation of the trade agreements program.”
This report is one of the principal means by which the U.S. International Trade Commission provides Congress with factual information on trade policy and its administration for calendar year 2013. The trade agreements program includes “all activities consisting of, or related to, the administration of international agreements which primarily concern trade and which are concluded pursuant to the authority vested in the President by the Constitution” and congressional legislation.
1

2

Table of Contents Preface ................................................................................................................... 1
Abbreviations and Acronyms ............................................................................... 11
Executive Summary.............................................................................................. 15
Chapter 1 Overview of U.S. Trade ........................................................................ 33 Scope and Approach of the Report ........................................................................................... 33 Overview of the U.S. Economy in 2013 ..................................................................................... 34
Exchange-Rate Trends ........................................................................................................... 35 Balance of Payments ............................................................................................................. 37
U.S. Trade in Goods in 2013 ...................................................................................................... 38 U.S. Merchandise Trade by Product Category ...................................................................... 38
Exports ............................................................................................................................... 38 Imports ............................................................................................................................... 39
U.S. Imports under Preferential Trade Programs and Free Trade Agreements.................... 40 U.S. Merchandise Trade with Selected Major Trading Partners ........................................... 40
U.S. Trade in Services in 2013 ................................................................................................... 42 U.S. Services Trade by Product Category .............................................................................. 43
Exports ............................................................................................................................... 43 Imports ............................................................................................................................... 44
U.S. Services Trade with Leading Partners ............................................................................ 44
Chapter 2 Administration of U.S. Trade Laws and Regulations............................. 47 Import Relief Laws ..................................................................................................................... 47
Safeguard Actions .................................................................................................................. 47 Laws against Unfair Trade Practices .......................................................................................... 47
Section 301 Investigations ..................................................................................................... 47 Section 301 Cases .............................................................................................................. 48 Special 301 ......................................................................................................................... 49
Antidumping and Countervailing Duty Investigations and Reviews ..................................... 52 Antidumping Duty Investigations ...................................................................................... 52 Countervailing Duty Investigations .................................................................................... 54 Reviews of Outstanding Antidumping and Countervailing Duty Orders/Suspension Agreements ........................................................................................................................ 55
Section 337 Investigations ..................................................................................................... 56 Trade Adjustment Assistance .................................................................................................... 57
Assistance for Workers .......................................................................................................... 58 Assistance for Firms ............................................................................................................... 59
Tariff Preference Programs ....................................................................................................... 60 Generalized System of Preferences ...................................................................................... 60 African Growth and Opportunity Act .................................................................................... 63 Andean Trade Preference Act ............................................................................................... 65 Caribbean Basin Economic Recovery Act .............................................................................. 68
3

Haiti Initiatives ................................................................................................................... 70
Chapter 3 The WTO, OECD, APEC, and TISA ......................................................... 73 World Trade Organization ......................................................................................................... 73
Ministerial Conference .......................................................................................................... 73 Agreement on Trade Facilitation ....................................................................................... 74 Agriculture ......................................................................................................................... 75 Development Issues ........................................................................................................... 79
General Council ..................................................................................................................... 80 Work Programs, Decisions, and Reviews ........................................................................... 80 Accessions .......................................................................................................................... 81
Selected Plurilateral Agreements .......................................................................................... 83 Agreement on Government Procurement ........................................................................ 83 Agreement on Trade in Civil Aircraft ................................................................................. 83 Information Technology Agreement ................................................................................. 84
Dispute Settlement Body ....................................................................................................... 85 New Requests for Consultations and New Panels Established ......................................... 89 Panel and Appellate Body Reports Issued and/or Adopted during 2013 that Involve the United States ............................................................................................................... 91
Organisation for Economic Co-operation and Development ................................................... 93 Ministerial Council Meeting .................................................................................................. 93 Trade Committee ................................................................................................................... 94
Asia-Pacific Economic Cooperation ........................................................................................... 97 The Bogor Goals, FTAAP, and Related APEC Commitments ................................................. 97 Regional Economic Integration, Connectivity, and Sustainable Growth .............................. 99
Negotiations on a Trade in Services Agreement ..................................................................... 100
Chapter 4 U.S. Free Trade Agreements .............................................................. 103 U.S. Trade with FTA Partners in 2013 ..................................................................................... 103 Developments in FTA Negotiations during 2013 .................................................................... 107
Negotiations and Consultations toward the Trans-Pacific Partnership (TPP) Agreement .......................................................................................................................... 107
U.S. Trade with TPP Partners ........................................................................................... 110 Negotiations and Consultations toward the Transatlantic Trade and Investment Partnership (TTIP) Agreement ............................................................................................. 112
Developments in FTAs Already in Force during 2013 ............................................................. 113 U.S.-Bahrain FTA: Consultation with Bahrain to Protect Worker Rights ............................ 114 CAFTA-DR ............................................................................................................................. 114
Enforcement Plan Relating to Labor Rights in Guatemala .............................................. 114 Meeting to Discuss Environmental Issues ....................................................................... 115
U.S.-Chile FTA: Environmental Affairs Council Meeting ...................................................... 115 U.S.-Colombia TPA: Labor Issues Discussion with Colombia ............................................... 116 U.S.-Jordan FTA: U.S.-Jordan Agreement to Boost Investment and ICT Services, and Enhance Labor Cooperation ................................................................................................ 116 U.S.-Korea Free Trade Agreement (KORUS FTA): Environment and Labor Councils and Joint Committee Meetings .................................................................................................. 117
4

U.S.-Morocco FTA: New Trade Facilitation Agreement ...................................................... 117 U.S.-Peru TPA ....................................................................................................................... 118
Progress on Environmental Matters ................................................................................ 118 Free Trade Commission Meeting ..................................................................................... 119
North American Free Trade Agreement ................................................................................. 119 Free Trade Commission ....................................................................................................... 119 Commission for Labor Cooperation .................................................................................... 120 Commission for Environmental Cooperation ...................................................................... 120 Dispute Settlement .............................................................................................................. 123
Chapter 11 Dispute Settlement Developments ............................................................... 123 Chapter 19 Dispute Panel Reviews .................................................................................. 123
Trade and Investment Framework Agreements and Other Agreements ............................... 124 Developments in New TIFAs during 2013 ........................................................................... 124 Developments in Existing TIFAs during 2013 ...................................................................... 125 Other Agreements ............................................................................................................... 125
Chapter 5 U.S. Relations with Selected Major Trading Partners ......................... 127 European Union ....................................................................................................................... 127
Transatlantic Trade and Investment Partnership ................................................................ 129 Beef Trade ........................................................................................................................... 131
Canada ..................................................................................................................................... 132 Softwood Lumber ................................................................................................................ 134 Regulatory Cooperation Council ......................................................................................... 135 Intellectual Property ............................................................................................................ 135
China ........................................................................................................................................ 136 Intellectual Property Rights Enforcement ........................................................................... 139 Industrial Policies ................................................................................................................. 140 Export Restraints on Raw Material Inputs .......................................................................... 140 Agriculture ........................................................................................................................... 141 Services ................................................................................................................................ 142 U.S.-China Bilateral Investment Treaty ............................................................................... 143
Mexico ..................................................................................................................................... 144 High Level Economic Dialogue............................................................................................. 146 High-Level Regulatory Cooperation Council ........................................................................ 147
Work Plan ......................................................................................................................... 147 2013 Progress Report ...................................................................................................... 148
Cross-Border Trucking between the United States and Mexico ......................................... 149 Japan ........................................................................................................................................ 150
TPP Negotiations and Dialogue ........................................................................................... 152 Passenger Vehicle Market Access ....................................................................................... 153 Japan Post ............................................................................................................................ 154 Agriculture Products ............................................................................................................ 155
Republic of Korea .................................................................................................................... 156 U.S.-Korea FTA ..................................................................................................................... 158 Beef ...................................................................................................................................... 159
5

Brazil ........................................................................................................................................ 159 Agreement on Trade and Economic Cooperation ............................................................... 161
Taiwan ..................................................................................................................................... 161 U.S.-Taiwan Trade and Investment Framework Agreement ............................................... 162 Beef and Beef Products ....................................................................................................... 164 Rice ...................................................................................................................................... 164
India ......................................................................................................................................... 165 Trade and Investment Dialogue .......................................................................................... 167 Electronic Goods .................................................................................................................. 168 Solar Equipment .................................................................................................................. 168 Intellectual Property Rights ................................................................................................. 169
Bibliography ....................................................................................................... 171
Appendix A Data Tables ..................................................................................... 205
Boxes 3.1 Outline of the WTO Agreement on Trade Facilitation, 2013 ................................................. 76 3.2 Overview of the WTO dispute settlement procedures .......................................................... 86
Figures ES.1 U.S. trade balance in goods and services, 1995–2013 ......................................................... 15 1.1 U.S. real gross domestic product, annual rate of change, 2004–13 ...................................... 34 1.2 Indices of U.S. dollar exchange rates for selected major foreign currencies, daily, 2013 ..... 36 1.3 U.S. merchandise trade with the world, 2011–13 ................................................................. 39 1.4 Leading U.S. merchandise export markets, by share, 2013 .................................................. 41 1.5 Leading U.S. merchandise import sources, by share, 2013 ................................................... 42 1.6 U.S. private cross-border services trade with the world, 2011–13 ....................................... 43 1.7 Leading U.S. export markets for private services, by share, 2013 ........................................ 45 1.8 Leading U.S. import sources for private services, by share, 2013 ......................................... 46 5.1 U.S. merchandise trade with the EU-28, 2009–13 .............................................................. 128 5.2 U.S. private services trade with the EU, 2009-13 ................................................................ 128 5.3 U.S. merchandise trade with Canada, 2009–13................................................................... 133 5.4 U.S. private services trade with Canada, 2009–13 .............................................................. 133 5.5 U.S. merchandise trade with China, 2009–13 ..................................................................... 137 5.6 U.S. private services trade with China, 2009-13 .................................................................. 137 5.7 U.S. merchandise trade with Mexico, 2009–13 ................................................................... 145 5.8 U.S. private services trade with Mexico, 2009-13 ............................................................... 145 5.9 U.S. merchandise trade with Japan, 2009–13 ..................................................................... 151 5.10 U.S. private services trade with Japan, 2009-13 ................................................................ 151 5.11 U.S. merchandise trade with Korea, 2009–13 ................................................................... 157 5.12 U.S. private services trade with Korea, 2009-13................................................................ 157 5.13 U.S. merchandise trade with Brazil, 2009–13 .................................................................... 160 5.14 U.S. private services trade with Brazil, 2009-13 ................................................................ 160 5.15 U.S. merchandise trade with Taiwan, 2009–13 ................................................................. 163 5.16 U.S. private services trade with Taiwan, 2009-13 ............................................................. 163
6

5.17 U.S. merchandise trade with India, 2009–13..................................................................... 166 5.18 U.S. private services trade with India, 2009-13 ................................................................. 166
Tables ES.1 Summary of 2013 trade agreement activities...................................................................... 26 1.1 U.S. merchandise trade with selected major trading partners and the world, 2013 (millions of dollars) ....................................................................................................................... 41 1.2 U.S. private services trade with major trading partners and the world, 2013 (billions of dollars) ........................................................................................................................ 45 2.1 Antidumping duty orders that became effective during 2013 .............................................. 54 2.2 Countervailing duty orders that became effective during 2013 ........................................... 55 2.3 U.S. imports for consumption from GSP beneficiaries, 2011–13 .......................................... 62 2.4 U.S. imports for consumption from AGOA beneficiaries, 2011–13 ....................................... 64 2.5 U.S. imports for consumption from ATPA countries, 2011–13 ............................................. 67 2.6 U.S. imports for consumption from CBERA countries, 2011–13 ........................................... 69 2.7 U.S. imports for consumption of apparel from Haiti, 2011–13 ............................................. 71 3.1 WTO membership in 2013 ..................................................................................................... 82 3.2 WTO observers in 2013 .......................................................................................................... 83 3.3 WTO dispute settlement panels established during 2013 .................................................... 87 3.4 WTO dispute settlement panel and Appellate Body (AB) reports circulated or adopted in 2013 in which the United States was a party ........................................................................... 92 4.1 U.S. merchandise trade with FTA partners, by FTA partner, applicable periods, 2011-13 ....................................................................................................................................... 104 4.2 U.S. imports for consumption entered under FTA provisions, by FTA partner, 2011–13 ...................................................................................................................................... 106 4.3 Status of U.S. FTA negotiations during 2013 ....................................................................... 107 4.4 U.S. merchandise trade with TPP partners, 2011–13 .......................................................... 111 4.5 Active files as of yearend 2013 under Articles 14 and 15 of the North American Agreement on Environmental Cooperation ............................................................................... 122 4.6 NAFTA Chapter 19 binational panels, active reviews as of yearend 2013 .......................... 124
Appendix Tables A.1 U.S. merchandise trade with major trading partners (total exports and general imports), 2013 ............................................................................................................................................ 207 A.2 U.S. merchandise trade with FTA partners (total exports and general imports), 2013 ...... 208 A.3 U.S. merchandise trade with the world, by USITC digest sectors, 2011–13 ....................... 209 A.4 Leading U.S. domestic exports to the world by Schedule B subheading, 2011–13 ............ 210 A.5 Leading U.S. imports for consumption from the world by HTS subheading, 2011–13 ....... 211 A.6 U.S. trade with top 15 single-country trading partners, 2013 ............................................ 212 A.7 Top 15 U.S. single-country export markets and import sources, 2013 ............................... 213 A.8 U.S. private services exports and imports from the world, by category, 2011–13 ............. 214 A.9 Antidumping cases active in 2013, by USITC investigation number ................................... 215 A.10 Antidumping duty orders and suspension agreements in effect as of December 31, 2013 ..................................................................................................................... 217
7

A.11 Countervailing duty cases active in 2013, by USITC investigation number ...................... 222 A.12 Countervailing duty orders in effect as of December 31, 2013 ........................................ 223 A.13 Reviews of existing antidumping and countervailing duty orders completed in 2013, by date of completion ................................................................................................................. 224 A.14 Section 337 investigations and related proceedings completed by the U.S. International Trade Commission during 2013 and those pending on December 31, 2013 ....... 225 A.15 Outstanding Section 337 exclusion orders as of December 31, 2013 ............................... 231 A.16 U.S. imports for consumption under the GSP, by leading GSP beneficiary, 2011–13 ...... 236 A.17 U.S. imports for consumption under the GSP, by USITC digest sectors, 2011–13 ............ 237 A.18 Leading U.S. imports for consumption under the GSP, by HTS provision, 2011–13 ......... 238 A.19 U.S. imports for consumption under AGOA, by source, 2011–13 ..................................... 239 A.20 Leading U.S. imports for consumption under AGOA, by HTS provision, 2011–13 ............ 240 A.21 U.S. imports for consumption under ATPA/ATPDEA, by source, 2011–13 ....................... 241 A.22 Leading U.S. imports for consumption under ATPA/ATPDEA, by HTS provision, 2011–13 ...................................................................................................................................... 242 A.23 U.S. imports for consumption under CBERA/CBTPA, by source, 2011–13 ....................... 243 A.24 Leading U.S. imports for consumption under CBERA/CBTPA, by HTS provision, 2011–13 ...................................................................................................................................... 244 A.25 WTO dispute settlement cases to which the United States was a party, developments in 2013 ........................................................................................................................................ 245 A.26 NAFTA Chapter 19 substantive challenges to original and five-year review determinations of USITC and USDOC, developments in 2013 ................................................... 257 A.27 U.S. merchandise trade with the European Union (28 countries), by USITC digest sectors, 2011–13 ......................................................................................................................... 258 A.28 Leading U.S. domestic exports to the European Union (28), by Schedule B subheading, 2011–13 .................................................................................................................. 259 A.29 Leading U.S. imports for consumption from the European Union (28), by HTS provision, 2011–13 ..................................................................................................................... 260 A.30 U.S. merchandise trade with Canada, by USITC digest sectors, 2011–13 ......................... 261 A.31 Leading U.S. domestic exports to Canada, by Schedule B subheading, 2011–13 ............. 262 A.32 Leading U.S. imports for consumption from Canada, by HTS provision, 2011–13 ........... 263 A.33 U.S. merchandise trade with China, by USITC digest sectors, 2011–13 ............................ 264 A.34 Leading U.S. domestic exports to China, by Schedule B subheading, 2011–13 ................ 265 A.35 Leading U.S. imports for consumption from China, by HTS provision, 2011–13 .............. 266 A.36 U.S. merchandise trade with Mexico, by USITC digest sectors, 2011–13 ......................... 267 A.37 Leading U.S. domestic exports to Mexico, by Schedule B subheading, 2011–13 ............. 268 A.38 Leading U.S. imports for consumption from Mexico, by HTS provision, 2011–13 ........... 269 A.39 U.S. merchandise trade with Japan, by USITC digest sectors, 2011–13 ........................... 270 A.40 Leading U.S. domestic exports to Japan, by Schedule B subheading, 2011–13 ................ 271 A.41 Leading U.S. imports for consumption from Japan, by HTS provision, 2011–13 .............. 272 A.42 U.S. merchandise trade with Korea, by USITC digest sectors, 2011–13 ........................... 273 A.43 Leading U.S. domestic exports to Korea, by Schedule B subheading, 2011–13 ............... 274 A.44 Leading U.S. imports for consumption from Korea, by HTS provision, 2011–13 .............. 275 A.45 U.S. merchandise trade with Brazil, by USITC digest sectors, 2011–13 ............................ 276 A.46 Leading U.S. domestic exports to Brazil, by Schedule B subheading, 2011–13 ................ 277
8

A.47 Leading U.S. imports for consumption from Brazil, by HTS provision, 2011–13 .............. 278 A.48 U.S. merchandise trade with Taiwan, by USITC digest sectors, 2011–13 ......................... 279 A.49 Leading U.S. domestic exports to Taiwan, by Schedule B subheading, 2011–13 ............. 280 A.50 Leading U.S. imports for consumption from Taiwan, by HTS provision, 2011–13 ............ 281 A.51 U.S. merchandise trade with India, by USITC digest sectors, 2011–13 ............................. 282 A.52 Leading U.S. domestic exports to India, by Schedule B subheading, 2011–13 ................. 283 A.53 Leading U.S. imports for consumption from India, by HTS provision, 2011–13 ............... 284
9

10

Abbreviations and Acronyms Acronyms Term AB Appellate Body (WTO) ACTA Anti-Counterfeiting Trade Agreement AD antidumping AGOA African Growth and Opportunity Act AI avian influenza APEC Asia-Pacific Economic Cooperation APHIS Animal and Plant Health Inspection Service (USDA) ARRA American Recovery and Reinvestment Act ASEAN Association of Southeast Asian Nations ATPA Andean Trade Preference Act ATPDEA Andean Trade Promotion and Drug Eradication Act BEA Bureau of Economic Analysis (USDOC) BECC Border Environment Cooperation Commission (NAFTA) BIT Bilateral Investment Treaty BOP balance of payments BSE bovine spongiform encephalopathy CAFTA-DR Dominican Republic-Central America-United States Free Trade Agreement CARICOM Caribbean Community and Common Market CBERA Caribbean Basin Economic Recovery Act CBI Caribbean Basin Initiative CBTPA Caribbean Basin Trade Partnership Act CCA Consultative Committee on Agriculture CEC Commission for Environmental Cooperation (NAFTA) CITES Convention on International Trade in Endangered Species of Wild Fauna and Flora CLC Commission for Labor Cooperation (NAFTA) CNL competitive need limitation C-Si crystalline silicon COOL country of origin labeling CSQ country-specific quota CTD Committee on Trade and Development (WTO) CTI Committee on Trade and Investment (APEC) DDA Doha Development Agenda (WTO) DSB Dispute Settlement Body (WTO) DSU Dispute Settlement Understanding (WTO) DFQF duty-free, quota-free EAC Environmental Affairs Council EC European Communities ECA Environmental Cooperation Agreement ECOWAS Economic Community of West African States EDA Economic Development Administration (USDOC) EIAP Earned Import Allowance Program ETA Employment and Training Administration (USDOL) EU European Union FAO Food and Agriculture Organization (UN) FAS Foreign Agricultural Service (USDA)
11

FDI foreign direct investment Fed. Reg. Federal Register FMCSA Federal Motor Carrier Safety Administration FTA free trade agreement FTAA Free Trade Area of the Americas FTAAP Free Trade Area of the Asia-Pacific FTC Free Trade Commission (CAFTA-DR, NAFTA, Peru TPA) FY fiscal year G20 Group of 20 (OECD) GATT General Agreement on Tariffs and Trade GDP gross domestic product GPA Agreement on Government Procurement (WTO) GPS global positioning system GSP Generalized System of Preferences GVC global value chain HELP Haiti Economic Lift Program HLC High Level Committee HLED High Level Economic Dialogue HLWG High-Level Working Group on Jobs and Growth HOPE Haitian Hemispheric Opportunity through Partnership Encouragement Act HS Harmonized Commodity Description and Coding System (international) HTS Harmonized Tariff Schedule of the United States ICSID International Centre for the Settlement of Investment Disputes ICT information and communications technology IIS Internet Information Services ILO International Labor Organization IMF International Monetary Fund IPR intellectual property rights IT information technology ITA Information Technology Agreement (WTO) ITA International Trade Administration (USDOC) JCCT Joint Commission on Commerce and Trade JCEC Joint Commission for Environmental Cooperation JECFA Joint FAO/WHO Expert Committee on Food Additives JNNSM Jawaharlal Nehru National Solar Mission (India) KORUS FTA U.S.-Korea Free Trade Agreement LAC Labor Affairs Council LCIA London Court of International Arbitration LDBDC least-developed beneficiary developing country LDC least-developed country LTFV less than fair value MEA multilateral environmental agreement Mercosur Common Market of the South MFN most-favored nation MOU memorandum of understanding MRL maximum residue limit mt metric tons NAAEC North American Agreement on Environmental Cooperation (NAFTA) NAALC North American Agreement on Labor Cooperation (NAFTA)
12

NAC National Advisory Committee (NAFTA) NADB North American Development Bank (NAFTA) NAEC New Approach to Economic Challenges NAFTA North American Free Trade Agreement NAO National Administrative Office (NAFTA) n.e.s.o.i. not elsewhere specified or included NTB nontariff barrier NTR normal trade relations OECD Organisation for Economic Co-operation and Development OIE World Organisation for Animal Health (Office International des Epizooties) OTEXA Office of Textiles and Apparel (USDOC) OTLA Office of Trade and Labor Affairs (NAFTA) PHP Preferential Handling Procedure PSU Policy Support Unit Pub. L. Public Law RCC Regulatory Cooperation Council S&ED Strategic and Economic Dialogue (China) SCM Subsidies and Countervailing Measures SEM Submissions on Environmental Measures (NAFTA) SLA Softwood Lumber Agreement SME Sindicato Mexicano de Electristas (NAFTA) SMEs small and medium-sized enterprises SPS sanitary and phytosanitary (standards) SSA sub-Saharan Africa STAN Structural Analysis database (OECD) STAR Service Trade Access Requirements TAA Trade Adjustment Assistance TAAEA Trade Adjustment Assistance Extension Act TBT technical barriers to trade TICFA Trade and Investment Cooperation Forum Agreement TIFA Trade and Investment Framework Agreement TISA Trade in Services Agreement TIVA Trade in Value-Added Terms TPA trade promotion agreement TPF U.S.-India Trade Policy Forum TPL tariff preference level TPP Trans-Pacific Partnership TPSC Trade Policy Staff Committee TRIPS Trade-Related Aspects of Intellectual Property Rights (WTO) TRQ tariff-rate quota TTIP Transatlantic Trade and Investment Partnership (EU) UN United Nations U.S.C. United States Code USAID U.S. Agency for International Development USCBP United States Customs and Border Protection (USDHS) USDA United States Department of Agriculture USDHS United States Department of Homeland Security USDOC United States Department of Commerce USDOL United States Department of Labor
13

USDOS United States Department of State USDOT United States Department of Transportation USFDA United States Food and Drug Administration USITC United States International Trade Commission USTR United States Trade Representative WCO World Customs Organization WHO World Health Organization (UN) WIPO World Intellectual Property Organization WTO World Trade Organization WUPP Wood Use Points Program
14

Executive Summary The U.S. trade deficit for goods and services fell from $535.0 billion in 2012 to $475.0 billion in 2013 on a balance-of-payments basis. The deficit on goods fell from $741.5 billion in 2012 to $703.9 billion in 2013, well below the $835.7 billion record set in 2006. At the same time, the U.S. surplus on services rose from $206.8 billion in 2012 to a new record of $229.0 billion in 2013 (figure ES.1).
U.S. trade in goods and services grew in 2013, but the rate of growth was significantly lower than in 2012. Generally slower growth in many foreign countries led to a smaller expansion in U.S. exports in 2013. The decline in U.S. imports of petroleum and petroleum-related products led to similarly lower growth in total U.S. imports of goods in 2013 compared to 2012. The U.S. economic recovery that began in the summer of 2009 continued as real gross domestic product (GDP) grew by 1.9 percent in 2013. However, this rate of growth was less than the 2.8 percent U.S. growth realized in 2012, due in part to a decline in government spending. The pace of global economic growth also slowed, from 3.2 percent in 2012 to 3.0 percent in 2013.
Figure ES.1 U.S. trade balance in goods and services, 1995–2013
Source: USDOC Note: Merchandise trade data are on a balance-of-payments basis.
-1,000
-800
-600
-400
-200
0
200
400
Billi
on $
U.S. services trade balance
U.S. goods trade balance
15

The U.S. dollar appreciated 3.3 percent during 2013 against a broad trade-weighted index of foreign currencies. By yearend, the dollar had fallen against the Chinese yuan, the euro, and the pound sterling by 2–4 percent, but had appreciated against the Japanese yen by 20.8 percent. Currency movements were uneven during the year. Responding to financial market developments, as well as concerns about fiscal stresses in Europe and the global economic outlook, the dollar appreciated in the first, second, and fourth quarters and fell in the third quarter of 2013.
A summary of U.S. trade agreement activities in 2013 is presented below, followed by a table summarizing key developments on a monthly basis for the year (table ES.1). Trade agreement activities during 2013 included the administration of U.S. trade laws and regulations; U.S. participation in the World Trade Organization (WTO), the Organisation for Economic Co-operation and Development (OECD), and the Asia-Pacific Economic Cooperation (APEC) forum; U.S. negotiation of and participation in free trade agreements (FTAs); and bilateral developments with major trading partners.
Complementing the release of the Year in Trade 2013 report, the USITC has developed a series of dashboards in MS Excel available online that present U.S. merchandise trade data in an interactive format. Readers will be able to conduct further analysis of U.S. merchandise trade with specific trading partners and U.S. trade under specific trade preference programs using these dashboards, which can be found on the Commission’s website, www.usitc.gov/publications/dashboards.
Key Trade Developments in 2013 Administration of U.S. Trade Laws and Regulations Safeguard actions: The Commission conducted no new safeguard investigations during 2013, and no U.S. safeguard measures under these provisions were in effect during any part of 2013. In addition, by statute, the authority to conduct investigations and apply measures under the China safeguards provision in section 421 of the Trade Act of 1974 ceased to be effective on December 11, 2013.
Antidumping duty investigations: The Commission instituted 42 new preliminary antidumping investigations and completed 10 final investigations during 2013. Antidumping duty orders were issued by the U.S. Department of Commerce (USDOC) in 8 of the final investigations on five products from five countries.
Countervailing duty investigations: The Commission instituted 14 new preliminary countervailing duty investigations and completed 12 final investigations during 2013. Countervailing duty orders were issued by the USDOC in 4 of the final investigations on four products from three countries.
Sunset reviews: During 2013, the Commission instituted 50 sunset reviews of existing antidumping duty and countervailing duty orders and suspension agreements. The Commission
16

completed 26 reviews, resulting in 22 antidumping duty and countervailing duty orders being continued for up to five additional years.
Section 337 investigations: During calendar year 2013, there were 109 active section 337 investigations and ancillary proceedings, 53 of which were instituted that year. Of these 53 new proceedings, 42 were new section 337 investigations and 11 were new ancillary proceedings relating to previously concluded investigations. The Commission completed a total of 55 investigations and ancillary proceedings in 2013 and issued 9 exclusion orders and 25 cease and desist orders. Slightly less than 40 percent of the active proceedings in 2013 involved computer and telecommunications equipment, while consumer electronics products, small consumer items, and pharmaceuticals and medical products each accounted for slightly more than 10 percent of the proceedings. At the close of 2013, 54 section 337 investigations and ancillary proceedings were pending at the Commission.
Trade Adjustment Assistance: In fiscal year (FY) 2013, the U.S. Department of Labor (USDOL) received 1,480 petitions for Trade Adjustment Assistance (TAA) for workers claiming harm from imports, on par with the 1,465 petitions received in FY 2012. USDOL certified 1,025 petitions as eligible for TAA covering 104,158 workers, and denied 279 petitions covering 23,628 workers. The TAA for Firms program also aided companies seeking technical assistance in expanding markets, strengthening their operations, or otherwise increasing their global competitiveness.
Trade Preference Programs Generalized System of Preferences (GSP): Imports from developing countries for which GSP treatment was claimed totaled $18.5 billion in 2013, accounting for 6.7 percent of total U.S. imports from GSP beneficiary countries and 0.8 percent of total imports from all trading partners. India was the leading GSP beneficiary in 2013, followed by Thailand and Brazil. On April 16, USTR initiated a review for the possible addition of Laos and Burma to the GSP program, and on June 27, Bangladesh was suspended from the GSP program because of worker rights issues. Authorization for the GSP program lapsed on July 31, 2013, and has not been renewed.
African Growth and Opportunity Act (AGOA): In 2013, 39 sub-Saharan African (SSA) countries were designated as eligible for AGOA benefits, and 27 SSA countries were designated eligible for AGOA textile and apparel benefits. South Sudan became eligible for AGOA benefits as of December 20, 2012, while Guinea-Bissau and Mali lost eligibility for AGOA benefits on January 1, 2013. In December 2013, the President announced that Mali would be reinstated on January 1, 2014, due to its inauguration of a democratically elected president in July 2013. Duty-free U.S. imports under AGOA, including those covered by GSP, were valued at $26.8 billion in 2013. U.S. imports under AGOA, excluding imports also covered by GSP, were valued at $24.8 billion, down 24.3 percent from 2012. This decrease was driven mainly by a decline in the value of U.S. imports of petroleum-related products, which made up 85.4 percent of imports under AGOA in 2013. Nigeria and Angola were the largest suppliers under AGOA in 2013.
Andean Trade Preference Act (ATPA): The President’s authority to provide preferential treatment under ATPA, including the Andean Trade Promotion and Drug Eradication Act
17

(ATPDEA), expired on July 31, 2013. Ecuador was the only country still eligible to receive trade preferences under ATPA during 2013. Colombia and Peru had previously lost eligibility following the entry into force of free trade agreements with the United States, and Bolivia’s eligibility had been suspended. However, the government of Ecuador announced on June 27, 2013, that it would withdraw from the ATPA program. In light of Ecuador’s withdrawal, and the expiration of the President’s authority to provide preferential treatment, U.S. imports under ATPA declined 77.7 percent in 2013 to $2.5 billion. Crude petroleum and petroleum products accounted for the overwhelming share (89.3 percent) of U.S. imports under ATPA in 2013.
Caribbean Basin Economic Recovery Act (CBERA): At yearend 2013, 17 countries and dependent territories were eligible for CBERA preferences, and 8 of those countries were eligible for additional preferences under the Caribbean Basin Trade Partnership Act (CBTPA). Curaçao became eligible for both CBERA and CBTPA preferences on December 31, 2013. U.S. imports under CBERA (including CBTPA) fell by 24.4 percent, from $3.1 billion in 2012 to $2.4 billion in 2013, reflecting a decline in the value of U.S. imports of crude petroleum, knitted apparel products, undenatured ethyl alcohol, and melamine, which are major imports from CBERA countries. Additionally, Panama left CBERA on October 31, 2012, when the U.S.-Panama TPA entered into force, and was thus not eligible for CBERA benefits during any part of 2013. Trinidad and Tobago continued to be the leading supplier of U.S. imports under CBERA in 2013, accounting for 69.2 percent of the total. Haiti and The Bahamas were also leading suppliers.
Haiti initiatives: Haiti accounted for nearly all U.S. imports of apparel entering under CBTPA. U.S. imports of apparel from Haiti were up 4.9 percent from 2012; these imports totaled $765.9 million, of which $341.7 million entered under CBTPA. U.S. imports of apparel entering under the Haitian Hemispheric Opportunity through Partnership Encouragement Acts (HOPE I and II) and the Haiti Economic Lift Program (HELP), which added special provisions to CBERA, rose by almost 40 percent in 2013 to $421.9 million. U.S. imports of apparel from Haiti under the Earned Import Allowance Program almost tripled to $90.0 million in 2013.
WTO, OECD, APEC, and TISA WTO developments: The World Trade Organization held its Ninth Ministerial Conference in Bali, Indonesia, from December 3 to 7, 2013, extending its scheduled conclusion by one day to reach agreement on a package of trade measures. Members concluded an Agreement on Trade Facilitation to expedite the movement, release, and clearance of goods, and to improve cooperation on customs matters among WTO members. They also reached a number of decisions in agriculture and in trade and economic development, in particular for the least-developed countries. Discussions during the year concerning WTO plurilateral agreements focused on bringing the revised Agreement on Government Procurement into force (which occurred on April 6, 2014), as well as negotiations to expand coverage of products under the Information Technology Agreement (ITA). In WTO-related negotiations, talks among the 27 participants looking to conclude an expansion of the Information Technology Agreement were suspended twice during 2013, first in July and again in November, largely over China’s inability to accept terms under discussion to expand coverage to a number of products. Laos and Tajikistan acceded to the WTO in 2013; Yemen, whose accession will raise membership to 160,
18

was invited to accede in December. The WTO also appointed a new Director-General, Roberto Azevêdo, to a four-year term that started December 1, 2013.
WTO dispute settlement: During 2013, WTO members filed 20 new requests for WTO dispute settlement consultations, compared to 27 in 2012. The United States was the complainant in 3 of the 20 requests filed during 2013, and the named respondent in 2. Two of the 3 new requests filed by the United States during 2013 concerned measures taken by Indonesia, both relating to Indonesia’s restrictions on importation of horticultural products, animals, and animal products. The third dispute concerned measures by India affecting solar cells and solar modules.
The United States was the named respondent in two new disputes filed during 2013, one filed by Korea and one by China. There were 12 new dispute settlement panels established during 2013; the United States was the complaining party in 2 of these panel proceedings and the responding party in 2.
OECD developments: The 34 OECD members held their OECD Council at the ministerial level in Paris, France, on May 29–30, 2013. Attendees looked at the New Approach to Economic Challenges, which focuses on incorporating broader social factors affecting skilled labor––such as education, environment, and gender equality––into the assumptions the OECD uses to gauge economic growth. In 2013, the OECD Trade Committee considered key projects underway, such as the Services Trade Restrictiveness Index as well as the OECD-WTO Trade in Value Added (TIVA) database. A joint project launched with the WTO in January, TIVA aims to quantify the value added to goods and services by source country as they pass through stages of global value chains.
APEC developments: APEC was chaired by Indonesia throughout 2013. Member economies focused on increasing regional economic integration; promoting physical, institutional, and people-to-people connectivity; and achieving sustainable, equitable growth in the region. APEC continued to work toward the 2015 goal of reducing applied tariffs on a list of environmental goods while focusing on the capacity-building needs of member countries. APEC’s annual summit in October 2013 served as a forum for discussing progress toward the Free Trade Area of the Asia-Pacific, and for leaders of countries negotiating the Trans-Pacific Partnership (TPP) to reaffirm their commitment to a 21st-century trade agreement.
Trade in Services Agreement: In 2013, 23 countries, including the United States, began negotiating a new agreement aimed at promoting international trade in services. Four rounds of negotiations were held in 2013.
U.S. Free Trade Agreements U.S. FTAs in force in 2013: The United States was a party to 14 FTAs with 20 countries as of December 31, 2013. These include the U.S.-Panama TPA (2012); the U.S.-Colombia TPA (2012); the U.S.-Korea FTA (2012); the U.S.-Oman FTA (2009); the U.S.-Peru TPA (2009); a multiparty FTA with the countries of Central America and the Dominican Republic (CAFTA-DR) that entered into force first with the Dominican Republic, El Salvador, Guatemala, Honduras, and Nicaragua
19

(2006–07) and then with Costa Rica (2009); the U.S.-Bahrain FTA (2006); the U.S.-Morocco FTA (2006); the U.S.-Australia FTA (2005); the U.S.-Chile FTA (2004); the U.S.-Singapore FTA (2004); the U.S.-Jordan FTA (2001); the North American Free Trade Agreement (NAFTA) with Canada and Mexico (1994); and the U.S.-Israel FTA (1985).
FTA developments: During 2013, four rounds of negotiations were held related to the TPP. The United States and the other TPP partners reached an agreement to bring Japan into the TPP negotiations with the 11 current participants––Australia, Brunei Darussalam, Chile, Malaysia, New Zealand, Peru, Singapore, Vietnam, Mexico, Canada, and the United States. In addition, TPP partners welcomed Korea’s formal announcement of its interest in joining the TPP.
Three rounds of negotiations for the Transatlantic Trade and Investment Partnership (TTIP) were held with the European Union (EU) in 2013. Discussions in these three rounds concerned the possible structure of the agreement, how chapters and specific issues might be handled, and pinpointing areas of common ground for text-based discussions. The negotiators also met with stakeholders.
FTA merchandise trade flows with FTA partners: Two-way merchandise trade (exports and imports) between the United States and its FTA partners amounted to $1.4 trillion, or 39.1 percent of total U.S. merchandise trade in 2013. The NAFTA countries––Canada and Mexico––dominated U.S. trade with FTA partners in 2013, accounting for 73.9 percent of total U.S. merchandise trade with U.S. FTA partners, or $1.0 trillion. In 2013, U.S. merchandise exports to the NAFTA partners expanded by 3.3 percent and imports by 2.4 percent, resulting in a decline in the U.S. merchandise trade deficit with the NAFTA partners to $177.2 billion. Leading U.S. exports to the NAFTA countries included petroleum products, aircraft, and motor vehicles, while the leading U.S. imports were crude petroleum and motor vehicles.
U.S. two-way merchandise trade with FTA partners other than the NAFTA countries amounted to $368.7 billion in 2013, representing an increase of 8.7 percent from 2012. U.S. imports from these FTA partners rose 10.5 percent to $185.8 billion, while U.S. exports rose 7.0 percent to $182.9 billion. Leading U.S. exports to the non-NAFTA FTA partners included petroleum products, aircraft, and processors or controllers, while the leading U.S. imports from these countries were crude petroleum, diamonds, and motor vehicles. The United States registered a merchandise trade deficit with these partners of $3.0 billion in 2013, whereas it had a trade surplus of $2.7 billion in 2012. This change was largely due to sharply reduced exports of machinery and equipment to Australia in 2013.
NAFTA developments: All of NAFTA’s provisions were fully implemented as of January 1, 2008, with the exception of the NAFTA cross-border trucking provisions; the current pilot program for cross-border trucking with Mexico is ongoing, but is scheduled to end in October 2014. (Developments in the trucking provisions in 2013 are described in the Mexico section below). The NAFTA Free Trade Commission typically meets annually, but did not meet in 2013. At the end of 2013, nine files remained active under articles 14 and 15 of the North American Agreement on Environmental Cooperation, one of which was submitted in 2013.
20

NAFTA dispute settlement: In 2013, there were five active Chapter 11 (investor-state disputes) cases filed against the United States, four of them filed by Canadian investors and one filed by Mexican investors. Additionally, four cases were filed by U.S. investors against Canada and none were filed against Mexico. At the end of 2013, the NAFTA Secretariat listed four active binational panels under Chapter 19; these are reviews of final determinations made by national authorities in antidumping and countervailing duty cases. Two of the four active cases challenged the Mexican agency’s determinations on products from the United States. A third case challenged U.S. agencies’ determinations on products from Canada, and a fourth challenged U.S. agencies’ determinations on products from Mexico. No binational panels were formed in 2013 under Chapter 19.
Trade Activities with Major Trading Partners European Union The EU as a unit1 continued to be the United States’ largest two-way merchandise trading partner in 2013. U.S. merchandise trade with the EU was $613.3 billion in 2013, which accounted for 17.0 percent of total U.S. merchandise trade. U.S. merchandise exports to the EU totaled $231.7 billion, ranking the EU second to Canada, while the value of U.S. merchandise imports from the EU was $381.6 billion, second to China. As a result, the U.S. merchandise trade deficit with the EU was $149.9 billion in 2013. Leading U.S. exports to the EU included aircraft and parts, petroleum-related products, certain medicaments (medicines), passenger motor vehicles, blood fractions (e.g., antiserum), and coal. Leading U.S. imports included passenger motor vehicles, petroleum-related products, certain medicaments, and turbojets and parts. The EU was also the United States’ largest trading partner in terms of services in 2013, accounting for 32.8 percent of total trade in private services.2 The United States registered a trade surplus in services with the EU of $60.5 billion in 2013.
The major focus of the U.S.-EU trade relationship in 2013 was the launch of negotiations on a comprehensive trade and investment agreement, TTIP. The two sides also addressed issues related to beef trade, including extending an expanded EU tariff-rate quota on imports of U.S. high-quality beef.
Canada In 2013, Canada continued to be the United States’ largest single-country two-way merchandise trading partner. Total two-way merchandise trade was valued at $584.6 billion, accounting for 16.2 percent of U.S. trade with the world. U.S. merchandise exports to Canada amounted to $251.7 billion in 2013, and U.S. merchandise imports from Canada were $332.9 billion. The resulting merchandise trade deficit of $81.2 billion was little changed from deficits in 2012 ($79.3 billion) and 2011 ($82.6 billion). Leading U.S. merchandise exports to Canada included
1 The 28 members of the EU in 2013 were Austria, Belgium, Bulgaria, Croatia, Cyprus, the Czech Republic, Denmark, Estonia, Finland, France, Germany, Greece, Hungary, Ireland, Italy, Latvia, Lithuania, Luxembourg, Malta, the Netherlands, Poland, Portugal, Romania, Slovakia, Slovenia, Spain, Sweden, and the United Kingdom. 2 The services trade data reported for the EU and other countries are based on trade in private services, which exclude government sales and purchases of services.
21

passenger and transport motor vehicles and related parts, and petroleum-related products, followed by civilian aircraft and related products. Major U.S. merchandise imports from Canada were raw material and energy products, as well as passenger motor vehicles and their parts. Canada was also the United States’ second-largest single-country partner for services in 2013 after the United Kingdom, valued at $93.3 billion, accounting for 8.6 percent of U.S. trade in services with the world.
In December 2013, Canada and the United States submitted a joint request for arbitration under the 2006 Canada-United States Softwood Lumber Agreement. This request was to determine if compensatory amounts awarded in a 2011 dispute case should continue beyond the original 2013 expiration of the agreement, in light of the agreement’s two-year extension (signed in January 2012). Canada also reintroduced intellectual property rights (IPR) legislation into Parliament to allow Canadian customs officials to take legal action against counterfeit trademark and pirated copyright goods transshipped through Canada to other countries, in particular the United States.
China In 2013, China was the United States’ second-largest single-country two-way merchandise trading partner. U.S. merchandise trade with China was $552.5 billion, which accounted for 15.3 percent of U.S. trade with the world. The United States’ bilateral trade deficit with China, which rose by $2.4 billion to $323.8 billion in 2013, remained higher than the U.S. deficit with any other single-country trading partner. U.S. merchandise exports to China were $114.3 billion, and U.S. merchandise imports from China amounted to $438.1 billion in 2013. Leading U.S. exports were soybeans, aircraft and parts, motor vehicles, metal waste and scrap, and cotton. Leading U.S. imports were computers and computer parts, cellphones, telecommunication equipment, toys, video games, and footwear. The United States ran a services trade surplus with China in 2013, which amounted to $19.2 billion, compared to $17.0 billion in 2012.
China’s compliance with its WTO commitments remained a focus of U.S.-China trade relations in 2013. Notable U.S. concerns were China’s IPR enforcement, industrial policies, export restraints on raw material inputs, import bans on certain U.S. agricultural products, and barriers to entry affecting services sectors. In July 2013, at the fifth U.S.-China Strategic and Economic Dialogue, the United States and China announced they intended to negotiate a bilateral investment treaty that would provide national treatment at all phases of investment.
Mexico In 2013, Mexico was the United States’ third-largest single-country two-way merchandise trading partner. With total two-way merchandise trade valued at $459.4 billion, Mexico accounted for 12.7 percent of U.S. trade with the world. U.S. merchandise exports to Mexico totaled $181.7 billion in 2013, and U.S. merchandise imports from Mexico amounted to $277.7 billion, resulting in a merchandise trade deficit of $96.0 billion. In 2013, leading U.S. exports to Mexico included transportation equipment, particularly automotive trade; chemicals and related products; energy-related products; and electronic products. Leading U.S. imports from
22

Mexico included transportation equipment, electronic products, energy-related products, machinery, computers, televisions, cellphones, and nonmonetary gold. The United States had a services trade surplus of $11.7 billion with Mexico in 2013.
On May 2, 2013, the presidents of the United States and Mexico announced the formation of the High Level Economic Dialogue (HLED), whose goal is to promote competitiveness and connectivity; foster economic growth, productivity, entrepreneurship, and innovation; and build a partnership for regional and global leadership. On August 15, 2013, the U.S.-Mexico High-Level Regulatory Cooperation Council published its first “Progress Report to Leaders,” including an appendix on regulations for nanotechnologies. The report recounts meetings held during 2012–13 and details the current status of regulatory cooperation activities and discussions related to seven sector issues.
To address cross-border trucking between the United States and Mexico, the Federal Motor Carrier Safety Administration (FMCSA) announced the authorization of Mexico-domiciled motor carriers to transport cargo throughout the United States (long-haul operations) under a pilot program in 2011. As of December 2013, FMCSA had active long-haul operating authority for 14 Mexican-domiciled motor carriers. These carriers had a total of 56 participating vehicles authorized to operate throughout the United States, and the trucks underwent a total of 4,209 inspections.
Japan In 2013, two-way U.S. merchandise trade with Japan—the United States’ fourth-largest single-country trading partner—was valued at $197.6 billion, accounting for 5.5 percent of U.S. merchandise trade with the world. U.S. merchandise exports to Japan were $59.7 billion in 2013, and U.S. merchandise imports from Japan were $138.0 billion, resulting in a trade deficit of $78.3 billion. Leading U.S. merchandise exports to Japan included aircraft and parts, certain medicines, pork, corn, wheat, and soybeans. Leading U.S. imports from Japan included passenger vehicles and parts, aircraft parts, parts for printers and copying machines, and heavy construction equipment. Japan was the United States’ third-largest single-country trading partner in services in 2013, and the United States’ services trade surplus with Japan was $18.6 billion.
U.S.-Japanese economic dialogue was driven by Japan’s consultations toward joining the TPP negotiations in the first half of 2013, and continued during the second half of the year through bilateral negotiations that ran parallel to the multilateral TPP negotiations. Japan’s entry into TPP negotiations was accompanied by several points of progress in long-standing trade irritants between the United States and Japan, including a substantial expansion of market access for U.S. beef and several practical measures concerning the Japanese automotive and insurance sectors. Dialogue continued on these issues throughout the year as the two countries refocused their economic engagement on the negotiation of a free trade agreement.
23

Korea In 2013, Korea was the United States’ sixth-largest single-country two-way trading partner, with two-way merchandise trade valued at $101.0 billion, accounting for 2.8 percent of U.S. trade with the world. U.S. merchandise exports to Korea were valued at $39.0 billion and U.S. merchandise imports from Korea were valued at $62.0 billion, resulting in a merchandise trade deficit of $23.0 billion. Leading U.S. exports to Korea included aircraft and parts, processors, machines for the production of electronic integrated circuits and semiconductors, ferrous waste and scrap, medicaments, and coal. Leading U.S. imports from Korea included automobiles and parts, cellphones, petroleum oils, electronic integrated circuits, and parts for automatic data processing machines. The United States reported an overall trade surplus in services with Korea of $11.1 billion in 2013.
In 2013, the second round of tariff cuts occurred under the U.S.-Korea FTA (KORUS FTA), and 12 of the 19 KORUS FTA committees and working groups held meetings. In November 2013, Korea expressed interest in joining the TPP.
Brazil In 2013, Brazil maintained its position as the United States’ ninth-largest single-country two-way merchandise trading partner. Two-way merchandise trade with Brazil was valued at $64.5 billion in 2013, accounting for 1.8 percent of total U.S. merchandise trade with the world. U.S exports to Brazil in 2013 were valued at $37.6 billion, while U.S imports from Brazil decreased by over 15 percent to $26.9 billion. As a result, the United States recorded a $10.8 billion surplus in merchandise trade in 2013, an increase of 95 percent from 2012. Leading U.S. exports to Brazil included aircraft and parts, petroleum-related oils and refined petroleum products, wheat, coal, medicaments, and propane. In 2013, as a result of a poor wheat crop in neighboring Argentina, exports of U.S. wheat to Brazil increased over 9,000 percent from 2012, reaching a value of $1.2 billion—the highest level in 30 years. Leading U.S. imports from Brazil included petroleum-related products, semifinished iron products, ethyl alcohol, unroasted coffee, and non-alloy pig iron. In 2013, the U.S. trade surplus in services with Brazil increased to $17.4 billion.
In 2013, Brazil and the United States held the second meeting of the Commission on Economic and Trade Relations under the Agreement on Trade and Economic Cooperation. Brazil’s temporary tariff increase on 100 products, imposed in 2012 on products imported from outside Mercosur (the South American common market), ended. The USDA proposed to allow fresh beef from certain parts of Brazil to be imported.
Taiwan In 2013, Taiwan remained the United States’ 11th-largest single-economy two-way merchandise trading partner. U.S. two-way merchandise trade with Taiwan was $60.8 billion in 2013, which accounted for 1.7 percent of U.S. trade with the world. The United States’ bilateral trade deficit with Taiwan, which had risen considerably in 2011, dropped to $16.9 billion in 2012 and $14.3 billion in 2013. U.S. merchandise exports to Taiwan amounted to $23.3 billion
24

in 2013, a 6.6 percent increase from 2012. U.S. merchandise imports from Taiwan amounted to $37.5 billion in 2013, a 3.1 percent decrease from 2012. Leading U.S. exports were manufacturing-related semiconductor machines and instruments; ferrous waste and scrap; aircraft and parts; light oils; soybeans; and military weapons and munitions. Leading U.S. imports were cellphones, memory chips, electronic integrated circuits, processors, and radio navigational aid apparatus (GPS devices). The United States ran a services trade surplus with Taiwan in 2013, which amounted to $4.0 billion, compared to $3.9 billion the year before.
In 2013, the United States and Taiwan resumed high-level meetings under the U.S.-Taiwan Trade and Investment Framework Agreement. The United States also continued work with Taiwan to provide full market access for U.S. beef and beef products consistent with World Organisation for Animal Health (OIE) guidelines for bovine spongiform encephalopathy (BSE), based on a bilateral protocol negotiated in 2009. Additionally, the United States engaged Taiwan on issues related to Taiwan’s inconsistent grading practice for imports of U.S. rice under a country-specific quota.
India U.S. two-way merchandise trade with India—the United States’ 12th-largest single-country trading partner—was valued at $58.4 billion, accounting for 1.6 percent of U.S. merchandise trade with the world. U.S. merchandise exports amounted to $16.9 billion in 2013, and U.S. merchandise imports from India were $41.5 billion, resulting in a merchandise trade deficit of $24.5 billion. Leading U.S. exports to India included aircraft and parts; nonmonetary gold; certain petroleum products used to manufacture tires; coal; and almonds. Leading U.S. imports from India included nonindustrial diamonds, certain medicines, light oils and preparations, mucilages and thickeners, and jewelry. India was the only major U.S. trading partner with which the United States had a deficit in services trade—$6.0 billion—in 2013.
The United States and India addressed several areas of concern using bilateral high-level meetings and multilateral forums in 2013. Of particular concern to the United States were localization and testing requirements in various electronic goods sectors as well as the solar energy sector. The United States continued to monitor India’s IPR protection policies, including those covering foreign company patent protection and copyright protection.
25

Table ES.1 Summary of 2013 trade agreement activities
January
8: The Generalized System of Preferences (GSP) subcommittee of the Trade Policy Staff Committee (TPSC) requests public comments on the effect of withdrawal, suspension, or limitation of GSP benefits for Bangladesh.
9: The United States and Chile convene the sixth meeting of the U.S.-Chile Environmental Affairs Council and the fourth meeting of the U.S.-Chile Joint Commission for Environmental Cooperation in Santiago, Chile.
10: The United States requests World Trade Organization (WTO) dispute settlement consultations with Indonesia concerning certain measures Indonesia imposes on the importation of horticultural products, animals, and animal products (DS455).
11: The United States and Peru reach agreement on a five-point action plan to support Peru’s forestry sector reform efforts and to further Peru’s implementation of its obligations under the U.S.-Peru Trade Promotion Agreement (TPA) Annex on Forest Sector Governance.
15: United States Trade Representative (USTR) Kirk notifies Congress of the Obama Administration’s intent to enter into negotiations for a Trade in Services Agreement (TISA) with 20 trading partners.
16: The United States and Thailand conclude a two-day meeting under their Trade and Investment Framework Agreement (TIFA), agreeing to expand cooperation on bilateral, regional, and multilateral issues in order to increase trade and investment and support the creation and retention of jobs in both countries.
28: The WTO Dispute Settlement Body (DSB) establishes a panel at the request of Argentina concerning certain measures the United States imposes on the importation of animals, meat, and other animal products from Argentina (DS447).
28: The WTO DSB establishes a single panel at the request of the United States, the European Union (EU), and Japan concerning certain measures Argentina imposes on the importation of goods (DS438, DS444, DS445).
28: The United States and Jordan agree to a set of joint principles for international investment, as well as joint principles for information and communication technology (ICT) services.
28: USTR Kirk and U.S. Agricultural Secretary Vilsack announce that the United States and Japan have agreed on new terms and conditions for exports of U.S. beef and beef products to Japan, which will pave the way for expanded exports to Japan.
February
6: The United States requests WTO dispute settlement consultations with India concerning certain measures of India relating to domestic content requirements for solar cells and solar modules (DS456).
26

February—continued
11: U.S.-EU High-Level Working Group on Jobs and Growth publishes its final report recommending the initiation of formal domestic procedures to launch negotiations on a comprehensive trade and investment agreement.
13: President Obama, European Council President Van Rompuy, and European Commission President Barroso announce the decision to initiate internal procedures necessary to launch negotiations on a Transatlantic Trade and Investment Partnership (TTIP).
14: The United States and South Korea convene the first meeting of the Environmental Affairs Council under the U.S.-Korea Free Trade Agreement (KORUS FTA).
27: The United States and Afghanistan meet to continue their dialogue and evaluate progress under the United States-Afghanistan TIFA.
March
1: USTR submits the Administration’s 2013 Trade Policy Agenda and 2012 Annual Report to Congress.
4–13: The United States and its TPP partners––Australia, Brunei Darussalam, Canada, Chile, Malaysia, Mexico, New Zealand, Peru, Singapore, and Vietnam––hold the 16th round of TPP negotiations in Singapore.
6: The United States and Iraq announce that the bilateral U.S.-Iraq TIFA, first negotiated in 2005, is likely to enter into force later this year. It will provide a bilateral forum fostering more trade and investment between the two countries.
10: U.S.-Taiwan TIFA council meetings in Taipei result in new joint statements on investment principles and ICT services, as well as the launch of the new TIFA working groups on investment and technical barriers to trade.
12: USTR holds a public hearing before the TPSC on U.S. negotiating objectives for the TISA.
18–19: The United States and South Korea convene the first meeting of the Labor Affairs Council under the KORUS FTA.
20: President Obama notifies Congress of its intent to enter into TTIP negotiations with the EU.
28: USTR holds a public hearing and receives testimony on the GSP review of country practices petitions relating to Bangladesh, Georgia, Niger, Russia, and Uzbekistan.
29: Acting USTR Marantis announces that the United States is exploring the possibility of a TIFA with the Economic Community of West African States.
April
1: USTR releases three reports on foreign trade measures—2013 Report on Sanitary and Phytosanitary Measures, 2013 Report on Technical Barriers to Trade, and 2013 National Trade Estimate Report on Foreign Trade Barriers.
3: USTR releases the annual 2013 Section 1377 Review on the operation and effectiveness of telecommunications trade agreements.
27

April—continued
10: USTR participates in the Forestry Subcommittee meeting of the U.S.-Peru TPA and the third meeting of the Environmental Cooperation Commission in Lima, Peru.
11: The United States and Guatemala agree on an Enforcement Plan to resolve concerns raised in a labor case brought by the United States under the Dominican Republic-Central America-United States Free Trade Agreement (CAFTA-DR).
16: The USTR announces initiation of a review of possible designation of Burma and Laos as GSP beneficiary developing countries.
21: The United States and other TPP negotiating partners welcome Japan as a new participant in the TPP negotiations.
24: The WTO DSB establishes a panel at the request of the United States concerning certain measures Indonesia imposes on the importation of horticultural products, animals, and animal products (DS455).
24: President Obama notifies Congress of its intent to include Japan in the TPP negotiations.
May
1: USTR releases the 2013 Special 301 Report on the adequacy and effectiveness of U.S. trading partners’ protection and enforcement of intellectual property rights (IPR).
7: Acting USTR Marantis and Acting Secretary of Labor Harris announce that the United States has requested consultations with the government of Bahrain under the labor chapter of the U.S.-Bahrain FTA regarding labor issues stemming from Bahrain’s response to civil unrest in early 2011.
10: CAFTA-DR members reaffirm their commitment to work together to enhance the mutually supportive trade and environmental protections outlined in the CAFTA-DR Environment Chapter as well as the Environmental Cooperation Agreement, at an Environmental Affairs Council meeting in Santo Domingo, Dominican Republic.
15–24: The 17th round of TPP negotiations is held in Lima, Peru.
21: The United States and Burma sign a TIFA, creating a platform for ongoing dialogue and cooperation on trade and investment issues between the two governments.
29: The United States and the Caribbean Community (CARICOM) sign a TIFA.
30: The United States initiates a Section 301 investigation of the acts, policies, and practices of the government of Ukraine that resulted in identifying Ukraine as a Priority Foreign Country in May’s 2013 Special 301 Report.
June
4: USTR holds a public hearing aimed at reviewing U.S. GSP eligibility for Burma and Laos.
5: The United States and Colombia conclude the first meeting of the Labor Affairs Council under the U.S.-Colombia FTA.
28

June—continued
6: The United States and Peru meet to discuss implementation of the environmental provisions of the U.S.-Peru TPA and the U.S.-Peru Environmental Cooperation Agreement.
7: The United States and Peru hold the third meeting of the Free Trade Commission, which is responsible for overseeing implementation and operation of the U.S.-Peru FTA. Participants discuss bilateral trade, investment, and economic issues, pending implementation issues, and cooperation in other fora, such as TPP.
13: The United States and Indonesia meet to discuss the comprehensive trade agenda between the two countries, seeking to address issues in ways that would further promote job-creating trade and investment under the U.S.-Indonesia TIFA.
19: USTR submits its first annual Report on WTO Enforcement Actions: Russia to Congress. The report highlights the enforcement actions USTR has taken to ensure Russia’s full compliance with its WTO obligations.
27: USTR announces results of the 2012 annual review under the GSP program, including a suspension of Bangladesh’s eligibility for tariff benefits under the GSP program.
27: Ecuador announces its intention to withdraw from the Andean Trade Preference Act (ATPA) program.
July
8–12: The first round of TTIP negotiations is held in Washington D.C.
10–11: The fifth round of the U.S.-China Strategic and Economic Dialogue is held in Washington D.C.
12: USTR Froman announces that the United States has fully implemented the WTO’s recommendations and rulings in the dispute brought by Mexico concerning the U.S. dolphin-safe labeling program (DS381).
12: The WTO DSB establishes a panel at the request of Vietnam concerning certain antidumping measures the United States imposes on certain frozen warm-water shrimp from Vietnam (DS429).
15–25: The 18th round of TPP negotiations is held in Kota Kinabalu, Malaysia, marking the first round in which Japan has participated as a full negotiating partner.
17: Negotiations for an expanded Information Technology Agreement (ITA) at the WTO are suspended due to concerns over China’s position on the negotiations.
24: USTR Froman meets with Japanese Minister for Economy, Trade, and Industry Motegi in Washington, DC, to discuss Japan’s participation in TPP negotiations as well as ongoing U.S.-Japan discussions on a series of multilateral trade issues.
29: Argentina requests that the WTO Director-General compose a panel concerning certain measures the United States imposes on the importation of animals, meat, and other animal products from Argentina (DS447).
29–August 2: USTR Froman joins President Obama for the final two of a three-nation trip to Senegal, South Africa, and Tanzania. The trip highlighted the importance of strengthening U.S.-Africa trade and investment ties.
29

July—continued
31: Authority to provide preferential treatment under GSP, ATPA, and the Andean Trade Promotion and Drug Eradication Act (ATPDEA) expires.
August
1: USTR Froman and Secretary of Agriculture Vilsack announce that the EU will continue to offer U.S. producers significant access, at zero duty, to the EU market for high-quality beef produced from non-hormone-treated cattle.
7–9: The United States and Japan hold bilateral negotiations related to autos, insurance, and nontariff measures in other key areas and sectors in Tokyo parallel to the TPP negotiations.
9–13: The 12th annual African Growth and Opportunity Act (AGOA) forum is held in Addis Ababa, Ethiopia.
22–30: The 19th round of TPP negotiations is held in Bandar Seri Begawan, Brunei Darussalam.
30: The United States requests WTO consultations with Indonesia concerning certain measures it imposes on the importation of horticultural products, animals, and animal products (DS465).
September
10: USTR conducts a public hearing as part of its ongoing section 301 investigation into certain IPR policies and practices in Ukraine.
11: The U.S.-China Joint Commission on Commerce and Trade holds its mid-year review in Beijing.
11–12: The United States and Brazil hold the second meeting of the Commission on Economic and Trade Relations under the U.S.-Brazil Agreement on Trade and Economic Cooperation. Discussion topics include investment, innovation, and small, medium-sized, and micro enterprises.
17: USTR announces country-specific and first-come, first-served in-quota allocations for the fiscal year 2014 tariff-rate quotas on imported raw cane sugar, refined and specialty sugar, and sugar-containing products.
18–28: The 12 TPP countries meet in Washington, DC, to discuss a range of issues under negotiation, including investment, financial services, and the environment.
25: The WTO DSB adopts the panel report concerning the complaint by the United States regarding China’s imposition of duties on U.S. broiler products (DS427).
26: The United States and Japan announce an agreement to streamline organic trade between the two countries. Beginning January 1, 2014, organic products certified in either country may be sold in both countries.
30–October 1: The United States and Japan hold a second round of bilateral negotiations on motor vehicles, insurance, and nontariff measures.
October
1–2: Trade ministers for the TPP negotiating countries hold discussions in Bali, Indonesia, on the margins of the APEC Leaders’ meeting.
30

October—continued
3: Brazil’s Council of Ministers responsible for Foreign Trade (CAMEX) meet to discuss their next steps in response to the United States’ September decision to reduce monthly settlement payments to the Brazil cotton fund.
3: The Indian Department of Electronics and Information Technology delayed, for a second time, a controversial testing requirement at the request of U.S. technology and telecommunications companies. The action delayed application of the requirement for an additional three months.
4–8: The APEC leaders’ and ministerial meetings are held in Bali, Indonesia. Leaders agree to take steps toward increasing connectivity in the region, promoting sustainable and equitable growth, and improving regional economic integration.
21–23: The United States and Japan hold the third round of U.S.-Japan bilateral negotiations on motor vehicles, insurance, and nontariff measures.
21–25: Negotiations towards expanding the ITA resume at the WTO.
28: The United States expresses concerns about the enforcement of Guatemala’s laws protecting worker rights, saying that significant work remains to ensure that an enforcement plan signed by the Guatemalan government earlier in the year is effectively implemented.
November
4–9: The fourth round of the TISA negotiations takes place in Geneva, Switzerland, among participating WTO members.
11–14: The eighth council meeting of the U.S.-Central Asia TIFA is held in Ashgabat, Turkmenistan.
11–15: The second round of TTIP negotiations takes place in Brussels, Belgium.
15: The United States and CARICOM hold an inaugural meeting of the U.S.-CARICOM Council on Trade and Investment under the recently inaugurated U.S.-CARICOM TIFA.
21: The United States and Morocco sign a Trade Facilitation Agreement. Morocco becomes the first country in the region to conclude a bilateral trade facilitation agreement with the United States, as well as endorse joint statements on investment principles and on ICT services trade with the United States.
25: The United States and Bangladesh sign the U.S.-Bangladesh Trade and Investment Cooperation Forum Agreement (TICFA).
29: USTR Froman welcomes Korea’s expression of interest in joining the TPP.
December
3: China requests WTO dispute settlement consultations with the United States regarding the use of certain methodologies in antidumping investigations involving Chinese products (DS471).
3–7: The ninth annual WTO ministerial conference is held in Bali, Indonesia.
31

December—continued
5: Korea requests establishment of a WTO DSB panel concerning certain antidumping and countervailing measures the United States has placed on large residential washers from Korea (DS464).
7–10: A TPP ministerial meeting is held in Singapore.
16–20: The third round of TTIP negotiations takes place in Washington, DC.
18: The United States and Libya sign a TIFA, which will provide a forum to address trade issues and will help build trade and investment relations between the two countries.
19–20: The 24th session of the U.S.-China Joint Commission on Commerce and Trade occurs in Beijing, China.
20: USTR submits its first annual Report on Russia’s Implementation of the WTO Agreement to Congress.
23: President Obama completes annual determinations regarding country eligibility for the AGOA in 2014. Eligibility will continue for the 39 currently eligible countries, and Mali’s eligibility is reinstated effective January 1, 2014.
24: USTR submits the 2013 Report to Congress on China’s WTO Compliance to Congress.
Source: Compiled from official and private sources, including the U.S. Department of Commerce, U.S. Department of State, U.S. Trade Representative, White House, World Trade Organization, Inside U.S. Trade, and Washington Trade Daily.
32

Chapter 1 Overview of U.S. Trade Scope and Approach of the Report This report provides factual information on the operation of the U.S. trade agreements program and its administration for calendar year 2013.3 Trade agreement activities during 2013 include the administration of U.S. trade laws and regulations; U.S. participation in the World Trade Organization (WTO), the Organisation for Economic Co-operation and Development (OECD), and the Asia-Pacific Economic Cooperation (APEC) forum; U.S. negotiation of and participation in free trade agreements (FTAs); and bilateral developments with major trading partners.
This report is based on primary source materials about U.S. trade programs and administrative actions pertaining to them. These materials chiefly encompass U.S. government reports, notices, and news releases, including publications and news releases by the U.S. International Trade Commission (USITC or the Commission). Other primary sources of information include publications of international institutions, such as the International Monetary Fund (IMF), World Bank, OECD, WTO, United Nations (UN), and foreign governments. The report draws on professional journals, trade publications, and news reports for supplemental factual information when primary source information is unavailable.
Official U.S. merchandise trade data are provided throughout the report. Chapters 1 and 5 also offer data on services trade. The services trade data by country are based on figures for trade in private services, which exclude government sales and purchases of services. Services data were compiled by the Commission primarily from figures provided by the Bureau of Economic Analysis (BEA) of the U.S. Department of Commerce (USDOC or Commerce).
To complement the release of the Year in Trade 2013 report, the USITC has developed a series of dashboards in MS Excel available online that present U.S. merchandise trade data in an interactive format. The dashboards are a companion piece to the traditional report. They will offer Year in Trade readers a new way to look at, visualize, and understand the U.S. merchandise trade data used in the report. Using the dashboards, readers will be able to conduct further analysis of U.S. merchandise trade focusing on specific trading partners, specific FTAs, and specific trade preference programs. The dashboards can be found at www.usitc.gov/publications/dashboards. All dashboards present data covering at least the period presented in this report (2011–13), while some allow the user to review data ranging from 1996 through 2013.4
3 This is the 65th in a series of annual reports submitted to the U.S. Congress under section 163(c) of the Trade Act of 1974 (19 U.S.C. § 2213(c)) and its predecessor legislation. 4 Data in the dashboards may differ from the data presented in the report. For example, the dashboards may present unadjusted data from the U.S. Census Bureau (Census), whereas the corresponding data in a given report
33

Overview of the U.S. Economy in 2013 In 2013, the U.S. economy continued to rebound from the economic recession of 2008 and 2009, though at a weaker rate than in 2012. U.S. real gross domestic product (GDP) increased 1.9 percent in 2013, compared to 2.8 percent the previous year (figure 1.1). The increase in real GDP in 2013 mostly reflected positive contributions from personal consumption expenditures (1.33 percentage points) and gross private domestic investment (0.84 percentage points), partly offset by a negative contribution from government spending (–0.44 percentage points).5 The contribution of net exports of goods and services to growth in real GDP was 0.12 percentage points.6 To support the continued U.S. economic recovery, the U.S. Federal Reserve continued to buy long-term securities and kept the target range for the federal funds rate at 0 to 0.25 percent in 2013.7 The seasonally adjusted U.S. unemployment rate fell from 7.9 percent in January 2013 to 6.7 percent in December 2013.8
Figure 1.1 U.S. real gross domestic product, annual rate of change, 2004–13
Source: USDOC. http://www.bea.gov/national/xls/gdpchg.xls.
table may reflect an adjustment that is explained in a footnote. Dashboard mechanics are discussed in more detail in the dashboard's “Introductory Page” on the USITC website. 5 USDOC, BEA, “Gross Domestic Product: Fourth Quarter and Annual 2013 (Second Estimate),” February 28, 2014, table 2. 6 Ibid. 7 Federal Reserve, “Federal Reserve Issues FOMC Statement,” June 19, 2013. The federal funds rate is the interest rate at which depository institutions lend their excess deposits to each other overnight. Federal Reserve, “Open Market Operations,” n.d. (accessed March 12, 2014). 8 USDOL, BLS, “Labor Force Statistics from the Current Population Survey,” n.d. (accessed January 16, 2014).
-4.0
-3.0
-2.0
-1.0
0.0
1.0
2.0
3.0
4.0
2004 2005 2006 2007 2008 2009 2010 2011 2012 2013
Perc
ent
34

U.S. international trade continued to grow in 2013, although the percentage increase was significantly less than in 2012.9 Exports of goods and services increased 2.8 percent in 2013, compared to 4.6 percent in 2012, reflecting generally slower growth in most other countries. U.S. imports of goods and services increased very slightly (by less than 0.04 percent), reflecting lower U.S. demand for imported petroleum and petroleum-related products.10
The global economy also grew at a slightly reduced rate: the growth rate was 3.0 percent in 2013, compared to 3.2 percent in 2012.11 Economic growth in major advanced economies fell slightly, slipping to 1.3 percent in 2013 from 1.4 percent in 2012. While growth has been more robust in many emerging and developing economies in recent years, economic growth for these economies also decreased on average, from 5.0 percent in 2012 to 4.7 percent in 2013.
Economic growth rates among major U.S. trading partners showed substantial differences. Output in the European Union (EU) euro area fell in 2013 by 0.5 percent, although the decline was less than the decline in 2012 (0.7 percent). The economic growth rate rose in the United Kingdom (from 0.3 percent in 2012 to 1.8 percent in 2013), in Canada (from 1.7 percent to 2.0 percent), and in Japan (from 1.4 percent to 1.5 percent). Economic growth rates among developing and emerging market economies were also mixed, with the growth rate falling in Mexico (from 3.9 percent in 2012 to 1.1 percent in 2013) and in India (from 4.7 percent to 4.4 percent). While China’s economic growth rate was highest among major U.S. trading partners, its rate stayed constant in 2013 (7.7 percent in both 2012 and 2013).12
Exchange-Rate Trends The U.S. dollar appreciated 3.3 percent in 2013 against a broad dollar index.13 By yearend, the dollar had appreciated 20.8 percent against the Japanese yen, 7.9 percent against the Canadian dollar, and 2.6 percent against the Mexican peso. However, the dollar fell against the Chinese yuan, the euro, and the pound sterling by 2 to 4 percent (figure 1.2). Fluctuations in the dollar reflected central bank policies as well as concerns about the global economic outlook. In the first quarter of the year, the dollar appreciated against most major currencies, reflecting a higher growth outlook for the U.S. economy and expectations that foreign central banks would continue monetary easing.14 In the second quarter, the dollar appreciated against most major currencies, except the euro, due to favorable U.S. economic reports and expectations that the
9 USDOC, Census Bureau, and BEA, “U.S. International Trade in Goods and Services, January 2014,” March 7, 2014, exhibit 1. 10 According to the U.S. Energy Information Administration (USEIA), strong crude oil production growth in the United States has led to a “significant decline” in U.S. imports of petroleum. USEIA, “Short-term Energy Outlook,” February 11, 2014. 11 IMF, World Economic Outlook, April 2014, table 1.1 Economic growth is measured as the percent change in GDP at constant prices. 12 Ibid. 13 The broad dollar index is a weighted average of the foreign exchange values of the U.S. dollar against those of the currencies of a large group of major U.S. trading partners. Dollar appreciation is measured as the increase in the broad dollar index from January 2, 2013 to December 31, 2013. 14 FRBNY, “Treasury and Federal Reserve Foreign Exchange Operations January–March 2013,” May 9, 2013, 1.
35

Figure 1.2 Indices of U.S. dollar exchange rates for selected major foreign currencies, daily, 2013a
Source: U.S. Federal Reserve Board.
aUnits of the foreign currency per unit of the U.S. dollar. A decrease in the index represents a depreciation of the U.S. dollar relative to the foreign currency, and an increase in the index represents an appreciation of the U.S. dollar relative to the foreign currency.
Federal Reserve Board would begin to reduce the pace of its asset purchases.15 In the third quarter of the year, the dollar depreciated against most major currencies due to a weaker-than-expected U.S. economic outlook and the continuation of Federal Reserve asset purchases, which prompted traders to reduce dollar exposures from the previous quarter.16 In the fourth quarter, the U.S. dollar appreciated against the yen and other emerging market currencies.17 The large appreciation of the dollar relative to the yen for the year reflected the expansionary monetary and fiscal policies Japan implemented during the course of the year.18
15 FRBNY, “Treasury and Federal Reserve Foreign Exchange Operations April–June 2013,” August 8, 2013, 1. 16 FRBNY, “Treasury and Federal Reserve Foreign Exchange Operations July–September 2013,” November 14, 2013, 1. 17 FRBNY, “Treasury and Federal Reserve Foreign Exchange Operations October–December 2013,” February 13, 2014, 5–6. 18 FRBNY, “Treasury and Federal Reserve Foreign Exchange Operations July–September 2013,” November 14, 2013, 7.
90
95
100
105
110
115
120
Jan Feb Mar Apr May Jun Aug Sep Oct Nov Dec
Dep
reci
atio
n $
App
reci
atio
n
Euro Pound Canadian dollar Yuan Yen Peso
January 2, 2013 = 100
36

Balance of Payments19 The U.S. current-account deficit—the combined balances of trade in goods and services, income, and net unilateral current transfers—decreased to $379.3 billion (preliminary) in 2013 from $440.4 billion in 2012, following an increase in the previous three years.20 The current-account deficit also decreased as a share of current-dollar U.S. GDP from 2.7 percent in 2012 to 2.3 percent in 2013. The decline in the current-account deficit was due to a decrease in the deficit in goods and services trade and an increase in the surplus in income, which offset an increase in net unilateral current transfers to foreigners in 2013.
The U.S. trade deficit for goods and services fell for the second consecutive year to $474.9 billion in 2013 from $534.7 billion in 2012. The deficit on goods decreased to $703.9 billion in 2013 from $741.5 billion in 2012, and remained well below the record goods deficit of $835.7 billion in 2006. U.S. exports of goods rose from $1,561.2 billion in 2012 to $1,589.7 billion in 2013, reflecting growth in exports of capital goods, consumer goods, and in particular, petroleum and petroleum products. Imports of goods dipped to $2,293.6 billion in 2013 from $2,302.7 billion in 2012, reflecting a decline in imports of petroleum and petroleum products.
The U.S. trade surplus for services grew from $206.8 billion in 2012 to $229.0 billion in 2013, a new annual record.21 Services exports rose from $649.3 billion to $681.7 billion in this period. All major categories of services exports grew, with the largest increases in travel and other private services.22 At the same time, services imports also increased, rising slightly from $442.5 billion in 2012 to $452.7 billion in 2013. The largest increases in services imports were in other transportation, travel, and other private services.23
19 This section of the report relies on trade data reported by the BEA. The trade balance reported by the BEA is the result of subtracting U.S. general imports from U.S. total exports using trade data from the U.S. Census Bureau (Census). The BEA adjusts these data to conform with the concepts and definitions used to prepare the international and national accounts. For a more detailed discussion of the differences between BOP-basis and Census-basis data, see USDOC, BEA, “A Guide to the U.S. International Transactions Accounts,” February 2010. All other sections of the report rely solely on Census data. 20 Unless otherwise indicated, information in this section is from USDOC, BEA, “U.S. International Transactions: Fourth Quarter and Year 2013,” March 19, 2014, 5–7. Income includes investment income and compensation of employees (compensation payments to U.S. residents by nonresidents and payments to nonresidents by U.S. residents). Net unilateral transfers include current transfers, such as private remittances, charitable contributions, taxes on international transactions, and transfers between U.S. and foreign insurance companies. 21 Services data in this section include trade in private services, as well as transfers under U.S. military agency sales contracts and U.S. government purchases of miscellaneous services. 22 Exports of other private services include “mainly film and television tape rentals and expenditures of foreign residents temporarily working in the United States.” USDOC, BEA, “U.S. International Transactions Accounts Data: Table 3a,” March 19, 2014. 23 “Other transportation” includes freight and port services. Services trade is discussed in more detail later in this chapter.
37

U.S. Trade in Goods in 201324 The value of U.S. exports of goods grew 1.4 percent while the value of imports fell 0.5 percent in 2013, compared to increases of 4.2 percent and 2.9 percent, respectively, in 2012 (appendix table A.3). The reduced growth in U.S. merchandise trade in 2013 reflected slower growth among the world economies and the reduction in the value of U.S. imports of petroleum and petroleum-related products. According to WTO data, China replaced the United States as the largest single-country merchandise trader in 2013.25 U.S. merchandise imports continued to exceed merchandise exports. U.S. merchandise exports increased from $1,353.2 billion in 2012 to $1,372.0 billion in 2013, while U.S. merchandise imports declined from $2,251.0 billion in 2012 to $2,239.8 billion in 2013 (figure 1.3). The merchandise trade deficit was down slightly in 2013 at $867.7 billion from $897.8 billion in 2012.
U.S. Merchandise Trade by Product Category Exports U.S. exports in 8 of 12 merchandise sector categories increased by a total of $25.8 billion in 2013, but fell in 4 other sector categories (footwear, minerals and metals, machinery, and electronic products) by $7.0 billion (appendix table A.3).26 Transport equipment, which consistently ranks as the largest U.S. export sector, accounted for 21.4 percent of merchandise exports in 2013. U.S. exports of transport equipment were valued at $293.0 billion in 2013, up 2.5 percent from $285.8 billion in 2012. Of the 8 merchandise export sectors that grew in 2013, 68.3 percent of the growth was accounted for by increased exports from 2 sectors: energy-related products and transport equipment. Energy-related products alone accounted for 40.2
24 Merchandise trade data in this section do not match the BOP-basis data presented above because of adjustments made to the data, as described in footnote 19. Additionally, to maintain continuity with previous Commission reports analyzing free trade and preferential trade arrangements, in this section and in the following chapters export data consist of U.S. domestic exports and import data consist of U.S. imports for consumption, both as reported by Census (for further information on these terms, please select “View data field descriptions” at http://dataweb.usitc.gov). The trade balance derived on this basis differs from the merchandise trade balance, defined as total exports minus general imports, as generally reported by Census and other federal agencies (see definitions of general imports and merchandise trade balance at http://www.census.gov/foreign-trade/reference/definitions). Imports for consumption may contain re-exports while domestic exports do not. As a result, trade deficits calculated as U.S. domestic exports minus U.S. imports for consumption with certain partners may be overstated and trade surpluses with certain partners may be understated in comparison to the merchandise trade balance as defined above, depending on the composition of trade with those partners. This difference is most notable in bilateral trade with Canada, Mexico, and the EU. Total exports, general imports, and the merchandise trade balance as defined above with major trading partners and with FTA partners can be found in appendix tables A.1 and A.2. 25 WTO, Statistics Database: Time Series on International Trade (accessed May 12, 2014). According to WTO data, the value of China’s merchandise imports and exports amounted to $4.2 trillion, compared to $3.9 trillion for the United States in 2013. 26 The 12 sectors in appendix table A.3 include agricultural products, forest products, chemicals and related products, energy-related products, textiles and apparel, footwear, minerals and metals, machinery, transportation equipment, electronic products, miscellaneous manufactures, and special provisions. Information on the scope of each sector can be found in the section on Frequently Asked Questions (FAQs) on the Commission’s website at http://www.usitc.gov/research_and_analysis/tradeshifts/2012/index.htm.
38

Figure 1.3 U.S. merchandise trade with the world, 2011–13
Source: Official trade statistics of the USDOC as maintained by the USITC. Note: Merchandise trade data here include U.S. domestic exports and imports for consumption.
percent of the export growth in these 8 sectors. Top products exported in 2013 included aircraft, spacecraft, and parts; petroleum oils; gold; passenger motor vehicles; and soybeans (see appendix table A.4 for details at the Schedule B subheading level).
Imports U.S. imports in 9 of 12 merchandise sector categories rose by $40.2 billion in 2013, while imports fell in 3 sector categories (chemicals and related products, energy-related products, and minerals and metals) by $51.5 billion (appendix table A.3). Energy-related products accounted for most (88.5 percent) of the decline in imports from these 3 sectors. The electronic products sector, which has ranked as the largest import sector since 2012, accounted for 18.6 percent of total merchandise imports in 2013, followed by transportation equipment, at 16.6 percent. U.S. imports of electronic products were valued at $417.2 billion in 2013, up 0.8 percent from $413.8 billion in 2012, while imports of transportation equipment were valued at $371.5 billion in 2013, up 3.7 percent from $358.4 billion in 2012. Of the 9 industry sectors that experienced import growth in 2013, 57.5 percent of this growth was accounted for by increased imports of goods from 3 industry sectors: transport equipment, miscellaneous manufactures, and imports under special provisions. Top products imported in 2013 included petroleum oils, motor vehicles, cellphones, computers, and pharmaceuticals (see appendix table A.5 for details at the Harmonized Tariff Schedule of the United States [HTS] subheading level).
-1,500
-1,000
-500
0
500
1,000
1,500
2,000
2,500
2011 2012 2013
Billi
on $
Exports Imports Trade balance
39

U.S. Imports under Preferential Trade Programs and Free Trade Agreements The value of U.S. merchandise imports under the United States’ four major preferential trade programs with developing countries fell from $66.9 billion in 2012 to $48.1 billion in 2013;27 they accounted for 2.1 percent of total U.S. imports during 2013. Imports totaled $18.5 billion under the U.S. Generalized System of Preferences (GSP) program (appendix table A.16); $24.8 billion (excluding GSP imports) under the African Growth and Opportunity Act (AGOA) (appendix table A.19); $2.5 billion under the Andean Trade Preference Act (ATPA), including the Andean Trade Promotion and Drug Eradication Act (ATPDEA) (appendix table A.21); and $2.4 billion under the Caribbean Basin Economic Recovery Act (CBERA), including the Caribbean Basin Trade Partnership Act (CBTPA) (appendix table A.23).28 The value of U.S. imports under all four of these programs fell in 2013. A much larger share of U.S. imports enter under free trade or trade promotion agreement provisions; the value of these imports increased 4.2 percent in 2013 and totaled $410.4 billion, or 18.3 percent of total U.S. imports in 2013.29
U.S. Merchandise Trade with Selected Major Trading Partners30 Table 1.1 shows U.S. trade with selected major trading partners, ranked by total trade (exports and imports) in 2013. In 2013, the EU remained the United States’ top trading partner in terms of two-way merchandise trade. Canada was the leading global market for U.S. exports. China continued as the leading source of U.S. imports through 2013. However, U.S. exports to China rose at a faster rate (10.1 percent) than U.S. imports from China (3.1 percent) in 2013. Canada also remained the largest single-country two-way trading partner of the United States, followed by China and Mexico (see appendix tables A.6 and A.7 for U.S. trade with the top 15 single-country trading partners). The leading U.S. export markets and import suppliers by share in 2013 are shown in figures 1.4 and 1.5.31
27 U.S. tariff preferences provided to goods entered into the customs territory of the United States from U.S. insular possessions (U.S. Virgin Islands, Guam, Johnston Atoll, Midway Islands, and Wake Island) and to products of the Freely Associated States (the Marshall Islands, the Federated States of Micronesia, and Palau) are not analyzed in this report. See the USITC, Harmonized Tariff Schedule of the United States (HTS) 2014, January 2014, gen. note 3a (iv) and gen. note 10. U.S. insular possessions are defined in 19 C.F.R. § 7.2 (a). 28 The President’s authority to provide duty-free treatment under the GSP program expired on July 31, 2013. After that date, GSP imports did not actually enter duty free, but importers still claimed GSP status to facilitate receiving refunds if GSP were to be renewed retroactively, as has been done in the past. The President’s authority to provide duty-free treatment under the ATPA/ATPDEA also expired on July 31, 2013. The 2013 data for these programs include any imports that claimed GSP or ATPA/ATPDEA status after the expiration date. 29 U.S. imports under preferential trade programs are discussed in chapter 2. U.S. trade with countries under free trade or trade promotion agreement provisions is discussed in chapter 4. 30 See chapter 5 for further information on U.S. merchandise trade with major trading partners, including the EU, Canada, China, Mexico, and other economies. Annual EU merchandise trade data include 28 countries for 2013 and the previous years covered in the report. Croatia became the 28th member on July 1, 2013. 31 Leading U.S. exports to and imports from these major trading partners are presented in appendix tables A.27–A.53.
40

Table 1.1 U.S. merchandise trade with selected major trading partners and the world, 2013 (millions of dollars)a
Major trading partner U.S. domestic
exports U.S. imports
for consumption Trade balance Two-way trade
(exports plus imports) EU-28 231,676 381,591 -149,915 613,267 Canada 251,685 332,887 -81,202 584,572 China 114,313 438,147 -323,834 552,460 Mexico 181,690 277,664 -95,973 459,354 Japan 59,689 137,954 -78,265 197,643 Koreab 39,008 61,979 -22,971 100,987 Brazil 37,627 26,861 10,767 64,488 Taiwan 23,270 37,539 -14,269 60,808 India 16,911 41,459 -24,548 58,370 All others 416,169 503,671 -87,503 919,840
World 1,372,039 2,239,750 -867,712 3,611,789 Source: Official trade statistics of the USDOC as maintained by the USITC. Note: Because of rounding, figures may not add to totals shown. aTrade balance is calculated here as U.S. domestic exports minus U.S. imports for consumption. These balances differ from the U.S. merchandise trade balance generally reported by Census, which is defined as total exports minus general imports. Appendix table A.1 reports the trade balance on this basis. bRepublic of Korea.
Figure 1.4 Leading U.S. merchandise export markets, by share, 2013
Source: Official trade statistics of the USDOC as maintained by the USITC. Note: Merchandise trade data here include U.S. domestic exports. Because of rounding, figures may not add to 100 percent.
Canada, 18%
EU-28, 17%
Mexico, 13% China, 8%
Japan, 5% Korea, 3%
Brazil, 3% Taiwan, 2%
India, 1%
All others, 30%
Total = $1,372 billion
41

Figure 1.5 Leading U.S. merchandise import sources, by share, 2013
Source: Official trade statistics of the USDOC as maintained by the USITC. Note: Merchandise trade data here include U.S. imports for consumption. Because of rounding, figures may not add to 100 percent.
U.S. Trade in Services in 201332 The U.S. surplus in cross-border private services trade increased 8.9 percent in 2013 to $232.4 billion (figure 1.6).33 The year 2013 represented the fourth consecutive year of growth in U.S. services trade since 2009. U.S. cross-border exports of private services rose 5.1 percent in 2013 to $659.9 billion, faster than the 3.1 percent increase in U.S. imports, which reached $427.5 billion. U.S. exports of private services posted gains in 10 of the 11 service categories in 2013, the exception being insurance services. By contrast, U.S. imports of private services decreased in two service categories: insurance and telecommunications services. Appendix table A.8 provides data on U.S. trade in private services by product category.
32 This section focuses primarily on cross-border transactions in private services, which exclude government sales and purchases of services. Services trade data are drawn from the BEA. In these national accounts data, “cross-border transactions” occur when firms resident in one country provide services to consumers in another, with people, information, or money crossing U.S. boundaries in the process. Cross-border transactions appear explicitly as imports and exports in the balance of payments. U.S. firms also provide services to foreign consumers through affiliates established in host countries, with the income generated through “affiliate transactions” appearing as investment income in the balance of payments. The channel of delivery used by service providers depends primarily on the nature of the service. For example, many financial services, such as retail banking services, are supplied most effectively by affiliates located close to the consumer. Conversely, most trade in education services takes the form of cross-border transactions, with students traveling abroad to attend foreign universities. 33 USDOC, BEA, “U.S. International Transactions Accounts Data: Table 3a,” March 19, 2014.
China, 20%
EU-28, 17%
Canada, 15% Mexico, 12%
Japan, 6%
Korea, 3%
Taiwan, 2% India, 2% Brazil, 1%
All others, 22%
Total = $2,240 billion
42

Figure 1.6 U.S. private cross-border services trade with the world, 2011–13a
Source: USDOC, BEA, U.S. International Transactions Accounts Data, March 19, 2014, table 3a.
aData for 2013 are preliminary.
U.S. Services Trade by Product Category Exports Business, professional, and technical services34 led U.S. cross-border services exports in 2013, accounting for 23.8 percent of the total, followed by travel services (21.2 percent)35 and royalties and license fees (19.6 percent).36 Although exports in most services categories grew in 2013, growth rates for some sectors were below 2012 levels, while others were virtually unchanged or declined. For instance, in 2013, U.S. exports of freight transport services and of business, professional, and technical services grew by 0.6 percent and 2.5 percent, respectively, compared to growth rates of 2.6 and 8.6 percent in 2012, while U.S. exports of insurance services fell by 4.7 percent in 2013. In total, services exports grew more slowly in 2013 than in 2012, reflecting lower global growth rates.
The post-recessionary growth of U.S. intellectual property exports increased in 2013. In 2013, royalties and license fees increased 4.1 percent to $129.3 billion, as compared to 2.9 percent
34 Business, professional, and technical services are characterized as labor-intensive services employing highly skilled and highly educated individuals who fill positions that frequently require specialized licensing or training. USITC, Recent Trends in U.S. Services Trade: 2013 Annual Report, July 2013, 2-1. 35 Travel services comprise purchases of goods and services by U.S. residents traveling abroad (U.S. imports of travel services) and by foreign travelers in the United States (U.S. exports of travel services). These goods and services include food, lodging, recreation, gifts, entertainment, local transportation in the country of travel, and other items incidental to a foreign visit. 36 U.S. exports of royalties and license fees comprise payments by foreigners to U.S. owners of intellectual property, such as trademarks, computer software, and industrial processes.
0
100
200
300
400
500
600
700
2011 2012 2013
Billi
on $
Exports Imports Trade balance
43

and $124.2 billion in 2012. Growth in U.S. exports of royalties and license fees occurs when there is an increase in the value of U.S. intellectual property purchased by foreign consumers for use in their domestic markets. Royalties and license fees receipts cover a wide array of activities, ranging from the distribution of U.S.-produced movies and television shows to industrial processes in the manufacture of pharmaceuticals to general-use software.37
Imports Business, professional, and technical services (28.0 percent of total imports) and travel services (20.2 percent) led U.S. cross-border services imports in 2013. Among all service categories, U.S. import growth was mixed. U.S. imports of passenger fares experienced the largest growth at 7.8 percent (down from 11.5 percent in 2012), followed by freight services at 6.8 percent in 2013. In 2013, U.S. imports of port and financial services posted increases of 2.7 and 6.3 percent, respectively, after experiencing a decline in 2012. By contrast, U.S. imports of telecommunications and insurance services in 2013 fell by 4.7 percent and 3.8 percent, respectively. Elsewhere, U.S. imports of travel services increased by 3.3 percent, down from 6.7 percent in 2012. Broad growth of U.S. services imports, with increases in 9 of 11 categories, likely reflects increasing demand for services by both businesses and consumers as the U.S. economy continued its post-recession growth and stabilization.
U.S. Services Trade with Leading Partners The EU was the United States’ largest export market for services in 2013, as well as its largest foreign supplier of services (table 1.2), accounting for $208.8 billion (31.6 percent) of total U.S. services exports and $148.4 billion (34.7 percent) of total U.S. services imports that year (figures 1.7 and 1.8).38 Canada and Japan were the second- and third-largest U.S. services trading partners in 2013. The U.S. trade surplus with the EU increased to $60.5 billion in 2013, up from $55.9 billion in 2012. The United States also maintained large trade surpluses in services with other leading trade partners, including Canada ($34.3 billion), China ($19.2 billion),39 Japan ($18.6 billion), Brazil ($17.5 billion), Mexico ($11.7 billion), the Republic of Korea (Korea) ($11.1 billion), and Australia ($11.1 billion). In addition, U.S. trade surpluses grew rapidly in 2013 with several countries, including Korea (27.6 percent), Argentina ($5.3 billion surplus, 17.3 percent increase), and South Africa ($1.0 billion surplus, 28.7 percent increase). India was the only leading services trade partner with which the United States recorded a trade deficit, $6.0 billion, representing a decrease of nearly 9.5 percent from 2012. Although industry-specific data by trading partner are not yet available for 2013, the U.S. services trade deficit with India has been driven for the past several years by an increase in U.S. imports of computer and information services.40
37 USDOC, BEA, “U.S. International Services,” October 2013, 32. 38 In terms of single countries, Canada was the United States’ largest export market and the United Kingdom (a member of the EU) was the largest import supplier of private services in 2013. 39 U.S. services imports from China increased by 7.7 percent while U.S. services exports to China increased by 10.5 percent, resulting in an increase of 12.6 percent in the U.S. services trade surplus with China. 40 USDOC, BEA, “U.S. International Services,” October 2013, 60–61.
44

Table 1.2 U.S. private services trade with major trading partners and the world, 2013a (billions of dollars)
Major trading partner U.S. exports U.S. imports Trade balance
Two-way trade (exports plus
imports) EU-28b 208.8 148.4 60.5 357.2 Canada 63.8 29.5 34.3 93.3 Japan 47.7 29.1 18.6 76.8 Mexico 28.5 16.8 11.7 45.3 China 33.2 14.0 19.2 47.2 India 12.8 18.8 -6.0 31.7 Brazil 24.8 7.3 17.5 32.1 Korea 20.5 9.4 11.1 29.9 Australia 17.6 6.6 11.1 24.2 Taiwan 11.6 7.7 4.0 19.3 Singapore 11.1 4.8 6.2 15.9 All others 179.3 135.1 34.9 305.1
World 659.9 427.5 232.4 1,087.4 Source: USDOC, BEA, U.S. International Transactions Accounts Data, March 19, 2014, table 12. Note: Because of rounding, figures may not add to totals shown. aData are preliminary. bEuropean Union data includes Croatia in the last two quarters of 2013 only.
Figure 1.7 Leading U.S. export markets for private services, by share, 2013a
Source: USDOC, BEA, U.S. International Transactions Accounts Data, March 19, 2014, table 12. Note: Because of rounding, figures may not add to 100 percent.
aData for 2013 are preliminary.
EU-28 31%
Canada 10%
Japan 7%
China 5%
Mexico 4%
Brazil 4%
Korea 3%
Australia 3%
India 2%
Taiwan 2%
Singapore 2%
All others 27%
Total = $659.9 billion
45

Figure 1.8 Leading U.S. import sources for private services, by share, 2013a
Source: USDOC, BEA, U.S. International Transactions Accounts Data, March 19, 2014, table 12. Note: Because of rounding, figures may not add to 100 percent.
aData for 2013 are preliminary.
EU-28 35%
Canada 7% Japan
7% India 4%
Mexico 4%
China 3% Korea
2%
Taiwan 2%
Brazil 2%
Hong Kong 2%
Australia 1%
All others 31%
Total = $427.5 billion
46

Chapter 2 Administration of U.S. Trade Laws and Regulations This chapter surveys activities related to the administration of U.S. trade laws during 2013, covering import relief laws, laws against unfair trade practices, trade adjustment assistance, and tariff preference programs. Tariff preference programs encompass the U.S. Generalized System of Preferences (GSP), the African Growth and Opportunity Act (AGOA), the Andean Trade Preference Act (ATPA), and the Caribbean Basin Economic Recovery Act (CBERA), including initiatives aiding Haiti. The online interactive merchandise trade dashboards that accompany the Year in Trade 2013 report, as described in chapter 1, can be used for further analysis of U.S. trade under the tariff preference programs.
Import Relief Laws Safeguard Actions This section covers safeguard actions under provisions administered by the Commission, including the global safeguards provided for in sections 201–204 of the Trade Act of 1974,41 the China safeguards provided for in section 421 of the Trade Act of 1974,42 and the safeguards provided for in various bilateral free trade agreements (FTAs) involving the United States.
The Commission conducted no new safeguard investigations during 2013, and no U.S. safeguard measures under these provisions were in effect during any part of 2013. In addition, by statute, the authority to conduct investigations and apply measures under the China safeguards provision in section 421 of the Trade Act of 1974 ceased to be effective on December 11, 2013.43
Laws against Unfair Trade Practices Section 301 Investigations Section 301 of the Trade Act of 1974 is the principal U.S. statute for addressing unfair foreign practices affecting U.S. commerce.44 Section 301 may be used to enforce U.S. rights under bilateral and multilateral trade agreements or to respond to alleged unjustifiable, unreasonable, or discriminatory foreign government practices that burden or restrict U.S.
41 19 U.S.C. §§ 2251–2254. 42 19 U.S.C. § 2451. 43 19 U.S.C. § 2451b(c). Section 423(c) of this law provided that such authority, and regulations issued thereunder, were to “cease to be effective 12 years after the date of entry into force of the Protocol of Accession of the People’s Republic of China to the WTO.” China’s Protocol of Accession entered into force on December 11, 2001. 44 Section 301 refers to sections 301–310 of the Trade Act of 1974, as amended (19 U.S.C. §§ 2411–2420).
47

commerce. Section 301 is administered by the Office of the U.S. Trade Representative (USTR). Interested persons may petition USTR to investigate foreign government policies or practices, or USTR may initiate an investigation itself.
If the investigation involves a trade agreement and consultations do not lead to a mutually acceptable resolution, section 303 of the Trade Act of 1974 requires USTR to use the dispute settlement procedures available under the subject agreement. If the matter is not resolved by the conclusion of the investigation, section 304 of the Trade Act of 1974 requires USTR to determine whether the practices in question fulfill any of three conditions: (1) they deny U.S. rights under a trade agreement; (2) they are unjustifiable, and burden or restrict U.S. commerce; or (3) they are unreasonable or discriminatory, and burden or restrict U.S. commerce. If the practices fulfill either of the first two conditions, USTR must take action.45 If the practices fulfill the third condition—that is, if they are unreasonable or discriminatory, and they burden or restrict U.S. commerce—USTR must determine whether action is appropriate and, if so, what type of action to take.46 The time period for making these determinations varies according to the type of practices alleged.
Section 301 Cases In 2013, there was one ongoing section 301 case, and one new section 301 investigation was initiated. The ongoing case concerned various meat hormone directives of the EU, which prohibit the use of certain hormones that promote growth in farm animals. The United States successfully challenged the EU measures at the WTO, and in 1999, imposed additional ad valorem duties of 100 percent on about $117 million in imports from the EU.47
In January 2009, the United States and the EU launched a series of consultations in an effort to resolve the meat hormone dispute through negotiation. On May 13, 2009, the United States and the EU announced the signing of a memorandum of understanding (MOU).48 Under the MOU, the EU agreed to open a tariff-rate quota (TRQ) with an in-quota tariff rate of zero for high-quality beef produced without growth-promoting hormones49 in the amount of 20,000 metric tons,50 and the United States agreed to reduce the scope of the retaliation list.51
The MOU further provided that the parties could enter a second phase under which the EU would increase the TRQ to 45,000 metric tons beginning in August 2012, and the United States
45 Section 301(a) of the Trade Act of 1974, as amended (19 U.S.C. § 2411(a)). 46 Section 301(b) of the Trade Act of 1974, as amended (19 U.S.C. § 2411(b)). 47 64 Fed. Reg. 40638 (July 27, 1999); WTO, European Communities—Measures Concerning Meat and Meat Products (DS26, DS48). 48 Memorandum of Understanding between the United States of America and the European Commission Regarding the Importation of Beef From Animals Not Treated with Certain Growth-Promoting Hormones and Increased Duties Applied by the United States to Certain Products of the European Communities, May 13, 2009 (U.S.-EU Beef MOU). For more information on the three-phase MOU, see USITC, The Year in Trade 2009, 2010, 5-5. 49 Article VI of the U.S.-EU Beef MOU defines “high quality beef.” High-quality beef is beef that meets certain quality characteristics. 50 U.S.-EU Beef MOU, Art. II(1). 51 U.S.-EU Beef MOU, Art. II(3); 74 Fed. Reg. 40864 (August 13, 2009).
48

would lift the remaining additional duties.52 The United States and the EU entered into the second phase of the MOU beginning August 1, 2012, and the EU increased the TRQ for high-quality beef to 45,000 metric tons.53 The MOU provided that the second phase would continue for one year. In August 2013, the United States and the EU agreed to extend the second phase of the MOU for two additional years, until August 2, 2015, thereby maintaining the TRQ for high-quality beef of 45,000 metric tons per year.54
The new section 301 case in 2013 concerned intellectual property rights (IPR) protection in Ukraine. In May 2013, Ukraine was identified as a priority foreign country55 in USTR’s 2013 Special 301 Report because of Ukraine’s denial of adequate and effective protection of IPR and its denial of fair and equitable market access to persons that rely on IPR protection.56 On May 30, 2013, the USTR initiated a section 301 investigation of the acts, policies, and practices of the government of Ukraine with respect to its IPR regime.57 In particular, the investigation was to focus on piracy of copyrights and related rights over the Internet, the Ukrainian government’s use of pirated software, and the non-transparent and unfair administration and operation of certain Ukrainian copyright collecting societies. The section 301 investigation of intellectual property rights in Ukraine was ongoing at the end of 2013.
Special 301 The Special 301 law58 requires that the USTR annually identify and issue a list of foreign countries that deny adequate and effective protection of IPR, or deny fair and equitable market access to U.S. persons who rely on IPR protection.59 Under the statute, a country denies adequate and effective IPR protection if the country does not allow foreign persons “to secure, exercise, and enforce rights related to patents, process patents, registered trademarks, copyrights and mask works.”60
52 U.S.-EU Beef MOU, Arts. I(2), II(4), and IV(2). The USTR terminated the imposition of the remaining additional duties in May 2011. For more background, see USITC, The Year in Trade 2011, 2012, 2-3. 53 Regulation (EU) No. 464/2012 of the European Parliament and of the Council, OJ L 149, June 8, 2012, 1. 54 USTR, “U.S. Trade Representative Froman, Secretary of Agriculture Vilsack,” August 1, 2013. 55 For an explanation of a “priority foreign country,” see the next section on Special 301. 56 USTR, 2013 Special 301 Report, May 2013; USTR, “USTR Releases Annual Special 301 Report,” May 1, 2013. 57 USTR, “Acting U.S. Trade Representative Sapiro Announces Section 301,” May 30, 2013; USTR, “Identification of Ukraine as a Priority Foreign Country and Initiation of Section 301 Investigation,” 78 Fed. Reg. 33886 (June 5, 2013). 58 The Special 301 law is set forth in section 182 of the Trade Act of 1974, as amended (19 U.S.C. § 2242). 59 “Persons who rely on IPR protection” means persons involved in “(A) the creation, production or licensing of works of authorship … that are copyrighted, or (B) the manufacture of products that are patented or for which there are process patents.” Section 182(d)(1) of the Trade Act of 1974, as amended (19 U.S.C. § 2242(d)(1)). 60 Section 182(d)(2) of the Trade Act of 1974, as amended (19 U.S.C. § 2242(d)(2)). Section 901(a)(2) of the Semiconductor Chip Protection Act (17 U.S.C. § 901(a)(2)) defines “mask work” as a “series of related images, however fixed or encoded—(A) having or representing the predetermined, three-dimensional pattern of metallic, insulating, or semiconductor material present or removed from the layers of a semiconductor chip product; and (B) in which series the relation of the images to one another is that each image has the pattern of the surface of one form of the semiconductor chip product.”
49

Under the statute, a country denies fair and equitable market access if it denies access to a market for a product that is protected by a copyright or related right, patent, trademark, mask work, trade secret, or plant breeder’s right through the use of laws and practices that violate international agreements or that constitute discriminatory nontariff trade barriers.61 A country may be found to deny adequate and effective IPR protection even if it is in compliance with its obligations under the WTO Agreement on Trade-Related Aspects of Intellectual Property Rights (TRIPS Agreement).62
In addition, the Special 301 law directs the USTR to identify and list so-called priority foreign countries.63 Priority foreign countries are countries that have the most onerous or egregious acts, policies, or practices with the greatest adverse impact (actual or potential) on the relevant U.S. products.64 Such countries must be designated as priority foreign countries unless they are entering into good-faith negotiations, or making significant progress in bilateral or multilateral negotiations to provide adequate and effective IPR protection.65 The identification of a country as a priority foreign country triggers a section 301 investigation,66 unless the USTR determines that the investigation would be detrimental to U.S. economic interests.67
In addition to identifying priority foreign countries as required by statute, the USTR has adopted a practice of naming countries to a “watch list” or a “priority watch list” when the countries’ IPR laws and practices fail to provide adequate and effective IPR protection, but the deficiencies do not warrant identification of the countries as priority foreign countries.68 The priority watch list identifies countries with significant IPR problems that warrant close monitoring and bilateral consultation. If a country on the priority watch list makes adequate progress, it may be moved to the watch list or removed from any listing. On the other hand, a country that fails to make progress may be raised from the watch list to the priority watch list, or from the priority watch list to the list of priority foreign countries.
In its 2013 Special 301 review, the USTR examined the adequacy and effectiveness of IPR protection in 95 countries.69 In conducting the review, the USTR focused on a wide range of issues and policy objectives relating to IPR protection and enforcement, including copyright piracy over the Internet; trademark counterfeiting and copyright piracy of physical goods, including semiconductors, optical discs, automobile parts, and medicines and health care products; trademark infringement, particularly with respect to domain names; the protection of trade secrets; compulsory technology transfer and licensing; transshipment of pirated and counterfeit goods; strengthened criminal and border enforcement; IPR training, resources, and prosecutions; criminal prosecutions and deterrent sentencing; ensuring that foreign
61 Section 182(d)(3) of the Trade Act of 1974, as amended (19 U.S.C. § 2242(d)(3)). 62 Section 182(d)(4) of the Trade Act of 1974, as amended (19 U.S.C. § 2242(d)(4)). 63 Section 182(a)(2) of the Trade Act of 1974, as amended (19 U.S.C. § 2242(a)(2)). 64 Section 182(b)(1) of the Trade Act of 1974, as amended (19 U.S.C. § 2242(b)(1)). 65 Ibid. 66 Section 182(f)(2) of the Trade Act of 1974, as amended (19 U.S.C. § 2242(f)(2)). 67 Section 302(b)(2)(B) of the Trade Act of 1974, as amended (19 U.S.C. § 2412(b)(2)(B)). 68 77 Fed. Reg. 77178 (December 31, 2012). 69 USTR, 2013 Special 301 Report, May 2013; USTR, “USTR Releases Annual Special 301 Report,” May 1, 2013.
50

government ministries only use legally authorized and properly licensed business software; market access barriers faced by U.S. pharmaceutical and medical device manufacturers; adequate implementation of the World Intellectual Property Organization (WIPO) Internet treaties;70 and proper implementation of the TRIPS Agreement by developed and developing countries.
In the 2013 Special 301 Report, Ukraine was identified as a priority foreign country, principally because of its unfair and nontransparent system for collecting and distributing music royalties, the widespread use of infringing software by the Ukrainian government, and the failure to implement an effective and transparent system to combat online piracy. Ukraine had made a series of commitments to make improvements on these particular issues in a 2010 IPR Action Plan, following intensive bilateral consultations. Notwithstanding the Ukrainian commitments, USTR noted that the situation in Ukraine had deteriorated significantly with respect to each of the three issues.
The 2013 Special 301 Report identified 10 countries on the priority watch list: Algeria, Argentina, Chile, China, India, Indonesia, Pakistan, Russia, Thailand, and Venezuela. In listing China, the report highlighted the need for greater protection and enforcement of all forms of IPR there, including patents, trademarks, copyrights, trade secrets, and the protection of pharmaceutical test data. It noted U.S. concerns about cybertheft, compulsory licensing, trade secret theft, and “indigenous innovation” policies and related industrial policies in China that may disadvantage U.S. rights holders.
India remained on the priority watch list because it made only limited progress in improving its weak legal framework for IPR protection and enforcement. The 2013 Special 301 Report noted concerns about the patent system, particularly in the pharmaceutical sector; compulsory licensing; unauthorized disclosure of test and other data; copyright piracy over the Internet; and market access measures that appear to discriminate in favor of the indigenous development of IPR.
Although Russia has made some progress in improving IPR protection and enforcement,71 it remained on the priority watch list because overall IPR protection and enforcement appears to have declined while online piracy is growing. No effective enforcement strategy has been developed by Russia to address this issue.
70 The WIPO Internet treaties include the WIPO Copyright Treaty, adopted in Geneva on December 20, 1996, and the WIPO Performances and Phonograms Treaty, adopted in Geneva on December 20, 1996. See USTR, 2013 Special 301 Report, May 2013, Annex 2. 71 On December 21, 2012, the USTR announced that the United States and Russia had agreed to an Intellectual Property Rights Action Plan to improve IPR protection and enforcement in Russia. USTR, “United States and Russian Federation Agree on Action Plan,” December 21, 2012.
51

The 2013 Special 301 Report also identified 30 countries on its watch list.72 It also noted that Brunei Darussalam and Norway had made progress and were therefore removed from the watch list.
From 2006 through 2010, the USTR also identified so-called notorious markets in the same report. In 2010, the USTR announced that the agency would begin issuing a list of these markets separately.73 In February 2011, the USTR published the first separate Notorious Markets List, which identifies select online and physical marketplaces that reportedly engage in and facilitate substantial piracy and counterfeiting.74 Such markets have been the subject of enforcement actions or, according to the USTR, may merit further investigations. In September 2013, the USTR solicited public comments for the 2013 Special 301 Out-of-Cycle Review of Notorious Markets Report.75 The 2013 Notorious Markets List was not issued, and the out-of-cycle review was ongoing during 2013.76
Antidumping and Countervailing Duty Investigations and Reviews Antidumping Duty Investigations The U.S. antidumping law is found in title VII of the Tariff Act of 1930, as amended.77 This law offers relief to U.S. industries that are injured by imports that are dumped, or sold, at less than their “fair value” (LTFV). The U.S. government provides relief by imposing a special additional duty on a LTFV import that reflects its “dumping margin”—the amount by which its sale price is less than its fair value.
Antidumping duties are imposed when (1) the U.S. Department of Commerce (USDOC), the administering authority, has determined that imports are being, or are likely to be, sold at LTFV in the United States, and (2) the Commission has determined that a U.S. industry is materially injured or threatened with material injury, or that the establishment of an industry in the United States is materially retarded by reason of such imports. (Such a conclusion is called an “affirmative determination.”) Most investigations are conducted on the basis of a petition filed with the USDOC and the Commission by or on behalf of a U.S. industry. The USDOC and the Commission each conduct preliminary and final antidumping duty investigations in making their separate determinations.
72 The countries on the 2013 watch list are Barbados, Belarus, Bolivia, Brazil, Bulgaria, Canada, Colombia, Costa Rica, the Dominican Republic, Ecuador, Egypt, Finland, Greece, Guatemala, Israel, Italy, Jamaica, Kuwait, Lebanon, Mexico, Paraguay, Peru, the Philippines, Romania, Tajikistan, Trinidad and Tobago, Turkey, Turkmenistan, Uzbekistan, and Vietnam. USTR, 2013 Special 301 Report, May 2013. 73 75 Fed. Reg. 60854 (October 1, 2010). The decision was made in coordination with the Office of the Intellectual Property Enforcement Coordinator (IPEC) and in accordance with the 2010 Joint Strategic Plan on Intellectual Property Enforcement. Executive Office of the President, IPEC, 2010 Joint Strategic Plan, June 2010, 9. 74 USTR, 2013 Out-of-Cycle Review of Notorious Markets, February, 2014. 75 78 Fed. Reg. 57924 (September 20, 2013). 76 The 2013 Out-of-Cycle Review of Notorious Markets Report was issued by the USTR in February 2014. 77 19 U.S.C. § 1673 et seq.
52

In general, imports are considered to be sold at LTFV when a foreign firm sells merchandise in the U.S. market at a price that is lower than the “normal value” of the merchandise.78 Generally, normal value is the price the foreign firm charges for a comparable product sold in its home market.79 Under certain circumstances, the foreign firm’s U.S. sales price may also be compared with the price the foreign firm charges in other export markets or with the firm’s cost of producing the merchandise, taking into account the firm’s selling, general, and administrative expenses, as well as its profit. Under the law, this latter basis for comparison is known as constructed value.80 Finally, where the producer is located in a non-market-economy country, a comparison is made between U.S. prices and a “surrogate” normal value (its factors of production, as valued by use of a “surrogate” country).81 In all three instances, the amount by which normal value exceeds the U.S. price is the “dumping margin.” The duty specified in an antidumping duty order reflects the weighted average dumping margins found by the USDOC both for the specific exporters it examined and for all other exporters.82 This rate of duty (in addition to any ordinary customs duty owed) will be applied to subsequent imports from the specified producers/exporters in the subject country, but it may be adjusted if the USDOC receives a request for an annual review.83
The Commission instituted 42 new preliminary antidumping investigations and completed 10 final investigations in 2013.84 As a result of affirmative Commission determinations, in 2013 antidumping duties were imposed in 8 of those completed investigations on five products from five countries (table 2.1).
The status of all antidumping investigations active at the Commission during 2013 is presented in appendix table A.9. A list of all antidumping duty orders, including suspension agreements (agreements to suspend investigations),85 in effect as of the end of 2013 appears in appendix table A.10.
78 19 U.S.C. § 1677(35)(A); see also 19 U.S.C. § 1677a(a) (defining export price), § 1677a(b) (defining constructed export price). 79 19 U.S.C. § 1677b. 80 19 U.S.C. § 1677b(a)(4), § 1677b(e). 81 19 U.S.C. § 1677b(c). 82 19 U.S.C. § 1677(35)(B); 19 U.S.C. § 1673d(c). 83 19 U.S.C. § 1675(a). 84 Data reported here and in the following two sections (“Countervailing Duty Investigations” and “Reviews of Outstanding Antidumping and Countervailing Duty Orders/Suspension Agreements”) reflect the total number of investigations. In other Commission reports these data are grouped by product because the same investigative team and all of the parties participate in a single grouped proceeding, and the Commission generally produces one report and issues one opinion containing its separate determinations for each investigation. 85 An antidumping investigation may be suspended if exporters accounting for substantially all of the imports of the merchandise under investigation agree either to eliminate the dumping or to cease exports of the merchandise to the United States within six months. In extraordinary circumstances, an investigation may be suspended if exporters agree to revise prices to completely eliminate the injurious effect of exports of the merchandise in question to the United States. A suspended investigation is reinstituted if USDOC determines that the suspension agreement has been violated. See 19 U.S.C. § 1673c.
53

Table 2.1 Antidumping duty orders that became effective during 2013a Country Product Range of dumping margins (percent) China Drawn stainless steel sinks 27.14–76.53 China Utility-scale wind towers 44.99–70.63 China Xanthan gum 15.09–154.07 Korea Large residential washers 9.29–82.41 Mexico Large residential washers 36.52–72.41 Taiwan Steel wire garment hangers 69.98–125.43 Vietnam Steel wire garment hangers 157.00–220.68 Vietnam Utility-scale wind towers 51.50–58.49 Source: Compiled by USITC from Federal Register notices. aAntidumping duty orders become effective following final affirmative determinations by USDOC and the Commission. The rates in the table apply in addition to any ordinary customs duty owed.
Countervailing Duty Investigations The U.S. countervailing duty law is also set forth in title VII of the Tariff Act of 1930, as amended. It provides for the imposition of special additional duties to offset (“countervail”) foreign subsidies on products imported into the United States.86 In general, procedures for such investigations are similar to those under the antidumping law. Petitions are filed with the USDOC (the administering authority) and with the Commission. Before a countervailing duty order can be issued, the USDOC must find that a countervailable subsidy exists. In addition, the Commission must make an affirmative determination that a U.S. industry is materially injured or threatened with material injury, or that the establishment of an industry is materially retarded, by reason of the subsidized imports.
The Commission instituted 14 new preliminary countervailing duty investigations and completed 12 final investigations during 2013. Countervailing duties were imposed in 2013 as a result of affirmative Commission determinations in 4 of the completed investigations on four products from three countries (table 2.2). The status of all countervailing duty investigations active at the Commission during 2013 is presented in appendix table A.11, and a list of all countervailing duty orders (including suspension agreements)87 in effect at the end of the year appears in appendix table A.12.
86 A subsidy is defined as when an authority (a government of a country or any public entity within the territory of the country):
(i) provides a financial contribution, (ii) provides any form of income or price support within the meaning of Article XVI of the GATT 1994, or (iii) makes a payment to a funding mechanism to provide a financial contribution, or entrusts or directs a private entity to make a financial contribution, if providing the contribution would normally be vested in the government and the practice does not differ in substance from practices normally followed by governments,
to a person and a benefit is thereby conferred. See 19 U.S.C. § 1677(5)(B). 87 A countervailing duty investigation may be suspended if the government of the subsidizing country or exporters accounting for substantially all of the imports of the merchandise under investigation agree to eliminate the subsidy, to completely offset the net subsidy, or to cease exports of the merchandise to the United States within six months. In extraordinary circumstances, an investigation may be suspended if the government of the subsidizing country or exporters agrees to completely eliminate the injurious effect of exports of the merchandise
54

Table 2.2 Countervailing duty orders that became effective during 2013a
Country Product Range of countervailable subsidy
rates (percent) China Drawn stainless steel sinks 4.80–12.26 China Utility-scale wind towers 21.86–34.81 Korea Large residential washers 1.85–72.30 Vietnam Steel wire garment hangers 31.58–90.42 Source: Compiled by USITC from Federal Register notices. aCountervailing duty orders become effective following final affirmative determinations by USDOC and the Commission. The rates in the table apply in addition to any ordinary customs duty owed.
Reviews of Outstanding Antidumping and Countervailing Duty Orders/Suspension Agreements Section 751(a) of the Tariff Act of 1930 requires the USDOC, if requested, to conduct annual reviews of outstanding antidumping duty and countervailing duty orders to ascertain the amount of any net subsidy or dumping margin and to determine whether suspension agreements are being complied with.88 Section 751(b) also authorizes the USDOC and the Commission, as appropriate, to review certain outstanding determinations and agreements after receiving information or a petition that shows changed circumstances.89 For a changed circumstances review, the party that is asking to have an antidumping duty order, countervailing duty order, or suspension agreement revoked or modified has the burden of persuading the USDOC and the Commission that circumstances have changed enough to warrant review and revocation. On the basis of either the USDOC’s or Commission’s review, the USDOC may revoke an antidumping duty or countervailing duty order in whole or in part, or may either terminate or resume a suspended investigation. No changed-circumstances investigations were conducted at the Commission during 2013.
Section 751(c) of the Tariff Act of 1930 requires both the USDOC and the Commission to conduct sunset reviews of existing antidumping duty and countervailing duty orders and suspension agreements five years after their publication to determine whether revocation of an order or termination of a suspension agreement would be likely to lead to continuation or recurrence of dumping or a countervailable subsidy and material injury.90 During 2013, the USDOC and the Commission instituted 50 sunset reviews, and the Commission completed 26 reviews. As a result, 22 antidumping duty and countervailing duty orders were continued for five more years. Appendix table A.13 shows completed reviews of antidumping duty and countervailing duty orders and suspension agreements in 2013.91
in question to the United States. A suspended investigation is reinstituted if USDOC determines that the suspension agreement has been violated. See 19 U.S.C. § 1671c. 88 19 U.S.C. § 1675(a). 89 19 U.S.C. § 1675(b). 90 19 U.S.C. § 1675(c). 91 For detailed information on reviews instituted, as well as Commission action in all reviews, see the Commission’s website section “Five-Year (Sunset) Reviews” at http://info.usitc.gov/oinv/sunset.NSF.
55

Section 337 Investigations Section 337 of the Tariff Act of 1930, as amended,92 prohibits certain unfair acts in the importation of goods into the United States. Most section 337 investigations involve allegations of patent infringement—specifically, whether products that infringe a valid and enforceable U.S. patent or that are produced by means of an infringed patented process are being imported into the United States, sold for importation, or sold after importation. To find a violation of section 337 based on patent infringement, the Commission must also determine that an industry in the United States related to articles protected by the patent either exists or is in the process of being established. Similar standards govern investigations involving infringement of registered trademarks, registered copyrights, registered mask works, and registered vessel hull designs. In addition, the Commission has broad authority to investigate other unfair methods of competition and unfair acts in the importation and sale of products in the United States (such as products manufactured abroad using stolen U.S. trade secrets), the threat or effect of which is to destroy or injure a U.S. industry, to prevent the establishment of a U.S. industry, or to restrain or monopolize trade and commerce in the United States.93 The Commission may institute an investigation on the basis of a complaint or on its own initiative.94
If the Commission determines that a violation exists, it can issue an exclusion order directing U.S. Customs and Border Protection to block the subject imports from entry into the United States, in addition to cease and desist orders directing the violating parties to stop engaging in the unlawful practices. The orders enter into force unless disapproved for policy reasons by the USTR95 within 60 days of issuance.96
During calendar year 2013, there were 109 active section 337 investigations and ancillary proceedings, 53 of which were instituted that year. Of these 53 new proceedings, 42 were new section 337 investigations and 11 were new ancillary proceedings relating to previously concluded investigations. In 37 of the new section 337 investigations instituted in 2013, patent infringement was the only type of unfair act alleged (although allegations of trade secret misappropriation were later added to 1 investigation). Of the remaining 5 investigations, 1 involved allegations of patent infringement and trade secret misappropriation; 2 involved allegations of only trade secret misappropriation; 1 involved allegations of copyright
92 19 U.S.C. § 1337. 93 Other unfair methods of competition and unfair acts have included common-law trademark infringement, trade dress infringement, trademark dilution, false advertising, and false designation of origin. (“Trade dress,” in general terms, is a product’s total appearance and image, including features such as size, texture, shape, color or color combinations, and graphics.) Unfair practices that involve the importation of dumped or subsidized merchandise must be pursued under antidumping or countervailing duty provisions, not under section 337. 94 19 U.S.C. § 1337(b)(1). 95 19 U.S.C. § 1337(j). Although the statute reserves the review for the President, since 2005 this function has been officially delegated to the USTR. 70 Fed. Reg. 43251 (July 26, 2005). 96 Section 337 investigations at the Commission are conducted before an administrative law judge in accordance with the Administrative Procedure Act, 5 U.S.C. §§ 551 et seq. The judge conducts an evidentiary hearing and makes an initial determination, which is transmitted to the Commission for review. If the Commission finds a violation, it must determine the appropriate remedy, the amount of any bond to be collected while its determination is under review by the USTR, and whether public-interest considerations preclude issuing a remedy.
56

infringement, unfair methods of competition, and unfair acts; and 1 involved allegations of trademark infringement, unfair methods of competition, trademark dilution, and unfair acts.
The Commission completed a total of 55 investigations and ancillary proceedings under section 337 in 2013, including 1 modification proceeding, 2 bond-related proceedings, and 4 enforcement proceedings. In addition, 9 exclusion orders, including 3 general exclusion orders, and 25 cease and desist orders were issued during 2013. The Commission also issued one limited exclusion order and one cease and desist order that were disapproved by the USTR. The Commission terminated 28 investigations without determining whether there had been a violation. Twenty-three of these investigations were terminated on the basis of settlement agreements and/or consent orders.
As in prior years, the section 337 investigations active in 2013 involved a broad spectrum of products. Slightly less than 40 percent of the proceedings involved computer and telecommunications equipment. Consumer electronics products (such as video game systems, Blu-ray disc players, and set-top boxes), small consumer items (such as digital photo frames, cellphone cases, and robotic toys), and pharmaceuticals and medical products (such as reduced folate nutraceuticals, omega-3 supplements, and breathing systems for treating sleep apnea) each represented slightly more than 10 percent of the proceedings. The remaining proceedings—about 30 percent of the total—involved a wide variety of other types of goods, including integrated circuits, liquid-crystal displays, toner cartridges, rubber resins, lighting products, automobile tires, outdoor grills, household cleaning products, and crawler cranes.
At the close of 2013, 54 section 337 investigations and related proceedings were pending at the Commission. Commission activities involving section 337 proceedings in 2013 are presented in appendix table A.14. As of December 31, 2013, there were 96 exclusion orders based on violations of section 337 in effect. Appendix table A.15 lists the investigations in which these exclusion orders were issued.
Trade Adjustment Assistance The United States provides trade adjustment assistance (TAA) to aid U.S. workers and firms adversely affected by import competition or by U.S. production moving to foreign countries.97 The main TAA programs in effect in 2013 were TAA for Workers, administered by the U.S.
97 TAA was first established by the Trade Expansion Act of 1962 (Pub. L. 87-793) and subsequently expanded and reauthorized numerous times. The most recent extension and modification of TAA was made by the Trade Adjustment Assistance Extension Act (TAAEA) of 2011 (Pub. L. 112-40), which was signed into law on October 21, 2011. The TAAEA generally extended most TAA provisions through December 31, 2013. CRS, Trade Adjustment Assistance ((TAA) and Its Role in U.S. Trade Policy, August 5, 2013, 14–16. On January 1, 2014, the 2011 Amendments to the Trade Act expired and the TAA program began operating under the sunset provisions, referred to as “Reversion 2014.” Reversion 2014 is a modified version of the 2002 Program that retains certain elements of the 2011 Program. For example, TAA for Workers under Reversion 2014 provides a wage subsidy to workers involved in a full-time training course lasting for 130 weeks (as in the 2011 Program) but limits worker eligibility to only those in the manufacturing sector (as in the 2002 Program). More examples of Reversion 2014 are provided below. USDOL, “Trade Adjustment Assistance for Workers: Comparison by Petition Number,” n.d. (accessed March 19, 2014).
57

Department of Labor (USDOL), and TAA for Firms, administered by the USDOC.98 A third program, TAA for Farmers, was authorized by the Trade Adjustment Assistance Extension Act (TAAEA) of October 2011, but has not received appropriations since 2011.99 Selected developments in the TAA programs for workers and firms during fiscal year (FY) 2013 are summarized below.100 The most current information on each of the TAA programs, including the status of authorizing legislation and program funding, is available from the respective administering agencies cited in this report.
Assistance for Workers The TAA for Workers program gives federal assistance to eligible workers who have been adversely affected by foreign trade. Assistance includes training and reemployment services, as well as income support, and included a tax credit for health care through 2013.101 Current information on provisions of the TAA for Workers program, as well as detailed information on program eligibility requirements, benefits, and available services, is available at the USDOL’s Employment and Training Administration (ETA) website for TAA, http://www.doleta.gov/tradeact/.
To be certified by USDOL as being eligible for TAA, unemployed workers must establish that they were separated from their employment either because their jobs moved outside the United States or because of an increase in directly competitive imports. (Workers often apply in groups based on their former firms.) Workers at firms that are or were suppliers to or downstream users of the output of TAA-certified firms may also be eligible for TAA benefits. In 2013, both manufacturing and service workers (except those in the public sector) were eligible for TAA.102
98 A TAA program for communities adversely impacted by trade was mostly discontinued by legislation in 2011 because it was considered duplicative of other federal programs. One component of that program, the trade adjustment assistance community college and career training grants, was retained and is administered by the USDOL in partnership with the U.S. Department of Education. CRS, Trade Adjustment Assistance (TAA) and Its Role, August 5, 2013, 14. Further information on the college and career training grants program is available from USDOL, ETA, “Trade Adjustment Assistance Community College and Career Training,” September 18, 2013. 99 The TAA for Farmers program, which was administered by USDA’s Foreign Agricultural Service, provided technical training and cash benefits to eligible U.S. producers of raw agricultural commodities and eligible fishermen whose crops or catch were adversely affected by imports. The program for farmers was first instituted in 2002 by Congress as part of the Trade Act of 2002 (Pub. L. 107-210), and was expanded as part of the American Recovery and Reinvestment Act (ARRA) of 2009 (Pub. L. 111-5) to increase producer eligibility for program benefits. Appropriations from ARRA lasted only through December 2010, and funding lapsed as of January 2011. CRS, TAA for Farmers, September 5, 2012, 2, 5; CRS, Trade Adjustment Assistance (TAA) and Its Role, August 5, 2013, 10–11. The program was re-authorized most recently as part of the TAAEA in October 2011 through the end of 2013, but USDA has not requested or received appropriations for this program between FY 2012 and FY 2014. CRS, TAA for Farmers, September 5, 2012, 5, 11; USDA, Budget Summary and Annual Performance Plans (FYs 2012–15) (accessed March 19, 2014). 100 FY 2013 ran from October 1, 2012, to September 30, 2013. 101 The Health Care Tax Credit expired on January 1, 2014. USDOL, “Trade Adjustment Assistance for Workers: Comparison by Petition Number,” n.d. (accessed March 19, 2014). 102 Since January 1, 2014, under Reversion 2014, services workers whose prior work was not related to manufacturing production are no longer eligible for TAA. In addition, workers who lost their jobs due to
58

Groups of workers submitted 1,480 petitions for TAA in FY 2013, roughly equivalent to the 1,465 petitions filed in FY 2012.103 The ETA certified 1,025 petitions covering 104,158 workers as eligible for TAA, and denied 279 petitions covering 23,628 workers.104 The largest number of petitions certified in FY 2013 were in the South census region (313 petitions covering 37,506 workers), followed by the Midwest (267 petitions covering 26,457 workers), the Northeast (249 petitions covering 20,806 workers), and the West (159 petitions covering 14,465 workers). By state, Texas had the most workers certified (10,853 workers), followed by California (7,609 workers), Pennsylvania (6,571 workers), New York (5,557 workers), and North Carolina (5,313 workers).
The majority (58.1 percent) of TAA petitions certified during FY 2013 were in goods-producing industries, covering 74,052 workers, primarily in the manufacturing sector. The remaining 41.9 percent of TAA petitions certified during FY 2013 were in services sectors, covering 30,106 workers. Among the services sector petitions certified, 17.0 percent were in professional, scientific, and technical services (5,110 workers); 11.4 percent were in information services (3,437 workers); and 8.0 percent were in finance and insurance (2,402 workers). The largest share of petitions that were certified attributed job losses to workers’ firms moving production or services to foreign countries.
Assistance for Firms The TAA for Firms program provided technical and financial assistance to U.S. manufacturers and service sector firms adversely affected by imports in 2013.105 The TAA for Firms program helps eligible firms that have been certified for benefits to develop a business recovery plan (“adjustment proposal”). TAA also provides matching funds to help certified firms expand markets, strengthen their operations, or otherwise increase their global competitiveness.106 Current information on provisions of the TAA for Firms program, as well as detailed information on program eligibility requirements, benefits, and available services, is available at the USDOC’s Economic Development Administration (EDA) website for TAA, http://www.taacenters.org/.
To be eligible for TAA, firms must show that directly competitive imports have contributed to declines in employment and sales or production.107 Assistance is in the form of matching funds
outsourcing are eligible only if their firm’s production shifted to a country with which the United States has an FTA or certain preferential trade agreements. CRS, Trade Adjustment Assistance for Workers, December 17, 2012, 2; USDOL, “Trade Adjustment Assistance for Workers: Comparison,” n.d. (accessed March 19, 2014). 103 ETA’s petition database is found at http://www.doleta.gov/tradeact/taa_reports/petitionsresults.cfm. Data represent actual figures as collected and reported for FY 2013 in TAA’s Trade Act Participant Report (TAPR) data management system. 104 Petitions are accepted and investigated on a rolling basis throughout the year, and petitions may be withdrawn and investigations terminated at any point. For these reasons, the number of petitions certified and denied for TAA in any fiscal year may not equal the total number of petitions filed in that year. USDOL, ETA, “Petition Filing Frequently Asked Questions (FAQ),” n.d. (accessed March 14, 2014). 105 As of January 1, 2014, TAA for Firms no longer offered eligibility to services firms. USDOC, EDA, Fiscal Year 2013 Annual Report to Congress: Trade Adjustment Assistance, 3 (accessed March 29, 2014). 106 Ibid., 3. 107 Ibid., 10–11.
59

that can be applied toward the cost of hiring consultants, engineers, designers, or industry experts for improvement projects in areas such as manufacturing, engineering, marketing, information technology, and quality improvement and sales.108 Under the program, the firm’s management receives help in assessing the firm’s strengths and weaknesses and developing an adjustment proposal to stimulate recovery and growth. Firms generally have up to five years to carry out an approved adjustment proposal.109
EDA reported that in FY 2013 it accepted 105 petitions for TAA, with 105 petitions certified as eligible for assistance and one denied or withdrawn during the year. In comparison, EDA accepted 83 petitions in FY 2012, with 79 certified and 3 denied or withdrawn.110 Firms located in Illinois received the most certifications in FY 2013 (16 certifications, or 15 percent of the total), followed by firms in Pennsylvania (12 certifications, or 11 percent).111 Manufacturing firms accounted for 89 percent of the firms certified for TAA during FY 2013, with firms in manufacturing and technical services, commercial machinery, wholesale trade, and agriculture accounting for the remainder.112 EDA approved 114 adjustment proposals in FY 2013 with total government funding valued at $6.2 million, up from 102 adjustment proposals with government funding valued at $5.4 million approved in FY 2012.113
Tariff Preference Programs Generalized System of Preferences The U.S. Generalized System of Preferences (GSP) program authorizes the President to grant duty-free access to the U.S. market for certain products that are imported from developing countries and territories designated as beneficiaries.114 Certain additional products are allowed duty-free treatment when imported from countries designated as least-developed beneficiary developing countries (LDBDCs). The President’s authority to provide duty-free treatment under the GSP program expired on December 31, 2010,115 and was renewed retroactively on October 21, 2011, effective through July 31, 2013.116 USTR completed an annual review of 2012 imports and announced the results on July 1, 2013. However, on July 31, 2013, the President’s authority to provide duty-free treatment again lapsed and was not renewed during 2013. As detailed below, petitions have continued to be accepted for review so that the program can be reinstituted smoothly if the President’s authority is renewed.
108 Ibid., 9–10. 109 Ibid., 11–12. 110 Petitions are certified on a rolling basis throughout the year. Petitions certified in one fiscal year may be the result of those received or accepted in the previous fiscal year, while petitions received or accepted in a fiscal year may not result in certification in that year. USDOC, EDA, Fiscal Year 2013 Annual Report to Congress: Trade Adjustment Assistance, 13 (accessed March 29, 2014). 111 USDOC, EDA, Fiscal Year 2013 Annual Report to Congress: Trade Adjustment Assistance, n.d, 15–16 (accessed March 29, 2014). 112 Ibid., 17. 113 Ibid., 25. 114 The program is authorized by title V of the Trade Act of 1974, as amended, 19 U.S.C. § 2461 et seq. 115 Pub. L. 111-124. 116 Pub. L. 112-40.
60

The GSP program aims to accelerate economic growth in developing countries by offering unilateral tariff preferences. An underlying principle of the program is that creating trade opportunities for developing countries encourages broad-based economic development and sustains momentum for economic reform and liberalization. The GSP program also allows U.S. companies to have access to intermediate products from beneficiary countries on generally the same terms as those available to competitors in other developed countries that grant similar trade preferences.117
Countries are designated as “beneficiary developing countries” under the GSP program by the President, although they can lose this designation based on petitions alleging improper country practices, including inadequate protection of IPR or of internationally recognized worker rights.118 The President also designates the articles that are eligible for duty-free treatment, but may not designate articles that are designated as “import sensitive” by statute or that he determines to be “import sensitive” in the context of the GSP. Certain articles (for example, footwear, textiles, and apparel) are designated by statute as “import sensitive” and thus not eligible for duty-free treatment under the GSP program. The statute also provides for graduating countries from the program when they become “high income” and for ending the eligibility of articles, or of articles from certain countries, under certain conditions.
Competitive need limitations (CNLs) are another important part of the GSP program’s structure. CNLs are quantitative ceilings on GSP benefits for each product and beneficiary developing country, and are applied during program reviews. The GSP statute provides that a beneficiary developing country will lose its GSP eligibility with respect to a product if the CNLs are exceeded, though waivers may be granted under certain conditions. Under the CNLs, U.S. imports of a particular product from a beneficiary developing country cannot account for 50 percent or more of the value of total U.S. imports of that product during a calendar year, and/or U.S. imports of a particular product cannot exceed a certain dollar value ($160 million in 2013 and increasing by $5 million each year).119 The extension of the GSP program in 2006 provided that a CNL waiver in effect on a product for five or more years should be revoked if U.S. imports from a specific supplier meet certain “super-competitive” value thresholds.120 The following developments affecting the U.S. GSP program occurred in 2013:
• On April 16, 2013, USTR announced initiation of a review of the possible designation of Burma and Laos as GSP beneficiary developing countries.121 A public hearing was held on June 4, 2013.
• Following a public hearing on March 28, and a comment period, the President proclaimed on June 27, 2013, that Bangladesh would be suspended from the GSP program in response to worker rights problems.122
117 USTR, 2012 Trade Policy Agenda, March 2012, 188. 118 The list of current GSP beneficiaries can be found on the USITC’s website at http://www.usitc.gov/publications/docs/tata/hts/bychapter/1400gn.pdf#page=11. 119 USTR, U.S. Generalized System of Preferences (GSP) Guidebook, December 2012, 11. 120 19 U.S.C. § 2463(d)(4)(B)(ii). 121 78 Fed. Reg. 22593 (April 16, 2013). 122 Proclamation 8997, 78 Fed. Reg. 39949 (July 2, 2013).
61

• In the same June 27, 2013, proclamation, one product (corn, other than seed and yellow dent corn from Brazil) was excluded from GSP for exceeding the CNL; a second product (calcium silicon ferroalloys from Brazil) was granted a waiver of its CNL; and certain other technical corrections were made. In addition, country practice reviews continued for a number of GSP beneficiaries. These reviews focused on worker rights, IPR, and arbitral issues.123
• The President’s authority to provide duty-free treatment under the program expired on July 31, 2013. As stated in a Federal Register notice on July 29, 2013, petitions have continued to be accepted for review so that the program can be reinstituted smoothly if the President’s authority is renewed.124
Imports for which GSP preference was claimed totaled $18.5 billion in 2013, accounting for 6.7 percent of total U.S. imports from GSP beneficiary countries and 0.8 percent of total U.S. imports (table 2.3).125 India was the leading GSP beneficiary in 2013, followed by Thailand and Brazil (appendix table A.16). Appendix table A.17 shows the overall sectoral distribution of GSP benefits, and appendix table A.18 shows the top 25 products imported under the GSP in 2013.
Table 2.3 U.S. imports for consumption from GSP beneficiaries, 2011–13 Item 2011 2012 2013
Total imports from GSP beneficiaries (million $) 365,902 338,138 276,950 Total imports under GSP (million $) a 18,539 19,857 18,516
Imports under LDBDC provisions (million $)b 503 540 622 Imports under non-LDBDC provisions (million $)c 18,036 19,317 17,894
Share of total imports under GSP (percent of total) 5.1 5.9 6.7 Source: Official trade statistics of the USDOC as maintained by the USITC. Note: LDBDCs = least-developed beneficiary developing countries. The President’s authority to provide duty-free treatment under the GSP program expired on December 31, 2010, and was restarted on October 21, 2011; trade data for this period include retroactive entries. The President’s authority expired again on July 31, 2013, and has yet to be renewed. Data for 2013 since the expiration include imports that have GSP petitions on file in anticipation of renewal of the program. aThere were 127 GSP beneficiary countries for which U.S. importers could claim GSP duty preferences in 2013. However, U.S. importers claimed such preferences for imports from only 95 beneficiaries. bLDBDC-eligible products are those for which a rate of duty of “free” appears in the special rate column of the HTS, followed by the symbol “A+” in parentheses. The symbol “A+” indicates that all LDBDCs (and only LDBDCs) are eligible for duty-free treatment with respect to all articles listed in the designated provisions. cNon-LDBDC-eligible products are those for which a rate of duty of “free” appears in the special rate column of the Harmonized Tariff Schedule of the United States (HTS) followed by the symbols “A” or “A*” in parentheses. The symbol “A” indicates that all beneficiary countries are eligible for duty-free treatment with respect to all articles listed in the designated provisions. The symbol “A*” indicates that certain beneficiary countries (specified in general note 4(d) of the HTS) are not eligible for duty-free treatment with respect to any article provided for in the designated provision.
123 Ibid. 124 78 Fed. Reg. 45596 (July 29, 2013). 125 Imports entering the United States free of duty under preference programs are given duty-free preference only upon an importer’s claim for each shipment, supported with documentation. Note that imports after July 31, 2013, did not actually enter duty-free, but importers still claimed GSP status to facilitate receiving refunds in case GSP is renewed retroactively, as has been done in the past.
62

African Growth and Opportunity Act The African Growth and Opportunity Act (AGOA or Act) was enacted in 2000 to promote stable and sustainable economic growth and development in sub-Saharan Africa. In a statement of policy in the Act, Congress expressed support for, among other things, “encouraging increased trade and investment between the United States and Sub-Saharan Africa” and “reducing tariff and nontariff barriers and other obstacles to sub-Saharan African and United States trade.”126 By granting unilateral trade benefits to eligible beneficiary sub-Saharan African (SSA) countries, AGOA aims to promote political and economic reform in SSA, encourage regional economic integration, strengthen private sectors, and facilitate the development of civil societies and political freedom.127 Authority to provide the principal trade preferences under AGOA is currently in effect through September 30, 2015.
AGOA builds on the U.S. GSP program, providing duty-free access to the U.S. market for all GSP-eligible products128 and for an additional 1,800 qualifying tariff line-item products from designated SSA countries. In addition, AGOA authorizes duty-free treatment to certain textile and apparel articles made in qualifying beneficiary SSA countries.129 In 2013, approximately 6,800 tariff lines were eligible for duty-free treatment under AGOA.130
AGOA authorizes the President to designate an SSA country as an AGOA beneficiary country if the President determines the country meets the eligibility requirements set forth in section 104(a) of the Act.131 The Act also requires the President to review annually whether SSA countries are, or remain, eligible for AGOA benefits based on the eligibility criteria.132 In 2013, a total of 39 SSA countries were designated as eligible for AGOA benefits,133 and 27 of these also qualified for AGOA textile and apparel benefits.134 Of the countries in the latter group, all but
126 Trade and Development Act of 2000, 19 U.S.C. 3701, Title I, sec. 103 (Pub. L.106-200), 19 U.S.C. § 3702. 127 Ibid. 128 The eligibility criteria for GSP and AGOA substantially overlap, and countries must be GSP-eligible in order to receive trade benefits under AGOA. USDOC, ITA, “AGOA: General Country Eligibility Provisions,” n.d. (accessed March 5, 2014). 129 19 U.S.C. § 3721. AGOA provisions that provide preferential treatment for certain textiles and apparel also expire on September 30, 2015. 19 U.S.C. § 3721(f). 130 These tariff lines do not include imports under the AGOA apparel and textile provisions. 131 19 U.S.C. § 3703(a). 19 U.S.C. § 3706 lists a total of 49 SSA countries, or their successor political entities, as potential AGOA beneficiaries. 132 19 U.S.C. § 2466a(a)(2). 133 The following 39 countries were listed in general note 16 of the HTS as designated AGOA beneficiaries during 2013: Angola, Benin, Botswana, Burkina Faso, Burundi, Cameroon, Cabo Verde, Chad, Comoros, Republic of the Congo, Côte d’Ivoire, Djibouti, Ethiopia, Gabon, The Gambia, Ghana, Guinea, Kenya, Lesotho, Liberia, Malawi, Mauritania, Mauritius, Mozambique, Namibia, Niger, Nigeria, Rwanda, São Tomé and Príncipe, Senegal, Seychelles, Sierra Leone, South Africa, South Sudan, Swaziland, Tanzania, Togo, Uganda, and Zambia. USITC, Harmonized Tariff Schedule of the United States (HTS) 2013, January 2013, 188. 134 Twenty-eight countries are listed in U.S. Note 7(a) of the HTS as eligible to receive AGOA apparel benefits as of January 1, 2014. These countries include 27 countries eligible in 2013 plus Mali, which was restored to AGOA benefits on January 1, 2014. The eligible countries in 2013 included Benin, Botswana, Burkina Faso, Cameroon, Cabo Verde, Chad, Côte d’Ivoire, Ethiopia, The Gambia, Ghana, Kenya, Lesotho, Liberia, Malawi, Mauritius, Mozambique, Namibia, Niger, Nigeria, Rwanda, Senegal, Sierra Leone, South Africa, Swaziland, Tanzania, Uganda, and Zambia. USITC, Harmonized Tariff Schedule of the United States (HTS) 2014, January 2014, section XXII, chapter
63

one (South Africa) were also eligible for additional textile and apparel benefits for lesser developed beneficiary countries. Notable among these extra benefits is the third-country fabric provision, which allows beneficiary countries to use non-U.S., non-AGOA fabrics in apparel exports under AGOA.
South Sudan became eligible for AGOA benefits in December 2012, while Guinea-Bissau and Mali lost their eligibility as of January 1, 2013.135 However, in December 2013 the President announced that Mali would be reinstated as of January 1, 2014, due to Mali’s inauguration of a democratically elected president in July 2013.136
In 2013, U.S. imports that entered duty-free from AGOA beneficiary countries under either AGOA or GSP were valued at $26.8 billion. They accounted for 70.2 percent of total imports from AGOA countries and represented a 23.1 percent decrease in value from 2012. Articles entering the United States free of duty exclusively under AGOA (excluding GSP) were valued at $24.8 billion, accounting for 64.9 percent of total imports from AGOA countries and representing a 24.3 percent decrease from 2012 (table 2.4). The drop in the value of petroleum-related product imports, particularly from Nigeria, Angola, and Gabon, was an important factor in the decrease of total imports under AGOA.137
The leading suppliers of duty-free U.S. imports under AGOA in 2013 were Nigeria (43.6 percent of total AGOA imports), Angola (24.2 percent), South Africa (10.4 percent), Chad (9.7 percent), the Republic of the Congo (4.2 percent), and Gabon (3.7 percent).138 These six countries accounted for 95.8 percent of total imports by value under AGOA, a decrease of 0.8 percentage points from 2012 (appendix table A.19). Petroleum-related products remained the leading
Table 2.4 U.S. imports for consumption from AGOA beneficiaries, 2011–13 Item 2011 2012 2013
Total imports from AGOA countries (million $) 72,198 47,638 38,209 Total imports under AGOA, including GSP (million $)a 53,840 34,892 26,816 Total Imports under AGOA, excluding GSP (million $) 51,883 32,748 24,798 Share of total imports under AGOA (percent of total) 74.6 73.2 70.2
Source: Official trade statistics of the USDOC as maintained by the USITC. aAGOA-eligible products are those for which a rate of duty of “free” appears in the special rate column of the HTS followed by the symbol “D” in parentheses. The symbol “D” indicates that all AGOA beneficiaries are eligible for duty-free treatment with respect to all articles listed in the designated provisions. In addition, provisions of subchapters II and XIX of chapter 98 of the HTS set forth specific categories of AGOA-eligible products, under the terms of separate country designations enumerated in subchapter notes. Includes imports for which preferential tariff treatment was claimed by U.S. importers under GSP, for HTS rate lines with special duty symbols “A” or “A+.”
98, 98-II-3, U.S. Note 7(a). Also, see USDOC, OTEXA, “Trade Preference Programs: AGOA,” n.d. (accessed December 6, 2013). Côte d’Ivoire qualified for AGOA apparel benefits in March 2013. 78 Fed. Reg. 16908 (March 19, 2013). 135 Proclamation 8921 of December 20, 2012, “To Take Certain Actions under the African Growth and Opportunity Act and for Other Purposes,” 77 Fed. Reg. 76799 (December 28, 2012). 136 USTR, “Mali Now Eligible for Trade Benefits,” December 24, 2013; 78 Fed. Reg. 80417 (December 31, 2013). 137 The decline in AGOA petroleum imports reflects the decline in total U.S. imports of these products. As noted in chapter 1, strong crude oil production growth in the United States has resulted in a “significant decline” in U.S. petroleum imports. USEIA, “Short-term Energy Outlook,” February 11, 2014. 138 The share is based on exclusive AGOA imports and does not include imports under GSP.
64

imports under AGOA, accounting for 85.6 percent of total AGOA imports in 2013, though they were down by 4.4 percentage points from 90.0 percent in 2012. The total value of petroleum-related imports dropped from $29.5 billion in 2012 to $21.2 billion in 2013, a 28.0 percent decrease (appendix table A.20). Imports of apparel increased 11.2 percent, from $0.8 billion in 2012 to $0.9 billion in 2013. As a percentage of total AGOA imports by value, apparel rose from 2.5 percent in 2012 to 3.6 percent in 2013.139
Section 105 of AGOA required the President to establish the U.S.-SSA Trade and Economic Cooperation Forum (also known as the AGOA Forum) through which USTR and the Secretaries of State, Commerce, and the Treasury meet with senior officials from AGOA-eligible countries to discuss trade, investment, and development relationships.140 The 12th AGOA Forum was held in Addis Ababa, Ethiopia, on August 9–13, 2013. The event brought together senior officials from the United States and AGOA-eligible African countries to discuss a range of trade and investment issues.141 The theme of the 2013 AGOA Forum was “Sustainable Transformation through Trade and Technology.”
Because AGOA is scheduled to expire in September 2015, U.S. Trade Representative Froman announced at the 2013 AGOA Forum that he would be launching a comprehensive review of the AGOA program to assess how well AGOA has met its stated goals. The review is to include inputs from AGOA’s many stakeholders, a hearing, and roundtables on a range of AGOA issues. Additionally, the USTR asked the Commission to provide four reports related to AGOA.142 The USTR said that the results of all these activities will help inform the Administration’s consultations with Congress on the future of the AGOA program.143
Andean Trade Preference Act The Andean Trade Preference Act (ATPA) was enacted in 1991 to promote broad-based economic development and viable economic alternatives to coca cultivation and cocaine production by offering Andean countries (Bolivia, Colombia, Ecuador, and Peru) broader access to the U.S. market.144 The President’s authority to provide preferential treatment under ATPA expired on December 4, 2001, but was renewed and expanded by the Andean Trade Promotion and Drug Eradication Act (ATPDEA), part of the Trade Act of 2002.145 The President’s authority
139 USITC DataWeb/DOC (accessed March 5, 2014). 140 19 U.S.C. § 3704. 141 USDOS, “AGOA Forum 2013” (accessed January 3, 2014). 142 The Commission’s reports and the investigations under which they were prepared are investigation no. 332-542, AGOA: Trade and Investment Performance Overview; investigation no. 332-544, AGOA: Economic Effects of Providing Duty-Free Treatment for Imports; investigation no. 332-545, U.S. AGOA Rules of Origin: Possible Changes to Promote Regional Integration and Increase Exports to the United States; and investigation no. 332-546, EU-South Africa FTA: Impact on U.S. Exports to South Africa. See also USITC, “Sub-Saharan African Trade and Investment under AGOA,” November 13, 2013. 143 USTR, “USTR Froman Looks to Next Steps,” August 13, 2013. 144 For a more detailed description of ATPA, including country and product eligibility, see USITC, Andean Trade Preference Act, September 2012. 145 Pub. L. 107-210, title XXXI. ATPA beneficiaries are not automatically eligible for ATPDEA preferences. ATPDEA authorizes the President to designate any ATPA beneficiary as eligible for ATPDEA benefits, provided the President determines the country has satisfied certain requirements, including protection of IPR and internationally
65
to provide preferential treatment under ATPA, as amended by ATPDEA, has expired and been renewed a number of times since then, including in 2011. (The authority expired on February 12, 2011, and was renewed retroactively on October 21, 2011, through July 31, 2013.)146 The President’s authority to provide preferential treatment under both ATPA and ATPDEA expired on July 31, 2013, and as of the end of 2013 had not been renewed.147
At the time the President’s authority expired on July 31, 2013, three out of the four original beneficiary countries—Bolivia, Peru, and Colombia—had been removed from ATPA. Bolivia lost its eligibility on December 15, 2008, for failing to meet ATPA’s counternarcotics cooperation criteria.148 Peru lost its eligibility by statute effective January 1, 2011, following entry into force of the U.S.-Peru Trade Promotion Agreement (TPA). Most recently, Colombia also lost its eligibility by statute when the U.S.-Colombia TPA entered into force on May 15, 2012.149 After May 2012, Ecuador was the only remaining ATPA beneficiary country. However, on June 27, 2013, the Ecuadorian government announced that it would withdraw from the ATPA program.150
A wide range of products are eligible for duty-free entry under ATPA as originally enacted. ATPDEA amended ATPA to provide duty-free treatment for certain products previously excluded from ATPA, including certain textiles and apparel, certain footwear, tuna in foil or other flexible airtight packages (not cans), crude petroleum and petroleum products, and watches and watch parts assembled from components originating in countries not eligible for U.S. normal trade relations (NTR) rates of duty.151 Products that continue to be excluded from ATPA preferential treatment include textile and apparel articles not otherwise eligible for preferential treatment under ATPDEA (primarily textile articles), certain footwear, canned tuna, rum and tafia, and above-quota imports of certain agricultural products subject to TRQs (primarily sugar, beef, and dairy products).
Total (dutiable and duty-free) U.S. imports from ATPA-eligible countries were valued at $11.5 billion in 2013, down 43.4 percent from $20.2 billion in 2012. There were two principal reasons for the decline: Ecuador was the only eligible country in 2013 following Colombia’s departure in May 2012, and the President’s authority to provide preferential treatment under ATPA expired
recognized workers’ rights. The President designated all four ATPA beneficiaries as ATPDEA beneficiaries on October 31, 2002. Proclamation No. 7616, “To Implement the Andean Trade Promotion and Drug Eradication Act,” 67 Fed. Reg. 67283 (October 31, 2002). 146 Pub. L. 112-42, § 501. Importers had 180 days to claim retroactive refunds. USDHS, USCBP, “Memorandum on the Renewal of ATPA,” October 24, 2011. 147 USDHS, USCBP, “Expiration of GSP, ATPA, and ATPDEA,” July 12, 2013. 148 Proclamation No. 8323 of November 25, 2008, 73 Fed. Reg. 72667 (November 28, 2008). 149 Proclamation No. 8818 of May 14, 2012, 77 Fed. Reg. 29519 (May 18, 2012). 150 Embassy of Ecuador, “Statement on the Renunciation of ATPDEA,” June 27, 2013. According to USTR, Ecuador stopped receiving benefits when the program expired on July 31, 2013. USTR, 2014 Trade Policy Agenda and 2013 Annual Report, March 2014, V.195; Valencia and Ellsworth, “Ecuador Offers U.S. Rights Aid, Waives Trade Benefits,” June 27, 2013 (quoting the USTR’s comment that Ecuador remained eligible for trade benefits despite Ecuador’s renunciation). 151 Also known as Most Favored Nation (MFN) rates of duty.
66

at the end of July (table 2.5 and appendix table A.21).152 Similarly, U.S. imports specifically under ATPA declined by 77.7 percent in 2013 to $2.5 billion, down from $11.4 billion in 2012. U.S. imports under ATPDEA accounted for 91.6 percent of imports under ATPA in 2013 ($2.3 billion) and U.S. imports under the original ATPA (ATPA excluding ATPDEA) accounted for the remaining 8.4 percent, valued at $212 million.
Crude petroleum and petroleum products accounted for 89.1 percent of U.S. imports under ATPA in 2013 and represented 3 of the top 25 U.S. imports under the program (appendix table A.22). Fresh cut flowers (ornamental or for bouquets) was the next-largest category of imports under ATPA, accounting for 4.9 percent of such imports and for three of the leading imports under ATPA. The share of U.S. imports under ATPA accounted for by all other imports was 5.9 percent in 2013.
Table 2.5 U.S. imports for consumption from ATPA countries, 2011–13 Item 2011 2012 2013
Total imports from ATPA countries (million $)a 31,891 20,228 11,454 Total imports under ATPA/ATPDEA (million $)b 4,385 11,406 2,538
Imports under ATPDEA (million $)c 3,965 10,605 2,326 Imports under ATPA excluding ATPDEA (million $)d 420 801 212
Total imports under ATPA (as a share of all imports from ATPA countries) 13.7 56.4 22.2 Source: Official trade statistics of the USDOC as maintained by the USITC. Note: The President’s authority to provide duty-free treatment lapsed between February 12, 2011, and October 21, 2011; retroactive entries under ATPA are included for this time period. ATPA expired again on July 31, 2013. aTotal imports from Colombia are included through May 2012 and for Ecuador, the last remaining beneficiary, through 2013. bIncludes imports recorded as entering under ATPA/ATPDEA after loss of eligibility or expiration of the agreement from Peru in 2011, from Colombia in 2012, and from Ecuador in 2013. Imports from Ecuador under ATPA/ATPDEA ceased after October 2013. cATPDEA-eligible products are those for which a rate of duty of “free” appears in the special rate column of the HTS followed by the symbol “J+” in parentheses. The symbol “J+” indicates that all ATPDEA beneficiary countries are eligible for duty-free treatment with respect to all articles listed in the designated provisions. dATPA-eligible products (excluding ATPDEA-eligible products) are those for which a special duty rate appears in the special rate column of the HTS, followed by the symbols “J” or “J*” in parentheses. The symbol “J” indicates that all beneficiary countries are eligible for special duty rate treatment with respect to all articles listed in the designated provisions. The symbol “J*” indicates that certain articles, specified in general note 11(d) of the HTS, are not eligible for special duty rate treatment with respect to any article listed in the designated provision. In addition, subchapter XXI of chapter 98 sets forth provisions covering specific products given duty-free eligibility under the ATPDEA, under the terms of separate country designations enumerated in that subchapter.
152 Total U.S. imports from Colombia in 2012 are included only for those months when Colombia was an ATPA beneficiary country.
67

Caribbean Basin Economic Recovery Act The Caribbean Basin Economic Recovery Act (CBERA) was enacted in 1983 as part of the Caribbean Basin Initiative to encourage economic growth and development in the Caribbean Basin countries by using duty preferences to promote increased production and exports of nontraditional products.153 The Caribbean Basin Trade Partnership Act (CBTPA) amended CBERA in 2000 and expanded the list of qualified articles, for eligible countries, to include certain apparel.154 The CBTPA also extended “NAFTA-equivalent treatment”—that is, rates of duty equivalent to those accorded to goods using the rules of origin applicable under the North American Free Trade Agreement (NAFTA)—to a number of other products previously excluded from CBERA. These products included certain tuna; crude petroleum and petroleum products; certain footwear; watches and watch parts assembled from parts originating in countries not eligible for NTR rates of duty; and certain handbags, luggage, flat goods, work gloves, and leather wearing apparel. Products that are still excluded from CBERA preferential treatment include textile and apparel products not otherwise eligible for preferential treatment under CBTPA (mostly textile products) and above-quota imports of certain agricultural products subject to TRQs (primarily sugar, beef, and dairy products). CBTPA preferential treatment provisions were extended in 2010 through September 30, 2020, while other parts of CBERA have no expiration date.155 In the section that follows, the term CBERA refers to CBERA as amended by the CBTPA.
At the end of 2013, 17 countries and dependent territories were eligible for CBERA preferences156 and 8 were eligible for CBTPA preferences.157 Panama lost its eligibility for both CBERA and CBTPA preferences when the U.S.-Panama TPA entered into force on October 31, 2012.158 Also in 2012, several countries asked to be designated as eligible for benefits under CBERA, CBTPA, or both, but only one had achieved eligibility by yearend 2013. The Turks and Caicos Islands requested eligibility under CBERA; Aruba, The Bahamas, Dominica, Grenada, Montserrat, St. Kitts and Nevis, and St. Vincent and the Grenadines, under CBTPA;159 and Curaçao and Sint Maarten, under CBERA and CBTPA.160 (Until 2010, Curaçao and Sint Maarten
153 For a more detailed description of CBERA, including country and product eligibility, see USITC, Caribbean Basin Economic Recovery Act, 21st Report 2011–12, September 2013. 154 Textiles and apparel not subject to textile agreements in 1983 (which includes only textiles and apparel of silk or non-cotton vegetable fibers, mainly linen and ramie) are eligible for duty-free entry under the original CBERA provisions, which do not have an expiration date. 155 Certain preferential treatment provisions relating to import-sensitive textile and apparel articles from CBERA countries and relating to textile and apparel articles imported under special rules for Haiti (see section on Haiti below) have been extended to September 30, 2020. This occurred on May 24, 2010, when the President signed the Haiti Economic Lift Program Act of 2010, Pub. L. 111-171, § 3. 156 Antigua and Barbuda, Aruba, The Bahamas, Barbados, Belize, Curaçao, Dominica, Grenada, Guyana, Haiti, Jamaica, Montserrat, St. Kitts and Nevis, St. Lucia, St. Vincent and the Grenadines, Trinidad and Tobago, and the British Virgin Islands. 157 Barbados, Belize, Curaçao, Guyana, Haiti, Jamaica, St. Lucia, and Trinidad and Tobago. 158 Proclamation No. 8894, 77 Fed. Reg. 66507 (November 5, 2012). 159 USTR, “Joint Statement from U.S.-CARICOM,” March 31, 2012; 77 Fed. Reg. 61816 (October 11, 2012). 160 77 Fed. Reg. 61816 (October 11, 2012). USTR, Tenth CBERA Report, December 31, 2013. In addition, Suriname requested beneficiary status under CBERA and CBTPA in December 2009, and in April 2010, USTR asked for public comments regarding this request. 75 Fed. Reg. 17198 (April 5, 2010).
68

were members of the now-dissolved Netherlands Antilles.) On December 31, the President designated Curaçao as a beneficiary country for purposes of CBERA and CBTPA.161
U.S. imports under CBERA fell by 24.4 percent, from $3.1 billion in 2012 to $2.4 billion in 2013 (table 2.6). This decrease reflected a decline in the value of 2013 U.S. imports of crude petroleum, knitted apparel products, undenatured ethyl alcohol, and melamine, which are major imports from CBERA countries. The decrease also reflected the fact that, as just noted, Panama lost eligibility for CBERA benefits at the end of October 2012 when the U.S.-Panama TPA entered into force. U.S. imports under CBERA accounted for 26.5 percent of all U.S. imports from CBERA countries in 2013. Trinidad and Tobago continued as the leading supplier of U.S. imports under CBERA in 2013, accounting for 69.2 percent of the total. Haiti and The Bahamas were also leading suppliers (appendix table A.23).
Mineral fuels, methanol, and apparel products dominated the list of imports under CBERA in 2013 (appendix table A.24). Of the 25 leading products under CBERA in 2013, 12 were agricultural and food products, which entered under CBERA preferences (accounting for 3.6 percent of total U.S. imports under CBERA in 2013); 3 were knitted apparel entered under CBTPA (14.2 percent); 2 were petroleum and fuel products entered under CBTPA (21.2 percent); 2 were organic chemicals entered under CBERA (50.4 percent); and the remaining 6 were miscellaneous products that qualify for benefits under CBERA provisions. Together, these 25 leading imports accounted for 97.2 percent of total U.S. imports under CBERA in 2013.
Table 2.6 U.S. imports for consumption from CBERA countries, 2011–13
Item 2011 2012 2013
Total imports from CBERA countries (million $)a 14,515 11,849 8,954
Total imports under CBERA/CBTPA (million $)b 3,619 3,137 2,371
Imports under CBTPA (million $)c 1,879 1,633 852
Imports under CBERA, excluding CBTPA (million $)d 1,740 1,504 1,520
Total imports under CBERA (as a share of all imports from CBERA countries) 24.9 26.5 26.5 Source: Official trade statistics of the USDOC as maintained by the USITC. aData for 2012 include U.S. imports from Panama only for the period during which Panama was eligible for CBERA benefits before the U.S.-Panama FTA entered into force on October 31, 2012. bIncludes a small amount of imports reported as originating from the Netherland Antilles in 2011. cCBTPA-eligible products are those for which a special duty rate appears in the special rate column of the HTS, followed by the symbol “R” in parentheses. The symbol “R” indicates that all CBTPA beneficiary countries are eligible for special duty rate treatment with respect to all articles listed in the designated provisions. In addition, subchapters II and XX of chapter 98 set forth provisions covering specific products eligible for duty-free entry, under separate country designations enumerated in those subchapters (and including the former CBTPA beneficiaries). dCBERA (excluding CBTPA)-eligible products are those for which a special duty rate appears in the special rate column of the HTS, followed by the symbols “E” or “E*” in parentheses. The symbol “E” indicates that all beneficiary countries are eligible for special duty rate treatment with respect to all articles listed in the designated provisions. The symbol “E*” indicates that certain articles, specified in general note 7(d) of the HTS, are not eligible for special duty rate treatment with respect to any article listed in the designated provision.
161 78 Fed. Reg. 80417 (December 31, 2013). 69

Haiti Initiatives Since 2006, CBERA has been amended three times to expand and enhance trade benefits for Haiti and to give Haitian apparel producers more flexibility in sourcing yarns and fabrics.162 In 2006, the Haitian Hemispheric Opportunity through Partnership Encouragement Act of 2006 (HOPE Act)163 amended CBERA to expand the rules of origin for inputs to apparel and wire harness automotive components assembled in Haiti and imported into the United States.164 In 2008, the Haitian Hemispheric Opportunity through Partnership Encouragement Act of 2008 (HOPE II Act)165 amended the HOPE Act to enhance the existing provisions and provide additional trade preferences to attract new investment and jobs in Haiti while also offering incentives to encourage the use of U.S. inputs.166 Finally, in 2010, the President signed into law the Haiti Economic Lift Program of 2010 (HELP Act).167 The HELP Act expanded existing U.S. trade preferences168 (especially duty-free treatment for certain qualifying apparel) for Haiti that were established under the CBTPA and the HOPE Act and HOPE II (collectively referred to as HOPE or the HOPE Acts).
U.S. imports of apparel from Haiti totaled $765.9 million in 2013, up 4.9 percent from $730.0 million in 2012 (table 2.7).169 Virtually all (99.7 percent) U.S. imports of apparel from Haiti entered duty-free under trade preference programs in 2013.170 The continued growth in U.S. imports of apparel from Haiti in 2013 since the devastating earthquake in January 2010 has
162 Haiti’s textiles and apparel industry is the largest sector of the country’s economy and is considered a key growth area. Barrie, “Haiti: Sae-A Trading on Track to Begin Production,” September 18, 2012; USDOS, U.S. Embassy, Port-au-Prince, “Haiti: FY2012 Second Quarter Report on the NEI Initiative,” April 27, 2012. 163 Pub. L. 109-432, sect. 5001 et seq., the Haitian Hemispheric Opportunity through Partnership Encouragement Act of 2006. 164 There were no U.S. imports of wire harness automotive components from Haiti during 2007–2013. 165 Pub. L. 110-234, sect. 15401 et seq., the Haitian Hemispheric Opportunity through Partnership Encouragement Act of 2008. 166 GAO, “Letter to the Honorable Max Baucus and the Honorable Dave Camp,” December 14, 2012. For more details on the programs under the HOPE Acts, see USITC, The Year in Trade 2010, July 2011, 2-21 to 2-22; USITC, Textiles and Apparel: Effects of Special Rules, June 2008, i, ES-1, 1-3 to 1-5. 167 Pub. L. 111-171, sect. 2, Haiti Economic Lift Program Act of 2010. 168 Key provisions under the HELP Act include (1) extension of the CBTPA and HOPE Acts through September 30, 2020 (from the earlier expiration of September 30, 2018); (2) provision of duty-free treatment for additional textile and apparel products that are wholly assembled or knit to shape in Haiti regardless of the origin of the inputs; (3) increase in the respective tariff preference levels under which certain Haitian knit and woven apparel products may receive duty-free treatment, regardless of the origin of inputs, from 70 million to 200 million square meter equivalents; and (4) liberalization of the earned import allowance rule by allowing the duty-free importation of one square meter equivalent of apparel wholly assembled or knit to shape in Haiti, regardless of the origin of the inputs, for every two square meter equivalents (previously it was for every three square meter equivalents) of qualifying fabric from the United States. The HELP Act also inserted two new headings into the HTS: 9820.61.45 (certain knit apparel) and 9820.63.05 (home goods). For additional details on the HELP Act, see USITC, The Year in Trade 2010, July 2011, 2-21 to 2-22. 169 Haitian apparel production remains concentrated in high-volume commodity garments that have reasonably predictable consumer demand and few styling changes. Cotton knit shirts and blouses, cotton underwear, and cotton trousers and pants dominated U.S. imports from Haiti, accounting for 49 percent, 15 percent, and 11 percent, respectively, of total U.S. imports of apparel from Haiti in 2013. 170 Based on data from USDOC, OTEXA, “U.S. Imports under Trade Preference Programs” (accessed various dates).
70

Table 2.7 U.S. imports for consumption of apparel from Haiti, 2011–13 Item 2011 2012 2013
Total apparel imports from Haiti (million $) 701.5 730.0 765.9 Apparel imports under a trade preference program (million $) 689.1 727.0 763.6
CBERA/CBTPA (million $) 461.4 423.6 341.7 HOPE and HELP Acts (million $) 227.7 303.4 421.9
Share of total apparel imports from Haiti: (percent) Apparel imports under a trade preference program 98.2 99.6 99.7
CBERA/CBTPA 65.8 58.0 44.6 HOPE and HELP Acts 32.5 41.6 55.1
Source: Official trade statistics of the USDOC as maintained by the USITC. Note: Because of rounding, figures may not add up to totals shown.
been attributed to these preference programs, which offer unlimited duty-free treatment for certain apparel products and limited duty-free treatment for other apparel products up to certain quotas known as tariff preference levels (TPLs).171 Nevertheless, industry sources in Haiti report that the Haitian apparel industry’s capacity to take full advantage of these preferences remains hobbled by internal problems. They state that although improvements are slowly being made in Haiti’s infrastructure—ports, airports, and roads—shortages of building space and adequate facilities still hamper the industry’s ability to substantially increase production.172 In addition, they report that Haitian apparel producers have lower productivity than other producers in the Western Hemisphere, such as Nicaragua and Guatemala.173
In 2013, Haiti accounted for nearly all (99.7 percent) of U.S. imports of apparel entering under the CBTPA. Just under half (44.6 percent) of total U.S. imports of apparel from Haiti entered under CBTPA provisions in 2013. The value of U.S. imports of apparel entering under the HOPE Acts rose by 39.1 percent, from $303.4 million in 2012 to $421.9 million in 2013,174 and represented over half (55.1 percent) of total U.S. apparel imports that entered free of duty from Haiti. Over three-fourths ($331.9 million) of the apparel imported into the United States from Haiti under the HOPE Acts entered under tariff preference levels that allow duty-free treatment for certain apparel up to established annual quotas (“restraint limits”).175 About one-third ($135.0 million) of these U.S. imports of apparel from Haiti entered under the woven
171 USDOS, U.S. Embassy, Port-au-Prince, “Haiti Response to USITC Biennial Caribbean Basin Investment Survey,” July 5, 2013. 172 U.S. apparel industry representative, telephone interview by USITC staff, January 31, 2014; Haitian apparel industry representatives, telephone interviews by USITC staff, February 4, 2014. 173 U.S. government representative, email message to USITC staff, February 11, 2014. 174 Data on trade under the HOPE Acts are from USDOC, OTEXA,“U.S. Imports under Trade Preference Programs” (accessed various dates). 175 The tariff preference limits allow certain knit and woven apparel (both of which must be wholly assembled in Haiti), as well as certain apparel for which at least 50–60 percent of the export value added must consist of inputs from Haiti, the United States, or a country with which the United States has an FTA, to enter the United States free of duty, regardless of the source of the fabric. The tariff preference limits allow certain knit and woven apparel (both of which must be wholly assembled in Haiti) as well as certain apparel for which the export value added must have a minimum of inputs from Haiti, the United States, or country with which the United States has an FTA, of 50 to 60 percent, to enter the United States free of duty regardless of the source of the fabric.
71

apparel restraint limit in 2013. Over half ($230.3 million) of the imports of apparel from Haiti entered under the knit apparel and value-added restraint limits the same year.176
Virtually all of the remaining U.S. imports ($90.0 million) under the HOPE Acts in 2013 entered under the Earned Import Allowance Program (EIAP), a special trade program created under HOPE II in 2008 that allowed the duty-free entry into the United States of certain apparel manufactured in Haiti. The EIAP originally provided that for every 3 square meter equivalents of qualifying fabric (defined as formed in the United States from U.S.-formed yarns) purchased or manufactured by the producer for apparel production in Haiti, a 1-unit credit was received that could be used toward the duty-free importation of apparel in the United States that was produced using non-qualifying fabric. In 2010, the HELP Act reduced the EIAP exchange ratio from 3-for-1 to 2-for-1 in an effort to encourage the program’s use, since no apparel from Haiti was exported to the United States under the original 3-for-1 program. The near tripling of U.S. imports of apparel from Haiti under the EIAP from $34.7 million in 2012 to $90.0 in 2013 can likely be attributed to apparel producers’ growing familiarity with the program and their taking advantage of credits earned on goods that otherwise would not qualify for duty-free treatment.177 No U.S. imports entered in 2013 under two other HELP provisions added in 2010; i.e., HTS 9820.61.45 (certain knit apparel—unlimited) and HTS 9820.63.05 (home goods).
176 The fill rates for the woven apparel restraint limit (HTS subheading 9820.62.05), knit apparel restraint limit (HTS subheading 9820.61.35), and value-added restraint limits (HTS subheadings 9820.61.25 and 9820.61.30) were 47.3 percent, 58.3 percent, and 5.5 percent respectively, for the preferential treatment period October 1, 2012, to September 30, 2013. 177 U.S. government representative, email message to USITC staff, February 11, 2014.
72

Chapter 3 The WTO, OECD, APEC, and TISA This chapter covers developments in 2013 in the World Trade Organization (WTO), including multilateral trade negotiations under the Doha Development Agenda; the work programs, decisions, and reviews of the WTO General Council; meetings held under WTO auspices by parties to plurilateral agreements; and major dispute settlement developments during the year. The chapter also covers activities in other key multilateral organizations, including the Organisation for Economic Co-operation and Development (OECD) and the Asia-Pacific Economic Cooperation (APEC) forum. Finally, the chapter covers negotiations for a Trade in Services Agreement (TISA), which began in 2013. While separate from the WTO, the negotiations were initiated as a result of slow progress on services negotiations under the WTO General Agreement on Trade in Services.
World Trade Organization Ministerial Conference178 The WTO held its Ninth Ministerial Conference from December 3 to 7, 2013, in Bali, Indonesia. The ministers reviewed the operation of the multilateral trade system, acting under the leadership of the new WTO Director-General Roberto Azevêdo, whose four-year appointment began December 1, 2013. The WTO Director-General also holds the post of chairman of the Trade Negotiating Committee overseeing the multilateral trade negotiations conducted under the Doha Development Agenda (“Doha Round”). The conference ended on December 7, one day later than scheduled, following round-the-clock consultations when ministers could not reach agreement on a complete package by the scheduled conclusion.179
The primary focus of the ministerial conference was a package of issues covering trade facilitation, agriculture, and trade and economic development. The discussion of trade facilitation covered the reduction of administrative barriers to the movement of goods across borders, e.g., the simplification of customs procedures or obstacles involving port administration. The conference also addressed several agricultural issues under negotiation in the Doha Development Agenda, including export subsidies, agricultural import quotas, and food stockpiles intended to improve food security for developing-country members. In considering development, a key topic was the establishment of a monitoring mechanism to review and recommend improvements in the special treatment provisions afforded to developing-country members and, in particular, to least-developed country (LDC) members under various trade agreements. Another key development topic was the cotton negotiations involving the four
178 WTO, “Bali Ministerial Declaration––Adopted on 7 December 2013,” December 11, 2013. 179 WTO, “Ninth WTO Ministerial Conference: Days 3, 4, and 5,” December 7, 2013.
73

sub-Saharan cotton producers—Benin, Burkina Faso, Chad, and Mali (the “Cotton Four” or “C-4”).180
Other issues discussed at the conference included issues of “nonviolation” provisions addressing intellectual property rights (IPR);181 electronic commerce (“e-commerce”); small and vulnerable economies; aid for trade; and trade and the transfer of technology. Plurilateral agreement issues included the Information Technology Agreement (ITA)182 and negotiations on ITA product expansion, as well as progress on bringing the revised Agreement on Government Procurement into force.183
Agreement on Trade Facilitation At the Ninth Ministerial Conference, WTO members reached consensus on a Trade Facilitation Agreement as part of a wider “Bali Package.” The agreement creates binding commitments among WTO members to expedite the movement, release, and clearance of goods; to improve cooperation on customs matters among WTO members; and to help developing-country members implement the agreement’s obligations.184 The agreement aims to increase customs efficiency, the effective collection of revenue, and transparency in customs practices, as well as to reduce document processing and other requirements before traded goods arrive at the border.185
The United States Trade Representative (USTR) Michael Froman announced at the conference that potential cost reductions from the Trade Facilitation Agreement were estimated at 10 percent for high-income countries and almost 14.5 percent for low-income countries.186 He cited OECD estimates that worldwide income could rise by more than $40 billion for every 1 percent in cost reduction, with nearly two-thirds (65 percent) of the income increase going to developing countries. Potential gains in world GDP, according to Froman, were estimated at nearly $1 trillion.187
The agreement establishes a Preparatory Committee on Trade tasked with developing a protocol to adopt the agreement, to be reported to the WTO General Council no later than July 31, 2014. WTO members will then have one year––until July 31, 2015––to accept or not accept the agreement as a protocol annexed to the 1995 Marrakesh Agreement Establishing the World Trade Organization (the “WTO Agreement”).188 The WTO Agreement on Trade Facilitation has
180 WTO, “Ninth WTO Ministerial Conference: Day 1,” December 3, 2013. 181 WTO summarizes a “nonviolation” complaint as a situation where a government alleges that it has been deprived of an expected benefit because of another government’s action or other similar situation, even where no agreement, commitment, or obligation has been violated. 182 Formally, the Ministerial Declaration on Trade in Information Technology Products. For further detail, see the “Plurilateral Agreements” section in this chapter. 183 WTO, “Ministerial Conferences: Briefing Notes” (accessed December 9, 2013). 184 WTO, “Agreement on Trade Facilitation––Ministerial Decision of 7 December 2013,” December 11, 2013. 185 USDOS, “Ninth WTO Ministerial Conference Makes History,” December 18, 2013, par. 4. 186 USTR, “Statement of U.S. Trade Representative Michael Froman,” December 6, 2013. 187 USTR, “Saving Money, Growing Trade, Raising Incomes Worldwide,” December 7, 2013. 188 WTO, “Agreement on Trade Facilitation––Ministerial Decision of 7 December 2013,” December 11, 2013, par. 1–3.
74

13 articles in section I, which sets out members’ substantive obligations on facilitating customs and other border procedures. Section II addresses rules providing special and differential treatment for developing and least-developed country members. Annex 1 to the agreement sets out the format for notifications to be used for the import and export of goods, as well as for goods in transit (box 3.1).189
Agriculture The ministers at the conference reached agreement on a number of agricultural issues, addressing (1) agricultural service programs, (2) food security stockholding, (3) underfilled agricultural tariff-rate quotas (TRQs), and (4) export competition provisions concerning state trading enterprises.190 Ministers also addressed several issues concerning cotton and developing-country members, including LDCs.
Government service programs.191 Members added several land-use and rural development programs to the list of general services exempt from reduction commitments under Annex 2 of the WTO Agreement on Agriculture. Such government agricultural service programs are exempt from reduction commitments because they provide benefits to the agricultural sector or rural community that offset whatever minimal production or trade distortion these programs might cause. Adding to the non-exhaustive list of general services already in Annex 2, members included six more programs, addressing (1) land rehabilitation, (2) soil conservation and resource management, (3) drought management and flood control, (4) rural employment programs, (5) issuance of property titles, and (6) farmer settlement programs.
Food security stockholding.192 A major issue considered at the conference was the use of domestic government support to build public stocks for food security. The problem is that such support may breach a country’s commitments limiting trade-distorting support under the Agreement on Agriculture, in particular Article 6 (Domestic Support Commitments) and Article 7 (General Disciplines on Domestic Support). Members were able to come to an interim solution to address this concern. Under the interim plan, members agreed to refrain from WTO dispute settlement challenges when a developing-country member falls out of compliance with its commitments under the Agreement on Agriculture due to government support for such programs, when targeted on traditional staple food crops. In addition to the interim solution, members agreed to establish a work program under the WTO Committee on Agriculture to develop a permanent solution to the issue no later than the 11th WTO Ministerial Conference (i.e., no later than 2017).
189 WTO, “Agreement on Trade Facilitation––Ministerial Decision of 7 December 2013,” December 11, 2013. 190 WTO summarizes a TRQ as a quota where an import quantity within a quota is charged a lower duty rate than the quantities above the quota; typically, import duty rates for amounts above the quota are significantly higher. 191 WTO, “General Services––Ministerial Decision of 7 December 2013,” December 11, 2013; WTO, “Agreement on Agriculture: Annex 2,” April 15, 1994; WTO, “Ninth WTO Ministerial Conference: Days 3, 4 and 5,” December 7, 2013. 192 WTO, “Public Stockholding for Food Security Purposes––Ministerial Decision of 7 December 2013,” December 11, 2013; USTR, “Promoting Food Security, Facilitating Competition, Enhancing Exports,” December 7, 2013; WTO, “Ninth WTO Ministerial Conference: Days 3, 4 and 5,” December 7, 2013.
75

Box 3.1 Outline of the WTO Agreement on Trade Facilitation, 2013 Annex––Agreement on Trade Facilitation Preamble Section I Article 1: Publication and availability of information
Publication 1. Information available through Internet 2. Enquiry points 3. Notification 4.
Article 2: Opportunity to comment, information before entry into force, and consultation Opportunity to comment and information before entry into force 1. Consultations 2.
Article 3: Advance rulings
Article 4: Appeal or review procedures Right to appeal or review 1.
Article 5: Other measures to enhance impartiality, nondiscrimination and transparency Notifications for enhanced controls or inspections 1. Detention 2. Test procedures 3.
Article 6: Disciplines on fees and charges imposed on or in connection with importation and exportation General disciplines on fees and charges imposed on or in connection with importation and 1.
exportation Specific disciplines on fees and charges imposed on or in connection with importation and 2.
exportation Penalty disciplines 3.
Article 7: Release and clearance of goods Pre-arrival processing 1. Electronic payment 2. Separation of release from final determination of customs duties, taxes, fees, and charges 3. Risk management 4. Post-clearance audit 5. Establishment and publication of average release times 6. Trade facilitation measures for authorized operators 7. Expedited shipments 8. Perishable goods 9.
Article 8: Border agency cooperation
Article 9: Movement of goods under customs control intended for import
Article 10: Formalities connected with importation and exportation and transit Formalities and documentation requirements 1. Acceptance of copies 2. Use of international standards 3.
76

Single window 4. Pre-shipment inspection 5. Use of customs brokers 6. Common border procedures and uniform documentation requirements 7. Rejected goods 8. Temporary admission of goods/inward and outward processing 9.
Article 11: Freedom of transit
Article 12: Customs cooperation Measures promoting compliance and cooperation 1. Exchange of information 2. Verification 3. Request 4. Protection and confidentiality 5. Provision of information 6. Postponement or refusal of a request 7. Reciprocity 8. Administrative burden 9. Limitations 10. Unauthorized use or disclosure 11. Bilateral and regional agreements 12.
Article 13: Institutional arrangements Committee on trade facilitation 1. National committee on trade facilitation 2.
Section II Special and differential treatment provisions for developing-country members and least-developed country members
General principles 1. Categories of provisions 2. Notification and implementation of Category A 3. Notification of definitive dates for implementation of Category B and Category C 4. Early warning mechanism: Extension of implementation dates for provisions in Categories B and C 5. Implementation of Category B and Category C 6. Shifting between Categories B and C 7. Grace period for the application of the understanding on rules and procedures governing the 8.
settlement of disputes Provision of assistance for capacity building 9. Information on assistance to be submitted to the committee 10.
Final Provisions
Annex 1: Format for Notification Under Article 10.1
Source: WTO, “Agreement on Trade Facilitation––Ministerial Decision of 7 December 2013,” December 11, 2013.
77

Tariff-rate quota administration. WTO members reached an understanding193 on the administration of TRQs for agricultural products, in particular those chronically under-filled194 for no evident commercial reason. In the understanding, members set out specific import licensing procedures and obligations to provide greater transparency and opportunity for consultations between an importing member and other interested members and potential users. Members agreed to establish an “underfill” or “re-allocation” mechanism195 for underfilled quotas within the purview of the Committee on Agriculture, with a review to begin no later than four years (i.e., by 2017) from adoption of the understanding.196
Under the mechanism, the Committee on Agriculture is to track TRQs for key indicators—e.g., whether a quota fill rate has (1) remained below 65 percent for three consecutive years, (2) not increased by certain percentages in each of the previous three years, or (3) not been shown to be underfilled as a result of market circumstances. The underfill mechanism, once fully operational, will require an importing member to act on the basis of such indicators to provide unencumbered access to other interested members. The importing member may use one of two quota administration methods: (1) a first-come, first-served system applied at the border; or (2) an automatic, unconditional, within-quota license issued on demand, either choice to be maintained in place for a minimum of two years. Developing-country members are to be permitted to maintain their current TRQ administration or choose an alternative TRQ method for a similar two-year period.
Export competition.197 Participants at the Bali ministerial agreed to hold dedicated annual discussions in the Committee on Agriculture to examine developments in the field of export competition. In addition to standard notifications under the Agreement on Agriculture, these discussions are to be augmented with information from a questionnaire designed to enhance transparency in the area of agricultural export competition. Key subjects in the questionnaire cover export subsidies; export credits, guarantees, and financing programs; provision of food aid and related policies; state trading enterprises that export agricultural products; and export-competition policies eliminated by policy reforms. Members agreed to review the situation regarding export competition at the 10th WTO Ministerial Conference (i.e., no later than 2015).
193 WTO, “Understanding on Tariff Rate Quota Administration Provisions of Agricultural Products,” December 11, 2013; WTO, “Ninth WTO Ministerial Conference: Days 3, 4 and 5,” December 7, 2013. 194 USTR cited in particular the EU, Japan, Norway, and Switzerland as import markets where U.S. farmers, ranchers, workers, and food processors might benefit from an understanding that could reallocate underfilled agricultural quotas. USTR, “Promoting Food Security, Facilitating Competition, Enhancing Exports,” December 7, 2013. 195 Annex A of the understanding. 196 WTO, “Understanding on Tariff Rate Quota Administration Provisions of Agricultural Products,” December 11, 2013; WTO, “Ninth WTO Ministerial Conference: Days 3, 4 and 5,” December 7, 2013. The understanding did not, however, fully resolve the future of the mechanism, indicating that the provisions for the underfill mechanism will “no longer apply” without a recommendation from the WTO General Council at the 12th WTO Ministerial Conference (i.e., by 2019), but also that “Members shall continue to apply the provisions . . . in the absence of a decision to extend [it].” WTO, “Understanding on Tariff Rate Quota Administration Provisions of Agricultural Products,” December 11, 2013, par. 14–15. Moreover, five countries reserved the right to discontinue the underfill mechanism regardless of any decision to continue it or not––Barbados, the Dominican Republic, El Salvador, Guatemala, and the United States. 197 WTO, “Export Competition––Ministerial Decision of 7 December 2013,” December 11, 2013.
78

More broadly, the decision was also seen as impetus for members to resume WTO agriculture negotiations in all three of the major areas—i.e., market access and domestic support as well as export competition.198
Cotton.199 Participants agreed to hold dedicated discussions twice a year in the Committee on Agriculture in Special Session to examine trade-related developments affecting cotton. The framework for these discussions will center on the three “pillars” of the Agreement on Agriculture––market access, domestic support, and export competition––in relation to cotton so as to enhance the monitoring and transparency of cotton-specific developments. Ministers also agreed to improve market access for cotton products from the LDCs, as well as to improve development assistance for cotton production for these countries.200
Development Issues In addition to action taken on cotton, members reached agreement on four other subjects related to the development needs of developing members and the LDCs.
Preferential rules of origin for least-developed countries.201 Participants agreed at the conference on guidelines to simplify individual members’ rules of origin arrangements that provide preferential market access to products from the LDCs. The decision called for simplifying documentary requirements and enhancing transparency of the origin rules notified through established channels, notably the Transparency Mechanism for Preferential Trade Arrangements under the WTO Committee on Trade and Development. The decision provided that members might confer preferential access through origin rules based not only on final products, but also through rules of origin containing criteria based on the principle of substantial transformation.202
Preferential treatment for services and service suppliers from least-developed countries.203 WTO members agreed to make permanent the waiver adopted at the Eighth Ministerial Conference in 2011, which originally granted preferential treatment to the services and service suppliers of LDCs for the next 15 years (i.e., the preferential treatment was previously set to expire in 2026).
Duty-free and quota-free market access for least-developed countries.204 Developed-country WTO members reached agreement “to seek to improve” their duty-free and quota-free (DFQF)
198 WTO, “Ninth WTO Ministerial Conference: Days 3, 4 and 5,” December 7, 2013. 199 WTO, “Cotton––Ministerial Decision of 7 December 2013,” December 11, 2013. 200 WTO, “Ninth WTO Ministerial Conference: Days 3, 4 and 5,” December 7, 2013. 201 WTO, “Preferential Rules of Origin for Least-developed Countries––Ministerial Decision of 7 December 2013,” December 11, 2013. 202 The World Customs Organization (WCO) summarizes substantial transformation as “a production requirement guaranteeing that a meaningful manufacturing process has taken place in the free trade zone in order to confer originating status of a good.” WCO, “Substantial Transformation: Concept of ‘Originating Goods’” (accessed March 13, 2014). 203 WTO, “Operationalization of the Waiver Concerning Preferential Treatment to Services and Service Suppliers,” December 11, 2013. 204 WTO, “Duty-free and Quota-free (DFQF) Market Access,” December 11, 2013.
79

market access for LDCs to at least 97 percent205 for LDC products before the 10th Ministerial Conference (i.e., no later than 2015). The ministerial decision further agreed that developing-country members in a position to do so would also seek to provide or improve such access to LDCs. Members are to notify measures taken to increase market access for LDCs through the Transparency Mechanism for Preferential Trade Arrangements.
Monitoring mechanism on special and differential treatment.206 Members established a Special and Differential Treatment Monitoring Mechanism to analyze and review the implementation of special and differential treatment provisions. This monitoring mechanism is a new forum aimed at complementing other WTO channels that help developing and least-developed country members to integrate into the multilateral trading system. The forum is to meet twice a year in dedicated sessions of the WTO Committee on Trade and Development. WTO members are to review the experience of the monitoring mechanism three years after its first formal meeting, and subsequently as needed as circumstances evolve.
General Council Work Programs, Decisions, and Reviews Intellectual property rights complaints.207 Ministers at the conference directed the WTO Council for Trade-Related Aspects of Intellectual Property Rights (TRIPS Council) to continue to examine “nonviolation complaints” under WTO dispute settlement provisions. Ministers first authorized the examination of this category of complaints in December 2011 to consider the effect of any measure or situation that does not necessarily conflict with WTO obligations or commitments, but may impair a member’s IPR benefits under the TRIPS Agreement. The ministers called for the TRIPS Council to make recommendations to them at the 10th Ministerial Conference in 2015, and members agreed not to bring nonviolation cases to dispute settlement pending such recommendations.
Work program on electronic commerce.208 At the conference, ministers agreed to continue the Work Program on Electronic Commerce, in particular as it relates to commercial issues, economic development, and evolving technology. Ministers cited a number of trade-related aspects of the program to address, including (1) enhanced Internet connectivity and access to information, telecommunications technologies, and public Internet sites; (2) the growth of mobile telephony; (3) electronically delivered software; (4) cloud computing; and (5) privacy, consumer protection, and the protection of confidential data. Ministers directed that the program continue to examine the opportunities and challenges for access to electronic commerce by micro, small, and medium-sized enterprises, with special consideration for developing and least-developed country members. The ministers instructed the General Council to hold several periodic reviews of the work program––in July 2014, December 2014, and July
205 Defined at the tariff level. 206 WTO, “Monitoring Mechanism on Special and Differential Treatment,” December 11, 2013. 207 WTO, “TRIPS Non-violation and Situation Complaints,” December 11, 2013. 208 WTO, “Work Programme on Electronic Commerce,” December 11, 2013.
80

2015. WTO members agreed to continue their current practice of not imposing customs duties on electronic transmissions in the interim to the 10th Ministerial Conference in 2015.
Work program on small economies.209 Ministers continued the Work Program on Small Economies, noting in particular the work on the effects of nontariff measures on small economies that has been conducted since 2011 in dedicated sessions of the Committee on Trade and Development. The ministers instructed the committee to continue its work in order to recommend ways for the General Council to help improve the economic situation of small economies. In particular, the committee was to focus on the challenges and opportunities for small economies in linking to global value chains involved in goods and services trade.
Aid for trade.210 The conference noted the deliberations and outcomes of the Fourth Global Review of Aid for Trade, held July 8–10, 2013, and welcomed the progress made to date in the effort to help developing and least-developed country members. Ministers considered that the new Aid-for-Trade Work Program should be developed in the context of debate over the post-2015 development agenda.
Trade and transfer of technology.211 The conference directed the Working Group on Trade and Transfer of Technology to continue to examine the nexus between trade and the transfer of technology, aimed at enhancing the flow of technology to developing countries.
Accessions At the end of 2013, the WTO had 159 members (table 3.1), with two countries acceding during the year and a third country invited to accede during the Ninth Ministerial Conference. Laos became the 158th WTO member on February 2, 2013,212 and Tajikistan became the 159th on March 2, 2013.213 Yemen was invited to join the WTO in December 2013 at the Bali conference.214 At the end of 2013, there were 25 observer countries in WTO accession working parties (table 3.2).
209 WTO, “Work Programme on Small Economies,” December 11, 2013. 210 WTO, “Aid for Trade,” December 11, 2013. 211 WTO, “Trade and Transfer of Technology,” December 11, 2013. 212 WTO, “Member Information: Lao People’s Democratic Republic and the WTO” (accessed March 13, 2014). 213 WTO, “Accessions: Tajikistan” (accessed March 13, 2014). 214 Yemen became the 160th WTO member on June 26, 2014. WTO, “Yemen brings WTO membership to 160,” June 26, 2014.
81

Table 3.1 WTO membership in 2013 Albania Germany Nigeria Angola Ghana Norway Antigua and Barbuda Greece Oman Argentina Grenada Pakistan Armenia Guatemala Panama Australia Guinea Papua New Guinea Austria Guinea-Bissau Paraguay Bahrain Guyana Peru Bangladesh Haiti Philippines Barbados Honduras Poland Belgium Hong Kong, China Portugal Belize Hungary Qatar Benin Iceland Romania Bolivia India Russia Botswana Indonesia Rwanda Brazil Ireland Saint Kitts and Nevis Brunei Darussalam Israel Saint Lucia Bulgaria Italy Saint Vincent and the Grenadines Burkina Faso Jamaica Samoa Burmaa Japan Saudi Arabia Burundi Jordan Senegal Cabo Verde Kenya Sierra Leone Cambodia Korea, Republic of Singapore Cameroon Kuwait Slovakia Canada Kyrgyzstan Slovenia Central Africa Republic Laos Solomon Islands Chad Latvia South Africa Chile Lesotho Spain China Liechtenstein Sri Lanka Colombia Lithuania Suriname Congo, Democratic Republic of the Luxembourg Swaziland Congo, Republic of the Macao, China Sweden Costa Rica Macedoniab Switzerland Côte d’Ivoire Madagascar Taiwanc Croatia Malawi Tajikistan
Cuba Malaysia Tanzania Cyprus Maldives Thailand Czech Republic Mali Togo Denmark Malta Tonga Djibouti Mauritania Trinidad and Tobago Dominica Mauritius Tunisia Dominican Republic Mexico Turkey Ecuador Moldova Uganda Egypt Mongolia Ukraine El Salvador Montenegro United Arab Emirates Estonia Morocco United Kingdom European Union Mozambique United States Fiji Namibia Uruguay Finland Nepal Vanuatu France Netherlands Venezuela Gabon New Zealand Vietnam Gambia Nicaragua Zambia Georgia Niger Zimbabwe
Source: WTO, “Understanding the WTO: The Organization: Members and Observers,” n.d. (accessed March 13, 2014). aIn the WTO, Burma is known as Myanmar. bIn the WTO, Macedonia is known as the Former Yugoslav Republic of Macedonia. cIn the WTO, Taiwan is known as the Separate Customs Territory of Taiwan, Penghu, Kinmen, and Matsu, or less formally as “Chinese Taipei.”
82

Table 3.2 WTO observers in 2013 Afghanistan Equatorial Guinea Serbia Algeria Ethiopia Seychelles Andorra Iran Sudan Azerbaijan Iraq Syria Bahamas Kazakhstan Uzbekistan Belarus Lebanon Vatican (Holy See) Bhutan Liberia Yemen Bosnia and Herzegovina Libya
Comoros São Tomé and Príncipe Source: WTO, “Understanding the WTO: The Organization: Members and Observers,” n.d. (accessed March 13, 2014).
Selected Plurilateral Agreements Agreement on Government Procurement215 Parties to the revised WTO Agreement on Government Procurement, adopted in March 2012, noted progress toward bringing the revised agreement into force by March 31, 2014.216 The parties encouraged all WTO members to consider the possibility of acceding to the revised agreement, noting it expands access to government procurement markets by an estimated $80–$100 billion annually, deters corruption, and promotes good governance and effective management of public resources. The parties acknowledged the efforts of several countries––China, Montenegro, and New Zealand—that are in the process of acceding to the agreement.
Agreement on Trade in Civil Aircraft217 The Committee on Trade in Civil Aircraft held its annual meeting November 7, 2013, to discuss progress made toward a final consensus on modifications to the Product Coverage Annex to the Agreement on Trade in Civil Aircraft. The modifications are intended to bring the annex into conformity with the Harmonized System (HS)218 nomenclature, 2007 edition (HS 2007). Based on information exchanges since their 2012 meeting, delegations considered that consensus was near on a revised annex. The chairman proposed at the November 2013 meeting that the committee meet in the first half of 2014 to finalize the revisions to the annex, after which the WTO Secretariat could prepare a final copy of the revised annex for action by the committee.
215 WTO, Committee on Government Procurement, “Ministerial-level Meeting of the Committee on Government Procurement,” December 3, 2013. 216 The revised agreement entered into force on April 6, 2014, upon acceptance by two-thirds of its 15 signatories. It thus entered into force for the following 10 signatories: Canada; the EU; Hong Kong, China; Iceland; Israel; Liechtenstein; Norway; Singapore; Taiwan (Chinese Taipei); and the United States. 79 Fed. Reg. 14776 (March 17, 2014). 217 WTO, Committee on Trade in Civil Aircraft, “Minutes of the Meeting Held on 7 November 2013,” November 12, 2013; USTR, 2014 Trade Policy Agenda and 2013 Annual Report, March 3, 2014, II.112. 218 Formally, the Harmonized Commodity Description and Coding System. WCO, “International Convention on the Harmonized Commodity Description and Coding System,” June 14, 1983. The HS underwent further modifications in 2012; work on 2017 changes is ongoing.
83

Information Technology Agreement As of October 3, 2013, there were 50 participants in the Ministerial Declaration on Trade in Information Technology Products, commonly known as the Information Technology Agreement (ITA). These participants covered 78 WTO members, states, or separate customs territories, and represented approximately 96 percent of world trade in information technology products.219 New members that joined during 2013 were Tajikistan (March 2), Qatar (July 4), and Russia (September 13).220 During the year, the ITA Committee221 continued with its Work Program on Nontariff Measures to identify impediments to trade in ITA products, as well as its Electromagnetic Interference/Electromagnetic Compatibility Pilot Project. In the latter effort, participants exchange information on national procedures used to assess conformity with standards used for ITA products in order to increase transparency and trade in the sector. In 2013, the ITA Committee also continued to work on consolidating differences in the HS classification that affect ITA products. In July 2013, ITA participants adopted a decision that narrowed classification divergences for a list of 18 products largely involving semiconductor technologies into single common classifications defined under the HS 1996.222
Negotiations to expand the ITA to new categories of information technology products ran into considerable difficulties in 2013, being twice suspended during that year.223 These negotiations had begun in the previous year. A core group of ITA participants––Costa Rica, the EU, Japan, Korea, Taiwan, and the United States––reached broad agreement at the May 15, 2012, meeting of the ITA Committee to proceed with negotiations to expand ITA product coverage. These participants made the decision recognizing that new categories of information technology products had been developed since conclusion of the original 1996 ITA.224 The proposed list for product expansion initially covered 130 product codes under the HS, comprising 439 product descriptions.225 The group’s discussions led to establishment of a technical working group outside of the formal WTO ITA Committee framework.226 At the working group’s meeting on September 26–27, 2012, China participated in the ITA expansion discussions for the first time,
219 WTO, Committee of Participants on the Expansion of Trade in Information Technology Products, “Status of Implementation––Note by the Secretariat––Revision,” October 4, 2013. As of October 3, 2013, participants in the ITA were Albania; Australia; Bahrain; Canada; China; Colombia; Costa Rica; the Dominican Republic; Egypt; El Salvador; the EU; Georgia; Guatemala; Honduras; Hong Kong, China; Iceland; India; Indonesia; Israel; Japan; Jordan; Korea; Kuwait; Kyrgyzstan; Macao, China; Malaysia; Mauritius; Moldova; Montenegro; Morocco; New Zealand; Nicaragua; Norway; Oman; Panama; Peru; the Philippines; Qatar; Russia; Saudi Arabia; Singapore; Switzerland (on behalf of the customs union of Switzerland and Liechtenstein); Taiwan (Chinese Taipei); Tajikistan; Thailand; Turkey; Ukraine; the United Arab Emirates; the United States; and Vietnam. 220 WTO, Committee of Participants on the Expansion of Trade in Information Technology Products, “Report (2013) of the Committee of Participants,” October 15, 2013. 221 Formally, the Committee of Participants on the Expansion of Trade in Information Technology Products. 222 WTO, Committee of Participants on the Expansion of Trade in Information Technology Products, “Classification Divergences—Note by the Secretariat,” March 11, 2009. 223 USTR, “USTR Froman Expresses U.S. Disappointment,” July 17, 2013. 224 WTO, “9th WTO Ministerial Conference, Bali, 2013: Briefing Note” (accessed March 14, 2014); USTR, “Letter from the United States Trade Representative/Williamson,” July 31, 2012. 225 USITC, The Information Technology Agreement: Advice and Information on the Proposed Expansion; Part 1, October 2012. 226 WTO, “9th WTO Ministerial Conference, Bali, 2013: Briefing Note” (accessed March 14, 2014).
84

reportedly favoring a more narrow expansion of product coverage as a result of domestic sensitivities.227 By the November 1, 2012, meeting of the ITA Committee, parties in the technical working group discussions had increased to 17.228 The group indicated that it aimed to reissue its draft list of ITA products by mid-December 2012. The reissued list would in turn become the basis for further discussion and subsequent negotiations.229
Discussions during the first half of 2013 aimed at consolidating and reducing the list of products proposed for ITA expansion. The group’s criteria restricted proposed products to goods that were traded among members in significant quantities (covering 50 percent or more of world trade in a given product) or whose inclusion was supported by at least 8 of the 25 negotiating parties.230 In meetings in June 2013, China reported to the group that it was unable to agree to tariff cuts for over one-third of the 256 products under discussion.231 Despite subsequent clarification of China’s offers, the remaining parties in the group suspended negotiations on July 18, 2013.232
ITA expansion talks resumed October 21–24, 2013, with a central focus on China’s offer to phase out tariffs for sensitive items.233 In subsequent meetings scheduled for November 11–20, China stated that it was unable to agree to tariff elimination for approximately one-quarter of the 256 products under discussion for tariff elimination, and furthermore could only agree to duty phaseouts for an additional 80 products.234 The parties reached an impasse in discussions on November 18, 2013, and suspended negotiations for a second time on November 21, 2013.235 By the end of 2013, parties to the technical working group discussions comprised 27 ITA participants: Albania; Australia; Canada; China; Colombia; Costa Rica; the Dominican Republic; El Salvador; the EU; Guatemala; Hong Kong, China; Iceland; Israel; Japan; Korea; Malaysia; Mauritius; Montenegro; New Zealand; Norway; the Philippines; Singapore; Switzerland; Taiwan; Thailand; Turkey; and the United States.236
Dispute Settlement Body This section focuses on complaints filed before the WTO Dispute Settlement Body (DSB) and on panel and Appellate Body findings and recommendations adopted under the WTO Dispute
227 Inside U.S. Trade, “China Joins ITA Talks; Pushes Back,” October 4, 2012. 228 The 17 parties were Australia; Canada; China; Costa Rica; the EU; Hong Kong, China; Japan; Korea; Malaysia; New Zealand; Norway; the Philippines; Singapore; Switzerland; Taiwan (Chinese Taipei); Thailand; and the United States. 229 WTO, Committee of Participants on the Expansion of Trade in Information Technology Products, “Minutes of the Meeting of 1 November 2012,” March 14, 2013, par. 2.7. 230 Inside U.S. Trade, “ITA Expansion Negotiators Make Push To Finalize,” June 6, 2013. 231 Inside U.S. Trade, “China Poses New Roadblock,” June 27, 2013. 232 USTR, “USTR Froman Expresses U.S. Disappointment,” July 17, 2013; Inside U.S. Trade, “U.S., Others Suspend ITA Talks,” July 18, 2013. 233 Inside U.S. Trade, “Slow Restart To ITA Expansion Talks,” October 24, 2013. 234 Inside U.S. Trade, “ITA Expansion Talks Suspended Again,” November 21, 2013. 235 WTO, “9th WTO Ministerial Conference, Bali, 2013: Briefing Note” (accessed March 14, 2014); Inside U.S. Trade, “ITA Expansion Talks Suspended Again,” November 21, 2013. 236 WTO, “9th WTO Ministerial Conference, Bali, 2013: Briefing Note” (accessed March 14, 2014).
85

Settlement Understanding during calendar year 2013 that involve the United States.237 Box 3.2 provides an overview of the WTO dispute settlement process.
Table 3.3 lists the disputes (involving all WTO members) that moved from the consultation stage to the more formal panel litigation stage during 2013. The titles of the disputes listed in table 3.3 also serve as an indication of the types of subject matter that reached the more formal litigation stage during 2013.
The rest of this section consists of short summaries of the procedural and substantive issues in disputes involving the United States that moved to the panel stage during 2013 and summaries of panel and Appellate Body reports involving the United States that were issued or adopted during 2013. The summaries are based entirely on information in publicly available documents, including summaries published online by the WTO and press releases issued by U.S. government agencies. They should not be regarded as comprehensive or as reflecting a U.S.
Box 3.2 Overview of the WTO dispute settlement procedures
The WTO Dispute Settlement Understanding (DSU) establishes a framework for the resolution of disputes that arise between members under the WTO agreements.a Under the DSU, a member may file a complaint with the WTO DSB. After filing, the member must first seek to resolve the dispute through consultations with the named respondent party.b If the consultations fail, the complaining party may ask the DSB to establish a panel to review the matters raised by the complaint and make findings and recommendations.c Either party may appeal issues of law covered in the panel report and legal interpretations developed by the panel to the WTO’s Appellate Body.d
The findings and recommendations of the Appellate Body and of the panel (as modified by the Appellate Body) are then adopted by the DSB unless there is a consensus by the members to reject the ruling. While the guidelines suggest that panels should complete their proceedings in six months, and the Appellate Body should complete its review in 60 days, these periods are often extended.
Once the panel report or the Appellate Body report is adopted, the party concerned must notify the DSB of its intentions with respect to implementing the adopted recommendations.e If it is impracticable to comply immediately, the party concerned is given a reasonable period of time to comply, with the time to be decided either through agreement of the parties and approval by the DSB, or through arbitration. Further provisions set out rules for compensation or the suspension of concessions in the event the respondent fails to implement the recommendations.f Within a specified timeframe, parties can enter into negotiations to agree on mutually acceptable compensation. Should the parties fail to reach agreement, a party to the dispute may request the DSB’s authorization to suspend concessions or other obligations to the other party concerned. Disagreements over the proposed level of suspension may be referred to arbitration.
aWTO, “Understanding on Rules and Procedures Governing the Settlement of Disputes,” 1995. bWTO DSU, Article 4. cWTO DSU, Article 6. dWTO DSU, Article 17.6. eWTO DSU, Article 21.3. fWTO DSU, Article 22.
237 For additional information on the WTO dispute settlement process, the DSU, and individual dispute cases, see the WTO, “Dispute Settlement” at http://www.wto.org/english/tratop_e/dispu_e/dispu_e.htm.
86

Table 3.3 WTO dispute settlement panels established during 2013 Case no. Complainant Respondent Case name Panel established DS429 Vietnam United States United States—Anti-Dumping Measures on
Certain Frozen Warmwater Shrimp from Viet Nam
February 27, 2013
DS435
Honduras Australia
Australia—Certain Measures Concerning Trademarks, Geographical Indications and Other Plain Packaging Requirements Applicable to Tobacco Products and Packaging
September 25, 2013
DS438
European Union Argentina
Argentina––Measures Affecting the Importation of Goods
January 28, 2013 (with DS444 and DS445)
DS442
Indonesia European Union
European Union—Anti-Dumping Measures on Imports of Certain Fatty Alcohols from Indonesia
June 25, 2013
DS444
United States Argentina
Argentina—Measures Affecting the Importation of Goods
January 28, 2013 (with DS438 and DS445)
DS445
Japan Argentina
Argentina—Measures Affecting the Importation of Goods
January 28, 2013 (with DS438 and DS444)
DS447
Argentina United States
United States—Measures Affecting the Importation of Animals, Meat and Other Products from Argentina
January 28, 2013
DS453
Panama Argentina
Argentina—Measures Relating to Trade in Goods and Services
June 25, 2013
DS454
Japan China
China—Measures Imposing Anti-Dumping Duties on High-Performance Stainless Steel Seamless Tubes (“HP-SSST”) from Japan
May 24, 2013
DS455 United States Indonesia Indonesia—Importation of horticultural products, animals and animal products
April 24, 2013
DS457
Guatemala Peru
Peru—Additional Duty on Imports of Certain Agricultural Products
July 23, 2013
DS460
European Union China
China—Measures Imposing Anti-Dumping Duties on High-Performance Stainless Steel Seamless Tubes (“HP-SSST”) from the European Union
August 30, 2013
DS461
Panama Colombia
Colombia—Measures Relating to the Importation of Textiles, Apparel and Footwear
September 25, 2013
DS462
European Union Russia Russian Federation—Recycling Fee on Motor Vehicles
November 25, 2013
Source: Derived from WTO, “Dispute Settlement: The Disputes—Chronological List of Disputes” (accessed March 19, 2014).
87

government interpretation of the issues raised or addressed in the disputes or in panel or Appellate Body reports. A table showing procedural developments during 2013 in disputes in which the United States was the complainant or respondent appears in appendix table A.25.
This section focuses on developments through the panel and Appellate Body stage and generally does not include matters that arise after the DSB adopts panel or Appellate Body reports in the original dispute. As indicated in box 3.2, dispute litigation often continues beyond the adoption of the panel or Appellate Body report, particularly when the defending party is the “losing” party. Issues may arise about the reasonableness of the time sought by the losing party to implement findings and recommendations, the adequacy of actions taken by the losing party to comply with the findings and recommendations, and about possible compensation and retaliation. Matters may be referred to the original or a new panel for further findings and recommendations regarding compliance and other matters, and in appropriate cases the parties may seek the assistance of an arbitrator to resolve matters. There were a number of disputes still active during 2013, well after the panel or Appellate Body report had been adopted, including two high-profile disputes brought by the United States and the European Communities (EC),238 respectively, against each other’s large civilian aircraft measures.239 Other proceedings of note that were underway during 2013 after adoption of panel and Appellate Body reports involved two disputes relating to U.S. country of origin labeling requirements240 and a dispute relating to U.S. measures relating to the importation, marketing, and sale of tuna and tuna products.241
238 In this report’s WTO dispute settlement section, the term “European Communities” (EC) is used rather than “EU” if the source document WTO online summary uses “EC.” 239 Compliance proceedings begun in 2012 in both disputes remained underway throughout 2013, with panel reports expected in DS316 (brought by the United States against the EU) by the end of 2014, and in DS353 (brought by the EU against the United States) during the first half of 2014. See WTO, “Dispute Settlement: DS316; European Communities—Measures Affecting Trade in Large Civil Aircraft” (accessed April 10, 2014); WTO, “Dispute Settlement: DS353; United States—Measures Affecting Trade in Large Civil Aircraft—Second Complaint” (accessed April 10, 2014). 240 WTO, “Dispute Settlement: DS384; United States—Certain Country of Origin Labelling (COOL) Requirements” (accessed April 10, 2014); WTO, “Dispute Settlement: DS386; United States—Certain Country of Origin Labelling Requirements” (accessed April 10, 2014). The disputes involved challenges by Canada and Mexico, respectively, of mandatory U.S. country of origin labelling (COOL) requirements; the respective panels and the Appellate Body found that aspects of U.S. requirements violated U.S. obligations under the Technical Barriers to Trade Agreement (TBT) and GATT 1994. In September 2012, both Canada and Mexico sought arbitration concerning the “reasonable period of time” the United States should have to implement the recommendations and rulings of the DSB, and in December 2012 the arbitrator determined that this period should expire on May 23, 2013. In August 2013, Canada and Mexico also requested the establishment of a compliance panel and a compliance panel was composed on September 27, 2013. As of the end of 2013, the panel had not issued its report. 241 WTO, “Dispute Settlement: DS381; United States—Measures Concerning the Importation, Marketing and Sale of Tuna and Tuna Products” (accessed April 10, 2014). The dispute concerned U.S. dolphin-safe labeling provisions and whether they were consistent with U.S. obligations under the GATT 1994 and the Agreement on Technical Barriers to Trade. The Appellate Body found aspects of the U.S. provisions inconsistent with the TBT Agreement. On July 23, 2013, the United States informed the DSB of a change in its dolphin-safe labeling requirements and that it had brought its requirements into conformity with the DSB recommendations and rulings. On November 14, 2013, Mexico requested the establishment of a compliance panel; the DSB established a panel on January 22, 2014; the panel was composed on January 27, 2014. See also USTR, “U.S. Announces Compliance,” July 12, 2013.
88

New Requests for Consultations and New Panels Established During 2013, WTO members filed 20 new requests for WTO dispute settlement consultations, compared with 27 in 2012, 8 in 2011, and 17 in 2010. The United States was involved in 5 (3 as complainant and 2 as respondent) of the 20 requests filed during 2013 (as compared with 11 of the 27 requests filed during 2012). During 2013, the EU was involved in the largest number of new requests for consultations, at 7 (as the complainant in 3, and the respondent in 4). Other WTO members involved in multiple new disputes included Indonesia, 5 (as complainant in 2 and respondent in 3), and Russia, 3 (as the complainant in 1 and the respondent in 2). New disputes involving China fell sharply in 2013, with China involved in only 2 new disputes (as the complaining party in 1 and the responding party in 1). This compares with 10 new disputes in 2012, when China was the complaining party in 3 and the responding party in 7.
Twelve new dispute settlement panels were established during 2013 (table 3.3), including one panel that consolidated three complaints. The United States was the complaining party in two of these panel proceedings, and the responding party in two. The 12 new panels established in 2013 represents an increase from the 11 established in 2012, and the 7 panels established in each of 2011 and 2010.
Requests for consultations filed during 2013 in which the United States was the complaining party or named respondent Two of the three new requests for dispute settlement consultations filed by the United States during 2013 concerned measures taken by Indonesia, with both relating to Indonesia’s restrictions on importation of horticultural products, animals, and animal products.242 The third dispute concerned measures by India relating to solar cells and solar modules.243 A panel was established during 2013 in only one of the three disputes, the first of the two disputes filed against Indonesia. The issues raised in that dispute are described in greater detail in the next section.
The United States was the named respondent in two new disputes filed during 2013, one filed by Korea and one filed by China. The dispute filed by Korea concerned U.S. countervailing duty and antidumping measures on large residential washers from Korea,244 and the dispute filed by China concerned U.S. methodologies and their application to antidumping proceedings involving China.245 No panel was established in either of these disputes during 2013.246
242 WTO, “Dispute Settlement: DS455; Indonesia—Importation of Horticultural Products, Animals and Animal Products” (accessed March 21, 2014); WTO, “Dispute Settlement: DS465; Indonesia—Importation of Horticultural Products, Animals and Animal Products” (accessed March 28, 2014). 243 WTO, “Dispute Settlement: DS456; India—Certain Measures Relating to Solar Cells and Solar Modules” (accessed March 28, 2014). 244 WTO, “Dispute Settlement: DS464; United States—Anti-dumping and Countervailing Measures on Large Residential Washers from Korea” (accessed March 31, 2014). 245 WTO, “Dispute Settlement: DS471; United States—Certain Methodologies and Their Application to Anti-Dumping Proceedings Involving China” (accessed March 31, 2014).
89

Panels established during 2013 at the request of the United States As indicated in table 3.3, the DSB established two panels at the request of the United States during 2013: one concerning measures taken by Argentina, and the second concerning measures taken by Indonesia. As of the end of 2013, the panel had been composed only in the Argentina dispute, with a final panel report expected in late spring 2014. The issues raised and the procedural histories of the two disputes are summarized below.
Argentina—Measures Affecting the Importation of Goods (DS444). In this dispute, filed on August 21, 2012, the United States challenged certain measures imposed by Argentina on the importation of goods, including certain licensing requirements, certain requirements imposed on importers to undertake trade-restrictive commitments, and systematic delays in granting or denying import approval. The United States alleged that these actions violated Articles III, X, and XI of the General Agreement on Tariffs and Trade (GATT) 1994; Article 2 of the Trade-Related Investment Measures (TRIMs) Agreement; Articles 1, 3, and 5 of the Agreement on Import Licensing Procedures; and Article 11 of the Safeguards Agreement. At its meeting on January 28, 2013, the DSB established a single panel to examine this dispute and two other disputes, DS438 (a complaint filed by the EU) and DS445 (a complaint filed by Japan). The Director-General composed the panel on May 27, 2013. On November 15, 2013, the chair of the panel informed the DSB that the panel expected to issue its final report to the parties by the end of May 2014.247
Indonesia—Importation of Horticultural Products, Animals and Animal Products (DS455). In this dispute, filed on January 10, 2013, the United States claimed that certain measures imposed by Indonesia on the importation of horticultural products, animals, and animal products are inconsistent with Articles X:3(a) and XI:1 of the GATT 1994; Article 4.2 of the Agreement on Agriculture; and Articles 1.2, 3.2 and 3.3 of the Import Licensing Agreement. After consultations failed to resolve the dispute, the United States asked for the establishment of a panel. The DSB established a panel at its meeting on April 24, 2013,248 but the panel had not been composed as of the end of 2013.
Panels established during 2013 in which the United States was the named respondent The DSB established two panels during 2013 in which the United States was the named respondent, one at the request of Vietnam and the second at the request of Argentina. As of the end of 2013, both panel proceedings were still pending, with an anticipated final report
246 A panel in one of the two disputes, DS464: United States—Anti-dumping and Countervailing Measures on Large Residential Washers from Korea, was established on January 22, 2014 (see WTO, “Dispute Settlement: DS464” (accessed March 31, 2014). 247 WTO, “Dispute Settlement: DS444; Argentina—Measures Affecting the Importation of Goods” (accessed March 21, 2014). See also USTR, “United States Requests WTO Panel,” December 6, 2012. On May 5, the chair informed the DSB that the panel expected to issue its final report by the end of June 2014. 248 WTO, “Dispute Settlement: DS455; Indonesia—Importation of Horticultural Products, Animals and Animal Products” (accessed March 21, 2014). See also USTR, “U.S. Trade Representative Kirk Seeks World Trade Organization Dispute Settlement,” March 14, 2013.
90

date announced for only one of the two panels. The issues raised and the procedural histories of the two disputes are summarized below.
United States—Anti-Dumping Measures on Certain Frozen Warmwater Shrimp from Viet Nam (DS429). In this dispute, filed on February 20, 2012, Vietnam claimed that various U.S. laws, regulations, administrative proceedings, and practices relating to zeroing249 are inconsistent with U.S. obligations under Articles 1:1, VI:1, VI:2, and X:3(a) of the GATT 1994; Articles 1, 2.1, 2.4, 2.4.2, 6, 9, 11, 17.6(i), and Annex II of the Antidumping Agreement; Article XVI:4 of the WTO Agreement; Articles 3.7, 19.1, 21.1, 21.3, and 21.5 of the Dispute Settlement Understanding; and Vietnam’s Protocol of Accession. The DSB established a panel on February 27, 2013, and the panel was composed on July 12, 2013. On January 30, 2014, the chair of the panel informed the DSB that the panel expects to issue its final report to the parties by September 30, 2014.
United States—Measures Affecting the Importation of Animals, Meat and Other Animal Products from Argentina (DS447). In this dispute, filed on August 30, 2012, Argentina alleged that several actions or omissions by the United States appeared to be inconsistent with U.S. WTO obligations. This included (1) a U.S. prohibition on imports of fresh (chilled or frozen) beef from Argentina embodied in an interim and final rule of the U.S. Animal and Plant Health Inspection Service (APHIS); (2) the failure by the United States to recognize certain areas of Argentina’s territory as free of foot-and-mouth disease embodied in the APHIS Policy Regarding Importation of Animals and Animal Products; and (3) undue delays in recognizing the animal health status of a region or in granting approval to export animals or animal products from that region under U.S. regulations and additional U.S. statutory conditions. Specifically, Argentina alleged violations of provisions in Articles I:1, III:4, and XI:1 of the GATT 1994; Articles 1.1, 2.2, 2.3, 3.1, 3.3, 5.1, 5.2, 5.4, 5.6, 6.1, 6.2, 8 and Annex C.1, and Article 10.1 of the Sanitary and Phytosanitary (SPS) Agreement; and Article XVI:4 of the WTO Agreement. The DSB established a panel on January 28, 2013, and the Director-General composed the panel on August 8, 2013.250 In early March 2014, the panel chair informed the DSB that the panel expects to issue its final report in early 2015.
Panel and Appellate Body Reports Issued and/or Adopted during 2013 that Involve the United States During 2013, the DSB adopted panel and/or Appellate Body reports in original disputes251 in only one case in which the United States was the complainant or a respondent (table 3.4). The report in that dispute is summarized below.
249 Before 2006, USDOC engaged in a practice called “zeroing,” in which it treated non-dumped transactions as having a zero margin for purposes of computing a weighted average dumping margin for a class or kind of subject merchandise. USDOC has changed this practice in response to adverse rulings from the WTO. Under the revised practice, USDOC uses the non-dumped transactions as an offset to dumped transactions. 250 WTO, “Dispute Settlement: DS447; United States—Measures Affecting the Importation of Animals, Meat and Other Animal Products from Argentina” (accessed June 1, 2014). 251 As opposed to panel and Appellate Body reports issued in subsequent compliance and other proceedings.
91

Table 3.4 WTO dispute settlement panel and Appellate Body (AB) reports circulated or adopted in 2013 in which the United States was a party
Case no. Complainant Respondent Case name Date of report circulation or adoption
DS427 United States China China—Anti-Dumping and Countervailing Duty Measures on Broiler Products from the United States
Panel report adopted (September 25, 2013)
Source: Derived from WTO, “Dispute Settlement: The Disputes—Chronological List of Disputes” (accessed March 19, 2014).
Reports in which the United States was the complainant China—Anti-Dumping and Countervailing Duty Measures on Broiler Products from the United States (DS427). In this dispute, filed on September 20, 2011, the United States challenged China’s measures imposing antidumping and countervailing duties on broiler products from the United States. More specifically, the United States alleged that China’s measures appeared to be inconsistent with various provisions of the WTO Antidumping and Subsidies and Countervailing Measures (SCM) Agreements related to the process of the investigation as well as to the determinations at issue (improper reliance on facts available, failure to provide access to relevant information, insufficient explanation of the basis for the determination, absence of proper analysis of the effects of imports under investigation, absence of objective determination of causality, and imposition of countervailing duties in excess of the subsidy found to exist). The United States alleged violations of provisions in Articles 1, 2, 3, 4, 5, 6, and 12 of the Antidumping Agreement and Articles 10, 11, 12, 15, 16, 19, and 22 of the SCM Agreement. The United States also alleged that China’s measures are inconsistent with Article VI of the GATT 1994 as a result of the alleged violations of the Antidumping and SCM Agreements.
After consultations failed to resolve the dispute, the United States requested establishment of a panel. The DSB established a panel on January 20, 2012, and the Director-General composed the panel on May 24, 2012. The panel report was circulated to members on August 2, 2013.
The panel found in favor of the United States on nearly all U.S. claims regarding the conduct of China’s investigation, the insufficiency of China’s public notices, China’s allocation methodology, and the claim that China failed to explain adequately its subsidy calculation. The panel also agreed with U.S. claims that the antidumping rates applied by China were in contravention of the Antidumping Agreement. The panel also upheld U.S. claims regarding China’s price comparisons and finding of price suppression. The panel rejected the U.S. claim concerning China’s definition of the domestic industry, and found it unnecessary to rule on certain other U.S. claims concerning China’s analysis, having found China’s price analysis deficient.
The DSB adopted the panel report on September 25, 2013. On October 22, 2013, China informed the DSB that it intended to implement the DSB recommendations and rulings, and on
92

December 19, 2013, China and the United States informed the DSB that they had agreed that a reasonable time to do so would expire on July 9, 2014. 252
Reports in which the United States was the respondent No reports were issued during 2013.
Organisation for Economic Co-operation and Development The Organisation for Economic Co-operation and Development (OECD) provides a forum for member governments to review and discuss economic, social, and other policy-related developments affecting their market economies, as well as to engage with other nonmember economies to address issues of common interest involving the global economy. There were 34 OECD members at the end of 2013.253
Ministerial Council Meeting The meeting of the OECD Council at the ministerial level was held in Paris, France, on May 29–30, 2013. The chair summarized the highlights of the meeting, starting with a call by ministers to continue their focus on structural reforms and policies that improve the functioning of the labor market through the broader inclusion of different social segments in the workforce. Recent OECD efforts in this area have focused on improving education, vocational training, and work skills for several types of people, including youth; the most vulnerable in society, such as low-income families; and those facing other social barriers, such as gender inequality. Work cited in these areas included the OECD recommendations from the Giving Youth a Better Start Action Plan as well as the Recommendation of the Council on Gender Equality in Education, Employment and Entrepreneurship. 254
The chair’s summary of the ministerial meeting pointed out a need to rebuild a level of trust of citizens in government and other institutions. According to the summary, citizens need to regain confidence not only in government’s ability to restore long-term growth that addresses the social impact of the global economic crisis, but also in fairness in governmental areas such as tax systems. Ministers highlighted two examples of recent OECD work in this area, one addressing the erosion of the government tax basis as a result of changing corporate profit sharing, and a second addressing plans to revise international tax rules to prevent commercial
252 WTO, “Dispute Settlement: DS427; China—Anti-Dumping and Countervailing Duty Measures on Broiler Products from the United States” (accessed March 19, 2014). See also USTR, “World Trade Organization Adopts Report Ruling,” September 25, 2013. 253 Australia, Austria, Belgium, Canada, Chile, the Czech Republic, Denmark, Estonia, Finland, France, Germany, Greece, Hungary, Iceland, Ireland, Israel, Italy, Japan, Korea, Luxembourg, Mexico, the Netherlands, New Zealand, Norway, Poland, Portugal, Slovakia, Slovenia, Spain, Sweden, Switzerland, Turkey, the United Kingdom, and the United States. 254 OECD, “Chair’s Summary––OECD Ministerial Council Meeting (MCM), 29–30 May 2013,” n.d. (accessed March 18, 2014).
93

firms from shifting funds to locations offering more favorable tax treatment. The chair summary also mentioned the need to build confidence and trust in the private sector in areas such as corporate governance, long-term investment, finance for small and medium-sized firms, consumer policy, and efforts to combat corruption. 255
At the ministerial meeting, the OECD Secretary-General offered ministers the organization’s Interim Report on the New Approach to Economic Challenges (NAEC) initiative. Ministers welcomed the report as a means to draw lessons from the global economic crisis and promote a more comprehensive concept of growth. According to the summary, such a concept encompasses not only basic economic growth but also broader factors, such as social equality in labor markets, access to high-quality education, environmentally sustainable growth, and other elements that contribute to skilled labor in an increasingly connected and complex global economy.256 Similarly, the ministers welcomed reports about OECD work on global value chains (GVCs) and on the joint OECD-WTO Trade in Value-Added Terms (TIVA) database.257 Finally, ministers reiterated the importance of OECD dialogue with nonmember partners. As part of this dialogue, the organization has launched a new regional program for Southeast Asia to exchange perspectives and common understandings on policy matters in order to address joint challenges.258
Trade Committee The OECD Trade Committee held two sessions in 2013—its 161st session259 on May 15–16, 2013, and its 162nd session260 on November 5–6, 2013. At the committee’s plenary session on May 15, the OECD Secretariat updated the Trade Committee on three key projects that are underway: (1) the Services Trade Restrictiveness Index, (2) Multilateralizing Regionalism, and (3) Emerging Trade Policy Issues and Trade Modeling Capacity. The committee also heard progress reports from the chairs of three subsidiary groups: the Working Party of the Trade Committee, the Joint Working Party on Trade and Environment, and the Arrangement on Export Credits.261
The committee discussed progress on the NAEC initiative, as well as the TIVA database. The OECD introduced the NAEC initiative at the 2012 Ministerial Council Meeting to reassess
255 Ibid. 256 USDOS, U.S. Mission, Paris, “Evolving the OECD,” September 17, 2013, par. 3, 6. 257 USDOS, U.S. Mission, Paris, “Inclusive Growth: OECD Working it Out,” February 12, 2014, par. 2. 258 OECD, “Chair’s Summary––OECD Ministerial Council Meeting (MCM), 29–30 May 2013,” n.d. (accessed March 18, 2014). 259 OECD, Trade and Agriculture Directorate (TAD), Trade Committee, “Summary Record: 161st Session of the Trade Committee––Plenary Session,” September 5, 2013; OECD, TAD, Trade Committee, “Summary Record: 161st Session of the Trade Committee––Confidential Session,” September 5, 2013. 260 OECD, TAD, Trade Committee, “Summary Record: 162nd Session of the Trade Committee––Plenary Session,” January 31, 2014; OECD, TAD, Trade Committee, “Summary Record: 162nd Session of the Trade Committee––Confidential Session,” January 31, 2014. 261 OECD, TAD, Trade Committee, “Chair’s Highlights: Working Party of the Trade Committee,” May 10, 2013; OECD, TAD, Trade Committee, “Chair’s Highlights: the Recent Activities of the Joint Working Party on Trade and Environment,” May 10, 2013; OECD, TAD, Trade Committee, “Report to the 161st Session of the Trade Committee: Export Credits,” May 2, 2013.
94

fundamental assumptions in OECD analytical frameworks. The reassessment’s aim is to make OECD policy advice not only promote strong economic growth, but also support a broader improvement in people’s well-being, a fairer distribution of the benefits of growth, and economic production that uses natural resources more sustainably.262
The OECD-WTO TIVA database seeks to measure the value added by each country in the production of goods and services that are consumed worldwide when passing through stages of GVCs.263 Launched in January 2013, the TIVA initiative is developing a database of indicators that can be integrated with information that covers bilateral trade in goods, broken down by industry and by end use; data on trade in services; and the structural analysis (STAN) industry databases. The resulting database should better illuminate the underlying relations of trade and commercial relations between countries. TIVA indicators include (1) the breakdown of gross exports by industry into their domestic and foreign content; (2) the services content of gross exports by exporting industry, broken down by foreign/domestic origin; (3) bilateral trade balances, based on flows of value added embodied in domestic final demand; and (4) imports embodied in exports.
In addition, the committee discussed administrative items concerning preparations for the 2013 OECD Ministerial Council meeting with G20 country delegates.264 It also discussed programs such as the OECD Global Forum, held under the auspices of the Trade Committee.
At the Trade Committee’s session on May 16 with participating G20 Members, Russia––as president of the G20––presented a progress report on the G20 trade policy agenda, with the OECD Secretariat highlighting participant contributions.265 The Trade Committee and G20 participants discussed the expansion of the TIVA database and its implications for policymaking on trade, investment, competitiveness, and skills and labor market issues. The committee and G20 participants held two sub-sessions focused on different facets of trade facilitation and trade in value added through GVCs.
The first sub-session of the May meeting explored the interaction of GVCs and trade issues, in particular considering how GVCs can compound the effects of protectionism on growth and employment. It also looked at the question whether different protectionist measures—tariffs, nontariff measures, regulations, and standards—affect GVCs for agriculture, manufactures, and services in different ways. In addition, the sub-session discussed the role of trade facilitation, in particular Aid for Trade measures, in advancing the integration of developing countries into GVCs.
262 OECD, “Ministerial Meeting 2013: NAEC and Prioritising Inclusive Growth,” n.d. (accessed March 18, 2014). 263 OECD, Interconnected Economies: Benefiting from Global Value Chains, 2013. 264 The Group of Twenty major advanced and emerging economies are Argentina, Australia, Brazil, Canada, China, the EU, France, Germany, India, Indonesia, Italy, Japan, Korea, Mexico, Russia, Saudi Arabia, South Africa, Turkey, United Kingdom, and the United States, https://www.g20.org (accessed March 19, 2014). 265 OECD, TAD, Trade Committee, “Summary Record; 161st Session of the Trade Committee––Session with the Participation of G20 Members,” September 5, 2013.
95

The second sub-session examined various implications for policy formulation that arise from results of the TIVA database, such as how convergence of standards and mutual recognition measures can reinforce the positive effects of market opening. It also considered the policy implications of TIVA analyses showing how services may be embodied in goods trade. Finally, it discussed whether government policies need to be reevaluated to ensure that business and labor market environments maximize the benefits of integration into GVCs.
At the committee’s closed session in May, members explored differences in the way government policy-makers and private sector officials view trade barriers to open markets (e.g., forced localization). Members also debated whether regulatory and other “behind the border” measures are increasing, and discussed what are the most egregious trade barriers and measures.266 The committee also reviewed its relations with Argentina and Argentina’s participation in its work; requests for participant status in the committee from Egypt, Latvia, Lithuania, and Romania; the status of the committee’s strategy on export credits; and the OECD program on Southeast Asia. The Secretariat updated the committee on the reporting process following OECD accession by Chile and Israel. In addition, the committee discussed its Market Openness Review of the Russian economy with the Russian delegation, focusing in particular on IPR and compliance with regulatory reform measures in the context of Russia’s accession to the OECD.
At the Trade Committee’s 162nd meeting in November, delegations heard updates from the chairs of the Working Party of the Trade Committee and of the Joint Working Party on Agriculture and Trade, as well as of the Trade Committee itself, concerning their respective work programs.267 The committee also explored issues concerning regulatory cooperation mechanisms to help reduce international transaction costs and facilitate trade, particularly looking at developments in regional trade agreements and negotiations. In addition, the committee considered progress being made in multilateral trade negotiations and related preparations for the February 2014 OECD Global Forum on Trade, hosted annually by the OECD Trade Committee.
At its closed meeting in November, the committee followed up on its May discussions concerning Russia’s accession to the OECD.268 The committee held a Market Openness Review of Colombia, and subsequently held discussions concerning the Trade Committee’s global relations strategy. Discussions related to this strategy touched on further review of Argentina’s participation in the committee’s work; consideration of participation status for Latvia, Lithuania, and Romania; and a request from Costa Rica for a Market Openness Review of its economy. Lastly, the Trade Committee considered adjustments made to the 2013 renewal of the mandate for the Export Credit Group, extending the group’s mandate to July 31, 2015.
266 OECD, TAD, Trade Committee, “161st Session of the Trade Committee: Confidential Session––Draft Agenda,” April 9, 2013. 267 OECD, TAD, Trade Committee, “162nd Session of the Trade Committee: Plenary Session––Draft Agenda,” October 29, 2013. 268 OECD, TAD, Trade Committee, “162nd Session of the Trade Committee: Confidential Session––Draft Agenda,” October 29, 2013.
96

Asia-Pacific Economic Cooperation Asia-Pacific Economic Cooperation (APEC) is an international organization composed of 21 Pacific Basin economies seeking to enhance intraregional economic growth and cooperation.269 The organization operates as a cooperative, multilateral economic and trade group, where decisions are made by consensus and commitments are undertaken voluntarily. Since its inception, APEC has aimed to facilitate economic growth, trade, investment, and cooperation in the Asia-Pacific region.270 APEC pursues progress toward greater regional economic integration through annual meetings of heads of state and trade ministers, and coordinates capacity-building and liberalization efforts with member economies throughout the year. In 1994, member economies committed to meeting the Bogor Goals––named for the summit meeting in Bogor, Indonesia––which aimed to create a free and open trade and investment area in the Asia-Pacific region by 2010 for industrialized members’ economies and by 2020 for developing members’ economies.271
Under the chairmanship of Indonesia throughout 2013, APEC focused on increasing regional economic integration in the context of a continued economic recovery; promoting physical, institutional, and people-to-people connectivity; and achieving sustainable growth and development. In addition, the APEC annual summit, held in Bali, Indonesia, in October 2013, served as a forum for discussing possible pathways and progress toward a Free Trade Area of the Asia-Pacific (FTAAP), as well as other multilateral commitments. APEC’s working-level committees and groups worked throughout the year to improve the prospects of meeting the Bogor Goals and to develop a coordinated and equitable approach to the FTAAP.272
The Bogor Goals, FTAAP, and Related APEC Commitments In 2013, APEC ministers and leaders remained committed to fully achieving the Bogor Goals by 2020, stating that working toward the attainment of free trade and investment had produced an extraordinary period of prosperity in the region. At the October 2013 APEC leaders’ meeting, participants highlighted the importance of assisting developing countries to achieve the goals by 2020. At the same time, participants encouraged developed countries to take more concrete actions toward reaching the Bogor Goals. These actions were to be based on a 2010 assessment calling for greater trade and investment liberalization and 2011 guidelines setting forth standardized self-reporting and peer review of new trade policies and improvements in the
269 APEC was founded in 1989 when ministers from 12 Asia-Pacific governments met in Canberra, Australia, to discuss world and regional economic developments, global trade liberalization, and opportunities for regional cooperation. Current APEC membership includes Australia; Brunei Darussalam; Canada; Chile; China; Hong Kong, China; Indonesia; Japan; Korea; Malaysia; Mexico; New Zealand; Papua New Guinea; Peru; the Philippines; Russia; Singapore; Taiwan (Chinese Taipei); Thailand; the United States; and Vietnam. For further details, see APEC, APEC at a Glance, 2014, October 2013, and the APEC website, http://www.apec.org/. 270 APEC, APEC at a Glance, October 2013. 271 Ibid. 272 APEC, 21st APEC Economic Leaders’ Meeting: The Bali Declaration, October 8, 2013; APEC, 25th APEC Ministerial Meeting: Joint Statement, October 5, 2013.
97

business environment.273 As a continuation of this self-review effort in 2013, economies agreed to the public release of an updated Bogor Goals Dashboard of Indicators laying out basic indicators used to measure regional integration. Member economies also agreed to a 2014 timeline for preparing and submitting Individual Action Plans toward meeting the Bogor goals.274
In addition to working toward the general objectives of the Bogor Goals, member economies affirmed their commitment to achieving a Free Trade Area of the Asia-Pacific (FTAAP). Recognizing the different tracks that such an agreement could take, leaders and ministers affirmed that APEC would serve as an information sharing and communication platform in order to improve transparency.275 In support of the FTAAP, APEC’s Committee on Trade and Investment (CTI) continued to implement the Capacity Building Needs Initiative, a program of workshops and training courses designed to build member capacity in negotiating areas such as e-commerce, labor, government procurement, safeguards, dispute settlement, and scheduling of services and investment commitments in free trade agreements.276
The trade ministers of the 12 countries negotiating the Trans-Pacific Partnership (TPP) again used the APEC Leaders’ Meeting in October as a forum to announce progress toward reaching an agreement. Leaders from these 12 countries announced that they were on track to complete the negotiations, and reaffirmed support for a “next-generation model” agreement that would benefit all member countries despite their different levels of economic development. Within the context of APEC, leaders stated that they viewed it as a promising pathway toward the finalization of a FTAAP and were encouraged by other APEC countries that had expressed an interest in future participation in negotiations.277
In addition, APEC leaders reiterated their confidence in the underlying institutional strength of the WTO, and extended a commitment to refrain from protectionist measures until the end of 2016. Stating that Doha negotiations were “at an impasse,” leaders expressed urgency about achieving successful outcomes at the Ninth Ministerial Conference of the WTO in Bali, including outcomes related to trade facilitation, some elements of agriculture, and economic
273 APEC, 21st APEC Economic Leaders’ Meeting: The Bali Declaration, October 8, 2013; APEC, 25th APEC Ministerial Meeting: Joint Statement, October 5, 2013. In 2010, APEC members assessed the progress made by 13 member countries toward the Bogor Goals and concluded that while broad liberalization had led to increased trade and investment linkages in the region, trade barriers between the economies remained. They based this assessment on a mutually endorsed and collaboratively written report which stated that, in the 13 countries, progress eliminating tariffs had not been uniform across sectors. Barriers to services trade were still in place, human mobility and FDI were still restricted, and work remained to be done with respect to nontariff measures and “behind-the-border” issues. APEC, The Report on APEC’s 2010 Economies’ Progress, 2010. These assessments were updated by the APEC Policy Support Unit (PSU) in a report that showed some progress in these areas. APEC, PSU, APEC’s Bogor Goals Progress Report, August 2012, August 2012. For more information on the self-reporting mechanisms agreed to in 2011, see APEC, CTI, 2011 Annual Report to Ministers, November 2011, appendix 1. 274 APEC, CTI, CTI Annual Report to Ministers: 2013, October 2013, 5; APEC, 25th APEC Ministerial Meeting: Joint Statement, October 5, 2013. 275 APEC, 21st APEC Economic Leaders’ Meeting: The Bali Declaration, October 8, 2013; APEC, 25th APEC Ministerial Meeting: Joint Statement, October 5, 2013. 276 APEC, CTI, CTI Annual Report to Ministers: 2013, October 2013, 6. 277 White House, Trans-Pacific Partnership Leaders Statement, October 8, 2013.
98

development.278 In addition, leaders encouraged swift progress in the negotiations to expand product coverage and membership in the WTO Information Technology Agreement (ITA). They noted that expansion would bolster the multilateral trading system and global economic growth, as well as contributing to APEC’s mission to facilitate regional economic integration.279
Regional Economic Integration, Connectivity, and Sustainable Growth In addition to providing a forum for leaders to discuss possible pathways toward multilateral liberalization, APEC pursues an agenda of regional economic integration that relies on developing nonbinding common principles, action plans, workshops, and research on best practices. In addition, APEC pursues economic objectives of shared importance driven by the needs and interests of member countries. This work ranges from technical policy prescriptions, studies, and workshops to more open-ended forums for discussion, and is therefore designed to deal practically with known issues as well as explore new areas of economic integration. These efforts continue year-round under the oversight of the APEC Secretariat and working-level committees and are guided by the outcomes of ministerial and leadership meetings.280
Building on an initiative begun in 2011, member economies continued to work toward the goal of reducing applied tariffs on the APEC List of Environmental Goods to 5 percent or less on a most-favored-nation basis by the end of 2015. Work in 2013 focused on capacity building to help reach that goal, including the development of a survey to identify economies’ specific capacity-building needs related to reducing the tariffs. Countries also agreed to a proposal on public-private partnership designed to offer industry representatives and government officials a platform for a dialogue on issues related to trade in environmental goods and services. Other green growth initiatives include continuing a capacity-building and research project on green public procurement policies, discussions on liberalizing certain products to address both sustainable growth and rural development goals, and a workshop on public facilitation of sustainable automotive technologies.281
Besides continuing work on environmental goods and services, APEC pursued a variety of other initiatives involving sustainable growth in areas such as small and medium-sized enterprises (SMEs), women’s economic empowerment, health, oceans, food security, renewable energy, financial inclusion, and innovation. For example, APEC held the First Joint Ministerial Meeting on Small and Medium Enterprise and Women; it also strengthened disaster-related business continuity planning for SMEs through several initiatives during the year.282
The APEC Group on Services made progress on several initiatives. The group continued implementing the Action Plan on Statistics on Trade in Services, an effort developed in 2012 to
278 APEC, 21st APEC Economic Leaders’ Meeting: Supporting the Multilateral Trading System and the 9th Ministerial Conference of the World Trade Organization, October 8, 2013. 279 Ibid. 280 APEC, APEC at a Glance, October 2013. 281 APEC, CTI, CTI Annual Report to Ministers: 2013, October 2013, 7–10. 282 APEC, Outcomes and Outlook 2013–14, March 2014.
99

improve collection methods and the quality of services statistics in the region by networking regional experts and holding workshop training.283 Member countries continued to participate in expanding the Services Trade Access Requirements (STAR) Database, which is a tool businesses can use to facilitate trade in services and which is particularly useful for SMEs.284 In addition, the APEC Market Access Group continued work on technical initiatives designed to facilitate and encourage trade in remanufactured goods through workshops, capacity building, and information sharing.285
Promoting connectivity was a major focal point in APEC’s policy agenda in 2013. Toward this goal, APEC worked on improving infrastructure through investment, making supply chains more efficient, advancing regulatory cooperation, and enhancing the mobility of people. Members endorsed a multiyear plan for infrastructure development and investment. This plan would improve members’ investment environments, promote public-private partnerships, and enhance government capacity and coordination in preparing and executing infrastructure projects.286
In addition, CTI and the APEC Policy Support Unit completed an interim assessment of the Supply-Chain Connectivity Framework Action Plan. Focused on time, costs, and uncertainty of supply chain performance, this program is designed to improve supply chain connectivity in the region by 10 percent between 2010 and 2015. The interim assessment indicated that midterm progress toward achieving these goals was below pro rata benchmarks. Working to reach the 2015 objectives, CTI made progress in building inventories of policy recommendations that members could use to address eight key “chokepoints” in their supply chains.287 APEC also set a goal of having one million university students participate in intraregional exchange programs in order to encourage people-to-people connectivity in the Asia-Pacific region.288
Negotiations on a Trade in Services Agreement On January 15, 2013, the USTR notified Congress of the administration’s intent to enter into negotiations for a new trade agreement aimed at promoting international trade in services.289 The USTR cited 20 trading partners, representing nearly two-thirds of global trade in services, as the initial negotiating group of countries.290
283 APEC, CTI, CTI Annual Report to Ministers: 2013, October 2013, 11; APEC, 25th APEC Ministerial Meeting: Joint Statement, October 5, 2013. 284 APEC, CTI, CTI Annual Report to Ministers: 2013, October 2013, 30; APEC, 25th APEC Ministerial Meeting: Joint Statement, October 5, 2013. 285 APEC, CTI, CTI Annual Report to Ministers: 2013, October 2013, 10. 286 APEC, 25th APEC Ministerial Meeting: Joint Statement, October 5, 2013. 287 APEC, CTI, CTI Annual Report to Ministers: 2013, October 2013, 17. 288 APEC, Outcomes and Outlook, March 2014. 289 USTR, “Letter from the United States Trade Representative/Boehner,” January 15, 2013. 290 The USTR cited these 20 trade partners as Australia; Canada; Chile; Colombia; Costa Rica; the EU; Hong Kong, China; Iceland; Israel; Japan; Korea; Mexico; New Zealand; Norway; Pakistan; Panama; Peru; Switzerland; Taiwan
100

The first round of negotiations for a Trade in Services Agreement (TISA) was held April 27 to May 3, 2013, chaired by the United States. Initial discussions focused on rules governing the temporary entry of foreign businesspersons into a country, as well as trade in financial services, and produced a draft core negotiating text.291 Switzerland presented an initial proposal regarding a TISA dispute settlement mechanism.292 The second round was held June 24–28, 2013, and was chaired by the EU. Discussions centered on the inclusion of provisions from the WTO General Agreement on Trade in Services in the core text, with proposals circulated regarding professional services, financial services and domestic regulation, electronic commerce, and maritime transport services.
The third round was held September 16–20, 2013, chaired by Australia. Progress was made on the core text, with early offers by the United States and Japan, which opened market-access negotiations. Discussions were also held on new and enhanced disciplines (trade rules) governing global trade in services. The fourth round was held November 4–8, 2013, chaired by the United States. Negotiations focused on new and enhanced disciplines for trade in services in information and communications technology, financial services, professional services, the temporary entry of businesspersons, maritime transport services, and domestic regulation. Parties presented new proposals on air transport services, competitive delivery services, energy services, and subsidies. The EU presented its initial market-access offer. Further progress was made on the core text of the agreement:293 participants agreed to use a “negative list” approach for commitments on national treatment294 and largely finalized the text provisions on scheduling of commitments.
At yearend, the draft agreement was reported to include six sectoral annexes, focused on telecommunications and electronic commerce; financial services; professional services, including computer services; the movement of natural persons; maritime transport; and domestic regulation and transparency.295
(Chinese Taipei); and Turkey, in addition to the United States. Since January 2013, the number of trading partners participating in TISA negotiations has grown to 23. 291 Government of Australia, DFAT, “Trade in Services Agreement (TiSA)” (accessed March 10, 2014). 292 Inside U.S. Trade, “TISA Negotiators Begin Mode 4 Talks,” May 9, 2013. 293 The fifth round was held February 17 to 24, 2014, chaired by the EU. Three days of discussions were held, concentrated on starting market-access negotiations. Of an expanded group of 23 negotiating parties, 21 parties presented their initial market-access offers. Discussions also continued on the subjects of trade rules for ICT services, financial services, professional services, the temporary entry of business persons, maritime transport, and domestic regulation and transparency. The sixth round of discussions and negotiations is set for April 28 to May 2, 2014, in Geneva, Switzerland, chaired by Australia. Government of Australia, DFAT, “Trade in Services Agreement (TiSA)” (accessed March 10, 2014). Another source reports that 19 of the 23 TISA parties have tabled offers, citing the four parties yet to table offers as Chile, Pakistan, Paraguay, and Peru. Inside U.S. Trade, “Focus on TPP, TTIP and TISA,” February 18, 2014. 294 USTR, “Readout of Trade in Services Agreement (TISA) Negotiations,” November 8, 2013. A negative list approach in an international agreement is one that lists those items, entities, products, etc. to which the agreement will not apply, the commitment being to apply the agreement to everything else. Contrasts with positive list. http://www-personal.umich.edu/~alandear/glossary/n.html. 295 Inside U.S. Trade, “U.S. Tables Financial Services TISA Proposal,” February 20, 2014.
101

102

Chapter 4 U.S. Free Trade Agreements This chapter summarizes developments related to U.S. free trade agreements (FTAs) during 2013. It describes trends in U.S. merchandise trade with FTA partners, the status of U.S. FTA negotiations during the year, and major North American Free Trade Agreement (NAFTA) activities, including NAFTA dispute settlement developments.296 The online interactive merchandise trade dashboards that accompany the Year in Trade 2013 report can be used for further analysis of U.S trade under various FTAs.
U.S. Trade with FTA Partners in 2013 The United States was party to 14 FTAs as of December 31, 2013.297 FTAs in force during 2013 were the U.S.-Panama Trade Promotion Agreement (TPA) (2012); the U.S.-Colombia TPA (2012); the U.S.-Korea FTA (2012); the U.S.-Oman FTA (2009); the U.S.-Peru TPA (2009); a multiparty FTA with the countries of Central America and the Dominican Republic (CAFTA-DR) that includes the Dominican Republic, El Salvador, Guatemala, Honduras, and Nicaragua (entered into force 2006–07), and Costa Rica (2009); the U.S.-Bahrain FTA (2006); the U.S.-Morocco FTA (2006); the U.S.-Australia FTA (2005); the U.S.-Chile FTA (2004); the U.S.-Singapore FTA (2004); the U.S.-Jordan FTA (2001); NAFTA, with Canada and Mexico (1994); and the U.S.-Israel FTA (1985).
Two-way merchandise trade between the United States and its 20 FTA partners amounted to $1.4 trillion or 39.1 percent of total U.S. merchandise trade in 2013. U.S. trade with FTA partners is dominated by trade with the NAFTA countries. In 2013, Canada and Mexico accounted for 73.9 percent of total U.S. trade with its FTA partners, or $1.0 trillion. Two-way trade with Canada and Mexico increased by 2.4 percent in 2013 from 2012, with exports expanding by 3.3 percent and imports by 1.7 percent (table 4.1). Leading U.S. exports to the NAFTA countries included petroleum products, aircraft, and motor vehicles, while leading U.S. imports were crude petroleum and motor vehicles. The U.S. merchandise trade deficit with the NAFTA partners declined for the second year in a row, by 2.1 percent, to $177.2 billion in 2013.
Outside of NAFTA, U.S. two-way trade with FTA partners amounted to $368.7 billion in 2013, representing an increase of 8.7 percent from 2012.298 U.S. imports from these FTA partners increased 10.5 percent to $185.8 billion, while U.S. exports increased 7.0 percent to $182.9 billion. Leading U.S. exports to the non-NAFTA FTA partners included petroleum products,
296 The chapter also includes updates on Trade and Investment Framework Agreement (TIFA) activity. 297 Since the U.S.-Singapore FTA in 2004, the modifications to the Harmonized Tariff Schedule of the United States (HTS) required to implement each FTA can be found at USITC, Tariff Information Center website, http://www.usitc.gov/tariff_affairs/hts_index.htm. 298 Outside of NAFTA, there were 18 FTA partners with 13 FTAs in place during 2013, including FTAs with Australia, Bahrain, Chile, Colombia, Israel, Jordon, Korea, Morocco, Oman, Panama, Peru, and Singapore, as well as CAFTA-DR (with six FTA partners).
103

Table 4.1 U.S. merchandise trade with FTA partners, by FTA partner, applicable periods, 2011-13a FTA Partner 2011 2012 2013
Million $
Domestic Exports: Israel 8,084 9,729 7,827 NAFTA 393,684 419,358 433,375
Canada 233,774 244,199 251,685 Mexico 159,910 175,159 181,690
Jordan 1,410 1,645 1,967 Chile 14,498 17,309 16,139 Singapore 28,224 27,013 26,690 Australia 25,491 28,907 23,976 Morocco 2,842 2,237 2,278 Bahrain 1,166 1,146 968 CAFTA-DR 28,403 28,204 27,080 Oman 1,369 1,661 1,423 Peru 7,412 8,196 8,857 Koreab 0 33,122 39,008 Colombiac 0 10,038 16,482 Panamad 0 1,687 10,176
FTA partner total 512,584 590,252 616,247 World total 1,299,176 1,353,211 1,372,039 FTA partner share of world (percent) 39.5 43.6 44.9
Imports for consumption: Israel 23,022 22,122 22,661 NAFTA 579,067 600,333 610,551
Canada 316,397 323,925 332,887 Mexico 262,671 276,408 277,664
Jordan 1,060 1,155 1,196 Chile 9,170 9,385 10,387 Singapore 18,982 20,080 17,671 Australia 10,173 9,575 9,519 Morocco 991 937 999 Bahrain 518 701 635 CAFTA-DR 27,947 30,848 29,829 Oman 2,184 1,354 1,022 Peru 6,153 6,586 8,143 Koreab 0 48,926 61,979 Colombiac 0 16,411 21,364 Panamad 0 109 430
FTA partner total 679,267 768,523 796,386 World total 2,186,951 2,251,035 2,239,750 FTA partner share of world (percent) 31.1 34.1 35.6
104

FTA Partner 2011 2012 2013 Million $ Trade Balance Israel -14,938 -12,393 -14,834 NAFTA -185,384 -180,975 -177,175
Canada -82,623 -79,726 -81,202 Mexico -102,761 -101,249 -95,973
Jordan 350 490 771 Chile 5,328 7,923 5,752 Singapore 9,243 6,933 9,019 Australia 15,318 19,332 14,457 Morocco 1,851 1,300 1,279 Bahrain 648 446 333 CAFTA-DR 456 -2,644 -2,749 Oman -815 307 401 Peru 1,259 1,610 714 Koreab 0 -15,804 -22,971 Colombiac 0 -6,374 -4,882 Panamad 0 1,578 9,746
FTA partner total -166,683 -178,271 -180,139 World total -887,775 -897,824 -867,712
Source: Official trade statistics of the USDOC as maintained by the USITC. aTrade balance is calculated here as U.S. domestic exports minus U.S. imports for consumption. These balances differ from the U.S. merchandise trade balance generally reported by Census, which is defined as total exports minus general imports. See footnote 24. Appendix table A.2 reports the trade balance on this basis. bU.S-Korea FTA entered into force on March 15, 2012 (data reported for March 2012 forward). cU.S.-Colombia TPA entered into force on May 15, 2012 (data reported for May 2012 forward). dU.S.-Panama TPA entered into force on October 31, 2012 (data reported for November 2012 forward).
aircraft, and processors or controllers, while leading U.S. imports from these countries were crude petroleum, diamonds, and motor vehicles. The United States registered a merchandise trade deficit of $3.0 billion in 2013 with these partners, compared to a trade surplus of $2.7 billion in 2012, largely due to a decline in U.S. exports of machinery and equipment to Australia in 2013.299
The value of imports that entered the United States under FTA provisions increased 4.2 percent, from $393.7 billion in 2012 to $410.4 billion in 2013 (table 4.2). These imports accounted for 51.5 percent of total imports from FTA partners in 2013. Approximately 40.4 percent of total imports from CAFTA-DR partners entered under FTA provisions in 2013. Particularly high shares (more than 60 percent) of total imports from Jordan, Bahrain, Colombia, and Mexico (listed in descending order of magnitude) also entered under FTA provisions. By contrast, particularly low shares (20 percent or less) of total imports from Morocco, Israel, Singapore, and Panama entered under FTA provisions.
Imports that entered under FTA provisions accounted for 18.3 percent of total U.S. imports in 2013, an increase from 17.5 percent in 2012. The share of U.S. imports that entered under FTA provisions continued to be small in 2013 because a large share (over 60 percent) of the imports from U.S. FTA partners enters the United States free of duty under normal trade relations or column 1-general duty rates.
299 For more information about the decline in U.S. exports to Australia, see Associated Equipment Distributors, “Exports of U.S.-Made Construction Equipment,” February 27, 2014.
105

Table 4.2 U.S. imports for consumption entered under FTA provisions, by FTA partner, 2011–13 % change, FTA partner 2011 2012 2013 2012–13 Million $
Israel 2,661 2,952 2,974 0.7 NAFTA 326,551 343,832 349,102 1.5
Canada 162,734 175,241 177,681 1.4 Mexico 163,817 168,591 171,421 1.7
Jordan 870 1,012 1,075 6.2 Chile 5,706 5,668 6,145 8.4 Singapore 1,138 1,068 1,733 62.3 Australia 3,034 3,419 3,628 6.1 Morocco 201 166 188 13.4 Bahrain 326 425 418 -1.7 CAFTA-DR 11,912 12,610 12,040 -4.5 Oman 1,526 655 582 -11.0 Peru 3,079 2,658 2,869 7.9
Korea 0 11,635 16,415 41.1
Colombia 0 7,638 13,175 72.5
Panama 0 4 31 690.2 Total imports under FTA provisions 357,005 393,742 410,376 4.2
World 2,186,951 2,251,035 2,239,750 -0.5 Share of total imports from FTA partner: Share of total imports from FTA partner
Israel 11.6 13.3 13.1 NAFTA 56.4 57.3 57.2 Canada 51.4 54.1 53.4 Mexico 62.4 61.0 61.7 Jordan 82.1 87.7 89.9 Chile 62.2 60.4 59.2 Singapore 6.0 5.3 9.8 Australia 29.8 35.7 38.1 Morocco 20.3 17.7 18.8 Bahrain 62.9 60.6 65.8 CAFTA-DR 42.6 40.9 40.4 Oman 69.8 48.3 56.9 Peru 50.0 40.4 35.2 Korea (a) 23.8 26.5 Colombia (a) 46.5 61.7 Panama (a) 3.6 7.2 FTA partner total 52.6 51.2 51.5 Source: Official trade statistics of the USDOC as maintained by the USITC.
Note: The U.S.-Korea FTA entered into force on March 15, 2012; the U.S.-Colombia TPA entered into force on May 15, 2012; and the U.S.-Panama TPA entered into force on October 31, 2012. aUndefined.
106

Developments in FTA Negotiations during 2013 On April 21, 2013, the United States and other Trans-Pacific Partnership (TPP) negotiating partners welcomed Japan as a new participant in the TPP negotiations, pending the successful completion of domestic procedures by each TPP country.300 During 2013, the United States and the EU also conducted three formal rounds of the Transatlantic Trade and Investment Partnership (TTIP).301 The status of U.S. FTA negotiations during 2013 is shown in table 4.3.
Negotiations and Consultations toward the Trans-Pacific Partnership (TPP) Agreement The United States and its TPP partners—Australia, Brunei Darussalam (Brunei), Canada, Chile, Japan, Malaysia, Mexico, New Zealand, Peru, Singapore, and Vietnam—concluded four formal rounds of negotiations in 2013. The 16th round of the TPP was held in March (Singapore), the 17th round in May (Lima, Peru), the 18th round in July (Kota Kinabalu, Malaysia), and the 19th round in August (Bandar Seri Begawan, Brunei). TPP ministers also met at the margins of the Asia-Pacific Economic Cooperation (APEC) leaders’ meetings in April (Surabaya, Indonesia), in October (Bali, Indonesia), and in December (Singapore). TPP negotiators also held six intersessional meetings to exchange proposals, identify creative and pragmatic solutions to outstanding issues, and close gaps. Meeting focuses included rules of origin (October 28–November 1, Mexico City, and November 12–18, Salt Lake City), government procurement (October 30–November 2, Washington, DC), state-owned enterprises (November 4–7, Santiago, Chile), investment (November 6–8, Washington, DC), and legal and institutional issues (November 12–14, Washington, DC).
In the 16th round of TPP negotiations, delegations intensified their drive to find mutually acceptable paths forward on the remaining issues in the legal text of the agreement. Chief negotiators and 20 working groups reported making progress in bridging the gaps in a number of areas, such as customs, investment, telecommunications, services, technical barriers to
Table 4.3 Status of U.S. FTA negotiations during 2013
FTA partner(s) Negotiations Launched
Negotiations concluded
Agreement signed by parties
Date of entry into force
Trans-Pacific Partnership (Australia, Brunei, Canada, Chile, Malaysia, Mexico, New Zealand, Peru, Japan, Singapore, and Vietnam)
Dec. 14, 2009
___
___
___
Transatlantic Trade and Investment Partnership (EU) March 20, 2013 ___ ___ ___
Source: USTR, various press releases, 2006–12. http://www.ustr.gov. Note: No negotiations have taken place concerning the Free Trade Area of the Americas since 2005, and none have taken place concerning the Southern African Customs Union (Botswana, Lesotho, Namibia, South Africa, and Swaziland), Ecuador, Thailand, and the United Arab Emirates since 2006.
300 USTR, “Obama Administration Notifies Congress of Intent,” April 24, 2013. 301 The United States and the EU announced their intentions to launch negotiations on TTIP on February 13, 2013.
107

trade, sanitary and phytosanitary measures, intellectual property, regulatory coherence, legal and institutional issues, and development of supply chains. TPP partners also made progress in continuing to develop the comprehensive packages that will provide market access for eligible goods, services, investment, and government procurement. Productive exchanges were also held on rules of origin and on how best to promote development of regional supply chains to benefit companies based in TPP partner countries. Negotiators also discussed proposals to open services and investment for government procurement markets and agreed on additional intersessional work to build on market access advances made in the 15th round.302
On March 15, 2013, USTR welcomed Japan’s announcement formally expressing its interest in joining TPP negotiations.303 On April 12, 2013, the United States and Japan completed bilateral TPP consultations, and on April 24, 2013, USTR notified Congress of its intent to include Japan in the TPP negotiations, stating that Japan would join the negotiations on July 23, 2013, during the 18th round.304 The notification triggered a 90-day consultation period with Congress. USTR announced its plans to conduct bilateral, parallel negotiations with Japan to address concerns about nontariff measures and the automotive and insurance sectors.305
In April, TPP Ministers met at the margins of the APEC Ministers meeting in Surabaya, Indonesia. TPP Ministers announced that an agreement had been reached to bring Japan into the regional trade talks, pending successful conclusion of each member’s respective domestic procedures.306 USTR held TPP discussions with Vietnamese officials beginning April 24 in Hanoi, focusing on meaningful market access in Vietnam for goods and services, as well as on the importance of fully enforcing labor and environmental provisions.307
In the 17th TPP round, negotiating groups reported making significant progress in services, government procurement, sanitary and phytosanitary issues, trade remedies, labor, and dispute settlement. Work also progressed on other legal texts, including those on technical barriers to trade, e-commerce, rules of origin, investment, financial services, intellectual property, transparency, competition, and environment. Negotiators also made progress on tariff packages and rules of origin that reflected stakeholders’ input on how to promote trade and regional integration. They also discussed plans for integrating Japan into the TPP negotiations.308
In the 18th TPP round, negotiators resolved many of the technical issues in the texts of all chapters across the agreement.309 They announced plans to discuss all other outstanding issues
302 USTR, “TPP Negotiations Shift into High Gear,” March 13, 2013. 303 USTR, “Statement by Acting U.S. Trade Representative Demetrios Marantis on Japan’s Announcement,” March 15, 2013. 304 USTR, “Obama Administration Notifies Congress of Intent to Include Japan,” April 24, 2013; CRS, Japan Joins the Trans-Pacific Partnership: What Are the Implications? August 13, 2013. 305 USTR, “Acting Deputy U.S. Trade Representative Wendy Cutler to Visit Japan,” July 31, 2013. 306 USTR, “Acting U.S. Trade Representative Marantis Lauds Progress,” April 21, 2013. 307 USTR, “United States Advances Trans-Pacific Partnership Goals,” April 24, 2013. 308 USTR, “Trans-Pacific Partnership Negotiations Maintain Strong Momentum,” May 24, 2013. 309 USTR, “Statement on the 18th Round of Trans-Pacific Partners Negotiations,” July 25, 2013.
108

through intersessional work before the next round of negotiations.310 Thirteen negotiating groups met to discuss investment, nonconforming measures, competition, market access, rules of origin, technical barriers to trade, financial services, e-commerce, temporary entry, intellectual property, environment, government procurement, and legal and institutional issues. The negotiators made progress on constructing a market access package for their respective markets for industrial, agricultural, and textile and apparel products; services and investment; and government procurement. On July 23, TPP members welcomed Japan as the 12th member of the negotiations.311
On August 22, USTR announced plans to present a new proposal on tobacco at the TPP negotiations in Brunei.312 Noting that the TPP Agreement would contain a general exception for matters necessary to protect human life and health, the proposal would state that this general exception should also apply to tobacco health measures. Another provision would require that before a party to TPP challenges another party’s tobacco regulatory measures using the TPP dispute settlement mechanism, the health authorities of the concerned parties should meet to discuss the measure. Lastly, USTR indicated that the U.S. position on market access would remain unchanged; consistent with long-standing policy, the United States will continue to press for an end to tariffs on agricultural goods.313
In the 19th round, ministers noted that work on the majority of issues had reached an advanced stage and that TPP partners had explored ways to develop a mutually acceptable package. The package would include possible “landing zones” on remaining sensitive and challenging questions and on sequencing issues in the final talks.314 Negotiators advanced their technical work on texts covering market access for goods, rules of origin, financial services, investment, temporary entry, and government procurement, as well as those on intellectual property, competition, and environmental issues. Ministers offered guidance on how to drive the negotiations toward a conclusion within a 2013 time frame.315
During September 18–21, chief negotiators concluded meetings in Washington, DC, having worked toward solutions and next steps on a range of issues under negotiation in the trade agreement talks.316 In some TPP chapters (customs, telecommunications, sanitary and phytosanitary issues, technical barriers to trade, cross-border services, and labor), progress was made on many issues, and discussions were held on how best to resolve the others. Chief negotiators also discussed approaches to resolving challenges on e-commerce and legal and institutional issues, and met with negotiating groups covering market access for goods and government procurement. They discussed plans for the TPP ministers’ and leaders’ meetings at
310 Government of Australia, DFAT, “Eighteenth Round of Trans-Pacific Partnership Agreement (TPP) Negotiations” (accessed April 9, 2014). 311 USTR, “Statement on the 18th Round of the Trans-Pacific Negotiations,” July 25, 2013. 312 USTR, “New U.S. Proposal on Tobacco Regulation,” August 22, 2013. 313 Ibid. 314 USTR, “Joint Press Statement TPP Ministers Meeting,” August 23, 2013. 315 Ibid. 316 USTR, “Readout of This Week’s Trans-Pacific Partnership Discussions,” September 23, 2013.
109

the margins of APEC in Bali as well. In addition, the United States also held bilateral meetings with a number of TPP members on the issue of state-owned enterprises.317
Following a three-day meeting of trade ministers in Bali, TPP leaders met on October 3 at the margins of the APEC Leaders’ Summit to review progress in the negotiations.318 Leaders announced that they were on track to complete the TPP negotiations, reporting progress on all the legal texts and annexes on access to each partner’s goods, services, investment, financial services, government procurement, and temporary entry markets.319 Leaders agreed that negotiators should proceed to resolve all outstanding issues with the objective of completing a comprehensive and balanced regional agreement.320
On November 29, 2013, USTR issued a statement welcoming Korea’s interest in joining the TPP.321
During December 7–10, ministers and heads of delegations completed four days of ministerial meetings in Singapore, following the WTO ministerial meeting in Bali. Ministers indicated that they had made substantial progress toward completing the TPP322 and that they were able to identify potential “landing zones” for the majority of key outstanding issues in the text, as well as for market access issues. However, ministers reported that they were unable to reach an agreement on all points by the end of 2013 and that talks would extend into 2014.323
U.S. Trade with TPP Partners In 2013, the United States had a trade deficit of $261.3 billion with its partners in the TPP negotiations (table 4.4). U.S. trade with the TPP partners is dominated by Canada and Mexico, which received $433.4 billion of the $588.1 billion in U.S. exports (73.7 percent) to TPP partners and supplied $610.6 billion of the $849.4 billion in U.S. imports (71.9 percent) from TPP partners in 2013. In addition to the NAFTA partners, four other TPP partners also have FTAs with the United States: Australia, Chile, Peru, and Singapore. The United States ran a trade surplus of $29.9 billion with these four FTA TPP partners in 2013.
The addition of Japan as a TPP partner in 2013 substantially increased the value of U.S. trade with non-FTA TPP partners. With Japan, U.S. exports to non-FTA TPP partners were higher by $59.7 billion in 2013; U.S. imports, by $138.0 billion. In total, U.S. exports and imports from non-FTA TPP partners accounted for 13.4 percent of U.S. TPP exports and 22.7 percent of U.S. TPP imports in 2013.
317 Ibid. 318 USTR, “Readout of Ambassador Michael Froman’s Oct. 3 Meeting,” October 17, 2013. 319 White House, “Trans-Pacific Partnership Leaders Statement,” October 8, 2013. 320 USTR, “Trans-Pacific Partnership Leaders Statement,” October 17, 2013. 321 USTR, “Statement by U.S. Trade Representative Michael Froman on Korea’s Announcement,” November 29, 2013. 322 USTR, “Substantial Progress in Singapore,” December 10, 2013. 323 USTR, “Statement of the Ministers and Heads of Delegation,” December 10, 2013.
110

Table 4.4 U.S. merchandise trade with TPP partners,a 2011–13b
% change,
2011 2012 2013 2012-13
Million $
Total trade with TPP partners: Total exports to TPP partners 550,729 583,772 588,072 0.7 Total imports from TPP partners 797,660 839,838 849,396 1.1 Trade balance -246,931 -256,066 -261,324 Domestic exports: TPP partners with FTAs 469,309 500,783 509,038 1.6
Of which NAFTA 393,684 419,358 433,375 3.3
TPP partners without FTAs 81,420 82,989 79,034 -4.8
Of which Japan 61,409 64,599 59,689 -7.6 Share with FTAs (percent) 85.2 85.8 86.6
Imports for consumption: TPP partners with FTAs 623,544 645,960 656,271 1.6
Of which NAFTA 579,067 600,333 610,551 1.7 TPP partners without FTAs 174,115 193,878 193,125 -0.4
Of which Japan 127,901 144,538 137,954 -4.6
Share with FTAs (percent) 78.2 76.9 77.3 Trade balance: TPP partners with FTAs -154,236 -145,176 -147,233
Of which NAFTA -185,384 -180,975 -177,175 TPP partners without FTAs -92,696 -110,889 -114,091
Of which Japan -66,492 -79,939 -78,265
Source: Official trade statistics of the USDOC as maintained by the USITC. aTPP negotiating partners at yearend 2013 included Australia, Brunei, Canada, Chile, Japan, Malaysia, Mexico, New Zealand, Peru, Singapore, and Vietnam. Of these, the United States has FTAs with Australia, Canada, Chile, Mexico, Peru, and Singapore. bTrade balance is calculated here as U.S. domestic exports minus U.S. imports for consumption. These balances differ from the U.S. merchandise trade balance generally reported by Census, which is defined as total exports minus general imports. See footnote 24. Appendix table A.2 reports the trade balance on this basis.
The United States runs a deficit, which has been increasing since 2010, with the five non-FTA TPP partners, Brunei, Japan, Malaysia, New Zealand, and Vietnam. U.S. exports to the non-FTA TPP countries are dominated by aircraft, medicaments, and agricultural products, including corn (maize), pork, wheat, and soybeans. The largest categories of U.S. imports from the non-FTA TPP countries include automobiles and parts, aircraft parts, parts and accessories of printing machines, earthmoving equipment, semiconductor manufacturing equipment, and television cameras. In total, TPP in its current form covers 42.9 percent of total 2013 U.S. exports and 37.9 percent of U.S. imports. If concluded, TPP would be the world’s largest FTA in terms of total trade covered.
111

Negotiations and Consultations toward the Transatlantic Trade and Investment Partnership (TTIP) Agreement On March 20, 2013, the Obama Administration notified Congress of its intent to enter into negotiations on a comprehensive trade and investment agreement with the EU.324 This followed a February 13 joint announcement by President Obama and EU leaders indicating their intent to pursue talks toward the TTIP based on recommendations from the U.S.-EU High Level Working Group on Jobs and Growth.325 The Administration’s notification of intent triggered a 90-day consultation period for Congress to comment on the proposed negotiations.326 On March 12, the European Commission agreed to a draft mandate for the TTIP negotiations, which was transmitted to the Council of the European Union for the approval of member states. On June 14, the Council of Ministers approved the mandate for the European Commission to negotiate TTIP.327
In 2013, the United States and the EU concluded three formal rounds of TTIP negotiations. The first round was held in July (Washington, DC), the second, in November (Brussels), and the third, in December (Washington, DC). During the first round, July 8–12, 2013, discussions focused on the possible structure of the negotiations and on how possible chapters and specific issues might be addressed.328 The first round of negotiations also identified the approaches and ambitions of the negotiating parties for 20 trade areas expected to be addressed by TTIP, including market access for agricultural and industrial goods, government procurement, investment, energy and raw materials, regulatory issues, sanitary and phytosanitary measures, services, intellectual property rights, sustainable development, small and medium-sized enterprises, dispute settlement, competition, customs/trade facilitation, and state-owned enterprises.329 Negotiators identified certain areas of convergence across various components of the negotiations and, in areas of divergence, explored possible ways to bridge the gaps.330 Negotiators also met with 350 stakeholders from the private sector, academia, trade unions, and nongovernmental organizations to answer questions and obtain their input for the proposed trade pact.
The second round of TTIP negotiations was initially scheduled for October 7–11, but was postponed due to the U.S. government shutdown. This round was eventually hosted by the EU in Brussels during November 11–15.331 Negotiators made progress in identifying areas of
324 USTR, “Obama Administration Notifies Congress of Intent to Negotiate,” March 20, 2013. 325 USTR, “U.S., EU Announce Decision to Launch Negotiations,” February 13, 2013. For more information on the U.S.-EU High Level Working Group on Jobs and Growth, see the EU section in chapter 5. 326 USTR, “Obama Administration Notifies Congress of Intent to Negotiate,” March 20, 2013. 327 EU Council of Ministers, “Council Approves Launch of Trade and Investment Negotiations,” June 14, 2013. 328 USTR, “Statement by U.S. Trade Representative Froman on the First Round,” July 12, 2013; White House, “Fact Sheet: Transatlantic Trade and Investment Partnership,” June 17, 2013. 329 European Commission, “EU and US Conclude First Round of TTIP Negotiations,” July 12, 2013. 330 Ibid. 331 USTR, “Statement by U.S. Trade Representative Froman on the Conclusion of Round Two,” November 15, 2013.
112

common ground in order to start preparing for text-based discussions in future rounds.332 Areas of discussion included services, investment, energy and raw materials, and a range of regulatory issues, including regulatory coherence, technical barriers to trade, and sector approaches.333
In the third round, hosted by the United States in Washington, DC, December 16–20, a number of TTIP negotiating groups continued their work on services, market access, competition, trade facilitation, sector issues, investment, textiles, labor and environment, intellectual property rights, and technical barriers to trade.334 The round also offered stakeholders an opportunity to give negotiators feedback on negotiating objectives for the TTIP. Chief negotiators and their teams participated in a three-hour session with stakeholders that included more than 50 policy presentations covering a range of issues, including consumer and food safety, innovation, and agriculture.335
Developments in FTAs Already in Force during 2013 In 2013, U.S. officials held consultations with the United States’ FTA partners to discuss a variety of matters, including labor issues, the environment, implementation and functioning of the agreements, and dispute settlement. Highlights of these developments are presented below.
Thirteen of the 14 U.S. FTAs have provisions on labor rights. In 2013, the U.S. Department of Labor (USDOL) and other agencies acted on five labor complaints made by interested parties from Bahrain, the Dominican Republic, Guatemala, Honduras, and Mexico that had been submitted under the labor chapters of various FTAs.336 The USDOL’s Office of Trade and Labor Affairs (OTLA) evaluated submissions regarding denial of workers’ rights in Honduras (under CAFTA-DR) and Mexico (under NAFTA). The USTR and the Secretary of Labor requested consultations with the government of Bahrain (responding to a 2011 U.S.-Bahrain FTA submission) and agreed to an enforcement plan with Guatemala regarding worker rights (2008
332 European Commission, “EU and US Conclude Second Round,” November 15, 2013. 333 European Commission, “EU and US Conclude Second Round,” November 15, 2013; USTR, “Announcement of Next Round,” November 4, 2013. 334 USTR, “Update on the Third Round,” December 19, 2013; USTR, “Statement by U.S. Trade Representative Froman on the Conclusion,” December 20, 2013. 335 USTR, “Update on the Third Round,” December 19, 2013. 336 Labor provisions in FTAs have set up processes through which interested organizations that believe a trading partner is not fulfilling commitments made under the FTAs can submit complaints (“submissions”) to the USDOL. The USDOL’s Office of Trade and Labor Affairs (OTLA) receives and reviews submissions made under the labor chapters of the FTAs. Depending on the outcome of the review, OTLA may recommend further actions, including consultations with the other country. The United States requested consultations for the first time under an FTA labor chapter in 2010 with Guatemala. USDOL, OTLA, “Submissions under the Labor Provisions of Free Trade Agreements” (accessed March 12, 2014).
113

CAFTA-DR submission). Additionally, OTLA issued a report in September 2013 raising concerns about certain labor laws in the Dominican Republic (2011 CAFTA-DR submission).337
Ten FTAs contain provisions designed to protect foreign investors and their investments and to facilitate the settlement of investment disputes. According to the U.S. Department of State, among the U.S. FTAs that provide for investor-state dispute settlement, there are ongoing investor disputes under NAFTA,338 the U.S.-Chile FTA, CAFTA-DR, and the U.S.-Peru TPA.339
U.S.-Bahrain FTA: Consultation with Bahrain to Protect Worker Rights On May 7, 2013, USTR announced that it had requested consultations with the government of Bahrain under the Labor Chapter of the U.S.-Bahrain FTA.340 The request followed a December 2012 report by the USDOL that highlighted labor issues stemming from the government of Bahrain’s response to civil unrest in early 2011. The United States sought consultations to discuss actions taken by Bahrain that appeared to be inconsistent with the Labor Chapter of the FTA. According to the USDOL’s report, trade unionists and leaders were apparently targeted for firing after a general strike in March 2011, and Bahrain’s labor laws do not provide adequate protection from employment discrimination based on religious (sectarian) identity or political opinion. The USDOL report recognized that members of the government of Bahrain, in particular the Minister of Labor, had taken important steps to address labor concerns following the unrest in 2011 by seeking to reinstate the fired workers. It found, however, that problems remained with Bahrain’s labor laws as well as with the treatment of certain reinstated workers.341
CAFTA-DR Enforcement Plan Relating to Labor Rights in Guatemala On April 26, 2013, representatives from the United States and Guatemala met and signed an 18-point Enforcement Plan outlining concrete actions to strengthen labor law enforcement in Guatemala. Under the Enforcement Plan, Guatemala committed to strengthen labor inspections, expedite and streamline the process of sanctioning employers and ordering remediation of labor violations, increase labor law compliance by exporting companies, improve the monitoring and enforcement of labor court orders, publish labor law enforcement information, and set up mechanisms to ensure that workers are paid what they are owed when factories close. 342 Guatemala’s representatives committed to implement the enforcement plan
337 USDOL, OTLA, “Submissions under the Labor Provisions of Free Trade Agreements” (accessed March 12, 2014). 338 For more information on dispute settlement under NAFTA, see the section on NAFTA later in this chapter. 339 For more information, see U.S. Department of State, International Claims and Investment Disputes, http://www.state.gov/s/l/c3433.htm. 340 USTR, “United States Seeks to Protect Worker Rights,” May 7, 2013. 341 Ibid. 342 USTR, “Acting U.S. Trade Representative Marantis and Acting Labor Secretary Harris,” April 11, 2013.
114

within six months. This labor case is the first that the United States has brought to dispute settlement under an FTA.
On October 28, USTR expressed serious concerns, saying that significant work remained to be done to ensure that the Enforcement Plan is effectively implemented.343 USTR acknowledged the important steps already taken under the plan, but indicated to Guatemalan officials that the United States expects solid progress in fully implementing the commitments. According to USTR, if Guatemala fails to comply with the provisions of the Enforcement Plan, the United States retains the right to reactivate an arbitration panel established in a 2011 labor enforcement case brought against Guatemala under the CAFTA-DR.
Meeting to Discuss Environmental Issues On May 9, 2013, officials from the United States and parties to CAFTA-DR held the seventh meeting of the Environmental Affairs Council (EAC) under CAFTA-DR.344 Members of the council reaffirmed their commitment to work together to enhance the mutually supportive nature of trade and environmental protection through the CAFTA-DR Environment Chapter and Environment Cooperation Agreement. They reviewed progress on implementation of the Environment Chapter and shared important achievements, including those involving environmental cooperation and capacity building.
U.S.-Chile FTA: Environmental Affairs Council Meeting During the week of January 10, 2013, the United States and Chile convened the sixth meeting of the Environmental Affairs Council (EAC) under the U.S.-Chile FTA and the fourth meeting of the Joint Commission for Environmental Cooperation (JCEC) under the U.S.-Chile Environmental Cooperation Agreement.345 The EAC reviewed implementation of, and compliance with, the obligations listed in the Environment Chapter of the FTA. Chile highlighted its new law that created the Ministry of Environment and other environmental institutions, such as the Environmental Evaluation Service and the Superintendency of Environment. Chile and the United States also signed the 2012–14 Work Program for Environmental Cooperation and reaffirmed their commitment to continue working together to preserve and protect the environment through the FTA Environment Chapter and Environmental Cooperation Agreement.
343 USTR, “United States Continues to Press Guatemala,” October 28, 2013. 344 USTR, “United States and Central America-Dominican Republic,” May 10, 2013. Officials from Costa Rica, the Dominican Republic, El Salvador, Guatemala, Honduras, Nicaragua, and the United States attended. 345 USTR, “United States and Chile Hold Sixth Meeting,” January 10, 2013.
115

U.S.-Colombia TPA: Labor Issues Discussion with Colombia U.S. and Colombian officials convened the inaugural meeting of the Labor Affairs Council in Washington, DC on June 4–5, 2013, under the U.S.-Colombia TPA.346 The council reaffirmed the parties’ commitments under the Labor Chapter, including the commitment to adopt and maintain in law and practice the rights as stated in the International Labor Organization (ILO) Declaration on Fundamental Principles of Rights to Work. The council held in-depth discussions on several topics, including (1) the vision of the new Colombian Ministry of Labor and activities to strengthen institutional capacity and labor law enforcement and compliance, (2) multilateral cooperation and technical assistance and capacity building, and (3) the implementation of the Labor Chapter of the U.S-Colombia TPA. The council discussed the labor obligations of the agreement as well as progress under the Colombian Action Plan Related to Labor Rights. It also discussed areas of technical cooperation and capacity building, including on the topics of enhanced social dialogue, promotion of high-quality jobs, and improving labor inspections.
U.S.-Jordan FTA: U.S.-Jordan Agreement to Boost Investment and ICT Services, and Enhance Labor Cooperation On January 28, 2013, the United States and Jordan agreed on the Joint Principles for International Investment as well as the Joint Principles for Information and Communication Technology (ICT) Services.347 The two countries also agreed to a new initiative on promoting labor rights and improving working conditions in Jordan. In recognition of the economic benefits that international investment can offer, the United States and Jordan committed to adopt and maintain an open and nondiscriminatory investment regime, strong protection for foreign investment, transparency and public participation in the development of laws and regulations, and a level competitive playing field for international investment. Under the Joint Principles for ICT Services, the United States and Jordan agreed to support the global development of ICT services, such as the Internet and other network-based applications. The ICT principles address issues such as the free flow of information across borders, facilitating the cross-border supply of services, and foreign investment in ICT sectors.348
346 USTR, “United States and Colombia Hold Inaugural Meeting,” June 5, 2013. 347 USTR, “U.S. Trade Representative Ron Kirk Announces Agreements,” January 28, 2013. 348 Ibid.
116

U.S.-Korea Free Trade Agreement (KORUS FTA): Environment and Labor Councils and Joint Committee Meetings On February 14, 2013, the United States and Korea convened the first meeting of the Environmental Affairs Council (EAC) under the KORUS FTA.349 At the meeting, officials reviewed implementation of the Environmental Chapter of the KORUS FTA. Korean officials highlighted developments in a wide range of areas, including initiatives to protect air and water resources, and public health.
The United States and Korea convened the first meeting of the Labor Affairs Council under the KORUS FTA on March 19, 2013. At this meeting, officials reviewed the implementation of the Labor Chapter and the labor obligations of the FTA.350 The two parties confirmed that implementation of the Labor Chapter during the first year, including the establishment of the council and contact points for labor issues, has been positive and constructive. The council also held in-depth discussions on areas for future cooperation on specific priority areas, including the collection and analysis of employment and labor statistics, and collaboration on supporting corporate compliance with international labor standards in global supply chains.
On October 5, the United States and Korea convened the second meeting of the KORUS FTA Joint Committee, which was held on the margins of the APEC ministerial, to review implementation of the FTA to date. The ministers noted that the overall implementation of the KORUS FTA had gone smoothly to date.351 The United States raised a number of issues requiring further attention, in particular financial services, autos, and customs-related matters.
U.S.-Morocco FTA: New Trade Facilitation Agreement On November 21, 2013, the United States and Morocco signed the U.S.-Morocco Trade Facilitation Agreement. The agreement, which builds on the U.S.-Morocco FTA, includes provisions for Internet publication of customs laws, regulations, and administrative and transit procedures for imports and exports of goods; simplified customs procedures; and penalties for violations of customs laws. 352 Morocco became the first country in the Middle East/North Africa region to conclude a bilateral trade facilitation agreement, as well as to endorse joint principles on investment and ICT services trade with the United States.353
349 USTR, “United States and Korea Hold First Meeting,” February 14, 2013. 350 USTR, “United States and Korea Hold First Meeting,” March 19, 2013. 351 USTR, “Readout of the Second Meeting,” October 5, 2013. 352 USTR, “United States, Morocco Sign Bilateral Trade Facilitation Agreement,” November 21, 2013. 353 Ibid.
117

U.S.-Peru TPA Progress on Environmental Matters On January 11, 2013, the United States and Peru announced agreement on a five-point action plan to support Peru’s forestry sector reforms and to further Peru’s implementation of its obligations under the U.S.-Peru TPA Annex on Forest Sector Governance.354 The two governments identified a targeted set of actions for Peru to undertake to address specific environmental challenges. These actions include strengthening physical inspection of big-leaf mahogany and Spanish cedar trees; strengthening accurate development and implementation of the annual operating plans; ensuring timely criminal and administrative proceedings to sanction anyone who violates Peru’s forestry and wildlife laws; improving systems to track and verify the chain of custody of timber exports of big-leaf mahogany and Spanish cedar; and strengthening the implementation of Peru’s National Anti-Corruption Forest and Wildlife Sector Plan.355
On April 10, 2013, the United States and Peru held the sixth meeting of the Sub-Committee on Forest Sector Governance to review progress made to implement the U.S.-Peru TPA Annex on Forest Sector Governance. Positive steps included the development of a prototype for an information system that will track and verify the chain of custody for wood harvested in Peru’s forests; the adoption of laws and administrative procedures for management, supervision, and issuance of permits for timber species exports covered by the Convention on International Trade in Endangered Species of Wild Fauna and Flora (CITES); and Peru’s efforts to develop regulations to implement its new Forestry and Wildlife Law.356 The third meeting of the Environmental Cooperation Commission also took place on the same date, and members reviewed ongoing and future environmental cooperation activities that support the implementation of the Annex on Forest Sector Governance. Members also discussed activities to support the January 2013 Joint Action Plan that focuses on deepening ongoing cooperation with respect to the management of big-leaf mahogany and Spanish cedar.357
During June 4–5, 2013, the United States-Peru Environmental Affairs Council and the Environmental Cooperation Commission convened their fourth meeting in Washington, DC.358 The meeting focused on progress to implement the environmental provisions of the U.S.-Peru TPA and environmental cooperation activities under the U.S.-Peru Environmental Cooperation Agreement. A key focus of the meeting was the discussion regarding the creation of an independent secretariat to receive and consider submissions on enforcement matters, as called for by the U.S.-Peru TPA.359
354 USTR, “The United States and Peru Reach Agreement,” January 11, 2013. 355 Ibid. 356 USTR, “USTR Participates in Forestry Sub-Committee,” April 10, 2013. 357 Ibid. 358 USTR, “Assistant U.S. Trade Representative for Environment and Natural Resources,” June 6, 2013. 359 Ibid.
118

Free Trade Commission Meeting On June 7, 2013, USTR and Peru held the third meeting of the Free Trade Commission in Washington, DC. The commission was established under the U.S.-Peru TPA to oversee the implementation and operation of the TPA and to address formally matters that arise under the agreement.360 A variety of issues were discussed, including the work of environmental, intellectual property, and other committees; implementation issues; and cooperation in other forums, including the TPP. Officials agreed to work to ensure the effective implementation of and compliance with the trade in goods and services, labor, and environment obligations under the TPA.361
North American Free Trade Agreement362 The North American Free Trade Agreement (NAFTA) between the United States, Canada, and Mexico entered into force on January 1, 1994. All of the agreement’s provisions were implemented by January 1, 2008, with the exception of the NAFTA cross-border trucking provisions.363 In 2013, total two-way (exports plus imports) U.S. merchandise trade with its NAFTA partners increased by 2.4 percent over 2012, with U.S.-Canada merchandise trade amounting to $584.6 billion and U.S.-Mexico merchandise trade totaling $459.4 billion (table 4.1). The following sections describe the major activities of NAFTA’s Free Trade Commission (FTC), Commission for Labor Cooperation (CLC), and Commission for Environmental Cooperation (CEC), as well as the dispute settlement activities under NAFTA chapters 11 and 19 during 2013.
Free Trade Commission The FTC is NAFTA’s central oversight body, established under article 2001 of the agreement. It is chaired jointly by trade representatives or their designees from the three member countries.364 The FTC is responsible for overseeing NAFTA’s “implementation and further elaboration,” as well as activities under its dispute settlement provisions.365
The FTC typically meets annually, but did not meet in 2013. At its most recent meeting in April 2012 in Washington, DC, the FTC agreed to continue the ongoing regulatory cooperation initiatives aimed at facilitating trade and reducing unnecessary administrative costs.366 These initiatives operate though the U.S.-Canada Regulatory Cooperation Council and the U.S.-Mexico
360 USTR, “Assistant U.S. Trade Representative for the Western Hemisphere,” June 7, 2013. 361 Ibid. 362 U.S. bilateral trade relations with Canada and Mexico are described in chapter 5 of this report. 363 The section on Mexico in chapter 5 discusses NAFTA’s cross-border trucking provisions. Information on the last remaining restrictions on U.S.-Mexico trade, which were removed on January 1, 2008, is given in USITC, The Year in Trade 2008, 2009, 5-16. All product categories offer duty-free entry to originating goods from Mexico, and all except over-TRQ shipments of goods from Canada are likewise eligible.
364 The representatives are the USTR, the Canadian Minister for International Trade, and the Mexican Secretary of the Economy. 365 USTR, 2014 Trade Policy Agenda and 2013 Annual Report, March 2014, 130. 366 USTR, “Joint Statement from 2012 NAFTA,” April 3, 2012.
119

High-Level Regulatory Cooperation Council.367 The FTC also agreed to enhance trade in chemicals starting with exploratory work on rules of origin, customs procedures, and classification.368
Commission for Labor Cooperation The CLC, composed of a ministerial council and an administrative secretariat, was established under the North American Agreement on Labor Cooperation (NAALC). The NAALC is a supplemental agreement to NAFTA that aims to promote effective enforcement of domestic labor laws and foster transparency in administering them. The CLC is responsible for implementing the NAALC. Each NAFTA partner has established a national administrative office (NAO) within its labor ministry to serve as the contact point with the other parties, the secretariat, other government agencies, and the public. The United States NAO is the USDOL’s Office of Trade and Labor Affairs (OTLA).369 Another NAO function is to receive and respond to public communications on labor law matters arising in another NAALC country. Each NAO establishes its own domestic procedures for reviewing and responding to public communications. The NAOs and the secretariat also carry out the cooperative activities of the CLC, including seminars, conferences, joint research projects, and technical assistance.370
In 2013, representatives of each country’s NAO met to discuss ways to strengthen coordination and communications among the NAOs. Also, the National Advisory Committee for Labor Provisions in U.S. Free Trade Agreements (NAC) provided recommendations to the U.S. NAO on how to improve the functioning of the NAALC.371 In January 2012, OTLA announced that it accepted for review a submission by the Sindicato Mexicano de Electricistas, a Mexican union, on behalf of 93 other organizations, concerning the Mexican government’s obligations under the NAALC.372 In March 2013, officials from OTLA met with the NAC and provided an update on the review of its submission. OTLA indicated that the Mexican union had requested the opportunity to provide additional information for the review, and that OTLA then extended the review period to consider this new information.373
Commission for Environmental Cooperation The CEC was established under article 8 of the North American Agreement on Environmental Cooperation (NAAEC). This supplemental agreement to NAFTA is designed to ensure that trade liberalization and efforts to protect the environment are mutually supportive. The CEC oversees
367 USTR, 2014 Trade Policy Agenda and 2013 Annual Report, March 2014, 131. For more information on regulatory cooperation, see sections on Canada and Mexico in chapter 5. 368 For additional information see USITC, The Year in Trade 2012, 2013, 4-15; USTR, “Joint Statement from 2012 NAFTA,” April 3, 2012. 369 USDOL, OTLA, “Submissions under the North American Agreement on Labor Cooperation (NAALC)” (accessed March 18, 2014). 370 CLC, “The National Administrative Offices” (accessed March 18, 2014). 371 USTR, 2014 Trade Policy Agenda and 2013 Annual Report, March 2014, 131. 372 77 Fed. Reg. 4366 (January 27, 2012). Also, USDOL, OTLA, “Submissions under the Labor Provisions of Free Trade Agreements: Mexico” (accessed March 18, 2014). 373 USTR, 2014 Trade Policy Agenda and 2013 Annual Report, March 2014, 131.
120

the mandate of the NAAEC and is composed of (1) the Council—the governing body of the CEC—made up of the environmental ministers from the United States, Canada, and Mexico;374 (2) the Joint Public Advisory Committee, made up of five private citizens from each of the NAFTA parties; and (3) the Secretariat, located in Montreal. The Secretariat provides technical, administrative, and operational support to the Council; prepares independent reports on environmental matters, along with information on the state of the environment throughout North America; and processes citizen submissions on enforcement matters.375
Articles 14 and 15 of the NAAEC provide citizens and nongovernmental organizations with a mechanism to help enforce environmental laws in the NAFTA countries. 376 Article 14 governs alleged violations submitted for review by the CEC. It sets forth guidelines regarding criteria for submissions and parties that can file complaints. Article 15 outlines the Secretariat’s obligations in considering the submissions and publishing findings in the factual record.377 At the end of 2013, nine complaint files remained active under Articles 14 and 15, one of which was submitted in 2013. In 2013, one active file involved the United States, three involved Canada, and five involved Mexico (see details in table 4.5).
At the 20th regular session of the CEC Council, held on July 11, 2013, in Los Cabos, Mexico, the Council agreed to a new operational plan for 2013–14 that focuses on collaborative actions in three strategic areas: greening transportation, tackling climate change while improving air quality, and addressing waste in trade.378 The Council also stated that it continues to support CEC efforts aimed at improving the alignment of environmental standards across North America, including the transportation sector, in accordance with legal frameworks and national circumstances.379
At the 2013 CEC Council meeting, the Council announced two new tools designed to make the Submissions on Enforcement Matters (SEM) process more accessible to the North American public: (1) a new online portal, designed to provide members of the public with a user-friendly resource for filing submissions; and (2) an online SEM “tracker” that will allow interested parties to monitor compliance with the mandatory SEM process deadlines.380 In 2012, the CEC Council adopted significant revisions of the SEM process.
374 The CEC Council consists of the U.S. Environmental Protection Agency Administrator, Canadian Environment Minister, and Mexican Secretary for Environment and Natural Resources. 375 CEC, Secretariat, “Three Countries Working Together” (accessed March 19, 2014). 376 CEC, “Submissions on Enforcement Matters” (accessed March 19, 2014). 377 CEC, “Part Three, Article 14 and Article 15” (accessed March 19, 2014). 378 In 2012, the FTC approved a work plan to strengthen cooperation between the FTC and the CEC. Trade officials from the three member countries participated in the CEC’s 2013–14 Operational Plan. USTR, 2014 Trade Policy Agenda and 2013 Annual Report, March 2014, 131. 379 CEC, “CEC Ministerial Statement: Twentieth Regular Session” (accessed March 19, 2014). 380Ibid.
121

Table 4.5 Active files as of yearend 2013 under Articles 14 and 15 of the North American Agreement on Environmental Cooperation Name Case First filed Countrya Status
Coal-fired Power Plants
SEM-04-005 Sept. 20, 2004 United States The Secretariat submitted a draft factual record to Council, for a 45-day comment period on the accuracy of the draft on October 25, 2013.
Ex Hacienda El Hospital II
SEM-06-003 July 17, 2006 Mexico The Secretariat received comments from Mexico on November 27, 2013, and from Canada on December 24, 2013.
Ex Hacienda El Hospital III
SEM-06-004 Sept. 22, 2006 Mexico The Secretariat received comments from Mexico on November 27, 2013, and from Canada on December 24, 2013.
Wetlands in Manzanillo
SEM-09-002 Feb. 4, 2009 Mexico The Council decided to defer voting on whether to instruct the Secretariat to prepare a factual record on November 15, 2013.
Alberta Tailings Ponds
SEM-10-002 Apr. 13, 2010 Canada The Secretariat determined that the submission met the criteria of Article 14(1) and requested a response from the concerned government party on December 11, 2013.
Sumidero Canyon II
SEM-11-002 Nov. 29, 2011 Mexico The Secretariat informed Council that the Secretariat considers that the submission warrants development of a factual record on November 11, 2013.
Protection of Polar Bears
SEM-11-003 Dec. 5, 2011 Canada The Secretariat informed Council that the Secretariat considers that the submission warrants development of a factual record on November 7, 2013.
BC Salmon Farms
SEM-12-001 Feb. 10, 2012 Canada The Secretariat received the requested information from the concerned government party on December 17, 2013.
Tourism Development in the Gulf of California
SEM-13-001 Apr. 11, 2013 Mexico The Secretariat determined that the submission met the criteria of Article 14(1) and requested a response from the concerned government on November 12, 2013.
Source: CEC, “Submission on Enforcement Matters: Active Submissions” (accessed March 12, 2014). aRefers to the country against which an allegation was filed.
In November 1993, the United States and Mexico agreed on arrangements to support border communities with environmental infrastructure projects to advance the goals of NAFTA and the NAAEC. The Border Environment Cooperation Commission (BECC) and the North American Development Bank (NADB) are working with communities throughout the U.S.-Mexico border region to address their environmental infrastructure needs.381 As of December 31, 2013, the NADB has contracted a cumulative total of approximately $2.3 billion in loans and grants, of which a total of $2.0 billion has already been disbursed. These funds helped finance 192 projects certified by the BECC with an estimated total cost of $5.7 billion.382
381 USTR, 2014 Trade Policy Agenda and 2013 Annual Report, March 2014, 131. 382 BECC and NADB, Quarterly Status Report, December 31, 2013; NADB, “Summary of Project Implementation Activities: Active Projects,” December 31, 2013.
122

Dispute Settlement The dispute settlement provisions of NAFTA Chapters 11 and 19 cover a variety of areas.383 The sections below describe developments during 2013 in NAFTA Chapter 11 investor-state disputes and Chapter 19 binational reviews of final determinations of antidumping and countervailing cases. Appendix table A.26 presents an overview of developments in NAFTA Chapter 19 dispute settlement cases to which the United States was a party in 2013.
Chapter 11 Dispute Settlement Developments Chapter 11 of NAFTA includes provisions designed to protect cross-border investors and ease the settlement of investment disputes. Under subpart B of Chapter 11, an individual investor who alleges that a NAFTA country has breached its investment obligations under Chapter 11 may pursue arbitration through internationally recognized channels or remedies available in the host country’s domestic courts.384 A key feature of the Chapter 11 arbitral provisions is the enforceability in domestic courts of final awards made by arbitration tribunals.385
In 2013, there were five active Chapter 11 cases filed against the United States, four of them filed by Canadian investors and one filed by Mexican investors;386 four filed by U.S. investors against Canada;387 and none filed against Mexico.388
Chapter 19 Dispute Panel Reviews Chapter 19 of NAFTA contains a mechanism that provides for a binational panel to review final determinations made by national investigating authorities in antidumping and countervailing duty cases. Such a panel serves as an alternative to judicial review by domestic courts and may be established at the request of any involved NAFTA country.389 At the end of 2013, the NAFTA Secretariat listed four binational panels active under Chapter 19 (table 4.6). Two of the four active cases challenged the Mexican agency’s determinations on products from the United States. One of the four active cases in 2013 challenged U.S. agencies’ determinations on products from Canada, and one challenged U.S. agencies’ determinations on products from Mexico.390 There were no binational panels formed in 2013 under Chapter 19.
383 NAFTA Secretariat, “Overview of the Dispute Settlement Provisions” (accessed March 19, 2014). 384 Internationally recognized arbitral mechanisms include the International Centre for the Settlement of Investment Disputes (ICSID) at the World Bank, ICSID’s Additional Facility Rules, and the rules of the United Nations Commission on International Trade Law (UNCITRAL Rules). NAFTA Secretariat, “Overview of the Dispute Settlement Provisions” (accessed March 19, 2014). 385 Ibid. 386 USDOS, “NAFTA Investor-State Arbitrations: Cases Filed against the United States” (accessed March 19, 2014). 387 USDOS, “NAFTA Investor-State Arbitrations: Cases Filed against the Government of Canada” (accessed March 19, 2014). 388 USDOS, “NAFTA Investor-State Arbitrations: Cases Filed against the United Mexican States” (accessed March 19, 2014). 389 NAFTA Secretariat, “Overview of the Dispute Settlement Provisions” (accessed March 19, 2014). Such reviews involve the parties and designated agencies, rather than individuals or firms. 390 NAFTA Secretariat, “NAFTA—Chapter 19 Active Cases” (accessed March 12, 2014).
123

Table 4.6 NAFTA Chapter 19 binational panels, active reviews as of yearend 2013
Countrya Case number National agencies’ final determinationb Case title
Mexico MEX-USA-2012-1904-01 SE Antidumping Administrative Review
Chicken Thighs and Legs
MEX-USA-2012-1904-02 SE Antidumping Administrative Review
Ethylene Glycol Monobutyl Ether
United States USA-CDA-2009-1904-01 USDOC Antidumping Administrative Review
Carbon and Alloy Steel Wire Rod
USA-MEX-2012-1904-02 USDOC Antidumping Administrative Review
Bottom Mount Combination Refrigerator-Freezers
Source: NAFTA Secretariat, “Status Report of Dispute Settlement Proceeding.” (accessed March 12, 2014). aThe United States filed the first two cases contesting Mexico’s determinations, Canada filed the next case contesting a U.S. determination, and Mexico filed the remaining case contesting a U.S. determination. bIn Canada, final dumping and subsidy determinations are made by the Canada Border Services Agency, and injury determinations are made by the Canadian International Trade Tribunal. In Mexico, all determinations are made by the Secretariat of Economy (SE). In the United States, dumping and subsidy determinations are made by the U.S. Department of Commerce (USDOC), and injury determinations are made by the USITC. NAFTA Secretariat, “Overview of the Dispute Settlement Provisions” (accessed March 12, 2014).
Trade and Investment Framework Agreements and Other Agreements The United States has entered into Trade and Investment Framework Agreements (TIFAs) with a number of countries and regional economic groups. These agreements create a forum through which the United States meets with partner governments on a regular basis (generally annually), through formal TIFA Councils, to discuss issues that affect trade and investment and to increase cooperation.391
Developments in New TIFAs during 2013 In 2013, the United States entered into TIFAs with the Caribbean Community (CARICOM),392 Burma,393 and Libya.394 In March 2013, it was announced that the United States was also considering entering into a TIFA with the Economic Community of West African States.395 Also in March 2013, the United States and Iraq announced progress on the entry into force of the bilateral TIFA that was signed in 2005, with the intention of holding the first meeting of the U.S.-Iraq TIFA Council in 2014.396 The inaugural meeting of the U.S.-CARICOM TIFA Council was held in November 2013 and the council discussed intellectual property protection, the development of e-commerce infrastructure, and the removal of barriers to trade.397
391 USTR, “Trade and Investment Framework Agreements.” 392 USTR, “Acting U.S. Trade Representative Miriam Sapiro Hails Signature,” May 29, 2013. 393 USTR, “United States and Burma Sign,” May 21, 2013. 394 USTR, “United States, Libya Sign,” December 18, 2013. 395 USTR, “The United States Explores New Opportunity,” March 29, 2013. 396 USTR, “United States of America and the Republic of Iraq Announce Progress,” March 6, 2013. 397 USTR, “United States and Caribbean Community,” November 15, 2013.
124

Developments in Existing TIFAs during 2013 In January 2013, the U.S.-Thailand TIFA Council met to discuss expanding trade in goods, services, and agriculture; protection of intellectual property rights; Thai import restrictions on pork products; and Thai regulations that might restrict access to the telecommunications sector and those that might require domestic processing of credit card transactions. 398 In February, at the seventh meeting of the U.S.-Afghanistan TIFA Council in Washington, DC, the Council discussed market access issues, Afghanistan’s work towards acceding to the WTO by the end of 2014, both countries’ efforts to improve transit of Afghan goods to export markets, agriculture, women’s entrepreneurship, and Afghanistan’s mining sector. 399 In March 2013, the U.S.-Taiwan TIFA Council met and released new joint statements on investment principles and ICT services, and also launched new TIFA working groups on investment and technical barriers to trade.400 The U.S.-Indonesia TIFA Council meeting in June 2013 included discussions on Indonesia’s restrictions to its agriculture, manufacturing, energy, and telecommunications markets and investment restrictions; trade issues including those within APEC and the WTO; and intellectual property rights. 401 The U.S. Central Asia TIFA Council held its eighth meeting in Turkmenistan in November 2013 to discuss energy trade, investment, WTO membership, customs, procurement, trade and investment between Central Asia and Afghanistan, and the promotion of women’s entrepreneurship.402
Other Agreements In November 2013, the United States and Bangladesh signed a Trade and Investment Cooperation Forum Agreement in order to improve the two countries’ bilateral trade and investment relationship, as well as to track and discuss Bangladesh’s work toward improving worker safety and worker rights.403
398 USTR, “United States and Thailand Deepen Commitments,” January 17, 2013. 399 USTR, “Readout from the Seventh Meeting,” February 28, 2013. 400 USTR, “Deputy U.S. Trade Representative Demetrios Marantis Welcomes,” March 10, 2013. 401 USTR, “United States and Indonesia Meet,” June 13, 2013. 402 USTR, “Joint Statement from the United States-Central Asia Trade and Investment,” November 14, 2013. 403 USTR, “United States, Bangladesh Sign Trade and Investment Cooperation,” November 25, 2013.
125

126

Chapter 5 U.S. Relations with Selected Major Trading Partners This chapter reviews U.S. bilateral trade relations with nine selected trading partners during 2013: the EU, Canada, China, Mexico, Japan, Korea, Brazil, Taiwan, and India (ordered by value of two-way merchandise trade). Appendix tables A.6 and A.7 show U.S. trade with its top 15 single-country trading partners in 2013.404 The online interactive merchandise trade dashboards that accompany the Year in Trade 2013 report can be used for further analysis of U.S. trade with all of its trading partners.
European Union The EU as a unit405 is the largest two-way (exports and imports) U.S. trading partner in terms of both goods and services. The value of U.S. merchandise trade with the 28 member states of the EU rose 0.5 percent in 2013 to $613.3 billion, accounting for 17.0 percent of total U.S. trade. However, U.S.-EU trade that year still had not recovered to the level recorded in 2008 ($614.9 billion), just before the global economic downturn. Although U.S. imports from the EU grew slightly in 2013, U.S. exports to the EU declined as slow growth in the EU continued. As a result, the U.S. merchandise trade deficit with the EU grew $11.3 billion or 8.1 percent, to $149.9 billion in 2013 (figure 5.1). On the other hand, the U.S. trade surplus in private services with the EU was $60.5 billion in 2013, up $4.5 billion from 2012 (figure 5.2). The EU accounted for 32.8 percent of U.S. two-way trade in services in 2013, with the United Kingdom as the largest services trader within the EU, followed by Germany and France.406
The EU continued to be the second-largest market (after Canada) for U.S. exports in 2013. U.S. merchandise exports to the EU fell 1.8 percent in 2013 to $231.7 billion. Leading U.S. exports included aircraft and parts, petroleum-related products, certain medicaments (medicines), passenger motor vehicles, blood fractions (e.g., antiserum), and coal. The most notable gains
404 In chapter 5, the country trade balance is calculated as U.S. domestic exports minus U.S. imports for consumption. These balances differ from the U.S. merchandise trade balance generally reported by Census, which is defined as total exports minus general imports. Appendix table A.1 reports the country trade balance on this basis. For more information, please see footnote 24 in chapter 1. 405 In 2013, Croatia joined the European Union as the 28th member state. The 28 members of the EU in 2013 were Austria, Belgium, Bulgaria, Croatia, Cyprus, the Czech Republic, Denmark, Estonia, Finland, France, Germany, Greece, Hungary, Ireland, Italy, Latvia, Lithuania, Luxembourg, Malta, the Netherlands, Poland, Portugal, Romania, Slovakia, Slovenia, Spain, Sweden, and the United Kingdom. 406 The services trade data by country reported in this chapter are based on trade in private services, which exclude government sales and purchases of services.
127

Figure 5.1 U.S. merchandise trade with the EU-28, 2009–13
Source: Official trade statistics of the USDOC as maintained by USITC.
Figure 5.2 U.S. private services trade with the EU, 2009-13a
Source: Official trade statistics of the USDOC as maintained by USITC.
aData for 2013 are preliminary.
-200
-100
0
100
200
300
400
500
2009 2010 2011 2012 2013
Billi
on $
Exports Imports Trade balance
0
50
100
150
200
250
2009 2010 2011 2012 2013
Bilio
n $
Exports Imports Trade balance
128

among top exports were certain heterocyclic compounds,407 which increased 66.7 percent from 2012, and shelled almonds, which rose 42.8 percent. Exports of petroleum-related products also rose significantly by value. The decline in the value of U.S. exports was led by nonmonetary gold, coal, and certain medicaments. Of the top 25 U.S. exports to the EU, 13 declined by value between 2012 and 2013.
The EU was also the second-largest source of U.S. imports, following China. U.S. merchandise imports from the EU rose 1.9 percent in 2013 to $381.6 billion. Leading U.S. imports included passenger motor vehicles, petroleum-related products, certain medicaments, and turbojets and parts. Among the top imports, the most notable increases by value were in motor vehicles, which grew by $3.3 billion, and airplanes and other aircraft, which grew by $1.8 billion. U.S.-EU merchandise trade data are shown in appendix tables A.27 through A.29.
The major focus of U.S.-EU trade relations in 2013 was the launch of negotiations to conclude a bilateral trade and investment agreement, which is described below and was discussed in greater detail in chapter 4. The two sides also addressed issues related to beef trade, including extending an EU tariff-rate quota (TRQ) on imports of U.S. high-quality beef, and amending U.S. import regulations on bovine spongiform encephalopathy (BSE) to end long-standing restrictions on U.S. imports of EU beef. There were also developments in WTO dispute settlement cases involving the United States and EU in 2013. Following a WTO dispute brought by the United States regarding EU tariff treatment of certain information technology products, in September 2013 the EU adopted a European Council regulation408 providing duty-free treatment for flat panel displays.409 The two WTO dispute settlement cases involving the long-running U.S. and EU complaints about each other’s measures affecting trade in large civil aircraft remained in the compliance panel phase in 2013 (see chapter 3 and appendix table A.25).
Transatlantic Trade and Investment Partnership On February 13, 2013, U.S. and EU leaders announced their intention to launch negotiations on a comprehensive trade and investment agreement.410 On June 17, these leaders formally launched negotiations to conclude a Transatlantic Trade and Investment Partnership (TTIP).411
TTIP negotiations are based on the findings and recommendations of the U.S.-EU High-Level Working Group on Jobs and Growth (HLWG). The HLWG was set up at the November 2011 U.S.-EU Summit to identify and assess policies and measures that could increase bilateral trade and investment to support job creation, economic growth, and international competitiveness.412
407 These heterocyclic compounds are organic chemicals containing a pyrimidine ring or a piperazine ring. They are used either as intermediates in the production of chemicals or as end products (e.g., the active ingredients in pharmaceuticals and pesticides). 408 Council Regulation 953/2013, Official Journal of the European Union, No. L 263/4. The regulation entered into effect on October 25, 2013. 409 USTR, “USTR Froman Welcomes EU Action,” October 25, 2013. 410 White House, “Statement from United States President Barack Obama,” February 13, 2013. 411 White House, “Remarks by President Obama, U.K. Prime Minister Cameron,” June 17, 2013. 412 HLWG, “Interim Report to Leaders from the Co-Chairs,” June 19, 2012.
129

The working group provided an interim report on their findings in June 2012413 and a final report on February 11, 2013.414 After engaging with key stakeholders and assessing various options, in the final report the HLWG recommended negotiating “a comprehensive agreement that addresses a broad range of bilateral trade and investment issues, including regulatory issues, and contributes to the development of global rules.” The HLWG noted that because the U.S. and EU economies are substantially open already, the new agreement will “need to break ground to create additional bilateral market openings and establish new trade rules that are globally relevant.”415
The final report identifies three broad areas for negotiations: market access, regulatory issues and nontariff barriers, and rules to address shared global trade challenges and opportunities. With respect to market access, the HLWG recommended that the agreement go “beyond what the United States and the EU have achieved in previous trade agreements.” In particular, the agreement should (1) eliminate all tariffs on bilateral trade; (2) bind services commitments to the “highest level of liberalization that each side has achieved in trade agreements to date” and “seek to achieve new market access” by addressing remaining long-standing barriers to trade in services; (3) include investment provisions that are “based on the highest levels of liberalization and highest standards of protection that both sides have negotiated to date”; and (4) improve “access to government procurement opportunities at all levels of government on the basis of national treatment.”416
In the area of regulatory issues and nontariff barriers, the HLWG recommended that the two sides find ways to address “behind-the-border” nontariff barriers and reduce the costs associated with regulatory differences. In particular, the agreement should include (1) an “SPS-plus” chapter and a “TBT-plus” chapter, which would include establishing bilateral forums to address sanitary and phytosanitary (SPS) and technical barriers to trade (TBT) issues, respectively, as they arise;417 (2) rules on regulatory coherence and transparency for goods and services, including early consultations on significant regulations, use of impact assessments, periodic review of existing regulatory measures, and application of good regulatory practices; (3) commitments to promote regulatory compatibility in mutually agreed goods and services sectors, including considering a variety of approaches, such as regulatory harmonization, equivalence, or mutual recognition, where appropriate; and (4) a framework for identifying opportunities for and guiding future regulatory cooperation, including provisions that provide an institutional basis for future progress. To help develop concrete action plans, the United States and the EU requested stakeholder comments on how to promote regulatory compatibility in September 2012. These proposals were initially reviewed at a meeting of the
413 Ibid. For more information on the interim report, see USITC, The Year in Trade 2012, 2013, 5-2 to 5-3. 414 HLWG, “Final Report,” February 11, 2013. 415 Ibid. 416 Ibid. 417 SPS-plus and TBT-plus refer to strengthening and reinforcing the rules and disciplines of the WTO’s agreements on SPS measures and TBTs, respectively.
130

High-Level Regulatory Cooperation Forum in April 2013, but more proposals are expected as negotiations on regulatory issues progress.418
Finally, the HLWG recommended developing rules that go beyond bilateral trade and contribute to strengthening the multilateral trading system by addressing IPR, the environment, and labor. According to the HLWG, the agreement should also include globally relevant rules, principles, or modes of cooperation in the following areas: customs and trade facilitation, competition policy, state-owned enterprises, localization barriers to trade,419 raw materials and energy, small and medium-sized enterprises, and transparency.
Following the launch of negotiations in June 2013, U.S. and EU officials held three rounds of negotiations in 2013. These rounds are described in chapter 4.
Beef Trade To resolve a dispute over the EU’s ban on imports of hormone-treated beef, the United States and the EU signed a memorandum of understanding (MOU) in May 2009 that increased access to the EU market for U.S. exports of “high quality” beef. Such beef must be from cattle not treated with growth-promoting hormones.420 The MOU established a TRQ of 20,000 metric tons with an in-quota tariff rate of zero percent.421 In August 2012, as part of the second phase of the MOU, the EU raised the TRQ to 45,000 metric tons for one year. In return, the United States suspended retaliatory duties it had imposed in 1999 in response to the findings of a WTO dispute settlement panel on the matter. In August 2013, both sides announced an agreement to extend phase 2 of the MOU, including the quota, for two years—until August 2, 2015.422 The MOU also provides for a third phase, which would require the EU to maintain the higher quota in exchange for a permanent cessation of U.S. retaliatory duties.423
In November 2013, the U.S. Department of Agriculture (USDA) Animal and Plant Health Inspection Service (APHIS) announced its intention to amend U.S. import regulations on BSE, which will end restrictions on U.S. imports of EU beef that have been in place since the 1990s. APHIS posted the final rule in the Federal Register on December 4, 2013, and it became effective March 4, 2014.424 The new regulations will permit imports from a particular country based on the same criteria and risk categories that the World Organization for Animal Health
418 HLWG, “Final Report,” February 11, 2013. 419 Localization barriers to trade are measures designed to protect, favor, or stimulate domestic industries, service providers, and/or intellectual property (IP) at the expense of goods, services, or IP from other countries. For more information, see USTR, Trade Topics, http://www.ustr.gov/trade-topics/localization-barriers. 420 Memorandum of Understanding between the United States of America and the European Commission Regarding the Importation of Beef From Animals Not Treated with Certain Growth-Promoting Hormones and Increased Duties Applied by the United States to Certain Products of the European Communities, May 13, 2009, http://www.ustr.gov/sites/default/files/asset_upload_file254_15654.pdf. For more information on the MOU, see USITC, The Year in Trade 2009, 2010, 5-5. 421 The EU’s high-quality beef quota is open to all countries on a most-favored-nation basis. 422 USTR, “U.S. Trade Representative Froman, Secretary of Agriculture Vilsack Announce,” August 1, 2013. 423 U.S.-EU Beef MOU, Art. II(5). 424 78 F.R. 72980–73008 (December 4, 2013).
131

(OIE)425 uses to rate a country’s BSE risk status.426 However, before EU producers can export to the United States, national meat inspection systems in EU member states must be approved by the USDA as providing protection for human health equivalent to U.S. procedures.427
Canada Canada is the United States’ largest single-country trading partner in terms of two-way trade in goods (exports plus imports), and its second-largest single-country partner for trade in services, after the United Kingdom. Total U.S. two-way merchandise trade with Canada was valued at $584.6 billion in 2013, representing about 16.2 percent of U.S. merchandise trade with the world. U.S. merchandise exports to Canada amounted to $251.7 billion in 2013, and U.S. merchandise imports from Canada amounted to $332.9 billion, resulting in a merchandise trade deficit of $81.2 billion, little changed from deficits in 2012 ($79.3 billion) and 2011 ($82.6 billion) (figure 5.3). Canada’s economic recovery from the 2008–09 global recession slowed in early 2012 and remained subdued in 2013. Canada’s exports were weaker than expected in 2013, partly due to slow economic recovery in the United States––Canada’s main export market––and partly influenced by other factors, such as low productivity growth and increased competition from emerging markets.428
Canada’s total two-way trade in private services with the United States was valued at $93.3 billion in 2013, accounting for 8.6 percent of U.S. trade in services with the world. U.S. services exports to Canada were valued at $63.8 billion, while U.S. services imports from Canada were valued at $29.5 billion, resulting in a U.S. surplus on trade in services with Canada of $34.3 billion (figure 5.4). The 2013 U.S. services surplus with Canada represented an increase of 9.2 percent from 2012, continuing the upward trend of the past five years (2009–13).
Canada was the foremost single-country export market for U.S. goods in 2013, with a value roughly 60 percent higher than the second-largest U.S. goods export market (Mexico). The leading 25 U.S. goods exports to Canada accounted for roughly 30 percent of U.S. good exports to Canada ($251.7 billion). Motor vehicles, tractors, trailers, and related parts (under HS chapter 87) were the leading products, representing half of the top 25 U.S. goods exports to Canada. U.S. exports of energy products (under HS chapter 27) came second, accounting for over a quarter of the top 25 U.S. goods exports to the Canadian market. These included products such as crude petroleum, light oils, and natural gas.
Canada was the second-largest single-country source of U.S. goods imports in 2013, after China. U.S. imports for consumption from Canada were valued at $332.9 billion, up slightly from 2012 ($323.9 billion) and 2011 ($316.4 billion). Leading U.S. merchandise imports from Canada were energy products (under HS chapter 27), which accounted for nearly one-third of U.S. imports
425 The OIE is an international body that sets standards related to animal health. 426 USDA, APHIS, “APHIS Finalizes Bovine Import Regulations,” November 1, 2013. 427 Glotz, “Beef Industry Hails Lifting of US Export Ban,” November 4, 2013; Inside U.S. Trade, “U.S. Lifts ‘Mad Cow’ Restrictions,” November 7, 2013. 428 OECD, “Canada,” Economic Outlook, November 2013, 123; IMF, “Canada––2013 Article IV Consultation,” February 2014, 4.
132

Figure 5.3 U.S. merchandise trade with Canada, 2009–13
Source: Official trade statistics of the USDOC as maintained by USITC.
Figure 5.4 U.S. private services trade with Canada, 2009–13a
Source: Official trade statistics of the USDOC as maintained by USITC. aData for 2013 are preliminary.
0
10
20
30
40
50
60
70
2009 2010 2011 2012 2013
Billi
on $
Exports Imports Trade balance
-200
-100
0
100
200
300
400
2009 2010 2011 2012 2013
Billi
on $
Exports Imports Trade balance
133

from Canada, followed by passenger vehicles and related parts (under HS chapter 87) and raw materials, such as coniferous wood, nonmonetary gold, and aluminum. (See appendix tables A.30 to A.32 for details of U.S.-Canada merchandise trade.)
The United States and Canada share the world’s largest and most comprehensive bilateral trading relationship, with Canada being the single largest foreign supplier of energy––petroleum, natural gas, and electricity––to the United States.429 Canada was the fourth largest source of foreign direct investment in the United States, totaling $261 billion in 2012 (latest data available).430 Since 1994, trade between the two countries has operated within the framework of the NAFTA agreement between the United States, Canada, and Mexico. NAFTA has reduced trade barriers and liberalized rules in a wide variety of areas––agriculture, services, energy, financial services, investment, and government procurement––as well as provided an institutional structure through which to settle a variety of disputes among the three partners.
In 2013, the United States and Canada continued to work to integrate the two economies more closely. They consulted on agricultural and industrial goods matters through forums such as the Canada-United States Consultative Committee on Agriculture and the Canada-United States Regulatory Cooperation Council to facilitate trade, targeting in particular trade distortions caused by behind-the-border measures. In September 2013, Canada and the United States agreed to a joint request for arbitration under the 2006 Softwood Lumber Agreement to resolve a dispute regarding interpretation of the award made in a 2011 case decided under the agreement (see following discussion).
Softwood Lumber On September 30, 2013, Canada and the United States agreed to submit a joint request for arbitration under the 2006 U.S.-Canada Softwood Lumber Agreement (SLA) to resolve a dispute concerning the interpretation of the compensatory amounts awarded in a case decided under the SLA in January 2011.431 On January 20, 2011, the tribunal in LCIA432 case no. 81010 made an award concerning provincial subsidies that requires Canada to apply additional export charges on shipments of softwood lumber from Quebec and Ontario to the United States in order to remedy breaches of the SLA concerning certain forestry programs in those provinces.433 The charges were designed to collect $58.85 million over the term of the original SLA, which was to expire on October 12, 2013. Canada started to apply the additional export charges on March 1, 2011, but did not collect the full $58.85 million by the expiration date of the original SLA (October 12, 2013). On January 23, 2012, the parties agreed to extend the SLA for an additional two years, setting a new expiration date of October 12, 2015. As a consequence, the parties
429 USDOS, Bureau of Western Hemisphere Affairs, “U.S. Relations with Canada,” August 23, 2013. 430 USDOS, American Embassy, Canada, “U.S.-Canada Economic Relations” (accessed March 25, 2014). 431 LCIA (London Court of International Arbitration), “Joint Request for Arbitration––Submitted on Behalf of Canada and the United States of America,” September 30, 2013. See text of the 2006 U.S.-Canada Softwood Lumber Agreement at http://www.ustr.gov/webfm_send/3254, and the Extension to the 2006 U.S.-Canada Softwood Lumber Agreement at http://www.ustr.gov/webfm_send/3255. 432 London Court of International Arbitration, the dispute settlement body recognized under the SLA. 433 USTR, 2014 Trade Policy Agenda and 2013 Annual Report, March 2014, III.137; USDOS, American Embassy, Canada, “Canada: 2014 National Trade Estimate Report,” December 12, 2013, par. 20–22.
134

agreed in 2013 to reconvene the original tribunal to determine whether or not the award requires Canada to continue to apply the additional export charges while the extended SLA remains in effect.434
Regulatory Cooperation Council Canada and the United States announced the creation of the Canada-United States Regulatory Cooperation Council (RCC) on February 4, 2011.435 The aim of the RCC is to eliminate unnecessary regulatory differences and duplication that hinder cross-border trade and investment. After consultations with the private sector and bilateral negotiations between Canada and the United States, the RCC released a Joint Action Plan on Regulatory Cooperation on December 7, 2011, describing 29 ways in which Canada and the United States will seek greater regulatory alignment.436 All 29 work plans were finalized by July 2012, and include sector initiatives in areas such as automotive, agricultural, and consumer products, as well as future technologies, including nanotechnology. Activities under these work plans include collaboration on common approaches to regulations, mutual recognition of standards and development of joint standards, harmonized testing procedures, technical and scientific cooperation, information sharing, and pilot programs to increase regulatory transparency.
U.S. regulatory agencies and their Canadian counterparts met in Washington, DC, on June 19, 2013, to discuss work under the 2011 Joint Action Plan, the next steps in regulatory alignment, and the future role of the RCC.437 The RCC held its first stakeholder meeting with interested private sector participants in January 2012, and a second stakeholder meeting on June 20, 2013, in Washington, DC. At the June 2013 meeting, industry representatives from the automobile, consumer products, food, and major appliance sectors shared views on how to better align the regulatory system in both countries in key areas such as product approval procedures, reduction of duplicative requirements, and setting and implementing standards.438
Intellectual Property Canada was placed on the USTR Special 301 Priority Watch List in 2009, but was moved in 2012 to the Watch List in light of Canada’s moves to legislate improved copyright protection. Canada passed the Copyright Modernization Act on June 29, 2012, implementing into national law the World Intellectual Property Organization (WIPO) Copyright Treaty and the Performances and Phonograms Treaty––commonly known as the WIPO Internet Treaties––that Canada had signed
434 For further information, see USITC, The Year in Trade 2011, July 2012, 5-6. On March 21, 2014, the tribunal determined that Canada has no obligation to continue to apply the compensatory adjustments beyond October 12, 2013. LCIA No. 810108, “The United States of America and Canada––DETERMINATION,” March 21, 2014. 435 USDOS, American Embassy, Canada, “2013 Investment Climate Statement” (accessed March 25, 2014). 436 USDOC, ITA,“U.S.-Canada Regulatory Cooperation Council” (accessed March 25, 2014); USTR, 2014 Trade Policy Agenda and 2013 Annual Report, March 2014, III.137. 437 USDOC, ITA, “June 19, 2013: Meeting of Canada-United States Regulatory Cooperation Council” (accessed March 26, 2014). 438 USDOC, ITA, “June 20, 2013: RCC Stakeholder Dialogue Session” (accessed March 26, 2014); RCC, “U.S.-Canada Regulatory Cooperation––Charting the Path Forward,” June 20, 2013.
135

in 1997.439 Most of these provisions to improve copyright protection became effective on November 7, 2012.440
In October 2011, Canada signed the Anti-Counterfeiting Trade Agreement, which obligates Canada to grant Canadian border officials ex officio authority to take legal action against infringing products, including the seizure of counterfeit trademark and pirated copyright goods transshipped through Canada for the United States. Canada has indicated its intention to introduce domestic legislation to meet its commitments under this agreement, but has not yet done so. The United States has urged Canada to enact such legislation as soon as possible.441 In October 2013, Canada reintroduced the Combating Counterfeit Products Act in Parliament after a previous version lapsed in September at the end of the first session.442
In addition, a new patent utility standard adopted by Canadian courts for pharmaceuticals has raised concerns among U.S. firms over the adequacy of Canada’s patent protection regime.443 The U.S. pharmaceutical industry has expressed the view that Canada’s administrative process for regulatory approval and review of pharmaceutical products may limit patent protection in Canada. For example, one U.S. firm had its patent invalidated and another pharmaceutical patent was voided in November 2012 by Canadian Supreme Court decision.444
China In 2013, China remained the United States’ second-largest single-country trading partner based on two-way goods trade, accounting for 15.3 percent of U.S. trade with the world. U.S. two-way merchandise trade with China amounted to $552.5 billion in 2013, an increase of 4.6 percent over $528.4 billion in 2012. The U.S. merchandise trade deficit with China, which rose by 0.8 percent, or $2.4 billion, to $323.8 billion in 2013, remained higher than the U.S. deficit with any other trading partner. The increase in the trade deficit was mostly attributable to an increase in U.S. merchandise imports from China, which more than offset an accompanying increase in U.S. exports to China (figure 5.5). However, the U.S. trade surplus in services with China increased by 12.6 percent from $17.0 billion in 2012 to $19.2 billion in 2013 (figure 5.6).
China overtook Japan to become the third-largest single-country destination for U.S. merchandise exports in 2007, and remained in that position, behind Canada and Mexico, through 2013. U.S. merchandise exports to China amounted to $114.3 billion in 2013, a 10.4 percent increase over 2012. Of U.S. merchandise exports to China in 2013, about 11.7 percent consisted of soybeans, and 10.6 percent consisted of aircraft and parts. Other leading U.S.
439 USITC, The Year in Trade 2012, July 2013, 7. 440 Ibid. See text of the act at http://laws.justice.gc.ca/PDF/C-42.pdf, and most recent amendments to the consolidated act at http://laws.justice.gc.ca/eng/acts/C-42/page-1.html. 441 USDOS, American Embassy, Canada, “2013 Investment Climate Statement” (accessed March 25, 2014). 442 Ibid.; Parliament of Canada, “C-8: An Act to Amend the Copyright Act and the Trade-marks Act and To Make Consequential Amendments to Other Acts: Short Title: Combating Counterfeit Products Act,” October 16, 2013–present. 443 USDOS, American Embassy, Canada, “2013 Investment Climate Statement” (accessed March 25, 2014); USTR, 2014 Trade Policy Agenda and 2013 Annual Report, March 2014, III.137. 444 USTR, 2013 National Trade Estimate Report, April 2013, 58.
136

Figure 5.5 U.S. merchandise trade with China, 2009–13
Source: Official trade statistics of the USDOC as maintained by USITC.
Figure 5.6 U.S. private services trade with China, 2009-13a
Source: Official trade statistics of the USDOC as maintained by USITC.
aData for 2013 are preliminary.
-400
-300
-200
-100
0
100
200
300
400
500
2009 2010 2011 2012 2013
Billi
on $
Exports Imports Trade balance
0
5
10
15
20
25
30
35
2009 2010 2011 2012 2013
Billi
on $
Exports Imports Trade balance
137

exports to China included motor vehicles, metal waste and scrap, and cotton. The increase in the value of U.S. exports to China in 2013 was led by a $4.2 billion increase in exports of aircraft and parts and a $3.1 billion increase in passenger motor vehicles, followed by increases in exports of wheat, brewing or distilling dregs and waste, gold, and telecommunication instruments and apparatus.
In 2013, China remained the largest source of U.S. imports. U.S. merchandise imports from China amounted to $438.1 billion, an increase of 3.1 percent over 2012. Leading U.S. imports from China in 2013 were computers and computer parts, cellphones, telecommunications equipment, toys, video games, and footwear. The increase in the value of U.S. imports in 2013 was led by growth in imports of cellphones, computers and computer parts, telecommunication equipment, and electrical static converters. U.S.-China merchandise trade data are shown in appendix tables A.33 through A.35.
In 2013, U.S.-China trade relations focused on the following Chinese policies and practices: China’s IPR protection and enforcement; industrial policies; export restraints on raw material inputs; import bans on U.S. agricultural products; and entry barriers in services sectors. These issues were among the principal themes of the 2013 U.S.-China Strategic and Economic Dialogue (S&ED) and the 2013 Joint Commission on Commerce and Trade (JCCT).445 The S&ED, established in 2009, is a high-level forum in which the United States and China can discuss a wide range of bilateral, regional, and global political, strategic, security, and economic issues. The JCCT, established in 1983, is a forum for high-level dialogue on bilateral trade issues and a vehicle for promoting commercial relations. Both the S&ED and the JCCT meet annually.
Since China’s accession to the WTO, the United States has brought 15 WTO dispute settlement cases against China, and China has brought 9 WTO dispute settlement cases against the United States.446 In December 2013, China filed a new WTO dispute settlement case against the United States regarding its use of certain methodologies in antidumping investigations involving Chinese products (DS471).447 There were also developments in a number of existing WTO dispute settlement cases between the United States and China in 2013. The WTO panel report was adopted in a case brought by the United States regarding China’s antidumping and countervailing duty measures on broiler products from the United States (DS427).448 China reported it had fully implemented the Dispute Settlement Body (DSB) recommendations and rulings in two cases brought by the United States: (1) certain measures affecting electronic payment services (DS413);449 and (2) measures related to the exportation of various raw
445 U.S. Department of Treasury, “Joint U.S.-China Economic Track Fact Sheet,” July 12, 2013; USDOC, “24th U.S.-China Joint Commission on Commerce and Trade,” December 20, 2013. 446 WTO, “Chronological List of Dispute Cases” (accessed March 12, 2014). 447 WTO, “Dispute Settlement: DS471; United States—Certain Methodologies and Their Application to Anti-Dumping Proceedings Involving China” (accessed January 3, 2014). 448 WTO, “Dispute Settlement: DS427; China—Anti-dumping and Countervailing Duty Measures on Broiler Products from the United States” (accessed January 3, 2014). 449 WTO, “Dispute Settlement: DS413; China—Certain Measures Affecting Electronic Payment Services” (accessed January 3, 2014).
138

materials (DS394).450 The United States reported it had fully implemented the DSB recommendations and rulings in a case brought by China regarding antidumping measures on shrimp and diamond sawblades from China (DS422); however, China disagreed, arguing that the United States had failed to revoke the antidumping duty on sawblades.451 Developments in several of these cases during 2013 are described in more detail in chapter 3 and appendix table A.25.
Intellectual Property Rights Enforcement452 The United States and China have had lengthy and long-standing consultations on IPR issues, particularly since China’s accession to the WTO and acceptance of the Trade-Related Aspects of Intellectual Property Rights (TRIPS) Agreement. As a result, China has undertaken wide-ranging revisions to its laws and numerous special campaigns to improve public awareness of IPR and enforcement. These efforts have yielded positive results, although much work reportedly remains to be done. According to USTR, the ongoing and sustained involvement of China’s governmental leaders will be critical if China is to deliver on its substantial IPR commitments.
USTR’s 2013 Special 301 report again placed China on the Priority Watch List for countries with particular problems with respect to IPR protection, enforcement, or market access for persons relying on intellectual property.453 USTR noted substantial concerns with the theft of U.S. firms’ trade secrets and forced technology transfer, the difficulty of obtaining legal redress, and problems with non-deterrent IPR enforcement in general. More positively, USTR cited improvements in China’s IPR landscape through increased judicial resources devoted to IPR cases and through notable efforts to update major intellectual property laws. For example, a judicial interpretation by China’s Supreme People’s Court, which took effect on January 1, 2013, clarified that those who facilitate online infringement would be held jointly liable with the actual infringers.454
USTR’s 2013 Out-of-Cycle Review of Notorious Markets, which identified Internet and physical markets that reportedly engage in substantial copyright and trademark infringement, also highlighted developments in China, including some encouraging trends. In 2013, the Chinese website Xunlei shut down the previously listed multiplatform site GouGou; another Chinese website, Warez-bb, cooperated with authorities to address unauthorized conduct on its site; and a third, PaiPai, took measures to address complaints about its role in facilitating the distribution of pirated and counterfeit goods, and expanded its work with rights holders to include business and entertainment software and other content industries. As a result of their
450 WTO, “Dispute Settlement: DS394; China—Measures related to the Exportation of Various Raw Materials” (accessed January 3, 2014). 451 WTO, “Dispute Settlement: DS422; United States—Anti-dumping Measures on Shrimp and Diamond Sawblades from China” (accessed January 3, 2014). 452 For more information on the effect of China’s IPR infringement, see USITC, China: Intellectual Property Infringement, November 2010; USITC, China: Effects of Intellectual Property Infringement, May 2011. 453 USTR, 2013 Special 301 Report, May 2013. 454 Ibid., 10.
139

efforts, GouGou, Warez-bb, and PaiPai were removed from the Notorious Markets list.455 However, USTR listed a number of Chinese websites that still sell counterfeit goods and facilitate the unauthorized downloading and distribution of music, movies, and software, as well as physical markets in China where large quantities of copyright- and trademark-infringing products are being sold.456
Industrial Policies According to USTR, China continues to use industrial policies that “seek to limit market access for imported goods, foreign manufacturers and foreign-based service suppliers, while offering substantial government guidance, resources and regulatory support to Chinese industries.”457 Such policies remained a major U.S. concern in 2013; they included China’s indigenous innovation policy, export restraints, subsidies to domestic industries, value-added tax rebates, and restrictive investment regime.458
According to USTR, some progress was made on these issues in 2013. At the December 2013 JCCT meeting, China made a commitment that it would not implement two measures that would have excluded vehicles manufactured by foreign enterprises or foreign-invested enterprises from procurement by the Chinese government and the Chinese Communist Party. Additionally, as a result of the 2012 bilateral dialogue, in 2013 the Chinese government reversed a proposed measure relating to approval of new medical devices that sought to limit eligibility for priority treatment to medical device manufacturers holding indigenous intellectual property.459
Export Restraints on Raw Material Inputs USTR reported that China continued to impose “numerous export restraints” in 2013, including export quotas, export licensing and bidding requirements, minimum export prices, and export duties on exports of raw materials. USTR also reported that such practices distort trade in raw materials as well as intermediate and final products.460 The United States filed two WTO dispute settlement complaints (DS394 in 2009 and DS431 in 2012) addressing China’s export restraints on raw materials.461 The United States prevailed in the first dispute settlement case
455 USTR, 2013 Out-of-Cycle Review of Notorious Markets, February 2014, 3. 456 The list of Chinese online websites and physical marketplaces can be found in USTR, 2013 Out-of-Cycle Review of Notorious Markets, February 2014. 457 USTR, 2013 Report to Congress on China’s WTO Compliance, December 2013, 8. 458 USTR, 2012 Report to Congress on China’s WTO Compliance, December 2012, 7–10. 459 USTR, 2013 Report to Congress on China’s WTO Compliance, December 2013, 8–9. 460 Ibid., 42-43. 461 WTO, “Dispute Settlement: DS394; China—Measures Related to the Exportation of Various Raw Materials”; WTO, “Dispute Settlement: DS431; China—Measures Related to the Exportation of Rare Earths, Tungsten and Molybdenum” (accessed January 3, 2014).
140

(DS394) in 2012462 and, in response, during 2013 China took steps to remove export duties and export quotas on certain raw material inputs covered in the dispute.463
Agriculture In 2013, U.S. agricultural exports worth about $25.9 billion, or 18.0 percent of all U.S. agricultural exports, went to China, making it the largest U.S. agricultural export destination.464 Although U.S. agricultural exports to China continued to grow in 2013, a variety of nontariff barriers remained to impede market access, including SPS measures and inspection-related requirements.465
In 2013, China continued to block the importation of U.S. beef and beef products in response to a case of BSE detected in the United States in 2003.466 At the December 2013 JCCT meeting, both sides agreed to aim to resume Chinese market access for U.S. beef by July 2014 on the basis of mutually agreed-upon conditions.467
In 2013, China also continued to ban imports of U.S. pork containing trace amounts of ractopamine, even at concentrations below the U.S. maximum residue level (MRL) and the proposed Codex Alimentarius MRL.468 The ban reflected China’s zero-tolerance policy for ractopamine, a veterinary drug used in animal feed to promote muscle growth in pigs, cattle, and, to a limited extent, heavy turkeys.469
In 2007, China placed avian influenza (AI)-related import bans on U.S. poultry and poultry products from several U.S. states. The United States asked China to take prompt action in accordance with science-based international standards on the state-level bans.470 During 2010–12, China lifted bans on U.S. poultry products from Idaho, Kentucky, Minnesota, Pennsylvania, and Texas. In June 2013, China lifted the Arkansas ban, but reimposed it several weeks later when a detection of low-pathogenic AI was reported. China also imposed a ban on poultry products from Wisconsin in June 2013 due to a detection of low-pathogenic AI. As of December 2013, China maintained import bans on poultry and poultry products from Arkansas, New York,
462 In March 2014, the WTO Panel ruled in favor of the United States in DS431. China has notified the WTO of its decision to appeal. 463 USTR, 2013 Report to Congress on China’s WTO Compliance, December 2013, 9. 464 USDA, “Top 15 U.S. Agricultural Export Destinations,” April 21, 2014. 465 USTR, 2013 Report to Congress on China’s WTO Compliance, December, 2013, 86–89. For more information on the conditions of competition in China’s agricultural market and trade, see USITC, China’s Agricultural Trade: Competitive Conditions, March 2011. 466 USTR, 2013 Report to Congress on China’s WTO Compliance, December, 2013, 92. 467 USTR, “24th U.S.-China Joint Commission on Commerce and Trade,” December 20, 2013. 468 USTR, 2012 Report on Sanitary and Phytosanitary Measures, April 2, 2012, 31. The Codex Alimentarius Commission is a UN food standards-setting body. 469 FAO, “Discussion on Ractopamine in Codex,” April 26, 2012. 470 USTR, 2012 Report on Sanitary and Phytosanitary Measures, April 2, 2012, 34.
141

Virginia, and Wisconsin.471 Additionally, poultry from eligible states may not transit the four restricted states, even if the truck, container, or railcar is sealed.
Services In 2013, about 5.0 percent, or $33.2 billion, of U.S. services exports went to China, making it the fifth-largest single-country market for U.S. services. However, USTR noted that in 2013 China continued to “maintain or erect restrictive or cumbersome terms of entry or internal expansion in some sectors (e.g., financial services, legal services, express delivery services, and construction and related engineering services) that prevent or discourage foreign suppliers from gaining market access.”472 Additionally, USTR noted that barriers such as “discriminatory regulatory processes, informal bans on entry, overly burdensome licensing and operating requirements” have prevented or discouraged U.S. services suppliers from achieving their full market potential in China.473
China’s telecommunication services market—the world’s second-largest—is one area that has been noted as problematic.474 Telecommunications services in China are classified into two categories: basic and value-added. As of November 2013, the Chinese regulator had licensed more than 29,000 domestic suppliers of value-added telecommunications services, but only 41 foreign suppliers.475 In 2013, China released a draft revision of its Catalogue of Telecommunications Services that seeks to expand the scope of value-added telecommunications services to include a range of Internet-based services, such as cloud computing services, e-commerce services, and content distribution network services. This change could potentially further limit the market access of foreign suppliers by subjecting them to additional telecommunications licensing requirements.476
Life insurance is another area of concern, though there have been recent promising developments. At present, in this sector, China permits foreign companies to participate only in Chinese-foreign joint ventures, with foreign equity capped at 50 percent. China also prevents foreign insurance brokers from providing a full scope of services. Such market access restrictions have limited foreign insurers to low market share in the Chinese insurance market—less than 4 percent of the life insurance sector and only 1 percent of the non-life (i.e., property and casualty) insurance sector.477 At the May 2012 S&ED meeting, China noted that its regulations had been amended to allow U.S. and other foreign insurance companies to sell mandatory auto liability insurance in China. At the July 2013 S&ED meeting, China stated that in its pilot projects for tax-deferred insurance pension products, it will treat domestic enterprises
471 USTR, 2013 Report on China’s WTO Compliance, December 2013, 95. In May 2014, China lifted the import ban on poultry and poultry products from Virginia, allowing Virginia products slaughtered or processed on or after April 30, 2014, to enter the country. USDA, FSIS, “Export Requirements for the People’s Republic of China,” May 8, 2014. 472 USTR, 2013 Report to Congress on China’s WTO Compliance, December 2013, 114–115. 473 Ibid., 11. 474 USITC, Recent Trends in U.S. Services Trade: 2012 Annual Report, July 2012, 8-2. 475 USTR, 2013 Report to Congress on China’s WTO Compliance, December 2013, 127. 476 Morrison & Foerster, “China’s MIIT Releases Long-Awaited Draft,” June 13, 2013. 477 USTR, 2013 Report to Congress on China’s WTO Compliance, December 2013, 122.
142

and foreign-invested enterprises equally with regard to participation and any further expansion.478
A third problem area has involved China’s restrictions on foreign suppliers of electronic payment services, including major U.S. credit card companies. In 2010, the United States brought a WTO dispute settlement case against China regarding its measures affecting electronic payment services (DS413), and won the case in 2012.479 China announced in July 2013 that it had complied with the WTO recommendations; however, USTR disagreed.480 USTR acknowledged that, as of December 2013, China had taken some steps toward complying with the WTO’s rulings, but stated that China continued to deny market access to foreign services providers in at least one important respect. Specifically, China has not set up a process for foreign suppliers to obtain licenses to provide electronic payment services for payment card transactions denominated in local currency through commercial presence in China.481 The United States has indicated its concerns about the situation at the WTO and is considering further options there while continuing to press China to comply with the rulings.482
U.S.-China Bilateral Investment Treaty In July 2013, at the fifth U.S.-China S&ED meeting, the two countries announced that they intended to negotiate a bilateral investment treaty (BIT) that would provide national treatment at all phases of investment, including market access (i.e., the “pre-establishment” phase of investment), and in all sectors of the Chinese economy (with negotiated exceptions).483 According to the U.S. Department of Treasury, this was the first time that China agreed to negotiate a BIT on this scale, which will help eliminate the market barriers and level the playing field for U.S. businesses in China.484 The United States and China had previously agreed to launch negotiations for a BIT on June 18, 2008, during the fourth meeting of the U.S.-China Strategic Economic Dialogue. However, negotiations were delayed during a review of the United States’ 2004 model BIT, which concluded in April 2012 with a new model BIT.485 U.S.-China negotiations will be based on the new model BIT, which provides investors with “improved market access; protection from discriminatory, expropriatory, or otherwise harmful
478 USTR, 2013 Report to Congress on China’s WTO Compliance, December, 2013, 123. 479 WTO, “Dispute Settlement: DS413; China—Certain Measures Affecting Electronic Payment Services” (accessed January 3, 2014). 480 USTR, “2013 Year in Review: A Look Back,” January 3, 2014. 481 USTR, 2013 Report to Congress on China’s WTO Compliance, December, 2013, 125. 482 Ibid., 125. 483 U.S. Department of Treasury, “U.S. Fact Sheet—Economic Track Fifth Meeting” July 12, 2013; USTR, 2013 Report to Congress on China’s WTO Compliance, December, 2013, 77. At the July 2014 S&ED meeting, the two sides agreed to intensify BIT negotiations with an aim to reach agreement on core issues and major articles of the treaty text by the end of 2014, and initiate the “negative list” negotiation to identify exceptions early in 2015 based on each other’s “negative list” offers. A “negative list” lists those sectors where investments would be explicitly excluded from the terms of the BIT. U.S. Department of Treasury, “U.S. and China Joint Fact Sheet Sixth Meeting,” July 11, 2014. 484 U.S. Department of Treasury, “U.S. and China Breakthrough Announcement,” July 15, 2013. 485 USTR, “United States Concludes Review of Model Bilateral Investment Treaty,” April 2012. The Obama Administration initiated a review of the 2004 model BIT to ensure that it was consistent with the Administration’s economic agenda.
143

government treatment; and a mechanism to pursue binding international arbitration for breaches of the treaty.”486 The 2012 model BIT made several changes from the earlier model BIT, including enhanced transparency and public participation; strengthened disciplines that address preferential treatment to state-owned enterprises, including the distortions created by certain indigenous innovation policies; and improved protections relating to labor and the environment.487
Mexico In 2013, Mexico was the United States’ third-largest single-country merchandise trading partner, following Canada and China. Merchandise trade between the two countries increased 1.7 percent to $459.4 billion in 2013, accounting for 12.7 percent of U.S. trade with the world. While the U.S. merchandise trade deficit with Mexico fell by $5.2 billion in 2013, to $96.0 billion, it was still the United States’ second-largest merchandise trade deficit with any single country (figure 5.7). The deficit was outweighed only by that with China, which was almost three and a half times the U.S. trade deficit with Mexico.
At the same time, the U.S. trade surplus in services with Mexico decreased by 4.5 percent to $11.7 billion in 2013 (figure 5.8). U.S. services exports to Mexico were valued at $28.5 billion, while U.S. services imports from Mexico totaled $16.8 billion. Mexico was the United States’ sixth-largest single-country trading partner for services in 2013, after the United Kingdom, Canada, Japan, Germany, and China.
U.S. merchandise exports to Mexico totaled $181.7 billion in 2013, an increase of 3.7 percent from 2012. In 2013, leading U.S. exports to Mexico included transportation equipment, particularly automotive trade; chemicals and related products; energy-related products; and electronic products. These exports together accounted for 60 percent of total U.S. merchandise exports to Mexico. Other leading exports to Mexico included parts and accessories for automatic data processing machines; articles of plastic; corn; copper ores; and soybeans.
In 2013, U.S. merchandise imports from Mexico increased by 0.5 percent to $277.7 billion. Leading U.S. imports from Mexico included transportation equipment, electronic products, energy-related products, and machinery, which together accounted for 75 percent of total U.S. merchandise imports from Mexico. Other leading imports from Mexico were computers, televisions, cellphones, and nonmonetary gold. Particularly important in the increase of U.S. imports from Mexico was the rise in the value of imports of vehicles and vehicle parts and accessories. U.S.-Mexico merchandise trade data are shown in appendix tables A.36 through A.38.
U.S.-Mexican trade relations are governed in large part by NAFTA, which provides duty-free treatment to a sizable portion of the goods traded between the two parties (table 4.2).488 In
486 USTR, “United States Concludes Review of Model Bilateral Investment Treaty,” April 2012. 487 Ibid. 488 For more information on NAFTA, see chapter 4.
144

Figure 5.7 U.S. merchandise trade with Mexico, 2009–13
Source: Official trade statistics of the USDOC as maintained by USITC.
Figure 5.8 U.S. private services trade with Mexico, 2009-13a
Source: Official trade statistics of the USDOC as maintained by USITC. aData for 2013 are preliminary.
-150
-100
-50
0
50
100
150
200
250
300
2009 2010 2011 2012 2013
Billi
on $
Exports Imports Trade balance
0
5
10
15
20
25
30
2009 2010 2011 2012 2013
Billi
on $
Exports Imports Trade balance
145

October 2012, Mexico officially joined the ongoing negotiations under the Trans-Pacific Partnership (TPP), a prospective regional trade agreement between the United States and 11 other countries (including Mexico).489
Various trade disputes between the United States and Mexico were the subject of WTO and NAFTA dispute settlement proceedings in 2013. These include long-standing WTO disputes brought by Mexico on U.S. requirements for country of origin labeling and U.S. measures relating to the importation, marketing, and sale of tuna and tuna products, both of which remained in the compliance stage in 2013. The procedural developments in each of these cases are listed in appendix tables A.25 and A.26, respectively.
To strengthen the U.S.-Mexico commercial and economic relationship, a new High Level Economic Dialogue (HLED) was established in 2013; it is described below. Also summarized below are developments in bilateral regulatory cooperation and developments related to NAFTA’s cross-border trucking provisions.
High Level Economic Dialogue On May 2, 2013, the presidents of the United States and Mexico met in Mexico City and announced the formation of the HLED, whose goal is to promote competitiveness and connectivity; foster economic growth, productivity, entrepreneurship, and innovation; and build a partnership for regional and global leadership.490 The HLED intends to advance strategic economic and commercial priorities central to promoting mutual economic growth, job creation, and competitiveness. The HLED, which will be led at the cabinet level and meet annually, aims to build on a variety of existing successful bilateral dialogues and working groups.491
On September 20, 2013, Vice President Biden, together with Mexican government officials, launched the HLED in Mexico City, co-chaired by the U.S. Department of State, U.S. Department of Commerce, Office of the U.S. Trade Representative, and their Mexican counterparts.492 To accomplish the goals laid out in the HLED work plan,
the United States and Mexico plan to: continue the work of the Mexico-U.S. Entrepreneurship and Innovation Council (MUSEIC) and expand entrepreneurship delegation exchanges; collaborate on organizing an information and communications technology road show, regulatory workshop series, and broadband innovation information exchanges; announce negotiations to modernize and expand our bilateral air transport relationship; develop an agenda of ongoing cooperation on
489 TPP is discussed in chapter 4. 490 White House, “Fact Sheet: U.S.-Mexico Partnership,” March 12, 2013; White House, “Fact Sheet: U.S.-Mexico High Level Economic Dialogue,” September 20, 2013. 491 White House, “Fact Sheet: U.S.-Mexico Partnership,” March 12, 2013. 492 White House, “Fact Sheet: U.S.-Mexico High Level Economic Dialogue,” September 20, 2013; USDOC, “Secretary Pritzker Co-Chairs U.S.-Mexico High Level Economic Dialogue,” September 20, 2013; USDOC, ITA, Fact Sheet “High Level Economic Dialogue” (accessed March 13, 2014).
146

intelligent transportation and freight systems; make efficient use of the North American Development Bank by supporting new and ongoing cross-border initiatives and directing its Board to begin an assessment of the Bank’s long-term capital needs as well as how it can more effectively leverage private sector capital to support border infrastructure; and pursue joint investment initiatives.493
High-Level Regulatory Cooperation Council On May 19, 2010, Mexico and the United States established the U.S.-Mexico High-Level Regulatory Cooperation Council (HLRCC) to enhance regulatory cooperation between the United States and Mexico through bilateral working groups composed of senior regulatory, trade, and foreign affairs officials from both countries.494 In March 2011 the HLRCC published terms of reference495 that set a goal of developing a work plan within two years. The work plan was to identify sectors in which both governments considered that harmonized regulations would be likely to reduce transaction costs and have a high positive impact on economic growth. Released in February 2012, the HLRCC’s work plan stipulated that the effort should include a focus on standards and technical regulations that mitigate risk––such as safety, health, and environmental risk––and that regulations should be consistent within the NAFTA region. Important economic aims are to facilitate intra-North American commerce and enhance the competitiveness of North American producers in key export markets, with a focus on small and medium-sized enterprises.
Work Plan After extensive consultations with private sector stakeholders, public comment, and bilateral discussion within the HLRCC, the council released the initial United States-Mexico HLRCC Work Plan on February 28, 2012, covering the period 2012–13.496 The work plan addressed regulatory issues in the areas of food and agriculture, energy, transportation, health, technology, and standards accreditation. Specific sectoral subjects focused on seven areas: food safety modernization, electronic certification (“e-certification”) for plants and plant products, commercial motor vehicle safety standards and procedures, electronic health record systems (“e-health”), offshore oil and gas development standards, nanotechnology, and the cross-sectoral issue of accreditation of conformity assessment bodies.
493 White House, “Fact Sheet: U.S.-Mexico High Level Economic Dialogue,” September 20, 2013. On February 19, 2014, the presidents of Canada, Mexico, and the United States held the North American Leader’s Summit in Toluca, Mexico. At the summit, the presidents stated, “We are determined to promote inclusive broad-based economic growth for the wellbeing of our citizens, so that 21st century North America sets new global standards for trade, education, sustainable growth, and innovation.” White House, “Joint Statement by North American Leaders,” February 19, 2014; USDOC, “U.S. Secretary of Commerce Penny Pritzker Attends,” February 19, 2014. 494 White House, “Joint Statement from President Barack Obama and President Felipe Calderón,” May 19, 2010; USDOC, ITA, “U.S.-Mexico High Level Regulatory Cooperation Council” (accessed May 1, 2014). 495 White House, “Terms of Reference for the High-Level Regulatory Cooperation Council,” March 3, 2011. 496 White House, Executive Office of the President, United States-Mexico High Level Regulatory Cooperation Council, February 28, 2012.
147

2013 Progress Report On August 15, 2013, the HLRCC published its first “Progress Report to Leaders,” including an appendix discussing regulations for nanotechnologies.497 The report lists the agencies involved, recounts meetings held during 2012–13, and details the current status of discussions in the seven sectoral topics set out in the work plan.
On food safety, a key topic has been the U.S. Food Safety Modernization Act. The report noted that Mexico was developing an e-certification system as part of the Mexican Single Window for Foreign Trade (VUCEM)498 following the release on June 27, 2013, of an electronic module for the Phytosanitary Certificate Issuance and Tracking system in the United States. In the area of transportation, the report cited progress toward alignment of truck safety standards to eliminate duplication of verification costs for vehicles entering either country, as well as progress toward developing a plan to recognize Mexico’s certifications of commercial vehicle inspection as the legal equivalent to inspections under U.S. law. Discussion of e-health record systems centered around sharing best regulatory practices for e-health certification programs, information exchange on interoperability standards for electronic health records, and the creation of a framework to establish core vocabularies for electronic health records. Regarding offshore oil and gas standards, discussions focused on developing a framework to identify critical oil and gas exploration and production activities in the Gulf of Mexico. The discussions centered on sharing best practices employed worldwide, as well as participation in offshore platform inspection and workshops to review lessons learned concerning oil spill responses.
Appendix A of the 2013 Progress Report contains guidelines for nanotechnology regulation drafted by Mexico in accordance with Mexican legal provisions.499 According to the appendix, the guidelines were developed in particular to help protect the environment, human health, and the consumer. Presented in Mexico City on November 12, 2012, the guidelines note that nanotechnology in Mexico is found in materials such as cosmetic products, coatings, bactericides, textiles, and other products. Among other principles, the guidelines state that regulations on nanotechnology, when needed, (1) should be based on sound technical and scientific evidence, (2) should protect worker health and the environment, and (3) should involve open communication with trade partners.500
The report also addressed a cross-sectoral issue: the accreditation of conformity assessment bodies. The progress report detailed activities undertaken by U.S. and Mexican regulatory agencies to increase recognition of U.S. and Mexican laboratories in the two countries. The activities focused on improving Mexican laboratories’ understanding of technical requirements and application processes in the United States and on making Mexican regulations more transparent to U.S. laboratories seeking certification.
497 United States-Mexico Regulatory Cooperation Council, “Progress Report to Leaders,” August 15, 2013. 498 In Mexico, Ventanilla Digital Mexicana de Comercio Exterior. 499 United States-Mexico Regulatory Cooperation Council, “Progress Report to Leaders,” August 15, 2013, appendix A. 500 Ibid.
148

Cross-Border Trucking between the United States and Mexico Before 2000, all Mexican trucks were limited to trucking goods in the United States within the “commercial zones” (which extend up to 25 miles into the United States along the U.S.-Mexico border). Under the cross-border trucking commitments found in Chapter 12 of NAFTA, Mexican trucks were allowed to provide cross-border truck services throughout the United States beginning in 2000. The implementation of these provisions was delayed because of U.S. safety concerns.501 To address these concerns, in 2011 the U.S. Department of Transportation established a Pilot Program on the NAFTA Long-Haul Trucking Provisions,502 following the suspension of an earlier program.503 The pilot program was not to exceed three years.504
Under the pilot program, on July 8, 2011, the Federal Motor Carrier Safety Administration (FMCSA) authorized Mexico-domiciled motor carriers to transport cargo throughout the United States (long-haul operations).505 To enter the pilot program, Mexican trucks must meet criteria that U.S. and Mexican government officials agreed upon.506 The agreement also stipulated that before a carrier has completed 18 months of operation under the pilot program, a final compliance review is to be conducted. Carriers that pass the review are granted a permanent operating authority to operate throughout both countries.507
In 2012, FMCSA conducted an audit of the program, concluding that there might not be enough authorized carriers to statistically assess the safety of the pilot program. The audit, covering the period from October 2011 through May 2012, noted that “The low participation in the pilot program puts FMCSA at risk of not meeting its goals for providing an adequate and representative sample of Mexico-domiciled carriers and inspections necessary to assess the impact on motor carrier safety.”508 FMCSA estimated that at least 46 carriers would be needed to conduct a target of 4,100 inspections over a period of three years.
As of December 2013, FMCSA had active long-haul operating authority for 14 Mexican-domiciled motor carriers. These carriers had a total of 56 participating vehicles authorized to
501 Developments in cross-border truck services between the United States and Mexico from 1981 to 2012 are reported in USITC, The Year in Trade 2008, 2009, 5-16; USITC, The Year in Trade 2009, 2010, 5-16; USITC, The Year in Trade 2010, 2011, 5-12; USITC, The Year in Trade 2011, 2012, 5-14; USITC, The Year in Trade 2012, 2013, 5-13. 502 76 Fed. Reg. 20807 (April 13, 2011). 503 The earlier program was suspended in 2009. In response, Mexico retaliated by suspending NAFTA preferential tariffs on certain U.S. products. In 2011, Mexico eliminated the retaliatory duties after the first Mexican carrier was authorized to enter the 2011 pilot program. For more details, see USITC, The Year in Trade 2011, 2012, 5-14; USITC, The Year in Trade 2012, 2013, 5-13. 504 Details of the program are reported in USITC, The Year in Trade 2011, 2012, 5-14. 505 76 Fed. Reg. 40420 (July 8, 2011). 506 USDOT, FMCSA, “Memorandum of Understanding on International Freight,” July 6, 2011. 507 Ibid. 508 USDOT, FMCSA, “Increased Participation and Improved Oversight Mechanisms,” August 16, 2012, 2.
149

operate throughout the United States, and the trucks underwent a total of 4,209 inspections.509 The program is scheduled to end in October 2014.
Japan In 2013, Japan remained the fourth-largest single-country U.S. trading partner in terms of two-way merchandise trade. Japan accounted for 5.5 percent of total U.S. merchandise trade, down from 5.8 percent in 2012. U.S.-Japan two-way trade has not changed significantly since the late 1990s, a trend driven in part by slow growth in Japan that was further exacerbated by the Great East Japan Earthquake disaster of 2011. In addition, Japanese producers increasingly rely on operations in third-country Asian markets to meet global demand as well as regional supply chains to further process Japanese intermediate goods; the result is a relative decline in Japanese exports to the United States and other markets not directly within its downstream supply chains.510
U.S. merchandise trade with Japan was $197.6 billion in 2013, a decrease of 5.5 percent from 2012 that resulted from lower exports and imports and was characteristic of a decline in the value of Japanese global trade.511 The United States recorded a merchandise trade deficit with Japan of $78.3 billion in 2013, roughly equivalent to the $79.9 billion deficit in 2012 (figure 5.9). The stability of the bilateral trade deficit was due to nearly identical declines in the value of U.S. exports to and imports from Japan.
Japan was the United States’ third-largest single-country trading partner in services, behind the United Kingdom and Canada, in 2013. U.S. services exports to Japan rose 2.6 percent to $47.7 billion, while imports of services from Japan rose 8.2 percent to $29.1 billion. The result was a $971 million decrease in the U.S. services surplus with Japan, to $18.6 billion, in 2013 (figure 5.10).
Japan remained the fourth-largest destination for U.S. merchandise exports, accounting for 4.4 percent of global U.S. exports. Between 2012 and 2013, however, U.S. merchandise exports to Japan fell by 7.6 percent, from $64.6 billion in 2012 to $59.7 billion in 2013. Leading U.S. exports to Japan were aircraft and parts, certain medicaments (medicines), corn, pork, wheat, and soybeans. The decline in U.S. exports to Japan was broadly based across most major sectors, such as corn (which fell by $1.2 billion) and aircraft and parts (which fell by $1.0 billion). Nonetheless, certain leading products experienced significant export growth, including liquefied propane, which increased by $427 million, and machines used to manufacture semiconductor devices or electronic integrated circuits, which increased by $441 million.
509 USDOT, FMCSA, Mexico Cross-Border Trucking Pilot Program, “Operational Update Reports,” 12/23/2013–12/29/2013 (revised 01/27/2014); USDOT, FMCSA, “Mexico-Domiciled Motor Carriers with Active Operating Authority,” December 29, 2013. 510 CRS, U.S.-Japan Economic Relations: Significance, Prospects, February 18, 2014, 4–5; JETRO, FY2013 Survey on the International Operations of Japanese Firms, February 27, 2014. 511 GTIS, Global Trade Atlas database (accessed April 4, 2014). The EIU reports that the annual average exchange rate between the U.S. dollar and the Japanese yen increased from 79.8 ¥/$ in 2012 to 97.6 ¥/$ in 2013. Therefore, the apparent decline in the U.S.-dollar value of Japanese trade may in part reflect the substantial depreciation of the Japanese yen relative to the U.S. dollar that occurred between 2012 and 2013.
150

Figure 5.9 U.S. merchandise trade with Japan, 2009–13
Source: Official trade statistics of the USDOC as maintained by USITC.
Figure 5.10 U.S. private services trade with Japan, 2009-13a
Source: Official trade statistics of the USDOC as maintained by USITC. aData for 2013 are preliminary.
-100
-50
0
50
100
150
200
2009 2010 2011 2012 2013
Billi
on $
Exports Imports Trade balance
0
10
20
30
40
50
60
2009 2010 2011 2012 2013
Billi
on $
Exports Imports Trade balance
151

Japan remained the fourth-largest source of U.S. merchandise imports, accounting for 6.2 percent of global U.S. imports. U.S. merchandise imports from Japan fell by 4.6 percent to $138.0 billion in 2013, down from $144.5 billion in 2012. Leading U.S. imports from Japan were passenger vehicles and parts, aircraft parts, parts for printers and copying machines, and heavy construction equipment. The decline in U.S. imports from Japan was led by a variety of products, including certain automotive parts, electronics, and heavy machinery. However, imports of passenger vehicles remained stable, while imports of certain aircraft parts generally increased. U.S.-Japan merchandise trade data are shown in appendix tables A.39 through A.41.
Economic dialogue between the United States and Japan in 2013 centered on Japan’s official entry into TPP negotiations in July 2013, including bilateral consultations beforehand and formal negotiations afterward. As part of these discussions, Japan agreed to work with the United States to address several long-standing trade concerns. These involved automotive market access, insurance and express delivery competition policy, and cross-cutting nontariff barriers to trade, such as standards and lack of transparency. In addition, Japan coordinated closely with the United States on a variety of WTO dispute settlement matters involving third-country markets, including a dispute concerning Chinese export restraints on rare earths, tungsten, and molybdenum.512 Japan and the United States also worked together in negotiations to expand the products covered by the WTO Information Technology Agreement, as well as the membership of the agreement.513
TPP Negotiations and Dialogue Between February 2012 and April 2013, bilateral economic dialogue between the United States and Japan was largely driven by consultations regarding Japan’s interest in joining the TPP.514 In exchange for U.S. support for Japan’s entrance into TPP negotiations, the United States looked for Japan to address three “confidence-building measures” related to Japanese restrictions on U.S. beef, market access for U.S. automotive exports, and insurance competition policy.515 As indicated further below, Japan took steps to address all three of these concerns before formally joining the negotiations. Japan also indicated its willingness to join the 11 other TPP partners in negotiating a high-standard trade agreement, including market access for industrial and agricultural goods, open markets for services and investment, protection of the environment, workers’ rights, and IPR. Japan further agreed to subject all goods to negotiation.516
Before Japan entered into TPP negotiations, Japanese and U.S. policy makers also agreed to conduct bilateral negotiations parallel to the multilateral negotiations. These talks were designed to produce outcomes that would be incorporated into the final TPP agreement once
512 USTR, 2014 Trade Policy Agenda and 2013 Annual Report, March 2014, 9. 513 Ibid., 4, 142. 514 USTR, “Toward the Trans-Pacific Partnership,” April 12, 2013. For additional information on the TPP, see chapter 4. 515 CRS, U.S.-Japan Economic Relations: Significance, Prospects, and Policy Options, February 18, 2014, 12. 516 USTR, “Toward the Trans-Pacific Partnership,” April 12, 2013; USTR, 2014 Trade Policy Agenda and 2013 Annual Report, March 2014, 2–3.
152

concluded.517 These bilateral negotiations will continue to focus on the insurance sector of the Japanese market and automotive market access issues. In addition, the United States and Japan agreed to use this bilateral negotiating framework to address a variety of cross-cutting nontariff measures in Japan that affect U.S. exporters and investors. The United States stated that it would seek more transparency in Japanese public decision making, including by increasing access to ministry-appointed advisory councils and through public comment procedures; facilitation of opportunities for mergers and acquisitions; stronger copyright, trademark rights, and enforcement of IPR; flexibility and transparency in standards setting and greater adoption of international standards; improved government procurement bidding processes; fairer competition policy, including competition policy governing express delivery services; and less restrictive SPS measures.518
Following the conclusion of preliminary consultations with the United States as well as with other TPP countries, the President notified Congress of his intent to include Japan in the TPP negotiations in April 2013.519 After a 90-day consultation period with Congress and the public on U.S. negotiating objectives with respect to Japan, Japan entered formal TPP negotiations during the 18th round in July 2013.520 As multilateral TPP negotiations continued throughout 2013, the United States and Japan had four rounds of bilateral parallel negotiations.521
Passenger Vehicle Market Access Despite the presence of a large domestic passenger vehicle market in Japan and a globally competitive passenger vehicle industry in the United States, U.S. manufacturers have been unable to make significant sales to this market. In order to address these concerns over market access, the United States used bilateral discussions both before and after Japan’s entry into TPP negotiations to address long-standing concerns over barriers to trade in such goods. The passenger vehicle consultations and negotiations focused on transparency in regulations, standards and conformity assessment, and on facilitating the adoption and distribution of “green” and new-technology vehicles, as well as other issues.522 Japan and the United States further agreed to negotiate a special motor vehicle safeguard provision as part of the TPP, as well as a “mechanism to ‘snap back’ tariffs” as a remedy in dispute settlement cases.”523
In addition, Japan announced in April 2013 that it would more than double the number of motor vehicles that could enter under its Preferential Handling Procedure (PHP), an easier, faster certification program used to quickly establish safety and environmental compliance of imported vehicles. U.S. producers would be able to export up to 5,000 vehicles annually, per
517 USTR, “Transcript: Briefing by USTR Ambassador Froman,” December 10, 2013. 518 USTR, “Toward the Trans-Pacific Partnership,” April 12, 2013; USTR, “Fact Sheet: Non-Tariff Measures: U.S. Consultations with Japan,” April 12, 2013. 519 USTR, “Obama Administration Notifies Congress of Intent,” April 24, 2013. 520 USTR, “Statement on the 18th Round of Trans-Pacific Partnership Negotiations,” July 25, 2013. 521 USTR, 2014 Trade Policy Agenda and 2013 Annual Report, March 2014, 142. These parallel bilateral negotiations continued into 2014. 522 USTR, Motor Vehicle Trade: Terms of Reference, April 12, 2013. 523 USTR, “Toward the Trans-Pacific Partnership,” April 12, 2013.
153

model, under the PHP program, up from 2,000 vehicles.524 Japan also agreed that, in a finalized agreement, U.S. tariffs on imports of Japanese motor vehicles would be phased out in accordance with the longest staging period established during the TPP negotiations, and that these phase-outs would be “back loaded” to take place at the end of the staging period.525
Japan Post In 2013, the United States continued to press Japan on the competitive position held by Japan Post Holdings Co. (Japan Post), a publicly held company, in the banking, insurance, and express delivery sectors of the Japanese economy.526 As in previous years, a major concern for U.S. policy makers and business leaders has been that Japan Post uses its size and the variety of its domestic holdings to cross-subsidize and promote its services across sectors, allowing it to monopolize services markets. In addition, Japan Post is subject to fewer reporting and customs clearance requirements than private companies, which may give it a competitive advantage over both smaller domestic firms and foreign competitors. While the United States remains neutral as to whether Japan Post should be privatized, it is concerned that these advantages do not allow smaller domestic businesses or international providers to compete on a level playing field within the banking, insurance, and express delivery services sectors.527
In 2007, former Prime Minister Koizumi’s government introduced reforms designed to privatize and separate the holdings of Japan Post, thereby making them subject to the same regulations as private firms. However, successor governments moved to reverse or mitigate these reforms before they were fully implemented, and the Japanese Diet passed legislation in April 2012 to loosen regulatory requirements on Japan Post as part of a compromise among various Japanese political parties.528 This legislation extended Japan Post companies’ exemptions from the Insurance Business Law and Banking Law, gave companies within Japan Post more latitude to expand their business scope, and increased interconnectedness between the Japan Post’s mail delivery and network operations subsidiaries.529
As part of the consultative process leading to Japan’s entrance into TPP negotiations, the United States and Japan agreed to address “level playing field” issues relating to Japan Post insurance and express delivery operations. Japan unilaterally announced in April 2013 that it would not approve new or modified cancer insurance and/or stand-alone medical products sold
524 Ibid. 525 Ibid. 526 USTR, “Toward the Trans-Pacific Partnership,” April 12, 2013; USTR, “Non-Tariff Measures: U.S. Consultations with Japan,” April 12, 2013. Japan Post is a Japanese conglomerate owned by the government of Japan; it supplies integrated postal, banking, and insurance services, among other services. Japan Post Group, Annual Report 2013, July 2013. 527 USTR, 2014 National Trade Estimate Report on Foreign Trade Barriers, March 2014, 180–182. 528 CRS, U.S.-Japan Economic Relations: Significance, Prospects, and Policy Options, February 18, 2014, 10–11. 529 USTR, 2014 National Trade Estimate Report on Foreign Trade Barriers, March 2014, 180–182; USTR, 2013 National Trade Estimate Report on Foreign Trade Barriers, April 2013, 180; WTO, Trade Policy Review: Japan, February 21, 2013, 87–88.
154

by Japan Post Insurance until it determined that equivalent conditions of competition exist between Japan Post and private insurance companies.530
Agriculture Products Japan banned imports of U.S. beef in December 2003 due to concerns about BSE, following years in which Japan was the largest export market for U.S. beef.531 The ban was adjusted in July 2006 to exclude cuts from cattle older than 20 months of age; nevertheless, the restrictions effectively banned most of the high-quality beef that U.S. exporters had traditionally shipped to Japan.532 Discussions between officials in Japan and the United States continued after this time, culminating in a bilateral meeting between President Obama and then-Prime Minister Yoshihiko Noda on the sidelines of the 2011 APEC Leaders’ Meeting, after which the Japanese Prime Minister announced that Japan would review current restrictions on U.S. beef imports.533
Between December 2011 and October 2012, Japan’s independent Food Safety Commission conducted a risk assessment on raising the age limit of cattle that can be used to supply U.S. beef products for export to Japan.534 The United States and Japan agreed to expand U.S. beef exports to Japan in January 2013, with Japan permitting beef from cattle less than 30 months of age and revising other restrictive standards for U.S. beef exports. In addition, the two governments agreed to hold both regular and ad hoc consultations to review progress under the agreement to address any issues that may arise. Japan further confirmed that an ongoing Food Safety Commission risk assessment is considering raising the age limit above 30 months for beef from the United States.535 The United States continued to press Japan for full market access for beef from animals of all ages.536
The U.S. and Japanese governments also engaged in other productive discussions covering agricultural market access issues. In September 2013, the United States and Japan announced the United States-Japan Organic Equivalency Arrangement. This bilateral agreement allows products certified as organic in Japan or in the United States to be sold as organic in either country without the need to obtain separate certifications in each country.537 Also during 2013, the U.S. government expressed concerns over Japan’s Wood Use Points Program (WUPP), an incentive program designed to encourage Japanese homeowners and builders to use local wood species. As a result of a petitioning effort by the U.S. Embassy, the Softwood Export Council, and American academic institutions, Japan’s National Land Afforestation Promotion
530 USTR, “Toward the Trans-Pacific Partnership,” April 12, 2013. 531 USITC, Year in Trade 2010, 2011, 5-16. 532 USTR, “U.S. Trade Representative Ron Kirk and Agriculture Secretary Tom Vilsack,” January 2013; USITC, Year in Trade 2011, 2012, 5-18 to 5-19. 533 White House, “Readout by the Press Secretary on the President’s Meeting,” November 12, 2011. 534 USTR, “U.S. Trade Representative Ron Kirk and Agriculture Secretary Tom Vilsack,” January 2013. 535 Ibid. 536 USTR, 2014 Report on Sanitary and Phytosanitary Measures, March 2014. 537 USTR, 2014 Trade Policy Agenda and 2013 Annual Report, March 2014, Annex III; USTR, “United States and Japan Streamline Organic Trade,” September 26, 2013.
155

Organization approved inclusion of U.S. Douglas fir as an eligible species under the WUPP program in December 2013.538
U.S. officials continued to work with their Japanese counterparts to resolve SPS restrictions in the Japanese market involving food additives, gelatin and collagen, poultry, and potatoes. In a development affecting a variety of U.S. agricultural exports, Japan changed its risk assessments of fungicides into a single, streamlined process and allowed U.S. agrochemical companies submitting registration applications with the U.S. Environmental Protection Agency to simultaneously apply for import tolerances in Japan.539
Republic of Korea The Republic of Korea (Korea) was the United States’ sixth-largest single-country trading partner in 2013. Two-way merchandise trade was valued at $101.0 billion in 2013, accounting for 2.8 percent of U.S. trade with the world. The United States recorded a $23.0 billion merchandise trade deficit with Korea in 2013, or 28.5 percent higher than in 2012 (figure 5.11). The U.S. trade surplus in services with Korea increased by over $2 billion, or by nearly 28 percent, to $11.1 billion in 2013 (figure 5.12).
U.S. merchandise exports to Korea were valued at $39.0 billion in 2013, a decrease of 2.5 percent from 2012. Leading U.S. exports to Korea during the year included aircraft, spacecraft, and parts, valued at $2.6 billion; processors or controllers, valued at $2.4 billion; and machines for the production of semiconductor devices or electronic integrated circuits, valued at $1.2 billion. Other leading U.S. exports in 2013 were ferrous waste and scrap, medicaments, and coal. Of the top five exports to Korea, growth in value occurred in processors or controllers (21.4 percent) and medicaments (25.7 percent). Significant decreases occurred in machines for the manufacture of semiconductor devices or electronic integrated circuits and ferrous waste and scrap (32.4 percent and 20.3 percent, respectively). The value of the top U.S. export—aircraft, spacecraft, and parts—after jumping nearly 40 percent from 2011 to 2012, fell by 0.6 percent from 2012 to 2013.
U.S. merchandise imports from Korea totaled $62.0 billion in 2013, an increase of 7.1 percent from 2012. Some of the top products imported from Korea saw significant gains, including motor vehicles, cellphones, and parts for automatic data processing machines. Though imports of cellphones have not recovered to 2011 levels and declined 40.9 percent from 2011 to 2012, they increased more than 30 percent from 2012 to nearly $6 billion in 2013. Imports of passenger vehicles with cylinder capacity between 1,000 cc and 1,500 cc increased in value by 517 percent from 2012. Few of the top imports experienced significant decreases in value from 2012, with the exception of car tires, mechanical shovels, and seamed pipe. U.S.-Korea merchandise trade data are shown in appendix tables A.42 through A.44.
538 USTR, 2014 Trade Policy Agenda and 2013 Annual Report, March 2014, 20; SEFS, “CINTRAFOR Scores Major Victory for Pacific Northwest,” January 15, 2014. 539 USTR, 2014 Report on Sanitary and Phytosanitary Measures, March 2014, 60–64.
156

Figure 5.11 U.S. merchandise trade with Korea, 2009–13
Source: Official trade statistics of the USDOC as maintained by USITC.
Figure 5.12 U.S. private services trade with Korea, 2009-13a
Source: Official trade statistics of the USDOC as maintained by USITC. aData for 2013 are preliminary.
-30-20-10
010203040506070
2009 2010 2011 2012 2013
Billi
on $
Exports Imports Trade balance
0
5
10
15
20
25
2009 2010 2011 2012 2013
Billi
on $
Exports Imports Trade balance
157

Korea was the United States’ 10th-largest single-country trading partner in services in 2013. U.S. services exports to Korea increased 13.5 percent from 2012 to reach $20.5 billion in 2013, while U.S. services imports from Korea remained relatively unchanged from 2012 levels at just over $9 billion.
The U.S.-Korea FTA (KORUS) entered its second year of implementation in 2013. Korea expressed interest in joining the TPP in November 2013, and its inclusion, at the appropriate time, was welcomed by USTR.540 After requesting consultations through the WTO in August, Korea and the United States held consultations on antidumping and countervailing duty measures imposed on large residential washers from Korea in October. In December, Korea requested the establishment of a WTO dispute resolution body panel to address this matter.541
U.S.-Korea FTA The KORUS FTA entered into force on March 15, 2012. The agreement ends tariffs on over 95 percent of U.S. exports of industrial and consumer goods by 2016.542 The second round of tariff cuts under the KORUS FTA occurred on January 1, 2013. Through a combination of tariff elimination and expansion of tariff-rate quotas, nearly two-thirds of U.S. agricultural exports to Korea are now eligible for duty-free treatment.543
On October 5, the second meeting of the KORUS FTA Joint Committee was held on the margins of the APEC ministerial in Bali, Indonesia. The Joint Committee is the premier committee under the FTA, responsible for supervising its implementation, coordinating the work of its other committees, and resolving issues that may arise. The two parties discussed origin verification, financial services, and automotive issues, and also updated each other on free trade agreements and regional trade agreements that were being negotiated.544 A Senior Officials Meeting was held on November 17, 2013, to follow up on the topics discussed in the October meeting and report on the FTA committees and working groups.545
In 2013, 12 of the 19 FTA committees and working groups held meetings. Among these were the Environmental Affairs Council, the Committee on Sanitary and Phytosanitary Matters, the Labor Affairs Council, the Professional Services Working Group, the Fisheries Committee, the Committee on Technical Barriers to Trade, the Automotive Working Group, the Working Group on Small and Medium Sized Enterprises, the Committee on Trade in Goods, and the Medicines and Medical Devices Committee.546 The Labor Affairs Council held its first meeting on March
540 USTR, “Statement by U.S. Trade Representative Michael Froman on Korea’s Announcement,” November 29, 2013. 541 WTO,“Dispute Settlement: DS464; United States—Anti-dumping and Countervailing Measures on Large Residential Washers from Korea” (accessed April 9, 2014); USTR, 2014 Trade Policy Agenda and 2013 Annual Report, March 3, 2014, 96–97. 542 USTR, “U.S.-Korea Free Trade Agreement Shows Strong Results,” March 12, 2014. 543 USTR, 2014 National Trade Estimate Report on Foreign Trade Barriers, March 2014, 208. 544 USTR, “Readout of the Second Meeting,” October 18, 2013; USTR, 2014 Trade Policy Agenda and 2013 Annual Report, March 2014, 127. 545 USTR, “Readout of the Second Meeting,” October 18, 2013. 546 Ibid.
158

18–19, 2013, in Washington, DC. Participants reaffirmed commitments under the Labor Chapter and discussed specific priority areas to address, which included information sharing on employment and labor statistics and collaboration on global supply chain issues.547
Beef Until 2008, the Korean market had been closed to imports of U.S. beef for several years. In 2008, the United States and Korea reached an agreement under which Korea would reopen its markets fully to U.S. beef and beef products. As a result of a voluntary commercial understanding, the United States may export beef from animals less than 30 months of age to Korea until Korean consumer confidence improves. Additionally, under KORUS, Korea has agreed to eliminate its 40 percent tariff on beef over a period of 15 years. In 2013, Korea was the fifth-largest export market for U.S. beef.548
Brazil In 2013, Brazil was the United States’ ninth-largest single-country trading partner. Brazil is also the United States’ second-largest Latin American trading partner and its largest South American trading partner. Two-way merchandise trade between the United States and Brazil shrank 6.5 percent to $64.5 billion in 2013, accounting for 1.8 percent of total U.S. trade with the world. The decline in two-way trade was a result of a decrease in U.S. imports from Brazil, as U.S. exports to Brazil increased very slightly from 2012 levels. After a steady increase in the merchandise trade balance from 2009 to 2011, the United States’ 2012 trade surplus fell by nearly 20 percent from 2010 and 2011 levels. In 2013, however, the U.S. trade surplus with Brazil recovered and surpassed 2010 and 2011 levels, reaching $10.8 billion, or a striking 94.6 percent increase from 2012 (figure 5.13). Brazil was the United States’ eighth-largest single-country two-way trading partner in services. The U.S. trade surplus in services trade with Brazil rose by 2.8 percent in 2013, reaching $17.5 billion (figure 5.14).
Leading U.S. exports to Brazil included aircraft and parts, petroleum-related oils and refined petroleum products, wheat, coal, light oils and preparations, medicaments, and propane. In 2013, exports of U.S. wheat to Brazil jumped over 9,000 percent from 2012 levels, reaching a value of $1.2 billion, the highest level in 30 years.549 This increase was a result of a poor crop in Argentina caused by bad weather and subsequent export restrictions in Argentina, traditionally Brazil’s main supplier of imported wheat. In 2013, Brazil temporarily lowered the 10 percent tariff on wheat from non-Mercosur countries to zero.550 The remaining top five exports to Brazil declined from 2012 levels, though there were increases in the other leading exports, including propane and insecticides.
547 Department of Labor, “Joint Statement of the Labor Affairs Council,” March 19, 2013. 548 USTR, 2014 National Trade Estimate Report on Foreign Trade Barriers, March 2014, 208–9. 549 USDA, FAS, “Brazil: U.S. Wheat Exports to Brazil,” February 19, 2014. 550 USDA, FAS, “Brazil: Grain and Feed Update,” January 23, 2014. Mercosur (or Mercosul, in Portuguese) is a South American common market agreement among Argentina, Brazil, Paraguay, Uruguay, and Venezuela. Bolivia, Chile, Colombia, Ecuador, Guyana, Peru, and Suriname are associate members.
159

Figure 5.13 U.S. merchandise trade with Brazil, 2009–13
Source: Official trade statistics of the USDOC as maintained by USITC.
Figure 5.14 U.S. private services trade with Brazil, 2009-13a
Source: Official trade statistics of the USDOC as maintained by USITC. aData for 2013 are preliminary.
0
5
10
15
20
25
30
35
40
2009 2010 2011 2012 2013
Billi
on $
Exports Imports Trade balance
0
5
10
15
20
25
30
2009 2010 2011 2012 2013
Billi
on $
Exports Imports Trade balance
160

U.S. imports from Brazil decreased in value by over 15.3 percent from 2012, falling to $26.9 billion in 2013. Over half of the nearly $5 billion decrease in imports from Brazil is a result of the 50.5 percent decline in value of U.S. imports of crude petroleum from Brazil, which reflected a 42.3 percent decline in the quantity of crude petroleum imported from Brazil.551 Other leading imports that decreased in value include semifinished iron products, petroleum oils, ethyl alcohol, unroasted coffee, and non-alloy pig iron. U.S. imports from Brazil that increased from 2012 levels included aircraft, wood pulp, granite, and tobacco. U.S.-Brazil merchandise trade data are shown in appendix tables A.45 through A.47.
A number of developments in 2013 affected economic relations between the United States and Brazil. The October 2012 temporary tariff increases on 100 products imposed on imports from non-Mercosur countries expired in November 2013, and the Brazilian government announced that it did not intend to extend those tariffs or impose new tariff increases.552 In December 2013, USDA and the Brazil Ministry of Agriculture released a joint statement indicating that the two agencies had agreed on a path towards amending rules that limit bilateral beef trade.553 In February 2013, the United States and Brazil informed the WTO DSB of a mutually satisfactory solution to a dispute regarding antidumping duties the United States had imposed on imported orange juice from Brazil.554 In September 2013, the amount of the monthly settlement payment to the Brazilian cotton fund resulting from a WTO dispute with Brazil on upland cotton was halved.555
Agreement on Trade and Economic Cooperation The United States and Brazil held the second meeting of the Commission on Economic and Trade Relations under the United States-Brazil Agreement on Trade and Economic Cooperation in September 2013 in Brazil. The parties discussed trade and investment issues, including increased cooperation on investment; innovation; and small, medium-sized, and micro enterprises, as well as regulatory cooperation, market access, and procurement issues at this meeting.556 The parties also agreed to hold a third meeting in Washington, DC, in 2014.
Taiwan In 2013, the United States reported $60.8 billion in two-way merchandise trade with Taiwan, a modest increase of 0.4 percent over 2012 trade of $60.6 billion. Taiwan remained the 11th-largest single-economy trading partner with the United States in 2013, accounting for 1.7 percent of total U.S. trade with the world. In 2013, U.S. exports to Taiwan increased, while U.S.
551 USEIA, official statistics (accessed April 21, 2014). 552 USTR, 2014 National Trade Estimate Report, March 2014, 33. 553 USDA, “Joint Statement on U.S.-Brazil Beef Trade,” December 18, 2013. 554 WTO, “Dispute Settlement: DS 382; “Administrative Reviews and Other Measures Related to Imports of Certain Orange Juice from Brazil” (accessed April 17, 2014). 555 Inside U.S. Trade, “U.S. Cuts Cotton Payment,” October 1, 2013. For more information, see USITC, The Year in Trade 2012, July 2013, 5-21. 556 USTR, “United States and Brazil Hold Second Meeting,” September 13, 2013.
161

imports from Taiwan declined slightly compared to the 2012 level. As a result, the United States’ bilateral trade deficit with Taiwan fell by 15.5 percent, from $16.9 billion in 2012 to $14.3 billion in 2013 (figure 5.15). On the other hand, the U.S. services trade surplus with Taiwan increased 1.0 percent, from $3.9 billion in 2012 to $4.0 billion in 2013 (figure 5.16).
U.S. merchandise exports to Taiwan amounted to $23.3 billion in 2013, a 6.6 percent increase from $21.8 billion in 2012. Machines and instruments related to semiconductor manufacturing remained the leading U.S. exports to Taiwan, increasing 21.2 percent from 2012 and accounting for $2.3 billion, or 10.1 percent, of 2013 merchandise exports. Other leading U.S. exports to Taiwan in 2013 were ferrous waste and scrap, aircraft and parts, light oils, soybeans, and military weapons and munitions. The increase in U.S. merchandise exports to Taiwan was mostly attributable to dramatic increases in two categories. U.S. exports of military weapons and munitions grew over 2,500 percent, from $21.6 million in 2012 to $564.1 million in 2013, while U.S. exports of light oils grew 154.0 percent, from $352.1 million in 2012 to $894.4 million in 2013.
U.S. merchandise imports from Taiwan amounted to $37.5 billion in 2013, a 3.1 percent decrease from $38.7 billion in 2012. Leading U.S. imports by value were cellphones, data processing machines, memory chips, electronic integrated circuits, processors, and radio navigational aid apparatus (GPS devices). Although cellphone imports fell 63.5 percent in 2012 and 25.4 percent in 2013, they remained the leading U.S. merchandise import from Taiwan. U.S. imports of GPS devices and reception apparatus for television also fell 41.4 percent and 44.1 percent in 2013, respectively. On the other hand, U.S. imports of memory chips and photosensitive semiconductor devices increased 32.0 percent and 32.9 percent in 2013, to $1.4 billion and $0.6 billion, respectively. U.S.-Taiwan merchandise trade data are shown in appendix tables A.48 through A.50.
In 2013, U.S.-Taiwan trade relations focused on the resumption of the high-level meetings under the U.S.-Taiwan Trade and Investment Framework Agreement (TIFA), Taiwan’s import ban on U.S. beef and beef products, Taiwan’s TRQ system for rice imports, and its inconsistent grading practice, which has affected imports of U.S. rice.
U.S.-Taiwan Trade and Investment Framework Agreement The U.S.-Taiwan Trade and Investment Framework Agreement (TIFA), signed in 1994, has served as a key mechanism to strengthen bilateral commercial ties between the United States and Taiwan, and covers a broad range of trade and investment issues important to U.S. and Taiwan stakeholders.557 High-level meetings under the TIFA were to take place on an annual basis. However, the talks were suspended in 2007 due to a dispute over Taiwan’s restrictions on imports of U.S. beef. In light of positive developments in the U.S.-Taiwan beef issue in 2012 (see
557 USTR, “United States and Taiwan Enhance Trade Ties,” April, 2014. 162

Figure 5.15 U.S. merchandise trade with Taiwan, 2009–13
Source: Official trade statistics of the USDOC as maintained by USITC.
Figure 5.16 U.S. private services trade with Taiwan, 2009-13a
Source: Official trade statistics of the USDOC as maintained by USITC. aData for 2013 are preliminary.
-30
-20
-10
0
10
20
30
40
50
2009 2010 2011 2012 2013
Billi
on $
Exports Imports Trade balance
0
2
4
6
8
10
12
14
2009 2010 2011 2012 2013
Billi
on $
Exports Imports Trade balance
163

section below), the United States and Taiwan resumed the TIFA talks in March 2013.558 The outcome of the March meeting included the establishment of two working groups on investment and technical barriers to trade, as well as joint statements on principles for information and communications technology (ICT) services and investment.559 Additionally, a joint working group on SPS and agricultural standards, led by the USDA’s Animal and Plant Health Inspection Service (APHIS) and the U.S. Environmental Protection Agency, met to discuss agricultural trade issues in December 2013.560
Beef and Beef Products In September 2012, Taiwan authorities implemented a maximum residue limit (MRL) for ractopamine in beef, an important milestone in the U.S.-Taiwan trade dispute over beef and beef products. As noted earlier in the China section, ractopamine is a veterinary drug used in animal feed to promote muscle growth in pigs, cattle, and, to a limited extent, heavy turkeys. It was approved for use in cattle by the U.S. Food and Drug Administration in 2003.561 Following the implementation of the MRL measure, U.S. beef exports to Taiwan nearly doubled, from $128.1 million in 2012 to $254.2 million in 2013.562 However, in 2013 Taiwan had not established a MRL for ractopamine in pork, which continued to disrupt U.S. exports of pork to Taiwan.563
Taiwan banned imports of U.S. beef and beef products following the detection of BSE in the United States in 2003. In 2009, the United States and Taiwan reached an agreement on a bilateral protocol defining the conditions for the exportation of U.S. beef and beef products to Taiwan. However, in 2013, USTR continued to note that Taiwan has failed to comply fully with the protocol and provide full market access for U.S. beef and beef products.564
Rice Upon accession to the WTO in 2002, Taiwan committed to lifting its ban on rice imports and opened an import quota of 144,720 metric tons (mt) on a brown rice basis under a “special treatment” regime. Subsequently, Taiwan adopted a complex TRQ system for rice imports that includes a ceiling price mechanism and a country-specific quota (CSQ) regime. Taiwan's annual rice TRQ is divided into two portions: 35 percent, or 50,652 mt, for private sector imports, and 65 percent, or 94,068 mt, for public sector imports. The amount allocated to public sector imports is divided by country of origin and tender type. The U.S. quota accounted for the largest share of the public sector import quota at 64,634 mt.565
558 USTR, “Deputy U.S. Trade Representative Demetrios Marantis,” March 10, 2013. 559 USTR, 2014 Trade Policy Agenda and 2013 Annual Report, March 2013, 146. 560 Ibid. 561 FAO, “Discussion on Ractopamine in Codex,” April 26, 2012; USTR, 2011 Report on Sanitary and Phytosanitary Measures, March 2011, 24. 562 USITC DataWeb/USDOC (accessed March 11, 2014). 563 USTR, 2014 Trade Policy Agenda and 2013 Annual Report, March 2014, 146. 564 Ibid., 147. 565 USTR, 2014 National Trade Estimate Report, March, 2014, 320.
164

In 2007 and 2008, Taiwan rejected all bids for U.S. rice under the CSQ, arguing that U.S. prices were high and exceeded Taiwan's ceiling price. U.S. exporters raised concerns that Taiwan’s ceiling price mechanism, which is not transparent, had arbitrarily set prices lower than the levels bid by U.S. exporters, causing their bids to fail. The United States has continued to urge Taiwan to fill the 2007 and 2008 shortfalls (approximately 80,000 mt on a brown rice basis), but Taiwan authorities have not agreed.566 According to USTR, Taiwan fully met its obligations to purchase U.S. rice for the years 2009–12.567 As of March 2014, however, Taiwan had yet to fulfill 2013 purchase obligations under the U.S. CSQ, with a potential shortfall of 3,000 mt to 5,000 mt.568
In 2013, the United States also continued to engage Taiwan on issues related to Taiwan’s inconsistent grading practice for imports of U.S. rice under the U.S. CSQ. Discrepancies increased between the grades that U.S. rice received as it was leaving the United States and those it received as it arrived in Taiwan, which resulted in U.S. rice failing grade inspections on arrival in Taiwan. To remedy this, the United States worked with Taiwan’s Agriculture and Food Agency as well as Taiwan’s Council on Agriculture in May 2013 to establish standardized grading mechanisms between the two economies.569
India In 2013, India remained the 12th-largest single-country U.S. trading partner. U.S.-India two-way merchandise trade was valued at $58.4 billion, accounting for 1.6 percent of U.S. merchandise trade with the world. U.S. imports of goods from India grew to $41.5 billion as U.S. exports to India declined to $16.9 billion, resulting in an increase in the U.S. merchandise trade deficit with India from $21.1 billion in 2012 to $24.5 billion in 2013 (figure 5.17).
The United States also registered a services trade deficit with India—its only deficit in services with any major trading partner in 2013. However, the services deficit, which amounted to $6.0 billion in 2013, fell by 9.5 percent from $6.6 billion in 2012. Although U.S. imports of Indian services increased from $18.5 billion in 2012 to $18.8 billion in 2013, U.S. exports of services to India increased from $11.9 billion in 2012 to $12.8 billion in 2013 (figure 5.18).
India was the 19th-largest single-country destination for U.S. merchandise exports in 2013, down from 18th in 2012. U.S. merchandise exports to India decreased by 10.9 percent, from $19.0 billion in 2012 to $16.9 billion in 2013. Leading U.S. exports to India included aircraft and parts; nonmonetary gold; aircraft; certain petroleum products used to manufacture tires; coal; and almonds. The decline in exports to India was the net effect of widely varying growth trends in underlying products. Exports of most major raw material products, including nonmonetary gold, coal, and nonindustrial diamonds, as well as certain chemical products, such as diammonium phosphate, experienced major declines. Other large sectors, such as aircraft and parts and certain petroleum products, experienced significant export growth.
566 Ibid. 567 Ibid., 346. 568 Ibid., 320. 569 USTR, 2014 Trade Policy Agenda and 2013 Annual Report, March, 2014, 147.
165

Figure 5.17 U.S. merchandise trade with India, 2009–13
Source: Official trade statistics of the USDOC as maintained by USITC.
Figure 5.18 U.S. private services trade with India, 2009-13a
Source: Official trade statistics of the USDOC as maintained by USITC. aData for 2013 are preliminary.
-30
-20
-10
0
10
20
30
40
50
2009 2010 2011 2012 2013
Billi
on $
Exports Imports Trade balance
-10
-5
0
5
10
15
20
25
2009 2010 2011 2012 2013
Billi
on $
Exports Imports Trade balance
166

India remained the 10th-largest single-country source of U.S. merchandise imports in 2013. U.S. imports from India amounted to $41.5 billion in 2013, representing a 3.4 percent increase from $40.1 billion in 2012. Leading U.S. imports from India were nonindustrial diamonds, certain medicaments (medicines), light oils and preparations, mucilages and thickeners, and jewelry. The overall growth in imports from India was driven by substantial growth in certain major sectors like nonindustrial diamonds (which grew by $2.0 billion), light oils and preparations, frozen shrimp, and crude petroleum. At the same time, imports of mucilages and thickeners fell by $1.8 billion, and some imports of lesser value, such as certain tractors and cotton T-shirts, also declined. U.S.-India merchandise trade data are shown in appendix tables A.51 through A.53.
During 2013, the United States and India continued discussions of diverse bilateral trade and investment issues through multilateral forums, direct high-level contact, and negotiations toward a bilateral investment treaty (BIT). U.S. policymakers engaged the government of India on several issues that continue to pose challenges in the trade relationship, including localization and testing requirements and issues related to the protection of IPR. The United States continued with WTO dispute settlement proceedings regarding India’s maintenance of nontariff barriers on U.S. exports of various agricultural products, including poultry and chicken eggs.570 The United States also initiated WTO dispute settlement consultations regarding India’s national solar policy and its preferential treatment of domestically produced solar cells and modules.
Trade and Investment Dialogue While the U.S.-India Trade Policy Forum, created in 2005, remains the formal platform for bilateral trade, investment, and economic dialogue between the two countries, the United States and India have not held a meeting of the forum since 2010.571 However, the U.S.-India trade and investment dialogue continued through a variety of other forums in 2013, including during Prime Minister Manmohan Singh’s visit to Washington in September 2013, in which President Obama addressed Indian manufacturing and IPR policies.572 USTR Froman and the Indian Minister of Commerce and Industry, Anand Sharma, met several times during the year. They discussed the need for a continuation of sustained and substantive dialogue under the U.S.-India Trade Policy Forum to address trade and investment issues such as India’s localization barriers to trade, copyright and patent protection, and green technology (all discussed below).573 In addition, the United States and India continued negotiations toward a BIT. These negotiations resumed in 2012 following the release of a new U.S. model BIT, which forms the basis for the way U.S. policymakers are negotiating BITs going forward.574 This version enhances
570 USTR, 2014 Report on Sanitary and Phytosanitary Measures, March 2014, 57-58. 571 USTR, “United States and India Hold Seventh Trade Policy Forum,” September 21, 2010. 572 USTR, 2014 Trade Policy Agenda and 2013 Annual Report, March 2013, 153. 573 USTR, “Readout of the Meeting,” July 11, 2013. 574 USTR, 2014 Trade Policy Agenda and 2013 Annual Report, March 2013, 153.
167

the 2004 model BIT by promoting transparency, strengthening labor rights and environmental protections, and adding provisions for state-led economies.575
Electronic Goods The United States remained concerned about a possible expansion of India’s National Manufacturing Policy affecting U.S. exports of electronic goods in 2013. Announced in November 2011, the policy calls for greater local-content requirements in certain key sectors, such as ICT and clean energy.576 India pursued these goals by issuing the Preferential Market Access notification in February 2012, which required government entities and private firms to meet their needs for electronic products, such as telecommunications and certain computer equipment, in part by purchasing domestically produced goods. India revised this policy in December 2013 after significant engagement with U.S. officials and industry members, and these requirements now pertain exclusively to government procurement.577
India maintains various security and safety regulations concerning electronic goods. India planned to institute a requirement that telecommunications equipment vendors test all imported ICT equipment in Indian laboratories beginning in July 2014.578 Indian policymakers also worked to implement a September 2012 order that mandates compulsory registration with Indian laboratories for 15 categories of imported electronic and IT goods, even if those products are fully certified in internationally recognized laboratories. This policy was originally set to take effect in April 2013, but entry into force was delayed until January 2014.579 U.S. exporters of ICT equipment report that they incur significant expenses during the testing phase, struggle to find Indian labs that are capable of testing the equipment, and are forced to leave their products in labs for extended periods of time.580 USTR continued to work with Indian officials on these testing requirements both bilaterally and at the WTO Technical Barriers to Trade (TBT) Committee in 2013, including pushing for delays to implementation of the burdensome Indian policies.581
Solar Equipment Another concern for U.S. policymakers in 2013 was the expansion of local-content requirements for Indian developers of solar power-generating projects under the Jawaharlal Nehru National Solar Mission (JNNSM), India’s national solar policy. Launched in 2010, this policy sets the goal of developing 20,000 megawatts of grid-connected solar power by 2022 through large-scale deployment goals, research and development, and local production of power-generating equipment. The JNNSM is scheduled to take place over three phases, with
575 USDOS, “Model BIT Fact Sheet,” April 20, 2012. 576 USTR, 2014 Section 1377 Review, April 2014, 19. 577 Ibid., 19-20; USTR, 2014 Report on Technical Barriers to Trade, April 2014, 80–81. 578 USTR, 2014 National Trade Estimate Report, March 2014, 150–151. 579 USTR, 2014 Report on Technical Barriers to Trade, April 2014, 81; USTR, “2013 Year in Review,” January 3, 2014. 580 Shapiro, Garfield, and Seiffert, letter to Penny S. Pritzker, Michael B. Froman, and Caroline Atkinson, September 23, 2013. 581 USTR, 2014 Report on Technical Barriers to Trade, April 2014, 81; USTR, “2013 Year in Review,” January 3, 2014.
168

the first phase ending in 2013 and the second phase extending through 2017.582 Phase 1, which was split into two batches, required domestic sourcing for crystalline silicon (c-Si) photovoltaic modules for the first batch, while domestic sourcing requirements for the second batch applied to both c-Si modules and c-Si cells.583
In February 2013, the United States requested WTO dispute settlement consultations with India concerning local-content requirements in Phase 1.584 In October 2013, India issued guidelines for the first set of projects under phase 2 of the JNNSM: one group of projects would be required to use only domestic sources for c-Si cells and modules as well as thin-film modules, while another group had no restrictions on origins of cells and modules.585
Intellectual Property Rights India has been on USTR’s Priority Watch List or designated a priority foreign country— designations reserved for countries with significant IPR problems—since 1989,586 and it was still on the Priority Watch List as of May 2013.587 USTR’s 2013 Special Report noted concerns with patents and regulatory data protection, copyright protections, IPR enforcement, and localization requirements.588
USTR reported that in the pharmaceutical sector some innovative firms were facing serious challenges securing and enforcing patents. For example, USTR cited a 2013 decision by the Indian Supreme Court (upholding the denial of a patent for Novartis’s leukemia drug Glivec), which appeared to confirm that India’s law imposes an additional requirement for obtaining patents for certain chemical forms.589 A March 2013 decision by the Indian Intellectual Property Appellate Board to uphold a compulsory license for Bayer’s cancer drug Nexavar, which granted an Indian generic drug manufacturer the right to produce the drug at a reduced royalty rate, also raised substantial concerns among multinational pharmaceutical companies.590
USTR further noted in the 2013 Special 301 Report that both physical and online piracy remained significant problems for creative and software industries in India. In May 2012, India passed the Copyright (Amendment) Act, with the goal of bringing the copyright law into
582 Government of India, Ministry of New and Renewable Energy, Jawaharlal Nehru National Solar Mission: Towards Building SOLAR INDIA (accessed April 6, 2014). 583 USTR, “United States Challenges India’s Restrictions on U.S. Solar Exports,” February 2013. India also instituted a local-content requirement of 30 percent for concentrated solar power projects during Phase 1. Government of India, Ministry of New and Renewable Energy, Jawaharlal Nehru National Solar Mission: Guidelines, July 2010; Government of India, Ministry of New and Renewable Energy, Jawaharlal Nehru National Solar Mission: Guidelines, August 2011. 584 USTR, “United States Challenges India’s Restrictions on U.S. Solar Exports,” February 2013. 585 USTR, 2014 National Trade Estimate Report, March 2014, 153. In February 2014, the United States requested WTO dispute settlement consultations with India concerning the domestic content requirements in Phase 2 of the JNNSM. USTR, “Remarks by USTR Michael Froman,” February 20, 2014. 586 International Intellectual Property Alliance, “Chart of Countries’ Special 301 Placement,” February 8, 2013. 587 USTR, 2013 Special 301 Report, May 2013, 38–40. 588 Ibid. 589 Ibid. 590 See Chatterjee, “India’s First Compulsory Licence Upheld,” March 4, 2013.
169

compliance with the World Intellectual Property Organization (WIPO) Internet Treaties, which protect digital works and works distributed over the Internet. While acknowledging improvements made under this law, USTR found that questions remained regarding the scope of exclusive rights under Indian law and the ability of rights holders to properly exercise those rights.591 USTR recommended additional legislation, such as an anti-camcording law, to help content-based industries effectively combat physical and online piracy.592 In the 2013 Special 301 Out-of-Cycle Review of Notorious Markets Report, USTR also identified several Indian physical marketplaces in New Delhi, Mumbai, and Hyderabad that provide widespread distribution of counterfeit media such as CDs, DVDs, and video games.593
591 Ibid. 592 Ibid. 593 USTR, 2013 Out-of-Cycle Review of Notorious Markets, February 12, 2014, 16. The localization concerns raised by USTR are addressed above in the sections on Electronic Goods and Solar Equipment.
170

Bibliography Abbot, Frederick M. “Inside Views: The Judgment in Novartis v. India: What the Supreme Court
of India Said.” Intellectual Property Watch, April 4, 2013. http://www.ip-watch.org/2013/04/04/the-judgment-in-novartis-v-india-what-the-supreme-court-of-india-said/.
Asia-Pacific Economic Cooperation (APEC). 21st APEC Economic Leaders’ Meeting: Supporting the Multilateral Trading System and the 9th Ministerial Conference of the World Trade Organization. Bali, Indonesia: APEC, October 8, 2013. http://www.apec.org/Meeting-Papers/Leaders-Declarations/2013/2013_aelm/2013_aelm_mts.aspx.
———.21st APEC Economic Leaders’ Meeting: The Bali Declaration; Resilient Asia-Pacific, Engine of Global Growth. Bali, Indonesia: APEC, October 8, 2013. http://publications.apec.org/publication-detail.php?pub_id=1471.
———. 25th APEC Ministerial Meeting: Joint Statement. Bali, Indonesia: APEC, October 5, 2013. http://publications.apec.org/publication-detail.php?pub_id=1471.
———. The Report on APEC’s 2010 Economies’ Progress towards the Bogor Goals, 2010. http://www.apec.org/About-Us/About-APEC/Achievements-and-Benefits/2010-Bogor-Goals.aspx.
Asia-Pacific Economic Cooperation (APEC). Committee on Trade and Investment (CTI). 2011 CTI Annual Report to Ministers. APEC#211-CT-01.5. Honolulu: APEC, November, 2011. http://publications.apec.org/publication-detail.php?pub_id=1209.
———. Annual Report to Ministers: 2013. APEC#213-CT-01.10. Bali: APEC, October 2013. http://publications.apec.org/publication-detail.php?pub_id=1457.
Asia-Pacific Economic Cooperation (APEC). Policy Support Unit (PSU). APEC’s Bogor Goals Progress Report, August 2012. APEC#212-SE-01.12. Singapore: APEC, August 2012. http://publications.apec.org/publication-detail.php?pub_id=1308.
Asia-Pacific Economic Cooperation (APEC). Secretariat. APEC at a Glance, 2014. APEC#212-SE-05.4. Singapore: APEC, October 2013. http://publications.apec.org/publication-detail.php?pub_id=1451.
———. Outcomes and Outlook 2013–14. APEC#213-SE-05.5. Singapore: APEC, March 2014. http://publications.apec.org/publication-detail.php?pub_id=1508.
Associated Equipment Distributors. “Exports of U.S.-Made Construction Equipment Decline 25 Percent in 2013 to $20 Billion.” AED.News, February 27, 2014. http://www.aednet.org/aednews/index.cfm.
171

Barrie, Leonie. “Haiti: Sae-A Trading on Track to Begin Production.” Just-style.com, September 18, 2012. http://www.just-style.com.
Board of Governors of the Federal Reserve System. “Federal Reserve Issues FOMC Statement.” Press release, June 19, 2013. http://www.federalreserve.gov/newsevents/press/monetary/20130619a.htm.
———. “Foreign Exchange Rates: H.10 Weekly,” n.d. http://www.federalreserve.gov/releases/h10/hist/ (accessed January 8, 2014).
———. “Open Market Operations,” n.d. http://www.federalreserve.gov/monetarypolicy/openmarket.htm (accessed March 12, 2014).
Chatterjee, Patralekha. “India’s First Compulsory Licence Upheld, but Legal Fights Likely to Continue.” Intellectual Property Watch, March 4, 2013. http://www.ip-watch.org/2013/03/04/indias-first-compulsory-licence-upheld-but-legal-fights-likely-to-continue/.
Commission for Environmental Cooperation (CEC). “CEC Ministerial Statement: Twentieth Regular Session of the CEC Council,” July 11, 2013. http://www.cec.org/Page.asp?PageID=122&ContentID=25594&SiteNodeID=219&BL_ExpandID=566.
———. “Part Three: Commission for Environment Cooperation.” Article 14 and Article 15, n.d. http://www.cec.org/Page.asp?PageID=122&ContentID=2732&SiteNodeID=567&BL_ExpandID=#A14 (accessed March 19, 2014).
———. “Submission on Enforcement Matters: Active Submissions,” n.d. http://www.cec.org/Page.asp?PageID=1226&SiteNodeID=544 (accessed March 12, 2014).
———. “Submission on Enforcement Matters,” n.d. http://www.cec.org/Page.asp?PageID=924&SiteNodeID=210 (accessed March 19, 2014).
Commission for Environmental Cooperation (CEC). Secretariat. “Three Countries Working Together,” n.d. http://www.cec.org/Page.asp?PageID=1226&SiteNodeID=206&BL_ExpandID=569 (accessed March 19, 2014).
Commission for Labor Cooperation (CLC). “The National Administrative Offices.” http://www.naalc.org/commission/nao.htm (accessed March 18, 2014).
172

Congressional Research Service (CRS). Japan Joins the Trans-Pacific Partnership: What Are the Implications? by W. Cooper and M. Manyin. CRS Report R42676, August 13, 2013. https://www.fas.org/sgp/crs/row/R42676.pdf.
———. Trade Adjustment Assistance (TAA) and Its Role in U.S. Trade Policy, by J.F. Hornbeck. CRS Report R41922, August 5, 2013. http://www.fas.org/sgp/crs/misc/R41922.pdf.
———. Trade Adjustment Assistance for Farmers, by Remy Jurenas. CRS Report R40206, September 5, 2012. http://www.nationalaglawcenter.org/assets/crs/R40206.pdf.
———. U.S.-Japan Economic Relations: Significance, Prospects, and Policy Options, by William H. Cooper. CRS Report RL32649, February 18, 2014. http://www.fas.org/sgp/crs/row/RL32649.pdf.
Economist Intelligence Unit (EIU). Data Tool database (accessed April 4, 2014).
EU Council of Ministers. “Council Approves Launch of Trade and Investment Negotiations with United States.” Press release, June 14, 2013. http://www.consilium.europa.eu/uedocs/cms_data/docs/pressdata/EN/foraff/137485.pdf.
EU-U.S. High-Level Working Group on Jobs and Growth (HLWG). “Interim Report to Leaders from the Co-Chairs,” June 19, 2012. http://trade.ec.europa.eu/doclib/docs/2012/june/tradoc_149557.pdf.
———. “Final Report,” February 11, 2013. http://www.ustr.gov/about-us/press-office/reports-and-publications/2013/final-report-us-eu-hlwg.
European Commission (EC). “EU and U.S. Conclude First Round of TTIP Negotiations in Washington.” Press release, IP/13/691, July 12, 2013. http://trade.ec.europa.eu/doclib/press/index.cfm?id=941.
———. “EU and U.S. Conclude Second Round of TTIP Negotiations in Brussels.” Press release, November 15, 2013. http://europa.eu/rapid/press-release_IP-13-1091_en.htm.
Executive Office of the President. Office of the Intellectual Property Enforcement Coordinator (IPEC). 2010 Joint Strategic Plan on Intellectual Property Enforcement. Washington, DC: IPEC, June 2010. http://www.whitehouse.gov/sites/default/files/omb/assets/intellectualproperty/intellectualproperty_strategic_plan.pdf.
Federal Reserve Bank of New York (FRBNY). “Treasury and Federal Reserve Foreign Exchange Operations, January–March, 2013.” Quarterly Reports, May 9, 2013. http://www.newyorkfed.org/newsevents/news/markets/2013/fx130509.html.
———. April-June 2013.” Quarterly Reports, August 8, 2013. http://www.newyorkfed.org/newsevents/news/markets/2013/fx130808.html.
173

———. July–September, 2013.” Quarterly Reports, November 14, 2013. http://www.newyorkfed.org/newsevents/news/markets/2013/fx131114.html.
———. October–December 2013.” Quarterly Reports, February 13, 2014. http://www.newyorkfed.org/newsevents/news/markets/2014/fx140213.html.
Food and Agriculture Organization of the United Nations (FAO). “Information Sheet: Discussion on Ractopamine in Codex and in the Joint FAO/WHO Expert Committee on Food Additives (JECFA),” April 26, 2012. http://www.fao.org/fileadmin/user_upload/agns/pdf/Ractopamine_info_sheet_Codex-JECFA_rev_26April2012__2_.pdf.
GAO. See U.S. Government Accountability Office (GAO).
Global Trade Information Service, Inc. (GTIS). Global Trade Atlas database (accessed April 4, 2014).
Glotz, Julia. “Beef Industry Hails Lifting of US Export Ban.” The Grocer, November 4, 2013. http://www.thegrocer.co.uk/fmcg/fresh/beef-industry-hails-lifting-of-15-year-us-export-ban/351247.article.
Government of Australia. Department of Foreign Affairs and Trade (DFAT). “Eighteenth Round of Trans-Pacific Partnership Agreement (TTP) Negotiation.” News release, July 23, 2013. http://www.dfat.gov.au/fta/tpp/130725-tpp-stakeholder-update-18.html.
———. “Trade in Services Agreement (TiSA),” n.d. https://www.dfat.gov.au/trade/negotiations/services/trade-in-services-agreement.html (accessed March 10, 2014).
Government of India. Ministry of New and Renewable Energy (MNRE). Jawaharlal Nehru National Solar Mission: Guidelines for Selection of New Grid Connected Solar Power Projects, July 2010. http://www.mnre.gov.in/file-manager/UserFiles/jnnsm_gridconnected_25072010.pdf.
———. Jawaharlal Nehru National Solar Mission: Guidelines for Selection of New Grid Connected Solar Power Projects, Batch-II, August 2011. http://mnre.gov.in/file-manager/UserFiles/jnnsm_gridconnected_24082011.pdf.
———. Jawaharlal Nehru National Solar Mission: Towards Building SOLAR INDIA, n.d. http://www.mnre.gov.in/solar-mission/jnnsm/mission-document-3/ (accessed April 6, 2014).
Inside U.S. Trade. “U.S. Cuts Cotton Payment, Leading Brazil to Gear Up for Retaliation,” October 1, 2013. http://insidetrade.com/201310012448501/WTO-Daily-News/Daily-News/us-cuts-cotton-payment-leading-brazil-to-gear-up-for-retaliation/menu-id-948.html.
174

———. “U.S. Lifts ‘Mad Cow’ Restrictions on EU Beef, But Other Hurdles Remain,” November 7, 2013.
———. “China Joins ITA Talks; Pushes Back against Expansive Product List,” October 4, 2012. http://insidetrade.com/Inside-US-Trade/Inside-U.S.-Trade-10/05/2012/china-joins-ita-talks-pushes-back-against-expansive-product-list/menu-id-710.html.
———. “China Poses New Roadblock to Concluding ITA Expansion Talks in July,” June 27, 2013. http://insidetrade.com/Inside-US-Trade/Inside-U.S.-Trade-06/28/2013/china-poses-new-roadblock-to-concluding-ita-expansion-talks-in-july/menu-id-710.html.
———. “Focus on TPP, TTIP and TISA; North American Leaders’ Summit,” February 18, 2014. http://insidetrade.com/WTO-Daily-News/This-Week-In-Trade/focus-on-tpp-ttip-and-tisa-north-american-leaders-summit/menu-id-949.html/.
———. “ITA Expansion Negotiators Make Push to Finalize Deal by Mid-July,” June 6, 2013. http://insidetrade.com/Inside-US-Trade/Inside-U.S.-Trade-06/07/2013/ita-expansion-negotiators-make-push-to-finalize-deal-by-mid-july/menu-id-710.html.
———. “ITA Expansion Talks Suspended Again; No Timeline for Resumption Set,” November 21, 2013. http://insidetrade.com/Inside-US-Trade/Inside-U.S.-Trade-11/22/2013/ita-expansion-talks-suspended-again-no-timeline-for-resumption-set/menu-id-710.html.
———. “Slow Restart to ITA Expansion Talks, As China Seeks Long Phaseouts,” October 4, 2013. http://insidetrade.com/Inside-US-Trade/Inside-U.S.-Trade-10/25/2013/slow-restart-to-ita-expansion-talks-as-china-seeks-long-phaseouts/menu-id-710.html.
———. “TISA Negotiators Begin Mode 4 Talks; New Proposals Expected in June,” May 9, 2013. http://insidetrade.com/Inside-US-Trade/Inside-U.S.-Trade-05/10/2013/tisa-negotiators-begin-mode-4-talks-new-proposals-expected-in-june/menu-id-710.html.
———. “U.S. Tables Financial Services TISA Proposal As Round Gets Underway,” February 20, 2014. http://insidetrade.com/Inside-US-Trade/Inside-U.S.-Trade-02/21/2014/us-tables-financial-services-tisa-proposal-as-round-gets-underway/menu-id-710.html.
———. “U.S., Others Suspend ITA Talks to Pressure China to Soften Its Stance,” July 18, 2013. http://insidetrade.com/Inside-US-Trade/Inside-U.S.-Trade-07/19/2013/us-others-suspend-ita-talks-to-pressure-china-to-soften-its-stance/menu-id-710.html.
International Intellectual Property Alliance (IIPA). “Appendix C: Chart of Countries’ Special 301 Placement (1989–2012) and IIPA 2013 Special 301 Recommendations.” International Intellectual Property Alliance 2013 Special 301 Report, February 8, 2013. http://www.iipa.com/pdf/2013SPEC301HISTORICALCHART.pdf.
175

International Monetary Fund. World Economic Outlook. Washington, D.C: IMF, April 2014.
Japan External Trade Organization (JETRO). FY2013 Survey on the International Operations of Japanese Firms. Tokyo: JETRO, February 27, 2014. http://www.jetro.go.jp/en/news/releases/20140324533-news/FY2013_Survey_International_Operations_of_Japanese_Firms.pdf.
Japan Post Group. Annual Report 2013. Tokyo: Japan Post Group, July 2013. http://www.japanpost.jp/en/group/disclosure/2013/pdf/all.pdf.
London Court of International Arbitration. “Joint Request for Arbitration---Submitted on Behalf of Canada and the United States of America.” Case No. 81010-B, September 30, 2013. http://www.ustr.gov/sites/default/files/Joint%20Request%20for%20Arbitration.pdf.
Milner, Gordon, Paul McKenzie, Sherry Lin, and Jing Bu. “China’s MIIT Releases Long-Awaited Draft Amended Telecoms Catalogue for Public Comment.” Morrison Foerster, June 13, 2013. http://www.mofo.com/files/Uploads/Images/130613-MIIT-Draft-Catalogue.pdf.
National Foreign Trade Council. “NFTC Releases Cheat Sheet to the WTO Trade Facilitation Agreement.” Press release, December 13, 2013. http://www.nftc.org/default/Publications/Trade_Policy/WTO%20Trade%20Facilitation%20Agreement%20%20Cheat%20Sheet.pdf.
North American Development Bank (NADB). BECC-COCEF Quarterly Status Report, December 31, 2013. http://www.nadb.org/pdfs/FreqUpdates/JointStatusReport.pdf.
———. “Summary of Project Implementation Activities,” December 31, 2013. http://www.nadb.org/pdfs/FreqUpdates/ProjectMatrix.pdf.
North American Free Trade Agreement (NAFTA). Secretariat. “Overview of the Dispute Settlement Provisions,” n.d. https://www.nafta-sec-alena.org/Default.aspx?tabid=93&language=en-US (accessed March 19, 2014)
———. “Status Report of Dispute Settlement Proceedings, NAFTA—Chapter 19 Active Cases,” n.d. https://www.nafta-sec-alena.org/Default.aspx?tabid=94&language=en-US (accessed March 12, 2014).
Organisation for Economic Co-operation and Development (OECD). “Canada.” Economic Outlook. Vol. 2013/2. Paris, OECD: November 2013. http://www.oecd-ilibrary.org/economics/oecd-economic-outlook-volume-2013-issue-2/canada_eco_outlook-v2013-2-10-en.
176

———. “Chair’s Summary––OECD Ministerial Council Meeting (MCM), 29–30 May 2013––It’s All about People: Jobs, Equality and Trust,” n.d. http://www.oecd.org/mcm/chairssummary-oecdministerialcouncilmeetingmcm29-30may2013-itsallaboutpeoplejobsequalityandtrust.htm (accessed March 18, 2014).
———. Interconnected Economies: Benefiting from Global Value Chains—Synthesis Report. Paris: OECD, 2013.
———. “OECD-WTO Database on Trade in Value-Added––FAQs: Background Note,” n.d. http://www.oecd.org/sti/ind/TIVA_FAQ_Final.pdf (accessed January 2, 2014).
———. Secretary-General’s Report to Ministers, 2013. Paris: OECD, 2013.
———. “Statement by the OECD Regarding the Status of the Accession Process with Russia and Co-operation with Ukraine,” March 13, 2014. http://www.oecd.org/russia/statement-by-the-oecd-regarding-the-status-of-the-accession-process-with-russia-and-co-operation-with-ukraine.htm.
Organisation for Economic Co-operation and Development (OECD). Council. “Meeting of the Council at Ministerial Level, 29–30 May 2013––Ministerial Council Statement (Adopted at the Council at Ministerial Level on 30 May 2013,” n.d. http://www.oecd.org/mcm/background/ministerial-meeting-2013-new-approaches-to-economic-challenges-and-prioritising-inclusive-growth.htm (accessed March 18, 2014).
Organisation for Economic Co-operation and Development (OECD). Trade and Agriculture Directorate (TAD). Trade Committee. “161st Session of the Trade Committee: Confidential Session––Draft Agenda––14 May 2013.” TAD/TC/A(2013)1/ANN, April 9, 2013.
———. “161st Session of the Trade Committee: Plenary Session––Draft Agenda––15–16 May 2013.” TAD/TC/A(2013)1, April 11, 2013.
———. “162nd Session of the Trade Committee: Plenary Session––Draft Agenda––5–6 November 2013.” TAD/TC/A(2013)2, October 29, 2013.
———.“Chair’s Highlights: The Recent Activities of the Joint Working Party on Trade and Environment (JWPTE)––14–16 May 2013.” TAD/TC(2013)3, May 10, 2013.
———. “Report to the 161st Session of the Trade Committee: Export Credits––14–16 May 2013.” TAD/TC(2013)4, May 2, 2013.
———. “Summary Record: 161st Session of the Trade Committee––Confidential Session––14 May 2013.” TAD/TC/M(2013)1/ANN, September 5, 2013.
———. “Summary Record: 162nd Session of the Trade Committee––Confidential Session––6 November 2013.” TAD/TC/M(2013)2/ANN, January 31, 2014.
177

———. “Summary Record: 161st Session of the Trade Committee––Plenary Session––15 May 2013.” TAD/TC/M(2013)1, September 5, 2013.
———. “Summary Record: 161st Session of the Trade Committee––Session with the Participation of G20 Members––16 May 2013.” TAD/TC/M(2013)1/ADD, September 5, 2011.
———. “Summary Record: 162nd Session of the Trade Committee––Plenary Session––5 November 2013.” TAD/TC/M(2013)2, January 31, 2014.
Organization of American States (OAS). “OAS-IADB-UNECLAC Tripartite Committee Multilingual dictionary of FTAA trade terms.” SICE (Sistema de Información sobre Comercio Exterior / Foreign Trade Information System), n.d. http://www.sice.oas.org/Dictionary/Dictio_e.asp#Negative_list_approach (accessed March 18, 2014).
Parliament of Canada. “C-8: An Act to Amend the Copyright Act and the Trade-marks Act and To Make Consequential Amendments to Other Acts: Short Title: Combating Counterfeit Products Act.” LEGISinfo database. 41st Parliament, 2nd Session, October 16, 2013–Present. http://www.parl.gc.ca/LEGISinfo/BillDetails.aspx?billId=6266835&Language=E&Mode=1(accessed March 28, 2014).
Shapiro, Gary (Consumer Electronics Association), Dean C. Garfield (Information Technology Industry Council), and Grant Seiffert (Telecommunications Industry Association). Letter to Penny S. Pritzker (Secretary, United States Department of Commerce), Michael B. Froman (U.S. Trade Representative), and Caroline Atkinson (Deputy Assistant to the President and Deputy National Security Advisor for International Economic Affairs), September 23, 2013. http://blog.itic.org/dotAsset/14a42a08-15ac-48fa-9b64-8d2d2ae6c4f9.pdf.
United States-Mexico Regulatory Cooperation Council (HLRCC). “Progress Report to Leaders,” August 15, 2013. http://trade.gov/hlrcc/documents/HLRCC-progress-report-0813.docx.
U.S. Department of Agriculture (USDA). Budget Summary and Annual Performance Plan, FY 2015, n.d. http://www.obpa.usda.gov/budsum/FY15budsum.pdf (accessed March 19, 2014).
———. Budget Summary and Annual Performance Plan, FY 2014, n.d. http://www.obpa.usda.gov/budsum/FY14budsum.pdf (accessed March 19, 2014).
———. Budget Summary and Annual Performance Plan, FY 2013, n.d. http://www.obpa.usda.gov/budsum/FY13budsum.pdf (accessed March 19, 2014).
———. Budget Summary and Annual Performance Plan, FY 2012, n.d. http://www.obpa.usda.gov/budsum/FY12budsum.pdf (accessed March 19, 2014).
178

U.S. Department of Agriculture (USDA). Animal and Plant Health Inspection Service (APHIS). “APHIS Finalizes Bovine Import Regulations in Line with International Animal Health Standards.” News release, November 1, 2013. http://www.usda.gov/wps/portal/usda/usdamediafb?contentid=2013/11/0207.xml&printable=true&contentidonly=true.
U.S. Department of Agriculture (USDA). Economic Research Service (ERS). “Top 15 U.S. Agricultural Export Destinations, by Calendar Year, $U.S. Value,” June 13, 2013. http://www.ers.usda.gov/data-products/foreign-agricultural-trade-of-the-united-states-(fatus)/calendar-year.aspx.
U.S. Department of Agriculture (USDA). Food Safety and Inspection Service (FSIS). “Export Requirements for the People’s Republic of China,” May 8, 2014. http://www.fsis.usda.gov/wps/portal/fsis/topics/international-affairs/exporting-products/export-library-requirements-by-country/Peoples-Republic-of-China.
U.S. Department of Agriculture (USDA). Foreign Agricultural Service (FAS). Brazil Grain and Feed Update: North American Wheat Fills Up Brazilian Warehouses, by Laura J. Geller. GAIN Report Number BR0926, January 23, 2014. http://gain.fas.usda.gov/Recent%20GAIN%20Publications/Grain%20and%20Feed%20Update_Brasilia_Brazil_1-23-2014.pdf.
———. Brazil: U.S. Wheat Exports to Brazil Highest in 30 Years, by Laura J. Geller. GAIN Report Number BR0929, February 19, 2014. http://gain.fas.usda.gov/Recent%20GAIN%20Publications/U.S.%20Wheat%20Exports%20to%20Brazil%20Highest%20in%2030%20Years_Brasilia_Brazil_2-19-2014.pdf.
———. “Joint Statement on U.S.-Brazil Beef Trade.” News release, December 18, 2013. http://www.fas.usda.gov/newsroom/joint-statement-us-brazil-beef-trade.
U.S. Department of Commerce (USDOC). “U.S. Secretary of Commerce Penny Pritzker Attends North American Leaders Summit with President Obama, U.S. Delegation.” Press release, February 19, 2014. http://www.commerce.gov/news/press-releases/2014/02/19/us-secretary-commerce-penny-pritzker-attends-north-american-leaders-s.
———. “Secretary Pritzker Co-Chairs U.S.-Mexico High Level Economic Dialogue and Outlines Future Engagement.” The Commerce Blog, September 20, 2013. http://www.commerce.gov/blog/2013/09/20/secretary-pritzker-co-chairs-us-mexico-high-level-economic-dialogue-and-outlines-fut.
U.S. Department of Commerce (USDOC). Bureau of Economic Analysis (BEA). “A Guide to the U.S. International Transactions Accounts and the U.S. International Investment Position Accounts,” by Christopher L. Bach. Survey of Current Business 90, no. 2 (February 2010): 33–51. http://www.bea.gov/scb/pdf/2010/02%20February/0210_guide.pdf.
179

———. “Gross Domestic Product: Fourth Quarter and Annual 2013 (Second Estimate).” News release, BEA 14-06, February 28, 2014. https://www.bea.gov/newsreleases/national/gdp/2014/pdf/gdp4q13_2nd.pdf.
———. “U.S. International Services: Cross-Border Trade in 2012 and Services Supplied through Affiliates in 2011,” by Alexis Grimm and Charu Sharma. Survey of Current Business 93, no. 10 (October 2013): 25–41. http://www.bea.gov/scb/pdf/2013/10%20October/1013_international_services.pdf.
———. “U.S. International Services: Cross-Border Trade in 2012 and Services Supplied through Affiliates in 2011,” by Alexis Grimm and Charu Sharma. Survey of Current Business 93, no. 10 (October 2013): 60–61 (accompanying tables). http://www.bea.gov/scb/pdf/2013/10%20October/1013_international_%20services_%20tables.pdf.
———. “U.S. International Transactions Accounts Data,” March 19, 2014, “Table 3a: Private Services Transactions,” “U.S. International Transactions, by Area.” http://www.bea.gov/iTable/iTable.cfm?ReqID=6&step=1#reqid=6&step=3&isuri=1&600=7.
———. “U.S. International Transactions Accounts Data,” March 19, 2014, “Table 12: U.S. International Transactions, by Area.” http://www.bea.gov/iTable/iTable.cfm?ReqID=6&step=1#reqid=6&step=1&isuri=1.
———. “U.S. International Transactions: Fourth Quarter and Year 2013.” News release, BEA 14-09, March 19, 2014. http://www.bea.gov/newsreleases/international/transactions/2014/pdf/trans413.pdf.
U.S. Department of Commerce (USDOC). Census Bureau (Census) and Bureau of Economic Analysis (BEA). “U.S. International Trade in Goods and Services January 2014.” News release, CB14-36/BEA 14-08, FT900 (14-01), March 7, 2014. http://www.bea.gov/newsreleases/international/trade/2014/pdf/trad0114.pdf.
U.S. Department of Commerce (USDOC). Economic Development Administration (EDA). Fiscal Year 2013, Annual Report to Congress: Trade Adjustment Assistance for Firms Program. n.d. http://www.eda.gov/pdf/FY13_TAAF_Annual_Report_to_Congress.pdf (accessed March 29, 2014).
U.S. Department of Commerce (USDOC). International Trade Administration (ITA). “African Growth and Opportunity Act,” n.d. http://trade.gov/agoa/index.asp (accessed November 20, 2013).
———. “High Level Economic Dialogue.” Fact sheet, n.d. http://www.trade.gov/hled/hled_fact_sheet.asp (accessed March 13, 2014).
180

———. “June 19, 2013: Meeting of Canada-United States Regulatory Cooperation Council,” n.d. http://www.trade.gov/rcc/meeting-of-canada-us-rcc-0619202013.asp (accessed March 26, 2014).
———. “June 20, 2013: RCC Stakeholder Dialogue Session,” n.d. http://www.trade.gov/rcc/meeting-of-canada-us-rcc-0619202013.asp (accessed March 26, 2014).
———. “U.S.-Canada Regulatory Cooperation Council,” n.d. http://www.trade.gov/rcc/ (accessed March 25, 2014).
U.S. Department of Commerce (USDOC). Office of Textiles and Apparel (OTEXA). “Trade Preference Programs: The African Growth and Opportunity Act (AGOA).” http://web.ita.doc.gov/tacgi/eamain.nsf/d511529a12d016de852573930057380b/1e85488eb01fd2fd852573940049047d?OpenDocument (accessed December 6, 2013).
———. Office of Textiles and Apparel (OTEXA). “U.S. Imports under Trade Preference Programs.” http://otexa.ita.doc.gov/agoa-cbtpa/catv0.htm (accessed February 2014).
U.S. Department of Homeland Security (USDHS). U.S. Customs and Border Protection (USCBP). “GSP, ATPA, and ATPDEA Due to Expire,” n.d. http://www.cbp.gov/trade/trade-community/outreach-programs/trade-agreements/special-trade-programs/andean/atpa-atpdea-expire (accessed April 14, 2014).
———. “Memorandum on the Renewal of ATPA,” October 24, 2011.
———. What Every Member of the Trade Community Should Know about the African Growth and Opportunity Act. An Informed Compliance Publication, August 2003. http://www.cbp.gov/sites/default/files/documents/icp065_3.pdf.
U.S. Department of Labor (USDOL). U.S. Bureau of Labor Statistics (BLS). “Labor Force Statistics from the Current Population Survey,” n.d. http://data.bls.gov/timeseries/LNS14000000 (accessed January 16, 2014).
U.S. Department of Labor (USDOL). Employment and Training Administration (ETA). “Petition Filing Frequently Asked Questions (FAQ),” n.d. http://www.doleta.gov/tradeact/FAQ.cfm (accessed March 14, 2014).
———. “Trade Adjustment Assistance Community College and Career Training (TAACCCT) Grant Program,” September 18, 2013. http://www.doleta.gov/taaccct/.
———. “Trade Adjustment Assistance for Workers: Comparison of Benefits and Services by Petition Number,” n.d. http://www.doleta.gov/tradeact/pdf/side-by-side.pdf (accessed March 19, 2014).
181

U.S. Department of Labor (USDOL). Office of Trade and Labor Affairs (OTLA). “Joint Statement of the Labor Affairs Council of the United States- Korea Free Trade Agreement,” March 19, 2013.http://www.dol.gov/ilab/programs/otla/KORUS-LAC2013.pdf.
———. “Submissions under the Labor Provisions of Free Trade Agreements,” n.d. http://www.dol.gov/ilab/trade/agreements/fta-subs.htm (accessed March 12, 2014).
———. “Submissions under the Labor Provisions of Free Trade Agreements: Mexico,” n.d. http://www.dol.gov/ilab/trade/agreements/fta-subs.htm (accessed March 18, 2014).
———. “Submissions under the North American Agreement on Labor Cooperation (NAALC),” n.d. http://www.dol.gov/ilab/trade/agreements/naalc.htm (accessed March 18, 2014).
U.S. Department of State (USDOS). “AGOA Forum 2013,” n.d. http://www.state.gov/p/af/rt/agoa/2013/index.htm (accessed January 3, 2014).
———. “Model BIT Fact Sheet.” Press release, April 20, 2012. http://www.state.gov/r/pa/prs/ps/2012/04/188199.htm.
———. “NAFTA Investor-State Arbitrations: Cases Filed Against the Government of Canada,” n.d. http://www.state.gov/s/l/c3740.htm (accessed March 19, 2014).
———. “NAFTA Investor-State Arbitrations: Cases Filed against United Mexican States,” n.d. http://www.state.gov/s/l/c3742.htm (accessed March 19, 2014).
———. “NAFTA Investor-State Arbitrations: Cases Filed against the United States of America,” n.d. http://www.state.gov/s/l/c3741.htm (accessed March 19, 2014).
———. “Ninth WTO Ministerial Conference Makes History (State 167712),” December 18, 2013.
U.S. Department of State (USDOS). Bureau of Western Hemisphere Affairs. “U.S. Relations with Canada.” Fact sheet, August 23, 2013. http://www.state.gov/r/pa/ei/bgn/2089.htm.
U.S. Department of State (USDOS). U.S. Embassy, Ottawa. “2013 Investment Climate Statement,” n.d. http://canada.usembassy.gov/business/reports-and-statistics/investment-climate-statement.html (accessed March 25, 2014).
———. “Canada: 2014 National Trade Estimate Report on Foreign Trade Barriers (Ottawa 001658),” December 12, 2013.
———. “U.S.-Canada Economic Relations.” U.S.-Canada Economic Fact Sheet. U.S.-Canada Trade News, n.d. http://canada.usembassy.gov/business/u.s.-canada-trade-news (accessed March 25, 2014).
U.S. Department of State (USDOS). U.S. Embassy, Port-au-Prince. “Haiti: FY2012 Second Quarter Report on the NEI Initiative (Port au-Prince 000658),” April 27, 2012.
182

———. “Haiti Response to USITC Biennial Caribbean Basin Investment Survey (Port-au-Prince 001952),” July 5, 2013.
U.S. Department of State (USDOS). U.S. Mission, Geneva. “March 2013 WTO Committee on Agriculture (Geneva 000346),” May 7, 2013.
———. “WTO General Council Meeting, 24–25 July 2013 (Geneva 000076),” August 6, 2013.
———. “WTO General Council Meeting, 4 June 2012 (Geneva 000050),” August 6, 2013.
———. “WTO Trade Negotiations Committee, 11 April 2013 (Geneva 00030),” April 18, 2013.
———. “WTO Trade Negotiations Committee, 22 February 2013 (Geneva 000016),” March 7, 2013.
———. “WTO Trade Negotiations Committee, 3 June 2013 (Geneva 000054),” June 24, 2013.
U.S. Department of State (USDOS). U.S. Mission to the OECD, Paris. “Evolving the OECD into a Modern and Relevant Organization (Paris 000220),” September 17, 2013.
———. “Inclusive Growth: OECD Working It Out, but No Good Definition (Paris 000016),” February 12, 2014.
U. S. Department of Transportation (USDOT). Federal Motor Carrier Safety Administration (FMCSA). “Increased Participation and Improved Oversight Mechanisms Would Benefit the NAFTA Pilot Program.” Report No. MH-2012-169, August 16, 2012. http://www.fmcsa.dot.gov/documents/intl-programs/trucking/NAFTA-INTERIM-REPORT.pdf.
———. “Memorandum of Understanding Between The Department of Transportation of the United States of America and the Secretaría de Comunicaciones y Transportes of the United Mexican States on International Freight Cross-border Trucking Services,” July 6, 2011. http://www.fmcsa.dot.gov/documents/Mexican_MOU_Eng.pdf.
———. “Mexico Cross-Border Trucking Pilot Program– Aggregate Data Charts.” Aggregated data thru December 29, 2013. http://www.fmcsa.dot.gov/intl-programs/trucking/aggregate_charts.aspx (accessed March 21, 2014).
———. “Mexico Cross-Border Trucking Pilot Program: Operational Update Reports—12/23/2013–12/29/2013 (Revised 01/27/2014): Number of Motor Carriers with Active Operating Authority.” http://www.fmcsa.dot.gov/intl-programs/trucking/reports.aspx (accessed March 21, 2014).
U. S. Department of the Treasury. “Joint U.S.-China Economic Track Fact Sheet of the Fifth Meeting of the U.S.-China Strategic and Economic Dialogue,” July 12, 2013. http://www.treasury.gov/press-center/press-releases/Pages/jl2010.aspx.
183

———. “U.S. and China Breakthrough Announcement on the Bilateral Investment Treaty Negotiations.” Treasury Notes (blog), July 15, 2013. http://www.treasury.gov/connect/blog/Pages/U.S.-and-China-Breakthrough-Announcement-.aspx.
———. “U.S. and China Joint Fact Sheet Sixth Meeting of the Strategic and Economic Dialogue,” July 11, 2014. http://www.treasury.gov/press-center/press-releases/Pages/jl2561.aspx.
———. “U.S. Fact Sheet — Economic Track Fifth Meeting of the U.S.-China Strategic and Economic Dialogue,” July 12, 2013. http://www.treasury.gov/press-center/press-releases/Pages/jl2011.aspx.
U.S. Energy Information Administration (EIA). Official statistics database. http://www.eia.gov/dnav/pet/pet_move_impcus_a2_nus_epc0_im0_mbbl_a.htm (accessed April 21, 2014).
———. “Short-term Energy Outlook,” February 11, 2014. http://www.eia.gov/forecasts/steo/report/us_oil.cfm.
U.S. Government Accountability Office (GAO). “Letter to the Honorable Max Baucus and the Honorable Dave Camp Concerning the Follow-up on the Haiti Earned Import Allowance Program,” December 14, 2012.
U.S. International Trade Commission (USITC). Andean Trade Preference Act: Impact on U.S. Industries and Consumers and on Drug Crop Eradication and Crop Substitution, 2011. USITC Publication 4352. Washington, DC: USITC, September 2012. http://www.usitc.gov/publications/332/pub4352.pdf.
———. Caribbean Basin Economic Recovery Act, 21st Report 2011–12. USITC Publication 4428. Washington, DC: USITC, September 2013. http://www.usitc.gov/publications/332/pub4428.pdf.
———. China’s Agricultural Trade: Competitive Conditions and Effects on U.S. Exports. USITC Publication 4219. Washington, DC: USITC, March 2011. http://www.usitc.gov/publications/332/pub4219.pdf.
———. China: Effects of Intellectual Property Infringement and Indigenous Innovation Policies on the U.S. Economy. USITC Publication 4226. Washington, DC: USITC, May 2011. http://www.usitc.gov/publications/332/pub4226.pdf.
———. China: Intellectual Property Infringement, Indigenous Innovation Policies, and Frameworks for Measuring the Effects on the U.S. Economy. USITC Publication 4199.Washington, DC: USITC, November 2010. http://www.usitc.gov/publications/332/pub4199.pdf.
184

———. Harmonized Tariff Schedule of the United States (2013), Annotated for Statistical Reporting Purposes, 2013. USITC Publication 4368. Washington, DC: USITC, January 2013.
———. Harmonized Tariff Schedule of the United States (2014), Annotated for Statistical Reporting Purposes, 2014. USITC Publication 4446. Washington, DC: USITC, January 2014. http://www.usitc.gov/publications/docs/tata/hts/bychapter/1400htsa.pdf.
———. The Information Technology Agreement: Advice and Information on the Proposed Expansion, Part 1. Investigation No. 332-532. USITC Publication 4355. Washington, DC: USITC, October 2012. http://www.usitc.gov/publications/332/pub4355.pdf.
———. Recent Trends in U.S. Services Trade: 2012 Annual Report. USITC Publication 4338. Washington, DC: USITC, July 2012. http://www.usitc.gov/publications/332/pub4338.pdf.
———. Recent Trends in U.S. Services Trade: 2013 Annual Report. USITC Publication 4412. Washington, DC: USITC, July 2013. http://www.usitc.gov/publications/332/pub4412.pdf.
———. “Sub-Saharan African Trade and Investment under AGOA Will Be Focus of Four New USITC Investigations.” News release, November 13, 2013. http://www.usitc.gov/press_room/news_release/2013/er1113ll2.htm.
———. Textiles and Apparel: Effects of Special Rules for Haiti on Trade, Markets, and Industries. USITC Publication 4016. Washington, DC: USITC, June 2008. http://www.usitc.gov/publications/332/pub4016.pdf.
———. The Year in Trade 2008: Operations of the Trade Agreements Program, 60th Report. USITC Publication 4091. Washington, DC: July 2009. http://www.usitc.gov/publications/332/pub4091.pdf.
———. The Year in Trade 2009: Operation of the Trade Agreements Program, 61st Report. USITC Publication 4174. Washington, DC: U.S. International Trade Commission, July 2010. http://www.usitc.gov/publications/miscellaneous/pub4174.pdf.
———. The Year in Trade 2010: Operation of the Trade Agreements Program, 62nd Report. USITC Publication 4247. Washington, DC: July 2011. http://www.usitc.gov/publications/332/pub4247.pdf.
———. The Year in Trade 2011: Operation of the Trade Agreements Program; 63rd Report. USITC Publication 4336. Washington, DC: July 2012. http://www.usitc.gov/publications/332/pub4336.pdf.
———. The Year in Trade 2012: Operation of the Trade Agreements Program, 64th Report. USITC Publication 4416. Washington, DC: July 2013. http://www.usitc.gov/publications/332/pub4416.pdf.
185

U.S. International Trade Commission Interactive Tariff and Trade DataWeb (USITC DataWeb)/U.S. Department of Commerce (USDOC). http://dataweb.usitc.gov (accessed various dates).
U.S. Trade Representative (USTR). 2011 Report on Sanitary and Phytosanitary Measures. Washington, DC: USTR, March 2011. http://www.ustr.gov/sites/default/files/SPS%20Report%20Master%20Final%20Draft%20March%2025.pdf.
———. 2012 National Trade Estimate Report on Foreign Trade Barriers. Washington, DC: USTR, March 2012. http://www.ustr.gov/sites/default/files/NTE%20Final%20Printed_0.pdf.
———. 2012 Report on Sanitary and Phytosanitary Measures. Washington, DC: USTR, April 2012. http://www.ustr.gov/webfm_send/3324.
———. 2012 Trade Policy Agenda and 2011 Annual Report. Washington, DC: USTR, March 2012. http://www.ustr.gov/sites/default/files/FULL%20REPORT%20-%20PRINTED%20VERSION.pdf.
———. 2013 National Trade Estimate Report on Foreign Trade Barriers. Washington, DC: USTR, April 2013. http://www.ustr.gov/sites/default/files/2013%20NTE.pdf.
———. 2013 Out-of-Cycle Review of Notorious Markets. Washington, DC: USTR, February 12, 2014. http://www.ustr.gov/sites/default/files/FINAL-PUBLISHED%202013_Notorious_Markets_List-02122014.pdf.
———. 2013 Report on Sanitary and Phytosanitary Measures. Washington, DC: USTR, March, 2013. http://www.ustr.gov/sites/default/files/2013%20SPS.pdf.
———. 2013 Report to Congress on China’s WTO Compliance. Washington, DC: USTR, December, 2013. http://www.ustr.gov/sites/default/files/2013-Report-to-Congress-China-WTO-Compliance.pdf.
———. 2013 Section 1377 Review on Compliance with Telecommunications Trade Agreements. Washington, DC: USTR, April 2013. http://www.ustr.gov/sites/default/files/04032013%202013%20SECTION%201377%20Review.pdf.
———. 2013 Special 301 Report. Washington, DC: USTR, May 2013. http://www.ustr.gov/sites/default/files/05012013%202013%20Special%20301%20Report.pdf.
———. “2013 Year in Review: A Look Back at USTR’s Work to Support Jobs and Economic Growth Here at Home.” USTR Blog, January 3, 2014. http://www.ustr.gov/about-us/press-office/blog/2014/january/2013-year-review-look-back-ustr%E2%80%99s-work-support-jobs-and-econ.
186

———. 2014 National Trade Estimate Report on Foreign Trade Barriers. Washington, DC: USTR, March 2014. http://www.ustr.gov/sites/default/files/2014%20NTE%20Report%20on%20FTB.pdf.
———. 2014 Report on Sanitary and Phytosanitary Measures. Washington, DC: USTR, March 2014. http://www.ustr.gov/sites/default/files/FINAL-2014-SPS-Report-Compiled.pdf.
———. 2014 Report on Technical Barriers to Trade. Washington, DC: USTR, April 2014. http://www.ustr.gov/sites/default/files/2014%20TBT%20Report.pdf.
———. 2014 Section 1377 Review on Compliance with Telecommunications Trade Agreements. Washington, DC: USTR, April 2014. http://www.ustr.gov/sites/default/files/2013-14%20-1377Report-final.pdf.
———. 2014 Trade Policy Agenda and 2013 Annual Report. Washington, DC: USTR, March 2014. http://www.ustr.gov/sites/default/files/2014%20Trade%20Policy%20Agenda%20and%202013%20Annual%20Report.pdf.
———. “24th U.S.-China Joint Commission on Commerce and Trade (JCCT) Signings.” Fact sheet, December 20, 2013. http://www.ustr.gov/about-us/press-office/fact-sheets/2013/December/JCCT-outcomes.
———. “Acting Deputy U.S. Trade Representative Wendy Cutler to Visit Japan, Initiate Bilateral Negotiations on Autos, Insurance, Non-Tariff Measures.” Press release, July 31, 2013. http://www.ustr.gov/ACTING-DEPUTY-USTR-WENDY-CUTLER-TO-VISIT-JAPAN-INITIATE-BILATERAL-NEGOTIATIONS-ON%20AUTOS-INSURANCE-NON-TARIFF-MEASURES%20.
———. “Acting U.S. Trade Representative Marantis and Action Labor Secretary Harris Announce Groundbreaking Labor Rights Enforcement Agreement with Guatemala.” Press release, April 11, 2013. http://www.ustr.gov/about-us/press-office/press-releases/2013/april/marantis-harris-labor-enforcement-guatemala.
———. “Acting U.S. Trade Representative Marantis Lauds Progress in APEC and Trans-Pacific Partnership, Notes Shared Concern on World Trade Organization Talks.” Press release, April 21, 2013. http://www.ustr.gov/about-us/press-office/press-releases/2013/april/amb-marantis-apec-tpp.
———. “Acting U.S. Trade Representative Miriam Sapiro Hails Signature of United States-Caribbean Community Trade and Investment Framework Agreement.” Press release, May 29, 2013. http://www.ustr.gov/about-us/press-office/press-releases/2013/may/amb-sapiro-hails-caricom-tifa.
———. “Acting U.S. Trade Representative Sapiro Announces Section 301 Investigation of Ukraine.” Press release, May 30, 2013. http://www.ustr.gov/about-us/press-office/press-releases/2013/may/amb-sapiro-ukraine-investigation.
187

———. “African Growth and Opportunity Act (AGOA).” http://www.ustr.gov/trade-topics/trade-development/preference-programs/african-growth-and-opportunity-act-agoa (accessed November 20, 2013).
———. “The African Growth and Opportunity Act Implementation Guide.” Washington, DC: USTR, October 2000. http://www.ustr.gov/archive/assets/Trade_Development/Preference_Programs/AGOA/AGOA_Implementation_Guide/asset_upload_file505_6510.pdf.
———. “Ambassador Froman Joins Vice President Biden in Mexico City to Kick Off the U.S.-Mexico High Level Economic Dialogue.” Press release, September 20, 2013. http://www.ustr.gov/about-us/press-office/blog/2013/september/froman-us-mexico-high-level-economic-dialogue.
———. “Announcement of Next Round of Transatlantic Trade and Investment Partnership Negotiation.” Press release, November 4, 2013. http://www.ustr.gov/about-us/press-office/press-releases/2013/November/announcement-TTIP-second-round.
———. “Assistant U.S. Trade Representative for Environment and Natural Resources Jennifer Prescott Participates in Meetings with Peruvian Government.” Press release, June 6, 2013. http://www.ustr.gov/about-us/press-office/press-releases/2013/june/assistant-us-trade-representative-environment-and-nat.
———. “Assistant U.S. Trade Representative for the Western Hemisphere John Melle Co-Chairs the Third Meeting of the Free Trade Commission under the United States-Peru Trade Promotion Agreement.” Press release, June 7, 2013. http://www.ustr.gov/about-us/press-office/press-releases/2013/june/assistant-us-trade-representative-western-hemisphere.
———. “Deputy U.S. Trade Representative Demetrios Marantis Welcomes Hard Work, Productive Outcomes in Revived U.S.-Taiwan Talks.” Press release, March 10, 2013. http://www.ustr.gov/about-us/press-office/press-releases/2013/march/amb-marantis-Taiwan-TIFA.
———. “Joint Press Statement TPP Ministerial Meeting Bandar Seri Begawan, Brunei Darussalam.” Press release, August 23, 2013. http://www.ustr.gov/Joint-Press-Statement-TPP-Ministerial-Brunei.
———. “Joint Statement from 2012 NAFTA Free Trade Commission (FTC) Meeting.” Press release, April 3, 2012. http://www.ustr.gov/about-us/press-office/press-releases/2012/april/joint-statement-2012-nafta-commission-meeting.
———. “Joint Statement from the United States-Central Asia Trade and Investment Framework Agreement (TIFA) Council Meeting.” Press release, November 14, 2013. http://www.ustr.gov/about-us/press-office/press-releases/2013/November/US-Central-Asia-TIFA-Council-Joint-Statement.
188

———. “Joint Statement from U.S.-CARICOM.” Press release, March 31, 2012. http://www.ustr.gov/about-us/press-office/press-releases/2012/march/joint-statement-us-caricom-trade-and-investment-coun.
———. Letter from the United States Trade Representative Ambassador Ron Kirk to the Honorable Irving A. Williamson, Chairman, United States International Trade Commission, July 31, 2012. http://www.usitc.gov/research_and_analysis/ongoing/documents/Request_letter_332-532.pdf.
———. Letter from the United States Trade Representative Ambassador Ron Kirk to the Honorable John Boehner, Speaker, U.S. House of Representatives, January 15, 2013. http://www.ustr.gov/about-us/press-office/blog/2013/january/wts-entering-negotiations-for-ista/.
———. “Mali Now Eligible for Trade Benefits under U.S. African Growth and Opportunity Act (AGOA). Press release, December 24, 2013. http://www.ustr.gov/about-us/press-office/press-releases/2013/December/Mali-Eligible-for-Trade-Benefits-Under-AGOA.
———. “Ministerial Guidance Energizes Negotiators’ Work during 19th Round of TPP Negotiations.” Press release, August 30, 2013. http://www.ustr.gov/19th-TPP-Round-Summary.
———. Motor Vehicle Trade: Terms of Reference. April 12, 2014. http://www.ustr.gov/sites/default/files/Motor%20Vehicle%20TOR%20-%20Attachment%20to%20Amb%20Sasae%20Letter%204-12-13.pdf.
———. “New U.S. Proposal on Tobacco Regulations in the Trans-Pacific Partnership.” Press release, August 22, 2013. http://www.ustr.gov/New-Proposal-Tobacco-Regulation-Trans-Pacific-Partnership.
———. “Non-Tariff Measures: U.S. Consultations with Japan.” Fact sheet, April 12, 2013. http://www.ustr.gov/about-us/press-office/fact-sheets/2013/april/non-tariff-measures-consultations-japan.
———. “Obama Administration Notifies Congress of Intent to Include Japan in Trans-Pacific Partnership Negotiations.” Press release, April 24, 2013. http://www.ustr.gov/about-us/press-office/press-releases/2013/april/congressional-notification-japan-tpp.
———. “Obama Administration Notifies Congress of Intent to Negotiate Transatlantic Trade and Investment Partnership.” Press release, March 20, 2013. http://www.ustr.gov/about-us/press-office/press-releases/2013/march/administration-notifies-congress-ttip.
———. Out-of-Cycle Review of Notorious Markets. Washington, DC: USTR, December 13, 2012. http://www.ustr.gov/sites/default/files/121312%20Notorious%20Markets%20List.pdf.
189

———. “Promoting Food Security, Facilitating Competition, Enhancing Exports: New Multilateral Agriculture Provisions at the WTO.” Fact sheet, December 7, 2013. http://www.ustr.gov/about-us/press-office/fact-sheets/2013/December/New-Multilateral-Agriculture-Provisions-at-the-WTO.
———. “Readout from the Seventh Meeting of the United States-Afghanistan TIFA Council.” Press release, February 28, 2013. http://www.ustr.gov/about-us/press-office/press-releases/2013/february/readout-US-Afghanistan-TIFA.
———. “Readout of Ambassador Michael Froman’s Oct. 3 Meeting in Bali, Indonesia.” Press release, October 17, 2013. http://www.ustr.gov/about-us/press-office/press-releases/2013/October/Readout-Bali-Meeting-TPP.
———. “Readout of the Meeting between U.S. Trade Representative Michael Froman and Indian Minister of Commerce and Industry Anand Sharma.” Press release, July 11, 2013. http://www.ustr.gov/about-us/press-office/press-releases/2013/july/readout-froman-sharma.
———. “Readout of the Meetings of Chief Negotiators for the Trans-Pacific Partnership.” Press release, November 25, 2013. http://www.ustr.gov/about-us/press-office/press-releases/2013/November/Readout-TPP-Chief-Negotiators.
———. “Readout of the Second Meeting of the U.S.-Korea Free Trade Agreement Joint Committee.” Press release, October 18, 2013. http://www.ustr.gov/about-us/press-office/press-releases/2013/October/Readout-second-US-Korea-FTA-Joint-Committee.
———. “Readout of This Week’s Trans-Pacific Partnership Discussions in Washington, DC.” Press release, September 23, 2013. http://www.ustr.gov/about-us/press-office/press-releases/2013/September/Readout-Washington-TPP-discussions.
———. “Readout of Trade in Services Agreement (TISA) Negotiations.” Press release, November 8, 2013. http://www.ustr.gov/about-us/press-office/press-releases/2013/November/readout-Trade-In-Services-Agreement-Negotiations.
———. “Remarks by United States Trade Representative Michael Froman Announcing Enforcement Action with Regard to India.” Press release, February 10, 2014. http://www.ustr.gov/about-us/press-office/press-releases/2014/February/Remarks-by-USTR-Froman-announcing-enforcement-action-with-regard-to-India.
———. “Saving Money, Growing Trade, Raising Incomes Worldwide: The New WTO Trade Facilitation Agreement.” Fact sheet, December 7, 2013. http://www.ustr.gov/about-us/press-office/fact-sheets/2013/December/WTO-Trade-Facilitation-Agreement.
190

———. “Statement by Acting U.S. Trade Representative Demetrios Marantis on Japan’s Announcement Regarding the Trans-Pacific Partnership.” Press release, March 15, 2013. http://www.ustr.gov/about-us/press-office/press-releases/2013/march/amb-marantis-statement-japan-tpp.
———. “Statement by Acting U.S. Trade Representative Demetrios Marantis Regarding Japan and the Trans-Pacific Partnership.” Press release, April 12, 2013. http://www.ustr.gov/about-us/press-office/press-releases/2013/april/amb-marantis-japan-tpp.
———. “Statement by U.S. Trade Representative Froman on the Conclusion of Round Two of TTIP Negotiations.” Press release, November 15, 2013. http://www.ustr.gov/about-us/press-office/press-releases/2013/November/Froman-TTIP-Second-Round-Statement.
———. “Statement by U.S. Trade Representative Froman on the Conclusion of the Third Round of TTIP Negotiations.” Press release, December 20, 2013. http://www.ustr.gov/about-us/press-office/press-releases/2013/December/Statement-by-Ambassador-Froman-on-Third-Round-TTIP-Negotiations.
———. “Statement by U.S. Trade Representative Froman on the First Round of TTIP Negotiations.” Press release, July 12, 2013. http://www.ustr.gov/node/8346.
———. “Statement by U.S. Trade Representative Michael Froman on Korea’s Announcement Regarding the Trans-Pacific Partnership.” Press release, November 29, 2013. http://www.ustr.gov/about-us/press-office/press-releases/2013/November/Froman-statement-TPP-Korea.
———. “Statement from United States President Barack Obama, European Council President Herman Van Rompuy and European Commission President José Manuel Barroso.” Press release, February 13, 2013. http://www.ustr.gov/about-us/press-office/press-releases/2013/february/statement-US-EU-Presidents.
———. “Statement of the Ministers and Heads of Delegation for the Trans-Pacific Partnership Countries.” Press release, December 10, 2013. http://www.ustr.gov/about-us/press-office/press-releases/2013/December/TPP-Ministers-Statement.
———. “Statement of U.S. Trade Representative Michael Froman Following the 9th Ministerial Conference of the World Trade Organization.” Press release, December 6, 2013. http://www.ustr.gov/about-us/press-office/press-releases/2013/December/Froman-statement-following-Ninth-Ministerial-Conference-WTO.
———. “Statement on the 18th Round of Trans-Pacific Partners Negotiations.” Press release, July 25, 2013. http://www.ustr.gov/about-us/press-office/press-releases/2013/july/statement-18th-round-tpp.
191

———. “Substantial Progress in Singapore toward Trans-Pacific Partnership Agreement.” Press release, December 10, 2013. http://www.ustr.gov/about-us/press-office/press-releases/2013/December/TPP-Ministers-Statement.
———. Tenth Report to Congress on the Operation of the Caribbean Basin Economic Recovery Act. Washington, DC: USTR, December 31, 2013.
———. “TPP Negotiations Shift into High Gear at 16th Round.” Press release, March 13, 2013. http://www.ustr.gov/about-us/press-office/press-releases/2013/march/tpp-negotiations-higher-gear.
———. “Trade and Investment Framework Agreements.” http://www.ustr.gov/trade-agreements/trade-investment-framework-agreements (accessed April 21, 2014).
———. “Trade as a Tool to Alleviate Poverty: Multilateral Results on Development at the World Trade Organization.” Fact sheet, December 7, 2013. http://www.ustr.gov/about-us/press-office/fact-sheets/2013/December/Multilateral-Results-on-Development-at-the-WTO.
———. “Transcript: Briefing by USTR Ambassador Froman.” Press release, December 10, 2013. http://www.ustr.gov/about-us/press-office/press-releases/2013/December/Transcript-Briefing-by-Ambassador-Froman.
———. “Trans-Pacific Partnership Leaders Statement.” Press release, October 17, 2013. http://www.ustr.gov/about-us/press-office/press-releases/2013/october/tpp-leaders-statement.
———. “Trans-Pacific Partnership Negotiations Maintain Strong Momentum.” Press release, May 24, 2013. http://www.ustr.gov/about-us/press-office/press-releases/2013/may/tpp-negotiations-strong-momentum.
———. “United States Advances Trans-Pacific Partnership Goals with Vietnam.” Press release, April 24, 2013. http://www.ustr.gov/about-us/press-office/press-releases/2013/april/US-advances-TPP-goals-Vietnam.
———. “Toward the Trans-Pacific Partnership: U.S. Consultations with Japan.” Fact sheet, April 12, 2013. http://www.ustr.gov/about-us/press-office/fact-sheets/2013/april/US-consultations-Japan.
———. “United States and Brazil Hold Second Meeting of the Commission on Economic and Trade Relations under the United States-Brazil Agreement on Trade and Economic Cooperation.” Press release, September 13, 2013. http://www.ustr.gov/about-us/press-office/press-releases/2013/september/us-and-brazil-hold-second-meeting-commission-eco.
192

———. “United States and Burma Sign Trade and Investment Framework Agreement.” Press release, May 21, 2013. http://www.ustr.gov/about-us/press-office/press-releases/2013/may/u.s.-burma-sign-tifa.
———. “United States and Caribbean Community Forge Stronger Relationship.” Press release, November 15, 2013. http://www.ustr.gov/about-us/press-office/press-releases/2013/November/US-CARICOM-TIFA.
———. “United States and Central America-Dominican Republic Hold Environmental Affairs Council Meeting.” USTR Blog, May 10, 2013. http://www.ustr.gov/about-us/press-office/blog/2013/may/us-ca-dr-eac-meeting.
———. “United States and Chile Hold Sixth Meeting of the Environmental Affairs Council under the U.S.-Chile Trade Agreement.” Press release, January 10, 2013. http://www.ustr.gov/about-us/press-office/press-releases/2013/january/us-chile-sixth-eac-us-chile-ft.
———. “United States and Colombia Hold Inaugural Meeting on Labor Affairs Council under the U.S.-Colombia Trade Promotion Agreement.” Press release, June 5, 2013. http://www.ustr.gov/about-us/press-office/press-releases/2013/june/us-colombia-lac-usctpa.
———. “United States and India Hold Seventh Trade Policy Forum.” Press release, September 21, 2010. http://www.ustr.gov/about-us/press-office/press-releases/2010/september/united-states-and-india-hold-seventh-trade-polic.
———. “United States and Indonesia Meet under Trade and Investment Framework Agreement.” Press release, June 13, 2013. http://www.ustr.gov/about-us/press-office/press-releases/2013/june/us-indonesia-tifa.
———. “United States and Japan Streamline Organic Trade across the Pacific.” Press release, September 26, 2013. http://www.ustr.gov/about-us/press-office/press-releases/2013/september/us-japan-organic-trade-across-pacific.
———. “United States and Korea Hold First Meeting of the Environmental Affairs Council under the U.S.-Korea Trade Agreement.” Press release, February 14, 2013. http://www.ustr.gov/about-us/press-office/press-releases/2013/february/US-Korea-first-EAC-meeting.
———. “United States and Korea Hold First Meeting of the Labor Affairs Council under the United States-Korea Trade Agreement.” Press release, March 19, 2013. http://www.ustr.gov/about-us/press-office/press-releases/2013/march/US-Korea-LAC-meeting.
193

———. “United States and Peru Reach Agreement on Action Plan to Strengthen Forest Sector Governance.” Press release, January 11, 2013. http://www.ustr.gov/about-us/press-office/press-releases/2013/january/us-peru-action-plan-forest-sector-governance.
———. “United States and Russian Federation Agree on Action Plan to Improve Intellectual Property Rights Protection.” Press release, December 21, 2012. http://www.ustr.gov/about-us/press-office/press-releases/2012/december/us-russia-agree-action-plan-ipr.
———. “United States and Taiwan Enhance Trade Ties.” Press release, April 5, 2014. http://www.ustr.gov/about-us/press-office/press-releases/2014/April/United-States-and-Taiwan-Enhance-Trade-Ties.
———. “United States and Thailand Deepen Commitments to Engagement at Trade and Investment Framework Agreement Meeting.” Press release, January 17, 2013. http://www.ustr.gov/about-us/press-office/press-releases/2013/january/US-Thailand-engagement.
———. “United States, Bangladesh Sign Trade and Investment Cooperation Forum Agreement (TICFA).” Press release, November 25, 2013. http://www.ustr.gov/about-us/press-office/press-releases/2013/November/US-Bangladesh-TICFA-Signing.
———. “United States, Libya Sign Trade and Investment Framework Agreement.” Press release, December 18, 2013. http://www.ustr.gov/about-us/press-office/press-releases/2013/December/US-Libya-Sign-Trade-Investment-Framework-Agreement.
———. “United States Challenges India’s Restrictions on U.S. Solar Exports.” Press release, February 2013. http://www.ustr.gov/about-us/press-office/press-releases/2013/february/us-challenges-india-restrictions-solar.
———. “United States Continues to Press Guatemala on Enforcement of Worker Rights.” Press release, October 28, 2013. http://www.ustr.gov/about-us/press-office/press-releases/2013/October/US-Guatemala-enforcement-worker-rights.
———. “The United States Explores New Opportunity to Boost Trade and Investment with West Africa.” Press release, March 29, 2013. http://www.ustr.gov/about-us/press-office/press-releases/2013/march/US-explores-opportunity-west-Africa.
———. “United States Launched Negotiations of an Investment Treaty with China.” Trade Facts, June 2008. http://www.ustr.gov/sites/default/files/uploads/factsheets/2008/asset_upload_file993_14943.pdf.
———. “United States, Morocco Sign Bilateral Trade Facilitation Agreement.” Press release, November 21, 2013. http://www.ustr.gov/press-office/press-releases/2013/November/US-Morocco-Trade-Facilitation-Agreement.
194

———. “United States of America and the Republic of Iraq Announce Progress on Entry into Force of Trade and Investment Framework Agreement.” Press release, March 6, 2013.http://www.ustr.gov/about-us/press-office/press-releases/2013/march/US-Iraq-TIFA-progress.
———. “United States Requests WTO Panel in Case against Argentina’s Widespread Use of Import Restrictions.” Press release, December 6, 2012. http://www.ustr.gov/about-us/press-office/press-releases/2012/december/us-requests-wto-panel-argentina-ir.
———. “United States Seeks to Protect Worker Rights under U.S.-Bahrain Trade Agreement.” Press release, May 7, 2013. http://www.ustr.gov/about-us/press-office/press-releases/2013/may/us-bahrain-worker-rights.
———. “Update on the Third Round of Transatlantic Trade and Investment Partnership Negotiations.” Press release, December 19, 2013. http://www.ustr.gov/about-us/press-office/press-releases/2013/December/Readout-TTIP-third-round-update.
———. “U.S. Announces Compliance in World Trade Organization ‘Dolphin-Safe’ Labeling Dispute.” Press release, July 12, 2013. http://www.ustr.gov/about-us/press-office/press-releases/2013/july/US-complies-tuna-dolphin.
———. “U.S., EU Announce Decision to Launch Negotiations on a Transatlantic Trade and Investment Partnership.” Press release, February 13, 2013. http://www.ustr.gov/about-us/press-office/press-releases/2013/february/statement-US-EU-Presidents.
———. “U.S.-Korea Free Trade Agreement Shows Strong Results on Second Anniversary.” Press release, March 12, 2014. http://www.ustr.gov/about-us/press-office/press-releases/2014/March/US-Korea-Free-Trade-Agreement-Shows-Strong-Results-on-Second-Anniversary.
———. “U.S.-Mexico High Level Economic Dialogue.” Fact sheet, May 2, 2013. http://www.ustr.gov/about-us/press-office/fact-sheets/2013/may/us-mexico-hled.
———. “U.S. Trade Representative Ron Kirk Announces Agreements between the United States and Jordan to Boost Investment and Economic Growth Enhance Labor Cooperation.” Press release, January 28, 2013. http://www.ustr.gov/about-us/press-office/press-releases/2013/january/ustr-kirk-announces-us-jordan-agreements.
———. “U.S. Trade Representative Kirk Seeks World Trade Organization Dispute Settlement on Indonesia’s Import Restrictions on Horticultural and Animal Products.” Press release, March 14, 2013. http://www.ustr.gov/about-us/press-office/press-releases/2013/july/US-complies-tuna-dolphin.
195

———. “U.S. Trade Representative Ron Kirk Announces Next Step in Labor Rights Enforcement Case against Guatemala.” Press release, August 9, 2011. http://www.ustr.gov/about-us/press-office/press-releases/2011/august/us-trade-representative-ron-kirk-announces-next-ste.
———. “U.S. Trade Representative Ron Kirk and Agriculture Secretary Tom Vilsack Announce Agreement to Further Open Japan’s Market to U.S. Beef.” Press release, January 28, 2013. http://www.ustr.gov/about-us/press-office/press-releases/2013/january/ustr-kirk-ag-sec-vilsack-japan-beef-announcement.
———. “USTR Froman Expresses U.S. Disappointment at Halt of Information Technology Agreement Talks.” Press release, July 17, 2013. http://www.ustr.gov/about-us/press-office/press-releases/2013/july/amb-froman-disappointment-ita.
———. “USTR Froman Looks to Next Steps in Review, Renewal of African Growth and Opportunity Act.” Press release, August 13, 2013. http://www.ustr.gov/Froman-Next-Steps-in-Review-Renewal-of-AGOA.
———. “USTR Froman, Secretary of Agriculture Vilsack Announce Continued EU Market Access for American Producers of High-Quality Beef.” Press release, August 1, 2013. http://www.ustr.gov/Froman-Vilsack-Announce-Continued-EU-Market-Access-for-American-Beef-Producers.
———. “USTR Froman Welcomes EU Action to Ensure Duty-Free Treatment for High-Tech Products as a Result of U.S. Victory in WTO Dispute.” News release, October 25, 2013. http://www.ustr.gov/about-us/press-office/press-releases/2013/October/WTO-EU-duty-free-high-tech.
———. “USTR Kirk Announced Labor Rights Enforcement Case against Guatemala.” Press release, July 30, 2010. http://www.ustr.gov/about-us/press-office/press-releases/2010/july/united-states-trade-representative-kirk-announces-lab.
———. “USTR Participates in Forestry Sub-Committee and Environmental Cooperation Commission Meetings in Lima.” Press release, April 10, 2013. http://www.ustr.gov/about-us/press-office/blog/2013/april/USTR-forestry-meetings-Peru.
———. “USTR Releases Annual Special 301 Report.” Press release, May 1, 2013. http://www.ustr.gov/about-us/press-office/press-releases/2012/april/ustr-releases-annual-special-301-report-intellectual.
———. “Weekly Trade Spotlight: USTR’s 2012 Year in Review,” USTR Blog, December 28, 2012. http://www.ustr.gov/about-us/press-office/blog/2012/december/weekly-trade-spotlight-ustr%E2%80%99s-2012-year-review.
196

University of Washington. School of Environmental and Forest Sciences (SEFS). “CINTRAFOR Scores Major Victory for Pacific Northwest Timber and Forest Products Industry,” January 15, 2014. http://depts.washington.edu/sefsblog/tag/wood-use-points-program/.
Valencia, Alexandra and Ellsworth, Brian. “Ecuador Offers U.S. Rights Aid, Waives Trade Benefits.” Reuters, June 27, 2013. http://www.reuters.com/article/2013/06/27/us-usa-security-ecuador-idUSBRE95Q0L820130627.
White House. “Fact Sheet: Key Deliverables for the 2014 North American Leaders Summit.” Fact sheet, February 19, 2014. http://www.whitehouse.gov/the-press-office/2014/02/19/fact-sheet-key-deliverables-2014-north-american-leaders-summit.
———. “Fact Sheet: Transatlantic Trade and Investment Partnership.” Fact sheet, June 17, 2013. http://www.ustr.gov/about-us/press-office/fact-sheets/2013/june/wh-ttip.
———. “Fact Sheet: U.S.-Mexico High-Level Economic Dialogue.” Fact sheet, September 20, 2013. http://www.whitehouse.gov/the-press-office/2013/09/20/fact-sheet-us-mexico-high-level-economic-dialogue.
———. “Fact Sheet: U.S.-Mexico Partnership.” Fact sheet, May 2, 2013. http://www.whitehouse.gov/the-press-office/2013/05/02/fact-sheet-us-mexico-partnership.
———. “Joint Statement from President Barack Obama and President Felipe Calderón.” Statements and Releases, May 19, 2010. http://www.whitehouse.gov/the-press-office/joint-statement-president-barack-obama-and-president-felipe-calder-n.
———. “Joint Statement by North American Leaders—21st Century North America: Building the Most Competitive and Dynamic Region in the World.” Statements and Releases, February 19, 2014. http://www.whitehouse.gov/the-press-office/2014/02/19/joint-statement-north-american-leaders-21st-century-north-america-buildi.
———. “Press Conference by President Obama, President Peña Nieto, and Prime Minister Harper.” Statements and Releases, February 19, 2014. http://www.whitehouse.gov/the-press-office/2014/02/19/press-conference-president-obama-president-pe-nieto-and-prime-minister-h.
———. “Readout by the Press Secretary on the President’s Meeting with Prime Minister Noda of Japan.” Statements and Releases, November 12, 2011. http://www.whitehouse.gov/the-press-office/2011/11/12/readout-press-secretary-presidents-meeting-prime-minister-noda-japan.
197

———. “Remarks by President Obama, U.K. Prime Minister Cameron, European Commission President Barroso, and European Council President Van Rompuy on the Transatlantic Trade and Investment Partnership.” Speeches and Remarks, June 17, 2013. http://www.whitehouse.gov/the-press-office/2013/06/17/remarks-president-obama-uk-prime-minister-cameron-european-commission-pr.
———. “Terms of Reference for the High-Level Regulatory Cooperation Council,” March 3, 2011. http://www.whitehouse.gov/sites/default/files/omb/oira/irc/high-level_regulatory_cooperation_council-terms_of_reference_final.pdf.
———. “Trans-Pacific Partnership Leaders Statement.” Press release, October 8, 2013. http://www.whitehouse.gov/the-press-office/2013/10/08/trans-pacific-partnership-leaders-statement.
White House. Executive Office of the President. United States-Mexico High-Level Regulatory Cooperation Council Work Plan. Washington, DC: Executive Office of the President, February 2012.
World Customs Organization (WCO). “International Convention on the Harmonized Commodity Description and Coding System.” Brussels, Belgium, June 14, 1983. http://www.wcoomd.org/en/topics/nomenclature/instrument-and-tools/hs_convention.aspx.
———. “Substantial Transformation: Concept of ‘Originating Goods’ / ‘Sufficient Working or Processing,’” n.d. http://www.wcoomd.org/en/topics/origin/instrument-and-tools/comparative-study-on-preferential-rules-of-origin/specific-topics/study-topics/suf.aspx. (accessed March 13, 2014).
World Trade Organization (WTO). “9th WTO Ministerial Conference, Bali, 2013: Briefing Note: Information Technology Agreement (ITA) and Product Expansion Negotiations.” Briefing note, n.d. http://www.wto.org/english/thewto_e/minist_e/mc9_e/brief_ita_e.htm (accessed March 14, 2014).
———. “Accessions: Tajikistan,” n.d. http://www.wto.org/english/thewto_e/acc_e/a1_tajikistan_e.htm (accessed March 13, 2014).
———. “Accessions: Yemen Brings WTO Membership to 160.” News release, June 26, 2014. http://www.wto.org/english/news_e/news14_e/acc_yem_26jun14_e.htm.
———. “Agreement on Agriculture. Annex 2––Domestic Support: The Basis for Exemption from the Reduction Commitments. Government Service Programmes. 2. General Services.” Agreement Establishing the World Trade Organization. Geneva: WTO, April 15, 1994. http://www.wto.org/english/docs_e/legal_e/legal_e.htm#wtoagreement.
198

———. “Agreement on Trade Facilitation––Ministerial Decision of 7 December 2013.” WT/MIN(13)/36, L/911, December 11, 2013. http://wto.org/english/thewto_e/minist_e/mc9_e/balipackage_e.htm.
———. “Aid for Trade––Ministerial Decision of 7 December 2013.” WT/MIN(13)/34, L/909, December 11, 2013. http://wto.org/english/thewto_e/minist_e/mc9_e/balipackage_e.htm.
———. “Aid for Trade: Mobilizing Aid for Trade: Fourth Global Review of Aid for Trade: ‘Connecting to Value Chains,’” n.d. http://www.wto.org/english/tratop_e/devel_e/a4t_e/global_review13_e.htm (accessed March 13, 2014).
———. Annual Report 2013. Geneva: WTO, 2013.
———. “Bali Ministerial Declaration––Adopted on 7 December 2013.” MIN(13)/DEC, December 11, 2013. http://wto.org/english/thewto_e/minist_e/mc9_e/balipackage_e.htm.
———. “Chronological List of Disputes Cases,” n.d. http://www.wto.org/english/tratop_e/dispu_e/dispu_status_e.htm (accessed March 12, 2014).
———. “Committee Debates Pros and Cons of Standard for Lean Meat Additive.” News release, June 30, 2011. http://www.wto.org/english/news_e/news11_e/sps_30jun11_e.htm.
———. “Cotton––Ministerial Decision of 7 December 2013.” WT/MIN(13)/41, L/916, December 11, 2013. http://wto.org/english/thewto_e/minist_e/mc9_e/balipackage_e.htm.
———. “Dispute Settlement,” n.d. http://www.wto.org/english/tratop_e/dispu_e/dispu_e.htm (accessed March 19, 2014).
———. “Dispute Settlement: DS316; European Communities—Measures Affecting Trade in Large Civil Aircraft.” Online summary prepared by the WTO Secretariat, n.d. http://www.wto.org/english/tratop_e/dispu_e/cases_e/ds316_e.htm (accessed April 10, 2014).
———. “Dispute Settlement: DS353; United States—Measures Affecting Trade in Large Civil Aircraft—Second Complaint.” Online summary prepared by the WTO Secretariat, n.d. http://www.wto.org/english/tratop_e/dispu_e/cases_e/ds353_e.htm (accessed April 10, 2014).
199

———. “Dispute Settlement: DS381; United States—Measures Concerning the Importation, Marketing and Sale of Tuna and Tuna Products.” Online summary prepared by the WTO Secretariat, n.d. http://www.wto.org/english/tratop_e/dispu_e/cases_e/ds381_e.htm (accessed April 10, 2014).
———. “Dispute Settlement: DS 382; United States—Administrative Reviews and Other Measures Related to Imports of Certain Orange Juice from Brazil.” Online summary prepared by the WTO Secretariat, n.d. http://www.wto.org/english/tratop_e/dispu_e/cases_e/ds382_e.htm (accessed April 17, 2014).
———. “Dispute Settlement: DS384; United States—Certain Country of Origin Labelling (COOL) Requirements.” Online summary prepared by the WTO Secretariat, n.d. http://www.wto.org/english/tratop_e/dispu_e/cases_e/ds384_e.htm (accessed April 10, 2014).
———. “Dispute Settlement: DS386; United States—Certain Country of Origin Labelling Requirements.” Online summary prepared by the WTO Secretariat, n.d. http://www.wto.org/english/tratop_e/dispu_e/cases_e/ds386_e.htm (accessed April 10, 2014).
———. “Dispute Settlement: DS394; China—Measures Related to the Exportation of Various Raw Materials.” Online summary prepared by the WTO Secretariat, n.d. http://www.wto.org/english/tratop_e/dispu_e/cases_e/ds394_e.htm (accessed January 3, 2014).
———. “Dispute Settlement: DS413, China—Certain Measures Affecting Electronic Payment Services.” Online summary prepared by the WTO Secretariat, n.d. http://www.wto.org/english/tratop_e/dispu_e/cases_e/ds413_e.htm (accessed January 3, 2014).
———. “Dispute Settlement: DS422, United States—Anti-dumping Measures on Shrimp and Diamond Sawblades from China.” Online summary prepared by the WTO Secretariat, n.d. http://www.wto.org/english/tratop_e/dispu_e/cases_e/ds422_e.htm (accessed January 3, 2014).
———. “Dispute Settlement: DS427; China—Anti-dumping and Countervailing Duty Measures on Broiler Products from the United States.” Online summary prepared by the WTO Secretariat, n.d. http://www.wto.org/english/tratop_e/dispu_e/cases_e/ds427_e.htm (accessed January 3, 2014).
———. “Dispute Settlement: DS431; China—Measures Related to the Exportation of Rare Earths, Tungsten, and Molybdenum.” Online summary prepared by the WTO Secretariat, n.d. http://www.wto.org/english/tratop_e/dispu_e/cases_e/ds431_e.htm (accessed January 3, 2014).
200

———. “Dispute Settlement: DS444; Argentina—Measures Affecting the Importation of Goods.” Online summary prepared by the WTO Secretariat, n.d. http://www.wto.org/english/tratop_e/dispu_e/cases_e/ds444_e.htm (accessed March 21, 2014).
———. “Dispute Settlement: DS447; United States—Measures Affecting the Importation of Animals, Meat and Other Animal Products from Argentina.” Online summary prepared by the WTO Secretariat, n.d. http://www.wto.org/english/tratop_e/dispu_e/cases_e/ds447_e.htm (accessed April 4, 2014).
———. “Dispute Settlement: DS455; Indonesia—Importation of Horticultural Products, Animals and Animal Products.” Online summary prepared by the WTO Secretariat, n.d. http://www.wto.org/english/tratop_e/dispu_e/cases_e/ds455_e.htm (accessed March 21, 2014).
———. “Dispute Settlement: DS456; India—Certain Measures Relating to Solar Cells and Solar Modules.” Online summary prepared by the WTO Secretariat, n.d. http://www.wto.org/english/tratop_e/dispu_e/cases_e/ds456_e.htm (accessed March 28, 2014).
———. “Dispute Settlement: DS464; United States—Anti-dumping and Countervailing Measures on Large Residential Washers from Korea.” Online summary prepared by the WTO Secretariat, n.d. http://www.wto.org/english/tratop_e/dispu_e/cases_e/ds464_e.htm (accessed March 31, 2014).
———. “Dispute Settlement: DS465; Indonesia—Importation of Horticultural Products, Animals and Animal Products.” Online summary prepared by the WTO Secretariat, n.d. http://www.wto.org/english/tratop_e/dispu_e/cases_e/ds465_e.htm (accessed March 28, 2014).
———. “Dispute Settlement: DS471; United States—Certain Methodologies and Their Application to Anti-Dumping Proceedings Involving China.” Online summary prepared by the WTO Secretariat, n.d. http://www.wto.org/english/tratop_e/dispu_e/cases_e/ds471_e.htm (accessed March 31, 2014).
———. “Duty-free and Quota-free (DFQF) Market Access for Least-developed Countries––Ministerial Decision of 7 December 2013.” WT/MIN(13)/44, L/919, December 11, 2013. http://wto.org/english/thewto_e/minist_e/mc9_e/balipackage_e.htm.
———. “Export Competition––Ministerial Decision of 7 December 2013.” WT/MIN(13)/40, L/915, December 11, 2013. http://wto.org/english/thewto_e/minist_e/mc9_e/balipackage_e.htm.
201

———. “General Council––Annual Report (2013).” WT/GC/156, November 28, 2013.
———. “General Services––Ministerial Decision of 7 December 2013.” WT/MIN(13)/37, L/912, December 11, 2013. http://wto.org/english/thewto_e/minist_e/mc9_e/balipackage_e.htm.
———. “Member Information: Lao People’s Democratic Republic and the WTO,” n.d. http://www.wto.org/english/thewto_e/countries_e/lao_e.htm (accessed March 13, 2014).
———. “Ministerial Conferences: Briefing Notes for the Ninth Ministerial Conference.” Briefing note, n.d. http://www.wto.org/english/thewto_e/minist_e/mc9_e/brief_e.htm (accessed December 9, 2013).
———. “Monitoring Mechanism on Special and Differential Treatment––Ministerial Decision of 7 December 2013.” WT/MIN(13)/45, L/920, December 11, 2013. http://wto.org/english/thewto_e/minist_e/mc9_e/balipackage_e.htm.
———. “Ninth WTO Ministerial Conference: Day 1: Bali Conference Kicks Off with Warnings That Failure Will Hurt the Poor.” News release, December 3, 2013. http://www.wto.org/english/news_e/news13_e/mc9_day1_e.htm.
———. “Ninth WTO Ministerial Conference: Days 3, 4 and 5: Round-the-clock Consultations Produce ‘Bali Package.’” News release, December 7, 2013. http://www.wto.org/english/news_e/news13_e/mc9sum_07dec13_e.htm.
———. “Operationalization of the Waiver Concerning Preferential Treatment to Services and Service Suppliers of Least-developed Countries––Ministerial Decision of 7 December 2013.” WT/MIN(13)/43, L/918, December 11, 2013. http://wto.org/english/thewto_e/minist_e/mc9_e/balipackage_e.htm.
———. “Preferential Rules of Origin for Least-developed Countries––Ministerial Decision of 7 December 2013.” WT/MIN(13)/42, L/917, December 11, 2013. http://wto.org/english/thewto_e/minist_e/mc9_e/balipackage_e.htm.
———. “Public Stockholding for Food Security Purposes––Ministerial Decision of 7 December 2013.” WT/MIN(13)/38, L/913, December 11, 2013. http://wto.org/english/thewto_e/minist_e/mc9_e/balipackage_e.htm.
———. “Report (2013) of the Committee on Trade in Civil Aircraft.” WT/L/897, November 7, 2013.
———. “Report (2013) of the Committee on Trade in Government Procurement.” GPA/121, October 24, 2013.
202

———. Statistics Database: Time Series on International Trade. http://stat.wto.org/StatisticalProgram/WSDBStatProgramHome.aspx?Language=E (accessed May 12, 2014).
———. “Trade and Transfer of Technology––Ministerial Decision of 7 December 2013.” WT/MIN(13)/35, L/910, December 11, 2013. http://wto.org/english/thewto_e/minist_e/mc9_e/balipackage_e.htm.
———. Trade Policy Review: Japan. Geneva: WTO, February 21, 2013. http://www.wto.org/english/tratop_e/tpr_e/tp376_e.htm.
———. “TRIPS: ‘Non-violation’ Complaints (Article 64.2)––Background and the Current Situation,” n.d. http://www.wto.org/english/tratop_e/trips_e/nonviolation_background_e.htm (accessed March 18, 2014).
———. “TRIPS Non-violation and Situation Complaints––Ministerial Decision of 7 December 2013.” WT/MIN(13)/31, WT/L/906, December 11, 2013. http://wto.org/english/thewto_e/minist_e/mc9_e/balipackage_e.htm.
———. “Understanding on Tariff Rate Quota Administration Provisions of Agricultural Products, As Defined in Article 2 of the Agreement on Agriculture––Ministerial Decision of 7 December 2013.” WT/MIN(13)/39, L/914, December 11, 2013. http://wto.org/english/thewto_e/minist_e/mc9_e/balipackage_e.htm.
———. “Work Programme on Electronic Commerce––Ministerial Decision of 7 December 2013.” WT/MIN(13)/32, L/907, December 11, 2013. http://wto.org/english/thewto_e/minist_e/mc9_e/balipackage_e.htm.
———. “Work Programme on Small Economies––Ministerial Decision of 7 December 2013.” WT/MIN(13)/33, L/908, December 11, 2013. http://wto.org/english/thewto_e/minist_e/mc9_e/balipackage_e.htm.
World Trade Organization (WTO). Committee on Government Procurement. “Ministerial-level Meeting of the Committee on Government Procurement (3 December 2013, at Bali, Indonesia)—Declaration.” GPA/122, December 3, 2013.
World Trade Organization (WTO). Committee of Participants on the Expansion of Trade in Information Technology Products. “Classification Divergences––Note by the Secretariat.” G/IT/W/30, March 11, 2009.
———. “Minutes of the Meeting of 1 November 2012.” G/IT/M/56, March 14, 2013.
———. “Report (2013) of the Committee of Participants on the Expansion of Trade in Information Technology Products.” G/L/1050, October 15, 2013.
203

———. “Status of Implementation––Note by the Secretariat––Revision.” G/IT/1/Rev.49, October 4, 2013.
World Trade Organization (WTO). Committee on Trade in Civil Aircraft. “Minutes of the Meeting Held on 7 November 2013.” TCA/M/29, November 12, 2013.
204

Appendix A Data Tables
205

206

Table A.1 U.S. merchandise trade with major trading partners (total exports and general imports), 2013
Major partners U.S. total
exports U.S. general
imports
Merchandise trade balance,
Census basis
Two-way trade (total exports plus
general imports)
Million $ EU-28 262,116 387,127 -125,011 649,243 Canada 300,347 332,078 -31,731 632,425 China 122,016 440,434 -318,417 562,450 Mexico 226,153 280,456 -54,303 506,608 Japan 65,145 138,534 -73,389 203,678 Korea 41,555 62,228 -20,673 103,783 Brazil 44,116 27,553 16,563 71,669 Taiwan 25,639 37,931 -12,292 63,570 India 21,875 41,829 -19,954 63,704 All others 470,017 519,252 -49,235 989,269
World 1,578,979 2,267,421 -688,443 3,846,400 Source: Census Bureau, U.S. Department of Commerce. http://www.census.gov/foreign-trade/. Note: Merchandise trade data used to derive country and world trade balances in this table differ from trade data used elsewhere in this report. This table uses U.S. total exports and U.S. general imports to derive the official merchandise trade balance on the Census basis. The merchandise trade balance presented here is that used by Census to describe official trade balances. Merchandise trade data used to derive country and world trade balances throughout the report use imports for consumption and domestic exports. For more information, please see footnote 24 in chapter 1; the Census merchandise trade balance definition at http://www.census.gov/foreign-trade/reference/definitions/#M; and the “View data field descriptions” selection at http://dataweb.usitc.gov.
207

Table A.2 U.S. merchandise trade with FTA partners (total exports and general imports), 2013
FTA partners U.S. total
exports U.S. general
imports
Merchandise trade balance,
Census basis
Two-way trade (total exports plus
general imports)
Million $ Israel 13,738 22,676 -8,938 36,414 NAFTA 526,398 612,533 -86,136 1,138,931 Jordan 2,087 1,197 890 3,284 Chile 17,585 10,363 7,221 27,948 Singapore 30,724 17,828 12,896 48,552 Australia 26,047 9,272 35,319 16,776 Morocco 2,305 977 1,328 3,282 Bahrain 1,018 635 383 1,653 CAFTA-DR 29,451 30,114 -662 59,565 Oman 1,504 1,022 482 2,527 Peru 10,056 8,122 1,933 18,178 Korea 41,555 62,228 -20,673 103,783 Colombia 18,606 21,617 -3,011 40,224 Panama 10,782 449 10,333 11,231
FTA partner total 757,495 836,965 -79,471 1,594,460 World 1,578,979 2,267,421 -688,443 3,846,400
Source: Census Bureau, U.S. Department of Commerce. http://www.census.gov/foreign-trade/. Note: Merchandise trade data used to derive FTA-partner trade balances in this table differ from trade data used in chapter 4. This table uses U.S. total exports and U.S. general imports to derive the official merchandise trade balance on the Census basis. The merchandise trade balance presented here is that used by Census to describe official trade balances. Merchandise trade data used to derive FTA-partner trade balances in chapter 4 uses imports for consumption and domestic exports. For more information, please see footnote 24 in chapter 1; the Census merchandise trade balance definition at http://www.census.gov/foreign-trade/reference/definitions/#M; and the “View data field descriptions” selection at http://dataweb.usitc.gov.
208

Table A.3 U.S. merchandise trade with the world, by USITC digest sectors, 2011–13 Sector Grouping Description 2011 2012 2013
% change 2012–13
Million $ Domestic exports:
1 Agricultural products 145,724 149,293 152,162 1.9 2 Forest products 39,274 38,309 39,244 2.4 3 Chemicals and related products 213,983 217,452 218,078 0.3 4 Energy-related products 134,088 142,294 152,652 7.3 5 Textiles and apparel 19,433 19,211 19,754 2.8 6 Footwear 832 824 789 -4.3 7 Minerals and metals 140,640 140,516 133,749 -4.8 8 Machinery 115,193 122,404 122,269 -0.1 9 Transportation equipment 257,589 285,772 293,023 2.5 10 Electronic products 164,537 167,003 166,976 0.0 11 Miscellaneous manufactures 26,759 27,914 29,843 6.9 12 Special provisions 41,123 42,218 43,501 3.0
Total U.S. domestic exports 1,299,176 1,353,211 1,372,039 1.4 Imports for consumption:
1 Agricultural products 115,585 122,400 125,699 2.7 2 Forest products 36,271 37,116 39,966 7.7 3 Chemicals and related products 254,229 252,153 250,484 -0.7 4 Energy-related products 430,796 398,441 352,853 -11.4 5 Textiles and apparel 113,611 113,507 117,225 3.3 6 Footwear 22,559 23,745 24,612 3.7 7 Minerals and metals 192,550 194,712 190,474 -2.2 8 Machinery 154,948 166,237 169,113 1.7 9 Transportation equipment 306,579 358,409 371,548 3.7 10 Electronic products 400,592 413,767 417,226 0.8 11 Miscellaneous manufactures 99,415 104,443 109,412 4.8 12 Special provisions 59,815 66,105 71,137 7.6
Total U.S. imports for consumption 2,186,951 2,251,035 2,239,750 -0.5
Source: Official trade statistics of the USDOC as maintained by the USITC. Note: Because of rounding, figures may not add up to totals shown.
209

Table A.4 Leading U.S. domestic exports to the world by Schedule B subheading, 2011–13 Schedule B subheading Description 2011 2012 2013
% change 2012–13
Million $ 8800.00 Aircraft, spacecraft, and parts thereof 74,961 86,050 96,287 11.9 2710.19 Petroleum oils & oils (not light) from bituminous minerals or preps n.e.s.o.i. 70%+ by weight from petroleum
oils or bituminous minerals 62,984 71,452 76,878 7.6
2710.12 Light oils and preparations (a) 30,413 33,773 11.0 7108.12 Gold, nonmonetary, unwrought n.e.s.o.i. (other than powder) 24,134 33,339 31,585 -5.3 8703.23 Passenger motor vehicles with spark-ignition internal combustion reciprocating piston engine, cylinder capacity
over 1,500 cc but not over 3,000 cc 22,318 19,478 21,808 12.0
1201.90 Soybeans, whether or not broken, other than seed (b) 24,695 21,456 -13.1 8703.24 Passenger motor vehicles with spark-ignition internal combustion reciprocating piston engine, cylinder capacity
over 3,000 cc 15,537 18,611 20,356 9.4
3004.90 Medicaments, in measured doses, etc. (excluding vaccines, etc., coated bandages, etc., and pharmaceutical goods), n.e.s.o.i.
18,386 19,436 17,322 -10.9
8542.31 Processors or controllers 10,667 11,325 11,355 0.3 2701.12 Bituminous coal, whether or not pulverized, but not agglomerated 15,587 14,349 10,506 -26.8 1001.99 Wheat and meslin other than durum or seed wheat (c) 7,953 10,242 28.8 8708.99 Parts and accessories for motor vehicles, n.e.s.o.i. 10,215 10,970 9,892 -9.8 8708.29 Parts and accessories of bodies (including cabs) for motor vehicles, n.e.s.o.i. 7,622 8,177 8,579 4.9 8704.31 Motor vehicles for goods transport n.e.s.o.i., with spark-ignition internal combustion piston engine, gross
vehicle weight not over 5 metric tons 7,122 7,474 8,570 14.7
9018.90 Instruments and appliances for medical, surgical or veterinary sciences, n.e.s.o.i., and parts and accessories thereof
8,044 8,102 8,182 1.0
3002.10 Antisera and other blood fractions, and modified immunological products 5,038 6,439 8,059 25.2 8517.62 Machines for the reception, conversion and transmission or regeneration of voice, images or other data,
including switching and routing apparatus 7,206 7,530 7,085 -5.9
1005.90 Corn (maize), other than seed corn 13,756 9,419 6,503 -31.0 8708.40 Gear boxes and parts thereof, for motor vehicles 4,943 5,165 6,000 16.2 7204.49 Ferrous waste and scrap, n.e.s.o.i. 9,217 7,482 5,991 -19.9 8431.43 Parts for boring or sinking machinery, n.e.s.o.i. 6,507 6,541 5,919 -9.5 2711.21 Natural gas, gaseous 5,436 4,346 5,818 33.9 8486.20 Machines and apparatus for the manufacture of semiconductor devices or electronic integrated circuits 5,331 5,279 5,813 10.1 5201.00 Cotton, not carded or combed 8,424 6,246 5,589 -10.5 8542.39 Electronic integrated circuits, n.e.s.o.i. 5,566 5,312 5,361 0.9
Total of items shown 349,000 435,581 448,929 3.1 All other 950,176 917,630 923,110 0.6
Total of all commodities 1,299,176 1,353,211 1,372,039 1.4 Source: Official trade statistics of the USDOC as maintained by the USITC. Note: Because of rounding, figures may not add up to totals shown. The abbreviation “n.e.s.o.i.” stands for “not elsewhere specified or included.” aTrade in 2011 reported under HTS tariff line 2710.11. bTrade in 2011 reported under HTS tariff line 1201.00. cTrade in 2011 reported under HTS tariff line 1001.90.
210

Table A.5 Leading U.S. imports for consumption from the world by HTS subheading, 2011–13 HTS subheading Description 2011 2012 2013
% change 2012–13
Million $ 2709.00 Petroleum oils and oils from bituminous minerals, crude 246,894 228,944 195,487 -14.6 8703.23 Passenger motor vehicles with spark-ignition internal combustion reciprocating piston engine,
cylinder capacity over 1,500 cc but not over 3,000 cc 64,355 77,086 84,873 10.1
8703.24 Passenger motor vehicles with spark-ignition internal combustion reciprocating piston engine, cylinder capacity over 3,000 cc
56,502 66,287 62,953 -5.0
2710.19 Petroleum oils & oils (not light) from bituminous minerals or preps n.e.s.o.i. 70%+ by wt. from petroleum oils or bitum. min.
74,995 68,113 61,295 -10.0
8517.12 Telephones for cellular networks or for other wireless networks 42,213 43,665 47,185 8.1 8471.30 Portable automatic data processing machines, weight not more than 10 kg, consisting of at least a
central processing unit, keyboard and display 42,091 43,216 42,634 -1.3
3004.90 Medicaments, in measured doses, etc. (excluding vaccines, etc., coated bandages, etc., and pharmaceutical goods), n.e.s.o.i.
37,802 34,541 33,924 -1.8
2710.12 Light oils and preparations (a) 35,606 33,005 -7.3 8517.62 Machines for the reception, conversion and transmission or regeneration of voice, images or other
data, including switching and routing apparatus 23,758 27,254 29,869 9.6
7102.39 Diamonds, nonindustrial, worked, including polished or drilled 21,691 19,638 22,673 15.5 2713.11 Petroleum coke, not calcined 16,543 18,914 17,161 -9.3 8542.31 Processors or controllers 14,378 14,895 16,828 13.0 8473.30 Parts and accessories for automatic data processing machines and units thereof, magnetic or optical
readers, transcribing machines, etc., n.e.s.o.i. 15,553 14,330 15,498 8.2
8471.50 Processing units other than those of 8471.41 and 8471.49, n.e.s.o.i.. 15,023 15,125 15,231 0.7 8528.72 Reception apparatus for television, incorporating a screen or video display device, color 16,621 16,642 14,425 -13.3 7108.12 Gold, nonmonetary, unwrought n.e.s.o.i. (other than powder) 14,330 15,912 14,124 -11.2 8803.30 Parts of airplanes or helicopters, n.e.s.o.i. 9,707 11,929 13,095 9.8 8708.99 Parts and accessories for motor vehicles, n.e.s.o.i. 11,460 12,911 12,266 -5.0 8471.70 Automatic data processing storage units, n.e.s.o.i.. 9,969 13,149 11,965 -9.0 9503.00 Toys, including riding toys o/than bicycles, puzzles, reduced scale models 10,877 10,914 11,096 1.7 8411.91 Parts of turbojets or turbopropellers 9,148 10,087 10,831 7.4 8708.29 Parts and accessories of bodies (including cabs) for motor vehicles, n.e.s.o.i. 8,477 10,202 10,817 6.0 8443.99 Parts and accessories of printing machinery, n.e.s.o.i. 11,527 10,842 10,738 -1.0 8704.31 Motor vehicles for goods transport n.e.s.o.i., with spark-ignition internal combustion piston engine,
gvw not over 5 metric tons 7,573 9,193 10,360 12.7
2711.21 Natural gas, gaseous 13,290 8,292 9,540 15.1 Total of items shown 794,778 837,686 807,876 -3.6
All other 1,392,173 1,413,349 1,431,875 1.3 Total of all commodities 2,186,951 2,251,035 2,239,750 -0.5
Source: Official trade statistics of the USDOC as maintained by the USITC. Note: Because of rounding, figures may not add up to totals shown. The abbreviation “n.e.s.o.i.” stands for “not elsewhere specified or included.” aTrade in 2011 reported under HTS tariff line 2710.11.
211

212
Table A.6 U.S. trade with top 15 single-country trading partners, 2013
Rank Country Domestic
exports Imports for
Consumption Total % of total
trade Million $
1 Canada 251,685 332,887 584,572 16.2 2 China 114,313 438,147 552,460 15.3 3 Mexico 181,690 277,664 459,354 12.7 4 Japan 59,689 137,954 197,643 5.5 5 Germany 42,372 112,233 154,605 4.3 6 Korea 39,008 61,979 100,987 2.8 7 United Kingdom 41,228 52,165 93,393 2.6 8 France 28,351 44,697 73,048 2.0 9 Brazil 37,627 26,861 64,488 1.8 10 Saudi Arabia 17,656 46,576 64,232 1.8 11 Taiwan 23,270 37,539 60,808 1.7 12 India 16,911 41,459 58,370 1.6 13 Netherlands 37,137 18,850 55,987 1.6 14 Italy 15,362 38,274 53,636 1.5 15 Switzerland 22,040 28,095 50,135 1.4
Top 15 928,340 1,695,378 2,623,718 72.6 All others 443,699 544,372 988,071 27.4
Total 1,372,039 2,239,750 3,611,789 100.0 Source: Official trade statistics of the USDOC as maintained by the USITC. Note: Because of rounding, figures may not add up to totals shown.
212

213
Table A.7 Top 15 U.S. single-country export markets and import sources, 2013 Rank Country
Million $ % of total exports Domestic exports: 1 Canada 251,685 18.3 2 Mexico 181,690 13.2 3 China 114,313 8.3 4 Japan 59,689 4.4 5 Germany 42,372 3.1 6 United Kingdom 41,228 3.0 7 Korea 39,008 2.8 8 Brazil 37,627 2.7 9 Netherlands 37,137 2.7 10 Hong Kong 31,644 2.3 11 France 28,351 2.1 12 Belgium 26,736 1.9 13 Singapore 26,690 1.9 14 Australia 23,976 1.7 15 Taiwan 23,270 1.7
Top 15 countries 965,417 70.4 All others 406,622 29.6
Total U.S. domestic exports to the world 1,372,039 100.0 Imports for consumption: Million $ % of total exports 1 China 438,147 19.6 2 Canada 332,887 14.9 3 Mexico 277,664 12.4 4 Japan 137,954 6.2 5 Germany 112,233 5.0 6 Korea 61,979 2.8 7 United Kingdom 52,165 2.3 8 Saudi Arabia 46,576 2.1 9 France 44,697 2.0 10 India 41,459 1.9 11 Italy 38,274 1.7 12 Taiwan 37,539 1.7 13 Ireland 31,336 1.4 14 Switzerland 28,095 1.3 15 Malaysia 27,241 1.2
Top 15 countries 1,708,245 76.3 All others 531,505 23.7
Total U.S. imports for consumption 2,239,750 100.0 Source: Official trade statistics of the USDOC as maintained by the USITC. Note: Because of rounding, figures may not add up to totals shown.
213

214
Table A.8 U.S. private services exports and imports from the world, by category, 2011–13
Service industry 2011 2012 2013 % change,
2012–13 Million $
Exports Business, professional, and technical services 140,974 153,093 156,883 2.5 Travel 115,552 126,214 139,569 10.6 Royalties and license fees 120,717 124,182 129,331 4.1 Financial services 78,243 76,418 81,270 6.3 Passenger fares 36,763 39,360 41,145 4.5 Education 22,823 24,710 26,357 6.7 Port services 21,334 21,562 22,987 6.6 Freight 21,733 22,293 22,427 0.6 Insurance services 14,958 16,067 15,311 -4.7 Telecommunications 12,851 14,009 14,083 0.5 Other 9,796 10,231 10,535 3.0
Total 595,744 628,138 659,899 5.1 Imports
Business, professional, and technical services 111,332 116,217 119,846 3.1 Travel 78,229 83,451 86,243 3.3 Insurance services 55,794 52,563 50,590 -3.8 Freight 40,418 41,873 44,740 6.8 Royalties and license fees 34,786 39,889 41,291 3.5 Passenger fares 31,079 34,654 37,344 7.8 Financial services 17,566 16,952 18,027 6.3 Port services 14,212 13,572 13,939 2.7 Telecommunications 7,792 8,007 7,633 -4.7 Education 5,763 6,037 6,393 5.9 Other 1,407 1,450 1,485 2.4
Total 398,378 414,666 427,530 3.1 Source: USDOC, BEA, U.S. International Transactions Accounts Data, March 19, 2014, table 3a. Note: Data for 2013 are preliminary.
214

Table A.9 Antidumping cases active in 2013, by USITC investigation number USITC investigation number Product
Country of origin
Date of institution
USITC prelim
ITAa prelim
ITA final
USITC final
Date of final actionb
Affirmative = A; Negative = N 731-TA-1195 Utility-scale wind towers China 12/29/2011 A A A A 2/8/2013 731-TA-1196 Utility-scale wind towers Vietnam 12/29/2011 A A A A 2/8/2013 731-TA-1197 Steel wire garment hangers Taiwan 12/29/2011 A A A A 2/8/2013 731-TA-1198 Steel wire garment hangers Vietnam 12/29/2011 A A A A 1/28/2013 731-TA-1199 Large residential washers Korea 12/30/2011 A A A A 2/8/2013 731-TA-1200 Large residential washers Mexico 12/30/2011 A A A A 2/8/2013 731-TA-1201 Drawn stainless steel sinks China 3/1/2012 A A A A 4/4/2013 731-TA-1202 Xanthan gum Austria 6/5/2012 A A A N 7/12/2013 731-TA-1203 Xanthan gum China 6/5/2012 A A A A 7/12/2013 731-TA-1204 Hardwood plywood China 9/27/2012 A A A N 11/25/2013 731-TA-1205 Silica bricks China 11/15/2012 A A A N (c) 731-TA-1206 Nickel-plated steel Japan 3/27/2013 A A (c) (c) (c) 731-TA-1207 Prestressed steel tie wire China 4/23/2013 A A (c) (c) (c) 731-TA-1208 Prestressed steel tie wire Mexico 4/23/2013 A A (c) (c) (c) 731-TA-1209 Prestressed steel tie wire Thailand 4/23/2013 A N (c) (c) (c) 731-TA-1210 Welded stainless steel pressure pipe Malaysia 5/16/2013 A (c) (c) (c) (c) 731-TA-1211 Welded stainless steel pressure pipe Thailand 5/16/2013 A (c) (c) (c) (c) 731-TA-1212 Welded stainless steel pressure pipe Vietnam 5/15/2013 A (c) (c) (c) (c) 731-TA-1213 Steel threaded rod India 6/27/2013 A A (c) (c) (c) 731-TA-1214 Steel threaded rod Thailand 6/27/2013 A A (c) (c) (c) 731-TA-1215 Oil country tubular goods India 7/2/2013 A (c) (c) (c) (c) 731-TA-1216 Oil country tubular goods Korea 7/2/2013 A (c) (c) (c) (c) 731-TA-1217 Oil country tubular goods Philippines 7/2/2013 A (c) (c) (c) (c) 731-TA-1218 Oil country tubular goods Saudi Arabia 7/2/2013 A (c) (c) (c) (c) 731-TA-1219 Oil country tubular goods Taiwan 7/2/2013 A (c) (c) (c) (c) 731-TA-1220 Oil country tubular goods Thailand 7/2/2013 A (c) (c) (c) (c) 731-TA-1221 Oil country tubular goods Turkey 7/2/2013 A (c) (c) (c) (c) 731-TA-1222 Oil country tubular goods Ukraine 7/2/2013 A (c) (c) (c) (c) 731-TA-1223 Oil country tubular goods Vietnam 7/2/2013 A (c) (c) (c) (c) 731-TA-1224 Ferrosilicon Russia 7/19/2013 A (c) (c) (c) (c) 731-TA-1225 Ferrosilicon Venezuela 7/19/2013 A (c) (c) (c) (c) 731-TA-1226 Chlorinated isocyanurates China 8/29/2013 A (c) (c) (c) (c) 731-TA-1227 Steel concrete rebar Mexico 9/4/2013 A (c) (c) (c) (c) 731-TA-1228 Steel concrete rebar Turkey 9/4/2013 A (c) (c) (c) (c) 731-TA-1229 Monosodium glutamate China 9/16/2013 A (c) (c) (c) (c) 731-TA-1230 Monosodium glutamate Indonesia 9/16/2013 A (c) (c) (c) (c) 731-TA-1231 Grain-oriented electrical steel China 9/18/2013 A (c) (c) (c) (c) 731-TA-1232 Grain-oriented electrical steel Czech Republic 9/18/2013 A (c) (c) (c) (c) 731-TA-1233 Grain-oriented electrical steel Germany 9/18/2013 A (c) (c) (c) (c)
215

USITC investigation number Product
Country of origin
Date of institution
USITC prelim
ITAa prelim
ITA final
USITC final
Date of final actionb
731-TA-1234 Grain-oriented electrical steel Japan 9/18/2013 A (c) (c) (c) (c) 731-TA-1235 Grain-oriented electrical steel Korea 9/18/2013 A (c) (c) (c) (c) 731-TA-1236 Grain-oriented electrical steel Poland 9/18/2013 A (c) (c) (c) (c) 731-TA-1237 Grain-oriented electrical steel Russia 9/18/2013 A (c) (c) (c) (c) 731-TA-1238 Non-oriented electrical steel China 9/30/2013 A (c) (c) (c) (c) 731-TA-1239 Non-oriented electrical steel Germany 9/30/2013 A (c) (c) (c) (c) 731-TA-1240 Non-oriented electrical steel Japan 9/30/2013 A (c) (c) (c) (c) 731-TA-1241 Non-oriented electrical steel Korea 9/30/2013 A (c) (c) (c) (c) 731-TA-1242 Non-oriented electrical steel Sweden 9/30/2013 A (c) (c) (c) (c) 731-TA-1243 Non-oriented electrical steel Taiwan 9/30/2013 A (c) (c) (c) (c) 731-TA-1244 Tetrafluoroethane China 10/22/2013 A (c) (c) (c) (c) 731-TA-1245 Calcium hypochlorite China 12/18/2013 (c) (c) (c) (c) (c) 731-TA-1246 Crystalline silicon photovoltaic products China 12/31/2013 (c) (c) (c) (c) (c) 731-TA-1247 Crystalline silicon photovoltaic products Taiwan 12/31/2013 (c) (c) (c) (c) (c) Source: U.S. International Trade Commission. a“ITA” is the International Trade Administration of the USDOC. bFor cases in which the final action was taken by the ITA, the date shown is the Federal Register notice date of that action. For cases in which the final action was taken by USITC, the date of the USITC notification of USDOC is shown. cPending as of December 31, 2013. 216

217
Table A.10 Antidumping duty orders and suspension agreements in effect as of December 31, 2013
Country Commodity Effective date of original action
Argentina Lemon juice (suspended) Sept. 10, 2007 Australia Electrolytic manganese dioxide Oct. 7, 2008 Belarus Steel concrete reinforcing bar Sept. 7, 2001 Belgium Stainless steel plate in coils May 21, 1999 Brazil Polyethylene terephthalate film, sheet, and strip Nov. 10, 2008
Frozen or canned warmwater shrimp and prawns Feb. 1, 2005 Prestressed concrete steel wire strand Jan. 28, 2004 Carbon and certain alloy steel wire rod Oct. 29, 2002 Stainless steel bar Feb. 21, 1995 Circular welded nonalloy steel pipe Nov. 2, 1992 Carbon steel butt-weld pipe fittings Dec. 17, 1986
Iron construction castings May 9, 1986
Canada Citric acid and certain citric salts May 29, 2009
Iron construction castings Mar. 5, 1986
Chile Preserved mushrooms Dec. 2, 1998 China Xanthan gum July 19, 2013
Drawn stainless steel sinks Apr. 11, 2013 Utility-scale wind towers Feb. 15, 2013 Crystalline silicon photovoltaic cells Dec. 07, 2012 High-pressure steel cylinders Jun. 21, 2012 Stilbenic optical brightening agent May 10, 2012 Multilayered wood flooring Dec. 8, 2011 Aluminum extrusions May 26, 2011 Drill pipe and drill collars Mar. 3, 2011 Seamless refined copper pipe and tube Nov. 22, 2010 Coated paper Nov. 17 2010 Seamless carbon and alloy steel standard, line, and pressure pipe Nov. 10, 2010 Magnesia carbon bricks Sept. 20, 2010 Narrow woven ribbons Sept. 1, 2010 Woven electric blankets Aug. 18, 2010 Steel grating July 23, 2010 Prestressed concrete steel wire strand June 29, 2010 Oil country tubular goods May 21, 2010 Potassium phosphate salts July 22, 2010 Kitchen appliance shelving and racks Sept. 14, 2009 Tow-behind lawn groomer Aug. 3, 2009 Citric acid and certain citric salts May 29, 2009 Circular welded carbon-quality steel line pipe May 13, 2009 Frontseating service valves April 28, 2009 HEDP April 28, 2009 Steel threaded rod April 14, 2009 Circular welded austenitic stainless pressure pipe Mar. 17, 2009 Small-diameter graphite electrodes Feb. 26, 2009 Uncovered innerspring units Feb. 19, 2009 Lightweight thermal paper Nov. 24, 2008 Polyethylene terephthalate film, sheet, and strip Nov. 10, 2008 Electrolytic manganese dioxide Oct. 7, 2008 Steel wire garment hangers Oct. 6, 2008 Raw flexible magnets Sept. 17, 2008 Off-the-road tires Sept. 4, 2008 Sodium nitrite Aug. 27, 2008 Laminated woven sacks Aug. 7, 2008 Light-walled rectangular pipe and tube Aug. 5, 2008 Steel nails Aug. 1, 2008 Circular welded carbon-quality steel pipe July 22, 2008
217

218
Country Commodity Effective date of original action
Sodium hexametaphosphate Mar. 19, 2008 Certain polyester staple fiber June 1, 2007 Certain activated carbon April 27, 2007 Certain lined paper school supplies Sept. 28, 2006 Artist's canvas June 1, 2006 Chlorinated isocyanurates June 24, 2005 Magnesium April 15, 2005 Tissue paper Mar. 30, 2005 Frozen or canned warmwater shrimp and prawns Feb. 1, 2005 Crepe paper Jan. 25, 2005 Wooden bedroom furniture Jan. 4, 2005 Carbazole violet pigment 23 Dec. 29, 2004 Hand trucks Dec. 2, 2004 Polyethylene retail carrier bags Aug. 9, 2004 Ironing tables Aug. 6, 2004 Tetrahydrofurfuryl alcohol Aug. 6, 2004 Malleable iron pipe fittings Dec. 12, 2003 Refined brown aluminum oxide Nov. 19, 2003 Barium carbonate Oct. 1, 2003 Polyvinyl alcohol Oct. 1, 2003 Saccharin July 9, 2003 Non-malleable cast iron pipe fittings Apr. 7, 2003 Ferrovanadium Jan. 28, 2003 Folding gift boxes Jan. 8, 2002 Honey Dec. 10, 2001 Hot-rolled carbon steel flat products Nov. 29, 2001 Pure magnesium (granular) Nov. 19, 2001 Foundry coke Sept. 17, 2001 Steel concrete reinforcing bars Sept. 7, 2001 Preserved mushrooms Feb. 19, 1999 Carbon steel plate Oct. 24, 1997 Crawfish tail meat Sept. 15, 1997 Persulfates July 7, 1997 Furfuryl alcohol June 21, 1995 Pure magnesium (ingot) May 12, 1995 Glycine Mar. 29, 1995 Cased pencils Dec. 28, 1994 Silicomanganese Dec. 22, 1994 Paper clips Nov. 25, 1994 Fresh garlic Nov. 16, 1994 Helical spring lock washers Oct. 19, 1993 Sulfanilic acid Aug. 19, 1992 Carbon steel butt-weld pipe fittings July 6, 1992 Silicon metal June 10, 1991 Axes and adzes Feb. 19, 1991 Bars and wedges Feb. 19, 1991 Hammers and sledges Feb. 19, 1991 Picks and mattocks Feb. 19, 1991 Tapered roller bearings June 15, 1987 Porcelain-on-steel cooking ware Dec. 2, 1986 Petroleum wax candles Aug. 28, 1986 Iron construction castings May 9, 1986 Barium chloride Oct. 17, 1984 Chloropicrin Mar. 22, 1984
Potassium permanganate Jan. 31, 1984
Finland Carboxymethylcellulose July 11, 2005 France Low-enriched uranium Feb. 13, 2002
218

219
Country Commodity Effective date of original action
Brass sheet and strip Mar. 6, 1987 Germany Lightweight thermal paper Nov. 24, 2008
Sodium nitrite Aug. 27, 2008 Seamless pipe Aug. 3, 1995 Brass sheet and strip Mar. 6, 1987
India Commodity matchbooks Dec. 11, 2009 HEDP Apr. 28, 2009 Certain lined paper school supplies Sept. 28, 2006 Frozen or canned warmwater shrimp and prawns Feb. 1, 2005 Carbazole violet pigment 23 Dec. 29, 2004 Prestressed concrete steel wire strand Jan. 28, 2004 Polyethylene terephthalate (PET) film July 1, 2002 Silicomanganese May 23, 2002 Hot-rolled carbon steel flat products Dec. 3, 2001 Carbon steel plate Feb. 10, 2000 Preserved mushrooms Feb. 19, 1999 Stainless steel bar Feb. 21, 1995 Stainless steel wire rod Dec. 1, 1993 Sulfanilic acid Mar. 2, 1993 Welded carbon-steel pipe May 12, 1986
Indonesia Coated paper suitable for high-quality print graphics using sheet-fed presses Nov. 11, 2010 Polyethylene retail carrier bags May 4, 2010 Carbon and certain alloy steel wire rod Oct. 29, 2002 Hot-rolled carbon steel flat products Dec. 3, 2001 Steel concrete reinforcing bars Sept. 7, 2001 Carbon steel plate Feb. 10, 2000 Preserved mushrooms Feb. 19, 1999
Iran Raw in-shell pistachios July 17, 1986 Italy Stainless steel butt-weld pipe fittings Feb. 23, 2001
Stainless steel wire rod Sept. 15, 1998 Pasta July 24, 1996 Granular polytetrafluoroethylene resin Aug. 30, 1988 Brass sheet and strip Mar. 6, 1987 Pressure-sensitive plastic tape Oct. 21, 1977
Japan Polyvinyl alcohol July 2, 2003 Welded large-diameter line pipe Dec. 6, 2001 Tin- and chromium-coated steel sheet Aug. 28, 2000 Large-diameter seamless pipe June 26, 2000 Small-diameter seamless pipe June 26, 2000 Stainless steel sheet and strip July 27, 1999 Stainless steel wire rod Sept. 15, 1998 Clad steel plate July 2, 1996 Stainless steel bar Feb. 21, 1995 Gray portland cement and clinker May 10, 1991 Brass sheet and strip Aug. 12, 1988 Carbon steel butt-weld pipe fittings Feb. 10, 1987 Prestressed concrete steel wire strand Dec. 8, 1978
Kazakhstan Silicomanganese May 23, 2002 Korea Large residential washers Feb. 15, 2013
Large power transformers Aug. 31, 2012 Light-walled rectangular pipe and tube Aug. 5, 2008 Prestressed concrete steel wire strand Jan. 28, 2004 Polyvinyl alcohol Oct. 1, 2003 Polyester staple fiber May 25, 2000 Carbon steel plate Feb. 10, 2000 Stainless steel sheet and strip July 27, 1999 Stainless steel plate in coils May 21, 1999
219

220
Country Commodity Effective date of original action
Stainless steel wire rod Sept. 15, 1998 Welded ASTM A-312 stainless steel pipe Dec. 30, 1992 Circular welded non-alloy steel pipe Nov. 2, 1992
Latvia Steel concrete reinforcing bars Sept. 7, 2001 Malaysia Polyethylene retail carrier bags Aug. 9, 2004
Stainless steel butt-weld pipe fittings Feb. 23, 2001 Mexico Large residential washers Feb. 15, 2013
Seamless refined copper pipe and tube Nov. 22, 2010 Magnesia carbon bricks Sept. 20, 2010 Light-walled rectangular pipe and tube Aug. 5, 2008 Prestressed concrete steel wire strand Jan. 28, 2004 Carbon and certain alloy steel wire rod Oct. 29, 2002 Fresh tomatoes (suspended) Nov. 1, 1996 Circular welded non-alloy steel pipe Nov. 2, 1992
Moldova Carbon and certain alloy steel wire rod Oct. 29, 2002 Steel concrete reinforcing bars Sept. 7, 2001
Netherlands Carboxymethylcellulose July 11, 2005 Philippines Stainless steel butt-weld pipe fittings Feb. 23, 2001 Poland Steel concrete reinforcing bars Sept. 7, 2001 Romania Small-diameter seamless pipe Aug. 10, 2000 Russia Silicon metal Mar. 26, 2003
Ammonium nitrate (suspended) May 19, 2000 Hot-rolled carbon steel flat products (suspended) July 12, 1999 Carbon steel plate (suspended) Oct. 24, 1997 Uranium (suspended) Oct. 16, 1992 Solid urea July 14, 1987
South Africa Uncovered innerspring units Dec. 11, 2008 Ferrovanadium Jan. 28, 2003 Stainless steel plate in coils May 21, 1999
Spain Chlorinated isocyanurates June 24, 2005 Stainless steel wire rod Sept. 15, 1998 Stainless steel bar Mar. 2, 1995
Taiwan Steel wire garment hangers Dec. 10, 2012 Stilbenic optical brightening agent May 10, 2012 Polyvinyl alcohol Mar. 15, 2011 Narrow woven ribbons Sept. 1, 2010 Polyethylene retail carrier bags May 4, 2010 Raw flexible magnets Sept. 17, 2008 Polyethylene terephthalate (PET) film July 1, 2002 Hot-rolled carbon steel flat products Nov. 29, 2001 Polyester staple fiber May 25, 2000 Stainless steel sheet and strip July 27, 1999 Stainless steel plate in coils May 21, 1999 Stainless steel wire rod Sept. 15, 1998 Helical spring lockwashers June 28, 1993 Welded ASTM A-312 stainless steel pipe Dec. 30, 1992 Circular welded non-alloy steel pipe Nov. 2, 1992 Light-walled rectangular pipe Mar. 27, 1989 Carbon steel butt-weld pipe fittings Dec. 17, 1986 Small-diameter carbon steel pipe May 7, 1984
Thailand Frozen or canned warmwater shrimp and prawns Feb. 1, 2005 Polyethylene retail carrier bags Aug. 9, 2004 Prestressed concrete steel wire strand Jan. 28, 2004 Hot-rolled carbon steel flat products Nov. 29, 2001 Carbon steel butt-weld pipe fittings July 6, 1992 Welded carbon steel pipe Mar. 11, 1986
220

221
Country Commodity Effective date of original action
Trinidad & Tobago Carbon and certain alloy steel wire rod Oct. 29, 2002 Turkey Light-walled rectangular pipe and tube May 30, 2008
Pasta July 24, 1996 Welded carbon steel pipe May 15, 1986
Ukraine Carbon and certain alloy steel wire rod Oct. 29, 2002 Hot-rolled carbon steel flat products Nov. 29, 2001 Silicomanganese Sept. 17, 2001 Ammonium nitrate Sept. 12, 2001 Steel concrete reinforcing bars Sept. 7, 2001 Carbon steel plate (suspended) Oct. 24, 1997 Solid urea July 14, 1987
United Arab Emirates Steel nails May 10, 2012 Polyethylene terephthalate film, sheet, and strip Nov. 10, 2008
Venezuela Silicomanganese May 23, 2002 Vietnam Utility-scale wind towers Feb. 15, 2013
Steel wire garment hangers Feb. 5, 2013 Polyethylene retail carrier bags May 4, 2010 Uncovered innerspring units Dec. 11, 2008 Frozen or canned warmwater shrimp and prawns Feb. 1, 2005 Frozen fish fillets Aug. 12, 2003
Source: U.S. International Trade Commission.
221

Table A.11 Countervailing duty cases active in 2013, by USITC investigation number USITC investigation number Product
Country of origin
Date of institution
USITC prelim
ITAa
prelim ITA final
USITC final
Date of final actionb
Affirmative = A; Negative = N 701-TA-486 Utility-scale wind towers China 12/29/2011 A A A A 2/8/2013 701-TA-487 Steel wire garment hangers Vietnam 12/29/2011 A A A A 1/28/2013 701-TA-488 Large residential washers Korea 12/30/2011 A A A A 2/8/2013 701-TA-489 Drawn stainless steel sinks China 3/1/2012 A A A A 4/4/2013 701-TA-490 Hardwood plywood China 9/27/2012 A A A N 11/25/2013 701-TA-491 Frozen warmwater shrimp China 12/28/2012 A A A N 10/21/2013 701-TA-492 Frozen warmwater shrimp Ecuador 12/28/2012 A N A N 10/21/2013 701-TA-493 Frozen warmwater shrimp India 12/28/2012 A A A N 10/21/2013 701-TA-494 Frozen warmwater shrimp Indonesia 12/28/2012 A N N (c) 8/19/2013 701-TA-495 Frozen warmwater shrimp Malaysia 12/28/2012 A A A N 10/21/2013 701-TA-496 Frozen warmwater shrimp Thailand 12/28/2012 A A N (c) 8/19/2013 701-TA-497 Frozen warmwater shrimp Vietnam 12/28/2012 A A A N 10/21/2013 701-TA-498 Steel threaded rod India 6/27/2013 A (d) (d) (d) (d) 701-TA-499 Oil country tubular goods India 7/2/2013 A (d) (d) (d) (d) 701-TA-500 Oil country tubular goods Turkey 7/2/2013 A (d) (d) (d) (d) 701-TA-501 Chlorinated isocyanurates China 8/29/2013 A (d) (d) (d) (d) 701-TA-502 Steel concrete rebar Turkey 9/4/2013 A (d) (d) (d) (d) 701-TA-503 Monosodium glumate China 9/16/2013 A (d) (d) (d) (d) 701-TA-504 Monosodium glumate Indonesia 9/16/2013 A (d) (d) (d) (d) 701-TA-505 Grain-oriented electrical steel China 9/18/2013 A (d) (d) (d) (d) 701-TA-506 Non-oriented electrical steel China 9/30/2013 A (d) (d) (d) (d) 701-TA-507 Non-oriented electrical steel Korea 9/30/2013 A (d) (d) (d) (d) 701-TA-508 Non-oriented electrical steel Taiwan 9/30/2013 A (d) (d) (d) (d) 701-TA-509 Tetrafluoroethane China 10/22/2013 A (d) (d) (d) (d) 701-TA-510 Calcium hypoclorite China 12/18/2013 (d) (d) (d) (d) (d) 701-TA-511 Crystalline silicon photovoltaic products China 12/31/2013 (d) (d) (d) (d) (d) Source: U.S. International Trade Commission. aInternational Trade Administration, USDOC. bFor cases in which the final action was taken by the ITA, the date shown is the Federal Register notice date of that action. For cases in which the final action was taken by USITC, the date of the USITC notification of USDOC is shown. cNot applicable. dPending as of December 31, 2013.
222

Table A.12 Countervailing duty orders in effect as of December 31, 2013
Country Commodity Effective date of original action
Brazil Carbon and certain alloy steel wire rod Oct. 22, 2002 Heavy iron construction castings May 15, 1986
China Utility-scale wind towers Feb. 15, 2013 Drawn stainless steel sinks April 11, 2013 Crystalline silicon photovoltaic cells Dec. 07, 2012 High pressure steel cylinders Jun. 21, 2012 Multilayered wood flooring Dec. 8, 2011 Aluminum extrusions May 26, 2011 Drill pipe and drill collars Mar. 3, 2011 Seamless refined copper pipe and tube Nov. 22, 2010 Coated paper Nov. 17, 2010 Seamless carbon and alloy steel standard, line, and pressure pipe Nov. 10, 2010 Magnesia carbon bricks Sept. 21, 2010 Narrow woven ribbons Sept. 1, 2010 Steel grating July 23, 2010 Potassium phosphate salts July 22, 2010 Prestressed concrete steel wire strand July 7, 2010 Oil country tubular goods Jan. 20, 2010 Citric acid and certain citric salts May 29, 2009 Kitchen appliance shelving and racks Sept. 14, 2009 Tow-behind lawn groomers Aug. 3, 2009 Welded stainless steel pressure pipe Mar. 19, 2009 Circular welded carbon-quality steel line pipe Jan. 23, 2009 Lightweight thermal paper Nov. 24, 2008 Raw flexible magnets Sept. 17, 2008 Off-the-road tires Sept. 4, 2008 Sodium nitrite Aug. 27, 2008 Laminated woven sacks Aug. 7, 2008 Light-walled rectangular pipe and tube Aug. 5, 2008 Circular welded carbon-quality steel pipe July 22, 2008
India Commodity matchbooks Dec. 11, 2009 Lined paper school supplies Sept. 28, 2006 Carbazole violet pigment 23 Dec. 29, 2004 Prestressed concrete steel wire strand Feb. 4, 2004 Polyethylene terephthalate (PET) film July 1, 2002 Hot-rolled carbon steel flat products Dec. 3, 2001 Carbon steel plate Feb. 10, 2000 Sulfanilic acid Mar. 2, 1993
Indonesia Coated paper Nov. 17, 2010 Hot-rolled carbon steel flat products Dec. 3, 2001 Carbon steel plate Feb. 10, 2000
Iran Roasted in-shell pistachios Oct. 7, 1986 Raw in-shell pistachios Mar. 11, 1986
Italy Pasta July 24, 1996 Korea Large residential washers Feb. 15, 2013
Carbon steel plate Feb. 10, 2000 Stainless steel sheet and strip Aug. 6, 1999
South Africa Stainless steel plate in coils May 11, 1999 Thailand Hot-rolled carbon steel flat products Dec. 3, 2001 Turkey Pasta July 24, 1996
Welded carbon steel pipe Mar. 7, 1986 Vietnam Polyethylene retail carrier bags May 4, 2010
Steel wire garment hangers Feb. 5, 2013 Source: U.S. International Trade Commission.
223

Table A.13 Reviews of existing antidumping and countervailing duty orders completed in 2013, by date of completion USITC investigation number Product
Country of origin
Completion datea Action
731-TA-739 Clad steel plate Japan Continued 1/28/2013 731-TA-1103 Activated carbon China Continued 2/22/22013 701-TA-350 Corrosion-resistant carbon steel Korea Revoked 3/5/2013 731-TA-616 Corrosion-resistant carbon steel Germany Revoked 3/5/2013 731-TA-618 Corrosion-resistant carbon steel Korea Revoked 3/5/2013 731-TA-894 Ammonium nitrate Ukraine Continued 5/24/2013 731-TA-1110 Sodium hexametaphosphate China Continued 6/28/2013 731-TA-873 Steel concrete reinforcing bar Belarus Continued 7/2/2013 731-TA-874 Steel concrete reinforcing bar China Continued 7/2/2013 731-TA-875 Steel concrete reinforcing bar Indonesia Continued 7/2/2013 731-TA-878 Steel concrete reinforcing bar Latvia Continued 7/2/2013 731-TA-879 Steel concrete reinforcing bar Moldova Continued 7/2/2013 731-TA-880 Steel concrete reinforcing bar Poland Continued 7/2/2013 731-TA-882 Steel concrete reinforcing bar Ukraine Continued 7/2/2013 731-TA-1105 Lemon juice Argentina Continued 7/26/2013 731-TA-1106 Lemon juice Mexico Revoked 7/26/2013 701-TA-365 Pasta Italy Continued 8/30/2013 701-TA-366 Pasta Turkey Continued 8/30/2013 731-TA-734 Pasta Italy Continued 8/30/2013 731-TA-735 Pasta Turkey Continued 8/30/2013 731-TA-929 Silicomanganese India Continued 9/18/2013 731-TA-930 Silicomanganese Kazakhstan Continued 9/18/2013 731-TA-931 Silicomanganese Venezuela Continued 9/18/2013 731-TA-919 Welded large-diameter line pipe Japan Continued 9/26/2013 701-TA-447 Circular welded carbon-quality pipe China Continued 11/18/2013 731-TA-116 Circular welded carbon-quality pipe China Continued 11/18/2013 Source: U.S. International Trade Commission. aThe completion date shown is the date of the USITC notification of USDOC.
224

Table A.14 Section 337 investigations and related proceedings completed by the U.S. International Trade Commission during 2013 and those pending on December 31, 2013 Status of investigation Article Countrya Commission determinationb Completed: 337-TA-562 Certain Incremental Dental Positioning Adjustment
Appliances and Methods of Producing Same British Virgin Islands, Pakistan One related (ancillary) enforcement proceeding;
terminated based on a finding of no violation. 337-TA-659 Certain Prepregs, Laminates, and Finished Circuit Boards Taiwan, Hong Kong, China One related (ancillary) enforcement proceeding;
terminated based on a settlement agreement. 337-TA-666 Certain Cold Cathode Fluorescent Lamp (CCFL) Inverter
Circuits and Products Containing Same Taiwan, Korea One related (ancillary) modification proceeding;
terminated based on a modification to a consent order.
337-TA-710 Certain Personal Data and Mobile Communications Devices and Related Software
Taiwan One related (ancillary) enforcement proceeding; terminated based on a settlement agreement.
337-TA-739 Certain Ground Fault Circuit Interrupters and Products Containing Same
China One related (ancillary) enforcement proceeding; issued cease and desist orders.
337-TA-744 Certain Mobile Devices, Associated Software, and Components Thereof
No foreign respondents One related (ancillary) bond forfeiture and one related (ancillary) bond return proceeding; terminated as premature.
337-TA-745 Certain Wireless Communication Devices, Portable Music and Data Processing Devices, Computers and Components Thereof
No foreign respondents Terminated based on a finding of no violation.
337-TA-746 Certain Automated Media Library Devices Germany, China, Mexico Terminated based on a finding of no violation. 337-TA-752 Certain Gaming and Entertainment Consoles, Related
Software, and Components Thereof No foreign respondents Terminated based on a finding of no violation.
337-TA-770 Certain Video Game Systems and Wireless Controllers and Components Thereof
Japan Terminated based on a finding of no violation.
337-TA-781 Certain Microprocessors, Components Thereof, and Products Containing Same
Costa Rica, Malaysia, Philippines, China
Terminated based on a finding of no violation.
337-TA-791 (consolidated with 337-TA-826)
Certain Electric Fireplaces, Components Thereof, Manuals for Same, Certain Processes For Manufacturing or Relating to Same and Certain Products Containing Same
China Issued limited exclusion order.
337-TA-792 Certain Static Random Access Memories and Products Containing Same
France, Sweden, Netherlands Terminated based on a finding of no violation.
337-TA-794 Certain Electronic Devices, Including Wireless Communication Devices, Portable Music and Data Processing Devices, and Tablet Computers
No foreign respondents Terminated based on disapproval of limited exclusion order and cease and desist order by the USTR.
337-TA-796 Certain Electronic Digital Media Devices and Components Thereof
Korea Issued limited exclusion order and cease and desist orders.
337-TA-797 Certain Portable Electronic Devices and Related Software Taiwan Terminated based on a settlement agreement. 337-TA-804 Certain LED Photographic Lighting Devices and Components
Thereof China, Taiwan Issued general exclusion order.
337-TA-805 Certain Devices for Improving Uniformity Used in a Backlight Module and Components Thereof and Products Containing the Same
Korea Terminated based on a finding of no violation.
225

Status of investigation Article Countrya Commission determinationb 337-TA-807 Certain Digital Photo Frames and Image Display Devices and
Components Thereof Taiwan, Canada, Japan Issued limited exclusion order and cease and
desist orders. 337-TA-808 Certain Electronic Devices with Communication Capabilities,
Components Thereof, and Related Software No foreign respondents Terminated based on a settlement agreement.
337-TA-812 Certain Computing Devices with Associated Instruction Sets and Software
No foreign respondents Terminated based on a settlement agreement.
337-TA-813 Certain Electronic Devices with Graphics Data Processing Systems, Components Thereof, and Associated Software
No foreign respondents Terminated based on a settlement agreement.
337-TA-819 Certain Semiconductor Chips with DRAM Circuitry, and Modules and Products Containing Same
Taiwan Terminated based on a settlement agreement.
337-TA-820 Certain Products Containing Interactive Program Guide and Parental Controls Technology
China Terminated based on a settlement agreement.
337-TA-823 Certain Kinesiotherapy Devices and Components Thereof Sweden, China, Netherlands Issued general exclusion order and cease and desist orders.
337-TA-824 Certain Blu-Ray Disc Players, Components Thereof and Products Containing Same
Japan, China, Korea Terminated based on a settlement agreement.
337-TA-825 Certain Silicon Microphone Packages and Products Containing Same
No foreign respondents Terminated based on a settlement agreement.
337-TA-826 (consolidated with 337-TA-791)
Certain Electric Fireplaces, Components Thereof, Manuals for Same, Certain Processes for Manufacturing or Relating to Same and Certain Products Containing Same
China Issued a limited exclusion order.
337-TA-828 Certain Video Displays and Products Using and Containing Same
Taiwan Terminated based on a settlement agreement.
337-TA-829 Certain Toner Cartridges and Components Thereof Vietnam, Mexico, China, Hong Kong, Canada
Issued a general exclusion order and cease and desist orders.
337-TA-830 Certain Dimmable Compact Fluorescent Lamps and Products Containing Same
China Terminated based on a settlement agreement and withdrawal of the complaint.
337-TA-831 Certain Electronic Devices for Capturing and Transmitting Images, and Components Thereof
Taiwan Terminated based on a settlement agreement.
337-TA-832 Certain Ink Application Devices and Components Thereof and Methods of Using the Same
Canada, China Issued a limited exclusion order.
337-TA-834 Certain Mobile Electronic Devices Incorporating Haptics Taiwan Terminated based on withdrawal of the complaint. 337-TA-836 Certain Consumer Electronics and Display Devices and
Products Containing Same Canada, Taiwan, Korea, Japan, Sweden
Terminated based on a settlement agreement.
337-TA-838 Certain Food Waste Disposers and Components and Packaging Thereof
No foreign respondents Terminated based on withdrawal of the complaint.
337-TA-839 Certain Consumer Electronics, Including Mobile Phones and Tablets
Taiwan, Korea, Canada Terminated based on a settlement agreement.
337-TA-841 Certain Computers and Computer Peripheral Devices and Components Thereof and Products Containing the Same
Taiwan, Japan, France, Korea Terminated based on a finding of no violation.
337-TA-854 Certain Two-Way Global Satellite Communication Devices, System and Components Thereof
United Kingdom Terminated based on a consent order.
226

Status of investigation Article Countrya Commission determinationb 337-TA-855 Certain Sintered Rare Earth Magnets, Methods of Making
Same and Products Containing Same China, Hong Kong, Austria, Germany Terminated based on a settlement agreement.
337-TA-857 Certain Reduced Folate Nutraceutical Products and L-Methylfolate Raw Ingredients Used Therein
Italy, Switzerland Terminated based on withdrawal of the complaint.
337-TA-858 Certain Devices with Secure Communication Capabilities, Components Thereof, and Products Containing Same
No foreign respondents Terminated based on withdrawal of the complaint.
337-TA-863 Certain Paper Shredders, Certain Processes for Manufacturing or Relating to Same and Certain Products Containing Same and Certain Parts Thereof
China, Hong Kong Terminated based on a settlement agreement.
337-TA-864 Certain Mobile Handset Devices and Related Touch Keyboard Software
China Terminated based on a settlement agreement.
337-TA-865 Certain Balloon Dissection Devices and Products Containing Same
Germany Terminated based on a consent order.
337-TA-869 Certain Robotic Toys and Components Thereof British Virgin Islands, Hong Kong, New Zealand
Terminated based on a consent order.
337-TA-870 Certain Electronic Bark Control Collars No foreign respondents Terminated based on a settlement agreement. 337-TA-874 Certain Products Having Laminated Packaging, Laminated
Packaging, and Components Thereof France Terminated based on a finding of no violation.
337-TA-875 Certain Radio Frequency Identification (RFID) Products and Components Thereof
No foreign respondents Terminated based on a settlement agreement.
337-TA-878 Certain Electronic Devices Having Placeshifting or Display Replication Functionality and Products Containing Same
No foreign respondents Issued a limited exclusion order and cease and desist orders.
337-TA-879 Certain Sleep-Disordered Breathing Treatment Systems and Components Thereof
Taiwan Terminated based on a consent order.
337-TA-880 Certain Linear Actuators China Terminated based on withdrawal of the complaint. 337-TA-891 Certain Laundry and Household Cleaning Products and
Related Packaging Mexico Terminated based on a settlement agreement.
Pending: 337-TA-501 Certain Encapsulated Integrated Circuit Devices and
Products Containing Same Malaysia One related (ancillary) remand proceeding;
pending before the Commission. 337-TA-613 Certain 3G Mobile Handsets and Components Thereof Finland One related (ancillary) remand proceeding;
pending before the Commission. 337-TA-641 Certain Variable Speed Wind Turbines and Components
Thereof Japan One related (ancillary) remand proceeding;
pending before the Commission. 337-TA-739 Certain Ground Fault Circuit Interrupters and Products
Containing Same China One related (ancillary) bond return proceeding
and one related (ancillary) advisory proceeding; pending before the Commission.
337-TA-750 Certain Mobile Devices and Related Software No foreign respondents One related (ancillary) remand proceeding; pending before the Commission.
337-TA-796 Certain Electronic Digital Media Devices and Components Thereof
Korea One related (ancillary) bond return proceeding; pending before the ALJ.
227

Status of investigation Article Countrya Commission determinationb 337-TA-800 Certain Wireless Devices with 3G Capabilities and
Components Thereof China, Finland Pending before the Commission.
337-TA-816 Certain Wiper Blades Korea, China, Taiwan Pending before the ALJ. 337-TA-823 Certain Kinesiotherapy Devices and Components Thereof Sweden, China, Netherlands One related (ancillary) advisory proceeding;
pending before the Commission. 337-TA-830 Certain Dimmable Compact Fluorescent Lamps and Products
Containing Same China One related (ancillary) enforcement proceeding
and one related (ancillary) modification proceeding; pending before the ALJ.
337-TA-833 Certain Digital Models, Digital Data, and Treatment Plans for Use in Making Incremental Dental Positioning Adjustment Appliances, the Appliances Made Therefrom, and Methods of Making the Same
Pakistan Pending before the Commission.
337-TA-837 Certain Audiovisual Components and Products Containing the Same
Japan, Taiwan Pending before the Commission.
337-TA-847 Certain Electronic Devices, Including Mobile Phones and Tablet Computers, and Components Thereof
Taiwan Pending before the Commission.
337-TA-849 Certain Rubber Resins and Processes for Manufacturing Same
China, Hong Kong, Canada Pending before the Commission.
337-TA-850 Electronic Imaging Devices Taiwan, Korea, China Pending before the Commission. 337-TA-853 Certain Wireless Consumer Electronics Devices and
Components Thereof Taiwan, Switzerland, China, Japan, Korea, Canada
Pending before the Commission.
337-TA-854 Certain Two-Way Global Satellite Communication Devices, System and Components Thereof
United Kingdom One related (ancillary) enforcement proceeding; pending before the ALJ.
337-TA-859 Certain Integrated Circuit Chips and Products Containing the Same
No foreign respondents Pending before the ALJ.
337-TA-860 Certain Optoelectronic Devices for Fiber Optic Communications, Components Thereof, and Products Containing the Same
Denmark, Germany, France, Israel Pending before the Commission.
337-TA-861 (consolidated with 337-TA-867)
Certain Cases for Portable Electronic Devices China, Taiwan, Hong Kong Pending before the ALJ.
337-TA-862 Certain Electronic Devices, Including Wireless Communication Devices, Tablet Computers, Media Players, and Televisions, and Components Thereof
Korea Pending before the ALJ.
337-TA-866 Certain Wireless Communications Equipment and Articles Therein
Sweden Pending before the ALJ.
337-TA-867 (consolidated with 337-TA-861)
Certain Cases for Portable Electronic Devices China, Taiwan Pending before the ALJ.
337-TA-868 Certain Wireless Devices with 3G and/or 4G Capabilities and Components Thereof
China, Finland, Korea Pending before the ALJ.
337-TA-871 Certain Wireless Communications Base Stations and Components Thereof
Sweden Pending before the Commission.
337-TA-872 Compact Fluorescent Reflector Lamps, Products Containing Same and Components Thereof
No foreign respondents Pending before the ALJ.
228

Status of investigation Article Countrya Commission determinationb 337-TA-873 Certain Integrated Circuit Devices and Products Containing
the Same Taiwan, Korea, Finland Pending before the ALJ.
337-TA-876 Certain Microelectromechanical Systems (MEMs Devices) and Products Containing Same
No foreign respondents Pending before the ALJ.
337-TA-877 Certain Omega-3 Extracts from Marine or Aquatic Biomass and Products Containing the Same
Norway, Israel, New Zealand, Canada
Pending before the ALJ.
337-TA-879 Certain Sleep-Disordered Breathing Treatment Systems and Components Thereof
Taiwan One related (ancillary) advisory proceeding; pending before the ALJ.
337-TA-881 Certain Windshield Wiper Devices and Components Thereof Mexico Pending before the ALJ. 337-TA-882 Certain Digital Media Devices, Including Televisions,
Blu-Ray Disc Players, Home Theater Systems, Tablets and Mobile Phones, Components Thereof and Associated Software
Korea, Japan Pending before the ALJ.
337-TA-883 Certain Opaque Polymers Turkey, Netherlands Pending before the ALJ. 337-TA-884 Certain Consumer Electronics with Display and Processing
Capabilities China, Japan, Taiwan Pending before the ALJ.
337-TA-885 Certain Portable Electronic Communications Devices, Including Mobile Phones and Components Thereof
Taiwan Pending before the ALJ.
337-TA-886 Certain TV Programs, Literary Works for TV Production and Episode Guides Pertaining to Same
Canada Pending before the ALJ.
337-TA-887 Certain Crawler Cranes and Components Thereof China Pending before the ALJ. 337-TA-888 Certain Silicon Microphone Packages and Products
Containing Same China Pending before the ALJ.
337-TA-889 Certain Wireless Devices, Including Mobile Phones and Tablets
Korea Pending before the ALJ.
337-TA-890 Certain Sleep-Disordered Breathing Treatment Systems and Components Thereof
China Pending before the ALJ.
337-TA-892 Certain Point-to Point Network Communication Devices and Products Containing Same
Taiwan, Korea, Japan, Sweden Pending before the ALJ.
337-TA-893 Certain Flash Memory Chips and Products Containing Same Taiwan, Japan, Hong Kong Pending before the ALJ. 337-TA-894 Certain Tires and Products Containing Same China, Thailand Pending before the ALJ. 337-TA-895 Certain Multiple Mode Outdoor Grills and Parts Thereof China, Hong Kong Pending before the ALJ. 337-TA-896 Certain Thermal Support Devices for Infants, Infant
Incubators, Infant Warmers, and Components Thereof Japan Pending before the ALJ.
337-TA-897 Certain Optical Disc Drives, Components Thereof, and Products Containing the Same
Hong Kong, Korea, Japan, Taiwan Pending before the ALJ.
337-TA-898 Certain Marine Sonar Imaging Devices, Products Containing the Same, and Components Thereof
Hong Kong, United Kingdom Pending before the ALJ.
337-TA-899 Certain Vision-Based Driver Assistance System Cameras and Components Thereof
No foreign respondents Pending before the ALJ.
337-TA-900 Certain Navigation Products, Including GPS Devices, Navigation and Display Systems, Radar Systems, Navigational Aids, Mapping Systems and Related Software
Switzerland, Norway, United Kingdom
Pending before the ALJ.
229

Status of investigation Article Countrya Commission determinationb 337-TA-901 Certain Handheld Magnifiers and Products Containing
Same China Pending before the ALJ.
337-TA-902 Certain Windshield Wipers and Components Thereof Belgium Pending before the ALJ. 337-TA-903 Certain Antivenom Compositions and Products Containing
the Same Mexico Pending before the ALJ.
Source: U.S. International Trade Commission. aThe country designation is based on the address of the foreign respondents named in the notice of investigation. "Hong Kong” refers to "Hong Kong, China”; “Korea” refers to “Republic of Korea.” bALJ stands for Administrative Law Judge.
230

Table A.15 Outstanding Section 337 exclusion orders as of December 31, 2013 Investigation no. Article Countrya Date patent expiresb 337-TA-55 Certain Novelty Glasses Hong Kong Nonpatent 337-TA-69 Certain Airtight Cast-Iron Stoves Taiwan, Korea Nonpatent 337-TA-87 Certain Coin-Operated Audio-Visual Games and Components
Thereof Japan, Taiwan Nonpatent
337-TA-105 Certain Coin-Operated Audio-Visual Games and Components Thereof (viz. Rally-X and Pac-Man)
Japan, Taiwan Nonpatent
337-TA-112 Certain Cube Puzzles Taiwan, Japan, Canada
Nonpatent
337-TA-114 Certain Miniature Plug-In Blade Fuses Taiwan Nonpatent 337-TA-118 Certain Sneakers with Fabric Uppers and Rubber Soles Korea Nonpatent 337-TA-137 Certain Heavy-Duty Staple Gun Tackers Taiwan, Hong Kong Nonpatent 337-TA-152 Certain Plastic Food Storage Containers Hong Kong, Taiwan Nonpatent 337-TA-167 Certain Single Handle Faucets Taiwan Nonpatent 337-TA-174 Certain Woodworking Machines Taiwan,
South Africa Nonpatent
337-TA-195 Certain Cloisonne Jewelry Taiwan Nonpatent 337-TA-197 Certain Compound Action Metal Cutting Snips and
Components Thereof Taiwan Nonpatent
337-TA-229 Certain Nut Jewelry and Parts Thereof Taiwan Nonpatent 337-TA-231 Certain Soft Sculpture Dolls, Popularly Known as "Cabbage
Patch Kids," Related Literature, and Packaging Therefor No foreign respondents
Nonpatent
337-TA-266 Certain Reclosable Plastic Bags and Tubing Singapore, Taiwan, Korea, Thailand, Hong Kong
Nonpatent
337-TA-279 Certain Plastic Light Duty Screw Anchors Taiwan Nonpatent 337-TA-285 Certain Chemiluminescent Compositions and Components
Thereof and Methods of Using, and Products Incorporating, the Same
France Nonpatent
337-TA-287 Certain Strip Lights Taiwan Nonpatent 337-TA-295 Certain Novelty Teleidoscopes Hong Kong Nonpatent 337-TA-319 Certain Automotive Fuel Caps and Radiator Caps and Related
Packaging and Promotional Materials Taiwan Nonpatent
337-TA-321 Certain Soft Drinks and Their Containers Colombia Nonpatent 337-TA-378 Certain Asian-Style Kamaboko Fish Cakes Japan Nonpatent 337-TA-380 Certain Agricultural Tractors under 50 Power Take-Off
Horsepower Japan Nonpatent
337-TA-413 Certain Rare-Earth Magnets and Magnetic Material and Articles Containing Same
Taiwan July 8, 2014
337-TA-424 Certain Cigarettes and Packaging Thereof No foreign respondents
Nonpatent
337-TA-440 Certain 4-Androstenediol China July 13, 2018 337-TA-448 Certain Oscillating Sprinklers, Sprinkler Components, and
Nozzles Taiwan, Israel, Germany
July 8, 2014 July 8, 2014
337-TA-473 Certain Video Game Systems, Accessories, and Components Thereof
No foreign respondents
Dec. 18, 2015 Dec. 25, 2015
337-TA-481/491 Certain Display Controllers with Upscaling Functionality and Products Containing Same; and Certain Display Controllers and Products Containing Same
Taiwan Feb. 24, 2017
337-TA-482 Certain Compact Disc and DVD Holders Denmark, Hong Kong, Taiwan
May 1, 2015
337-TA-486 Certain Agricultural Tractors, Lawn Tractors, Riding Lawnmowers, and Components Thereof
China Nonpatent
337-TA-487c Certain Agricultural Vehicles and Components Thereof China, Netherlands, France, Germany, Canada
Nonpatent
231

Investigation no. Article Countrya Date patent expiresb 337-TA-494 Certain Automotive Measuring Devices, Products Containing
Same, and Bezels for Such Devices Taiwan Nonpatent
337-TA-498 Certain Insect Traps No foreign respondents
Jan. 30, 2018
337-TA-500 Certain Purple Protective Gloves Malaysia Nonpatent 337-TA-505 Certain Gun Barrels Used in Firearms Training Systems Switzerland,
Netherlands Sept. 25, 2015 Aug. 25, 2017
337-TA-512 Certain Light-Emitting Diodes and Products Containing Same Malaysia Jan. 18, 2015 Sept. 22, 2017 Sept. 22, 2017 Sept. 22, 2017 Sept. 22, 2017 Sept. 22, 2017 July 27, 2018 July 27, 2018 July 27, 2018
337-TA-514 Certain Plastic Food Containers China Dec. 23, 2017 Dec. 23, 2017
337-TA-518 Certain Ear Protection Devices China, Taiwan June 2, 2015 337-TA-522 Certain Ink Markers and Packaging Thereof China, India, Korea,
Hong Kong Nonpatent
337-TA-539 Certain Tadalafil or Any Salt or Solvate Thereof, and Products Containing Same
India, Panama, Haiti, Nicaragua, Mexico, Australia
June 12, 2016
337-TA-541 Certain Power Supply Controllers and Products Containing Same
Taiwan Sept. 24, 2019 Sept. 24, 2019
337-TA-545 Certain Laminated Floor Panels Canada, Netherlands, China, Malaysia
June 10, 2017 June 10, 2017 June 10, 2017
337-TA-549 Certain Ink Sticks for Solid Ink Printers Korea Apr. 29, 2022 Apr. 29, 2022 Apr. 29, 2022
337-TA-557 Certain Automotive Parts Taiwan June 22, 2018 July 27, 2018 Sept. 28, 2018 Oct. 5, 2018 Oct. 26, 2018 Mar. 1, 2019 Mar. 22, 2019
337-TA-563 Certain Portable Power Stations and Packaging Thereof China Feb. 4, 2017 Nonpatent Nonpatent
337-TA-565 Certain Ink Cartridges and Components Thereof Hong Kong, China, Germany, Korea
Apr. 1, 2014 May 18, 2019 May 18, 2019 Apr. 3, 2022 Aug. 17, 2023 Aug. 26, 2023
337-TA-567 Certain Foam Footwear Canada Oct. 3, 2020 Mar. 28, 2020
337-TA-575 Certain Lighters Hong Kong, China Nonpatent 337-TA-582 Certain Hydraulic Excavators and Components Thereof Canada Nonpatent 337-TA-588 Certain Digital Multimeters, and Products with Multimeter
Functionality Hong Kong, China Nonpatent
337-TA-590 Certain Coupler Devices for Power Supply Facilities, Components Thereof, and Products Containing Same
Taiwan, Germany, China
Aug. 5, 2024
232

Investigation no. Article Countrya Date patent expiresb 337-TA-603 Certain DVD Players and Recorders and Certain Products
Containing Same China, Hong Kong Dec. 23, 2014
Jan. 18, 2015 Jan. 30, 2016
337-TA-604 Certain Sucralose, Sweeteners Containing Sucralose, and Related Intermediate Compounds Thereof
China, United Kingdom, Hong Kong
Oct. 17, 2017 Apr. 18, 2023
337-TA-611 Certain Magnifying Loupe Products and Components Thereof China May 20, 2022 337-TA-615 Certain Ground Fault Circuit Interrupters and Products
Containing the Same China Oct. 24, 2014
Nov. 21, 2020 May 3, 2021 Apr. 28, 2025
337-TA-617 Certain Digital Televisions and Certain Products Containing Same and Methods of Using Same
Taiwan, Hong Kong, China
Apr. 9, 2018
337-TA-629 Certain Silicon Microphone Packages and Products Containing the Same
Malaysia June 21, 2021 Sept. 16, 2022
337-TA-637 Certain Hair Irons and Packaging Thereof Singapore, China, Hong Kong
Nonpatent
337-TA-638 Certain Intermediate Bulk Containers China Mar. 21, 2015 337-TA-643 Certain Cigarettes and Packaging Thereof Moldova, Belize,
Singapore, Ukraine, Kyrgyzstan, Gibraltar, United Kingdom, Switzerland
Nonpatent
337-TA-644 Certain Composite Wear Components and Products Containing the Same
India, Italy Aug. 27, 2017
337-TA-650d Certain Coaxial Cable Connectors and Components Thereof and Products Containing Same
Taiwan, China Sept. 12, 2014 Aug. 2, 2017 Jan. 24, 2020
337-TA-655 Certain Cast Steel Railway Wheels, Certain Processes for Manufacturing or Relating to Same and Certain Products Containing Same
China Nonpatent
337-TA-678 Certain Energy Drink Products No foreign respondents
Nonpatent
337-TA-679 Certain Products Advertised As Containing Creatine Ethyl Ester
No foreign respondents
Nonpatent
337-TA-691 Certain Inkjet Ink Supplies and Components Thereof China, Hong Kong Mar. 9, 2018 May 11, 2018
337-TA-700 Certain MEMS Devices and Products Containing Same No foreign respondents
Jan. 29, 2021
337-TA-710 Certain Personal Data and Mobile Communication Devices and Related Software
Taiwan Feb. 1, 2016
337-TA-718 Certain Electronic Paper Towel Dispensing Devices and Components Thereof
Canada, Hong Kong, Taiwan, Turkey
Feb. 9, 2021 Feb. 9, 2021 Mar.15, 2021 May 27, 2021
337-TA-720 Certain Biometric Scanning Devices, Components Thereof, Associated Software, and Products Containing the Same
Korea May 9, 2017 Jan. 16, 2023
337-TA-722 Certain Automotive Vehicles and Designs Therefore China Jan. 3, 2020 337-TA-723 Certain Inkjet Ink Cartridges with Printheads and Components
Thereof Taiwan, Hong Kong, China
Aug. 30, 2019 July 24, 2020 July 24, 2020 Oct. 30, 2020 Oct. 30, 2020
337-TA-725 Certain Caskets Mexico May 10, 2015 May 10, 2015 May 10, 2015 July 9, 2016 Sept. 13, 2020
233

Investigation no. Article Countrya Date patent expiresb 337-TA-730 Certain Inkjet Ink Supplies and Components Thereof Hong Kong, China Aug. 20, 2023
Oct. 29, 2023 337-TA-739 Certain Ground Fault Circuit Interrupters and Products
Containing Same China Oct. 21, 2023
337-TA-740 Certain Toner Cartridges and Components Thereof China, Hong Kong, Canada, Korea, Macao
Feb. 16, 2016 Feb. 16, 2016 Dec. 20, 2016 Dec. 20, 2016 Dec. 20, 2016 Dec. 20, 2016 Feb. 18, 2018 Sept. 22, 2019 July 18, 2021 July 15, 2022 July 15, 2022 Apr. 29, 2023 May 21, 2023 Dec. 19, 2024
337-TA-744 Certain Mobile Devices, Associated Software, and Components Thereof
No foreign respondents
Apr. 10, 2018
337-TA-754 Certain Handbags, Luggage, Accessories, and Packaging Thereof
China Nonpatent
337-TA-759 Certain Birthing Simulators and Associated Systems China May 8, 2016 May 8, 2016
337-TA-763 Certain Radio Control Hobby Transmitters and Receivers and Products Containing Same
China Oct. 18, 2025 Nonpatent
337-TA-776 Certain Lighting Control Devices Including Dimmer Switches and Parts Thereof
China June 10, 2014
337-TA-780 Certain Protective Cases and Components Thereof China, Hong Kong Sept. 29, 2023 June 15, 2024 May 11, 2024 June 15, 2024 Mar. 22, 2025 Apr. 19, 2025 Jan. 25, 2029 Nonpatent
337-TA-791/826 Certain Electric Fireplaces, Components Thereof, Manuals for Same, Certain Processes for Manufacturing or Relating to Same and Certain Products Containing Same; and Certain Electric Fireplaces, Components Thereof, Manuals for Same, Certain Processes for Manufacturing or Relating to Same and Certain Products Containing Same
China Nonpatent
337-TA-796 Certain Electronic Digital Media Devices and Components Thereof
Korea Sept. 6, 2026 Jan. 5, 2027
337-TA-804 Certain LED Photographic Lighting Devices and Components Thereof
China, Taiwan Dec. 7, 2021 Dec. 7, 2021
337-TA-807 Certain Digital Photo Frames and Image Display Devices and Components Thereof
Taiwan, Canada, Japan
July 6, 2020 Dec. 26, 2020 Oct. 29, 2021
337-TA-823 Certain Kinesiotherapy Devices and Components Thereof Sweden, China, Netherlands
Sept. 18, 2026
337-TA-829 Certain Toner Cartridges and Components Thereof Vietnam, Mexico, China, Hong Kong, Canada
March 26, 2016 March 26, 2016
337-TA-832 Certain Ink Application Devices and Components Thereof and Methods of Using the Same
Canada, China Feb. 28, 2020 Sept. 2, 2020
234

Investigation no. Article Countrya Date patent expiresb 337-TA-878 Certain Electronic Devices Having Placeshifting or Display
Replication Functionality and Products Containing Same No foreign respondents
May 26, 2019 May 26, 2019 June 7, 2025 June 7, 2025 June 7, 2025 May 1, 2029
Source: U.S. International Trade Commission. aThis column lists the countries of the foreign respondents named in the notice of investigation. bMultiple dates indicate the expiration dates of separate patents within the investigation. cThere are three outstanding exclusion orders in inv. no. 337-TA-487. dThere are three outstanding exclusion orders in inv. no. 337-TA-650.
235

Table A.16 U.S. imports for consumption under the GSP, by leading GSP beneficiary, 2011–13
Source 2011 2012 2013 % change 2012–13
Thousand $ India 3,736,156 4,453,874 4,222,999 -5.2 Thailand 3,719,574 3,709,582 3,341,136 -9.9 Brazil 2,059,096 2,317,083 2,306,520 -0.5 Indonesia 1,965,418 2,208,075 1,834,042 -16.9 Philippines 1,133,796 1,239,219 1,267,527 2.3 Turkey 894,703 1,139,221 1,213,494 6.5 South Africa 1,332,575 1,294,108 1,089,648 -15.8 Angola 300,237 631,683 710,350 12.5 Russia 574,780 543,880 465,868 -14.3 Pakistan 130,686 195,187 225,267 15.4 Ecuador 147,406 106,823 182,951 71.3 Sri Lanka 135,237 157,980 158,360 0.2 Bolivia 81,963 128,193 158,129 23.4 Tunisia 98,747 149,124 146,004 -2.1 Venezuela 115,914 98,573 110,262 11.9 Georgia 117,947 124,058 107,444 -13.4 Kazakhstan 93,322 111,379 93,597 -16.0 Uruguay 51,383 56,476 92,408 63.6 Armenia 79,539 80,600 86,784 7.7 Côte d’Ivoire 48,579 96,148 84,440 -12.2 Paraguay 77,117 69,685 78,972 13.3 Egypt 48,655 60,413 70,906 17.4 Lebanon 35,822 40,713 55,979 37.5 Ukraine 53,202 72,359 50,782 -29.8 Congo, Democratic Republic of the 691 93,704 50,155 -46.5
Subtotal, top 25 GSP beneficiaries 17,032,545 19,178,139 18,204,026 -5.1 All other beneficiaries 1,506,536 678,563 311,968 -54.0
Total U.S. imports for consumption under the GSP 18,539,081 19,856,702 18,515,994 -6.8 Source: Official trade statistics of the USDOC as maintained by the USITC. Note: Because of rounding, figures may not add to totals shown.
236

Table A.17 U.S. imports for consumption under the GSP, by USITC digest sectors, 2011–13 Sector Grouping Description 2011 2012 2013
% change 2012–13
Million $
U.S. imports for consumption: 1 Agricultural products 2,865 3,015 2,984 -1.0 2 Forest products 469 546 600 9.9 3 Chemicals and related products 4,047 4,216 3,700 -12.2 4 Energy-related products 482 724 711 -1.8 5 Textiles and apparel 631 611 570 -6.8 6 Footwear 1 1 4 295.7 7 Minerals and metals 4,177 4,300 3,897 -9.4 8 Machinery 1,816 2,115 2,092 -1.1 9 Transportation equipment 1,691 1,885 1,688 -10.4 10 Electronic products 730 853 959 12.5 11 Miscellaneous manufactures 1,630 1,591 1,310 -17.7
Total U.S. imports for consumption under the GSP 18,539 19,857 18,516 -6.8 Percent of total
Share of U.S. imports for consumption: 1 Agricultural products 15.5 15.2 16.1 2 Forest products 2.5 2.7 3.2 3 Chemicals and related products 21.8 21.2 20.0 4 Energy-related products 2.6 3.6 3.8 5 Textiles and apparel 3.4 3.1 3.1 6 Footwear 0.0 0.0 0.0 7 Minerals and metals 22.5 21.7 21.0 8 Machinery 9.8 10.7 11.3 9 Transportation equipment 9.1 9.5 9.1 10 Electronic products 3.9 4.3 5.2 11 Miscellaneous manufactures 8.8 8.0 7.1
Total U.S. imports for consumption under the GSP 100.0 100.0 100.0
Source: Official trade statistics of the USDOC as maintained by the USITC. Note: Because of rounding, figures may not add to totals shown.
237

Table A.18 Leading U.S. imports for consumption under the GSP, by HTS provision, 2011–13 HTS provision Description 2011 2012 2013
% change 2012–13
Million $ 2709.00 Petroleum oils and oils from bituminous minerals, crude 481 664 649 -2.3 4011.10 New pneumatic tires, of rubber, of a kind used on motor cars (including station wagons and racing cars) 421 575 345 -39.9 7113.19 Jewelry and parts thereof, of precious metal other than silver 248 335 333 -0.4 7202.41 Ferrochromium, containing more than 4% (weight) carbon 386 373 319 -14.4 1005.90 Corn (maize), other than seed corn 9 119 312 161.0 7606.12 Aluminum alloy rectangular (including square) plates, sheets and strip, over 0.2 mm thick 493 399 267 -33.1 8415.90 Parts, n.e.s.o.i., of air conditioning machines 126 193 262 36.2 4015.19 Gloves, mittens and mitts, other than surgical, of vulcanized rubber 224 250 239 -4.8 2106.90 Food preparations n.e.s.o.i. 262 224 211 -5.8 8708.99 Parts and accessories for motor vehicles, n.e.s.o.i. 261 260 205 -21.3 6802.99 Worked monumental or building stone n.e.s.o.i., of stone n.e.s.o.i. 86 145 196 34.9 2202.90 Nonalcoholic beverages, n.e.s.o.i. (including milk-based drinks and nonalcoholic beer) 91 149 185 23.9 7202.30 Ferrosilicon manganese 279 280 172 -38.7 7202.21 Ferrosilicon, containing more than 55% (weight) silicon 170 201 164 -18.3 2008.99 Fruit and other edible parts of plants, n.e.s.o.i., prepared or preserved, whether or not containing added sweetening
or spirit, n.e.s.o.i. 126 127 149 17.6
4412.31 Plywood n.e.s.o.i., not of bamboo, not over 6mm thickness with at least one outer ply of wood as specified in subheading note 1 to chapter 44
108 137 145 5.6
8481.80 Taps, cocks, valves and similar appliances for pipes, vats or the like, including thermostatically controlled valves, n.e.s.o.i.
157 176 145 -17.9
1704.90 Sugar confectionery (including white chocolate), not containing cocoa, n.e.s.o.i. 137 130 138 6.8 8483.10 Transmission shafts (including camshafts and crankshafts) and cranks 147 191 134 -29.6 7323.93 Table, kitchen or other household articles and parts thereof, of stainless steel 102 112 134 19.9 2934.10 Heterocyclic compounds containing an unfused triazole ring (whether or not hydrogenated) in the structure 38 85 133 57.0 7403.11 Refined copper cathodes and sections of cathodes 4 0 130 (a) 9001.50 Spectacle lenses of materials other than glass 97 96 128 33.8 3907.60 Polyethylene terephthalate, in primary forms 47 72 125 75.3 8708.94 Steering wheels, steering columns and steering boxes and parts thereof, for motor vehicles 75 104 125 19.8
Total of items shown 4,574 5,397 5,347 -0.9 All other HTS subheadings 13,965 14,459 13,169 -8.9
Total of all commodities 18,539 19,857 18,516 -6.8 Source: Official trade statistics of the USDOC as maintained by the USITC. Note: Because of rounding, figures may not add to totals shown. The abbreviation “n.e.s.o.i.” stands for “not elsewhere specified or included.” aUndefined.
238

Table A.19 U.S. imports for consumption under AGOA, by source, 2011–13
Source 2011 2012 2013 % change 2012–13
Thousand $ Nigeria 31,003,705 17,723,567 10,818,897 -39.0 Angola 11,534,112 6,660,738 6,003,258 -9.9 South Africa 2,464,831 2,384,109 2,578,238 8.1 Chad 2,991,226 2,376,665 2,397,799 0.9 Congo, Republic of the 1,935,187 1,225,539 1,039,454 -15.2 Gabon 477,521 1,271,621 924,951 -27.3 Kenya 288,273 287,737 336,535 17.0 Lesotho 314,311 300,609 320,807 6.7 Mauritius 155,982 160,030 187,895 17.4 Swaziland 77,121 62,373 53,940 -13.5 Malawi 56,146 46,307 47,084 1.7 Cameroon 137,372 111,765 36,427 -67.4 Ethiopia 10,887 18,294 31,711 73.3 Tanzania 5,131 10,446 10,360 -0.8 Botswana 15,479 10,427 5,856 -43.8 Ghana 414,094 16,988 2,811 -83.5 Mozambique 689 30 1,362 4,513.2 Côte d’Ivoire 0 29,901 229 -99.2 Cabo Verde 154 117 146 25.2 Uganda 787 64 56 -13.3 Senegal 3 5,634 11 -99.8 Rwanda 17 8 9 19.5 Zambia 10 7 8 23.0 Burkina Faso 2 5 7 32.4 Guinea 0 3 6 122.1 Niger 0 1 (a) -75.3 Gambia 1 0 0 (b)
Namibia 13 216 0 -100.0 Mali 2 21 0 -100.0 Togo 0 44,448 0 -100.0
Total U.S. imports for consumption under AGOA 51,883,054 32,747,670 24,797,856 -24.3
Source: Official trade statistics of the USDOC as maintained by the USITC. Note: Because of rounding, figures may not add to totals shown. aLess than $500. bUndefined.
239

Table A.20 Leading U.S. imports for consumption under AGOA, by HTS provision, 2011–13 HTS provision Description 2011 2012 2013
% change 2012–13
Million $ 2709.00 Petroleum oils and oils from bituminous minerals, crude 47,434 28,114 19,984 -28.9 8703.23 Passenger motor vehicles with spark-ignition internal combustion reciprocating piston engine, cylinder capacity
over 1,500 cc but not over 3,000 cc 1,995 1,872 2,098 12.1
2710.12 Light oils and preparations (a) 896 771 -13.9 2710.19 Petroleum oils and oils (not light) from bituminous minerals or preps n.e.s.o.i. 70%+ by weight from petroleum
oils or bituminous minerals 262 453 465 2.8
7202.11 Ferromanganese, containing more than 2% (wt.) carbon 205 197 180 -8.8 6205.20 Men’s or boys’ shirts of cotton, not knitted or crocheted 117 129 149 15.2 6203.42 Men’s or boys’ trousers, bib and brace overalls, breeches and shorts of cotton, not knitted or crocheted 141 135 140 3.7 6110.30 Sweaters, pullovers, sweatshirts, vests and similar articles of manmade fibers, knitted or crocheted 75 68 99 45.0 6204.62 Women’s or girls’ trousers, bib and brace overalls, breeches and shorts of cotton, not knitted or crocheted 126 105 88 -16.6 6104.63 Women’s or girls’ trousers, bib and brace overalls, breeches and shorts of synthetic fibers, knitted or crocheted 41 47 84 78.5 3823.70 Industrial fatty alcohols 47 54 61 11.5 0802.62 Macadamia nuts, shelled (b) 57 52 -8.5 0805.10 Oranges, fresh 38 40 51 28.8 6105.20 Men’s or boys’ shirts of manmade fibers, knitted or crocheted 28 35 49 38.2 6109.90 T-shirts, singlets, tank tops and similar garments, of textile materials n.e.s.o.i., knitted or crocheted 18 27 40 45.7 2401.20 Tobacco, partly or wholly stemmed/stripped 40 39 37 -6.6 2204.21 Wine of fresh grapes (other than sparkling wine) and grape must with fermentation prevented, etc., by adding
alcohol, containers of not over 2 liters 27 29 33 13.4
6204.63 Women’s or girls’ trousers, bib and brace overalls, breeches and shorts of synthetic fibers, not knitted or crocheted
15 20 30 54.7
6103.43 Men’s or boys’ trousers, bib and brace overalls, breeches and shorts of synthetic fibers, knitted or crocheted 26 26 28 10.0 6110.20 Sweaters, pullovers, sweatshirts, vests and similar articles of cotton, knitted or crocheted 62 34 27 -20.5 8111.00 Manganese and artcles thereof, including waste and scrap 8 24 23 -4.2 6104.62 Women’s or girls’ trousers, bib and brace overalls, breeches and shorts of cotton, knitted or crocheted 49 56 22 -60.7 2204.29 Wine of fresh grapes (other than sparkling wine) and grape must with fermentation prevented, etc., by adding
alcohol, containers holding over 2 liters 3 15 18 18.9
2207.10 Ethyl alcohol, undenatured, of an alcoholic strength by volume of 80% vol. or higher 17 17 17 -1.3 6105.10 Men’s or boys’ shirts of cotton, knitted or crocheted 31 19 15 -20.1
Total of items shown 50,807 32,509 24,562 -24.4 All other HTS subheadings 1,077 238 236 -0.9
Total of all commodities 51,883 32,748 24,798 -24.3 Source: Official trade statistics of the USDOC as maintained by the USITC. Note: Because of rounding, figures may not add to totals shown. The abbreviation “n.e.s.o.i.” stands for “not elsewhere specified or included.” aTrade in 2011 reported under HTS tariff line 2710.11 bTrade in 2011 reported under HTS tariff line 0802.60
240

Table A.21 U.S. imports for consumption under ATPA/ATPDEA, by source, 2011–13
Source 2011 2012 2013 % change 2012–13
Million $ Colombiaa 2,675 5,536 0 -100.0 Ecuadorb 1,706 5,870 2,538 -56.8 Peruc 5 0 0 (d)
Total 4,385 11,406 2,538 -77.7 Source: Official trade statistics of the USDOC as maintained by the USITC. Note: Because of rounding, figures may not add to totals shown. aColombia’s status as an ATPA beneficiary country ended effective May 15, 2012. This table includes imports valued at $222 million from Colombia that claimed ATPA/ATPDEA preferences after that date. bEcuador’s status as an ATPA beneficiary country ended when the program expired on July 31, 2013. This table includes imports valued at $80 million from Ecuador that claimed ATPA/ATPDEA preferences after that date. cPeru’s status as an ATPA beneficiary country ended on January 1, 2011. This table includes imports valued at $5 million from Peru that claimed ATPA/ATPDEA preferences after that date. dUndefined.
241
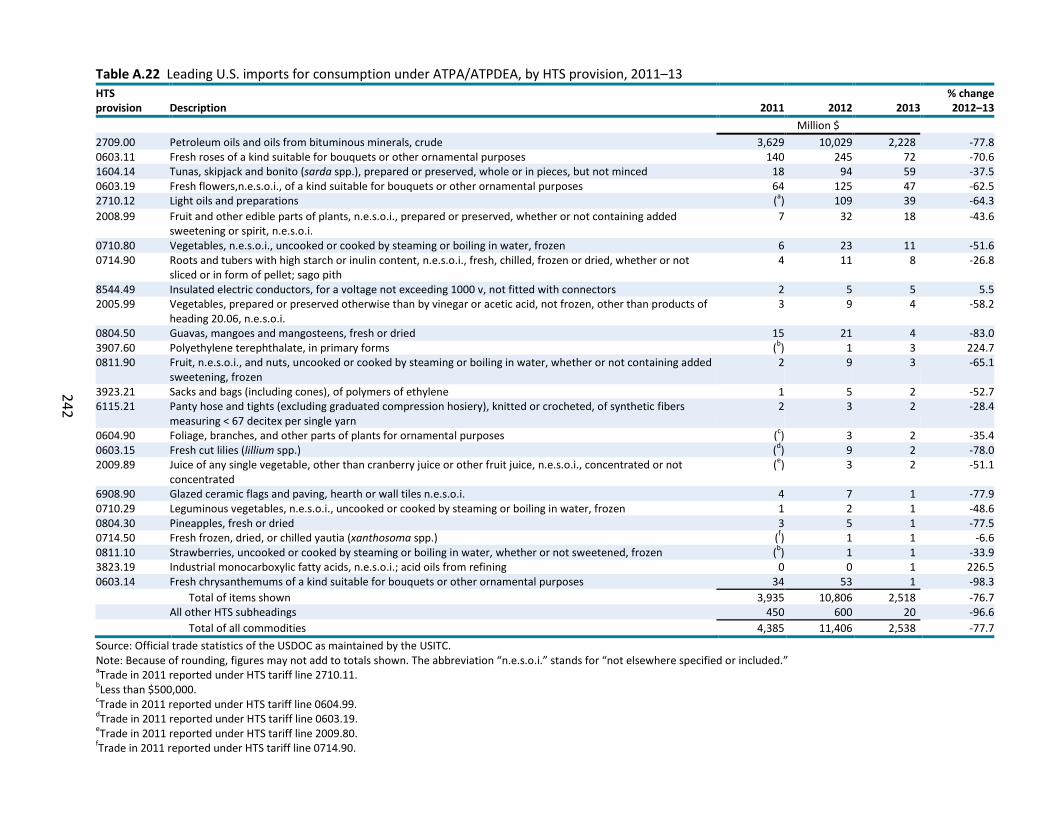
Table A.22 Leading U.S. imports for consumption under ATPA/ATPDEA, by HTS provision, 2011–13 HTS provision Description 2011 2012 2013
% change 2012–13
Million $ 2709.00 Petroleum oils and oils from bituminous minerals, crude 3,629 10,029 2,228 -77.8 0603.11 Fresh roses of a kind suitable for bouquets or other ornamental purposes 140 245 72 -70.6 1604.14 Tunas, skipjack and bonito (sarda spp.), prepared or preserved, whole or in pieces, but not minced 18 94 59 -37.5 0603.19 Fresh flowers,n.e.s.o.i., of a kind suitable for bouquets or other ornamental purposes 64 125 47 -62.5 2710.12 Light oils and preparations (a) 109 39 -64.3 2008.99 Fruit and other edible parts of plants, n.e.s.o.i., prepared or preserved, whether or not containing added
sweetening or spirit, n.e.s.o.i. 7 32 18 -43.6
0710.80 Vegetables, n.e.s.o.i., uncooked or cooked by steaming or boiling in water, frozen 6 23 11 -51.6 0714.90 Roots and tubers with high starch or inulin content, n.e.s.o.i., fresh, chilled, frozen or dried, whether or not
sliced or in form of pellet; sago pith 4 11 8 -26.8
8544.49 Insulated electric conductors, for a voltage not exceeding 1000 v, not fitted with connectors 2 5 5 5.5 2005.99 Vegetables, prepared or preserved otherwise than by vinegar or acetic acid, not frozen, other than products of
heading 20.06, n.e.s.o.i. 3 9 4 -58.2
0804.50 Guavas, mangoes and mangosteens, fresh or dried 15 21 4 -83.0 3907.60 Polyethylene terephthalate, in primary forms (b) 1 3 224.7 0811.90 Fruit, n.e.s.o.i., and nuts, uncooked or cooked by steaming or boiling in water, whether or not containing added
sweetening, frozen 2 9 3 -65.1
3923.21 Sacks and bags (including cones), of polymers of ethylene 1 5 2 -52.7 6115.21 Panty hose and tights (excluding graduated compression hosiery), knitted or crocheted, of synthetic fibers
measuring < 67 decitex per single yarn 2 3 2 -28.4
0604.90 Foliage, branches, and other parts of plants for ornamental purposes (c) 3 2 -35.4 0603.15 Fresh cut lilies (lillium spp.) (d) 9 2 -78.0 2009.89 Juice of any single vegetable, other than cranberry juice or other fruit juice, n.e.s.o.i., concentrated or not
concentrated (e) 3 2 -51.1
6908.90 Glazed ceramic flags and paving, hearth or wall tiles n.e.s.o.i. 4 7 1 -77.9 0710.29 Leguminous vegetables, n.e.s.o.i., uncooked or cooked by steaming or boiling in water, frozen 1 2 1 -48.6 0804.30 Pineapples, fresh or dried 3 5 1 -77.5 0714.50 Fresh frozen, dried, or chilled yautia (xanthosoma spp.) (f) 1 1 -6.6 0811.10 Strawberries, uncooked or cooked by steaming or boiling in water, whether or not sweetened, frozen (b) 1 1 -33.9 3823.19 Industrial monocarboxylic fatty acids, n.e.s.o.i.; acid oils from refining 0 0 1 226.5 0603.14 Fresh chrysanthemums of a kind suitable for bouquets or other ornamental purposes 34 53 1 -98.3
Total of items shown 3,935 10,806 2,518 -76.7 All other HTS subheadings 450 600 20 -96.6
Total of all commodities 4,385 11,406 2,538 -77.7 Source: Official trade statistics of the USDOC as maintained by the USITC. Note: Because of rounding, figures may not add to totals shown. The abbreviation “n.e.s.o.i.” stands for “not elsewhere specified or included.” aTrade in 2011 reported under HTS tariff line 2710.11. bLess than $500,000. cTrade in 2011 reported under HTS tariff line 0604.99. dTrade in 2011 reported under HTS tariff line 0603.19. eTrade in 2011 reported under HTS tariff line 2009.80. fTrade in 2011 reported under HTS tariff line 0714.90.
242

Table A.23 U.S. imports for consumption under CBERA/CBTPA, by source, 2011–13
Source 2011 2012 2013 % change 2012–13
Thousand $ Trinidad and Tobago 2,594,465 2,171,207 1,640,693 -24.4 Haiti 474,602 436,783 361,625 -17.2 Bahamas 123,854 130,309 142,890 9.7 Belize 146,045 131,898 104,822 -20.5 Jamaica 179,045 206,046 91,931 -55.4 St. Kitts-Nevis 27,273 22,350 18,933 -15.3 Guyana 11,129 5,300 4,532 -14.5 St. Lucia 1,889 1,836 3,155 71.9 Barbados 4,493 3,812 2,040 -46.5 Grenada 257 341 295 -13.5 Dominica 149 117 170 45.3 St. Vincent and Grenadines 88 138 141 2.2 British Virgin Islands 136 451 103 -77.1 Antigua and Barbuda 23 30 24 -17.6 Aruba 249 27 18 -32.1 Panamaa 55,184 26,319 0 -100.0 Montserrat Island 0 24 0 -100.0
Total U.S. imports for consumption under CBERA/CBTPA 3,618,883 3,136,986 2,371,374 -24.4
Source: Official trade statistics of the USDOC as maintained by the USITC. Note: Because of rounding, figures may not add to totals shown. aU.S. imports from Panama are included only for the period during which Panama was eligible for CBERA benefits before the U.S.-Panama Trade Promotion Agreement entered into effect on October 31, 2013.
243

Table A.24 Leading U.S. imports for consumption under CBERA/CBTPA, by HTS provision, 2011–13 HTS provision Description 2011 2012 2013
% change 2012-13
Million $ 2905.11 Methanol (methyl alcohol) 1,097 1,022 1,172 14.6 2709.00 Petroleum oils and oils from bituminous minerals, crude 1,274 1,164 371 -68.1 6109.10 T-shirts, singlets, tank tops and similar garments of cotton, knitted or crocheted 213 225 209 -7.1 3903.11 Polystyrene, expandable, in primary forms 122 129 142 9.4 2710.19 Petroleum oils and oils (not light) from bituminous minerals or preps n.e.s.o.i. 70%+ by weight from
petroleum oils or bituminous minerals 125 40 133 231.1
6110.20 Sweaters, pullovers, sweatshirts, vests and similar articles of cotton, knitted or crocheted 221 176 118 -32.9 2207.10 Ethyl alcohol, undenatured, of an alcoholic strength by volume of 80% vol. or higher 244 153 27 -82.5 0714.30 Fresh, frozen, or dried, or chilled yams (dioscorea spp.) (a) 16 17 7.4 2933.61 Melamine 24 22 17 -22.0 0804.50 Guavas, mangoes and mangosteens, fresh or dried 10 9 12 37.5 0807.20 Papayas (papaws), fresh 13 11 12 10.1 2103.90 Sauces and preparations therefor, n.e.s.o.i.; mixed condiments and mixed seasonings 10 11 11 5.5 8525.50 Transmission apparatus for television 16 12 11 -12.8 6109.90 T-shirts, singlets, tank tops and similar garments, of textile materials n.e.s.o.i., knitted or crocheted 18 16 11 -31.7 2106.90 Food preparations n.e.s.o.i. 4 6 8 37.0 2009.11 Orange juice, frozen, whether or not sweetened 6 8 7 -11.7 2009.19 Orange juice, other than frozen, not fortified with vitamins or minerals, of a brix value exceeding 20 5 8 5 -36.8 2008.99 Fruit and other edible parts of plants, n.e.s.o.i., prepared or preserved, whether or not containing added
sweetening or spirit, n.e.s.o.i. 6 6 5 -15.1
2202.10 Waters, including mineral waters and aerated waters, sweetened or flavored 7 5 5 -12.7 2005.99 Vegetables, prepared or preserved otherwise than by vinegar or acetic acid, not frozen, other than products
of heading 20.06, n.e.s.o.i. 3 4 5 18.1
2818.10 Artificial corundum, whether or not chemically defined 0 0 4 (b) 8503.00 Parts of electric motors, generators, generating sets and rotary converters 4 4 4 -4.9 2202.90 Nonalcoholic beverages, n.e.s.o.i. (including milk-based drinks and nonalcoholic beer) 5 5 4 -24.5 8504.90 Parts for electrical transformers, static converters and inductors 4 4 3 -16.1 2104.10 Soups and broths and preparations therefor 2 2 3 56.5
Total of items shown 3,433 3,056 2,313 -24.3 All other HTS subheadings 186 81 58 -28.2
Total of all commodities 3,619 3,137 2,371 -24.4 Source: Official trade statistics of the USDOC as maintained by the USITC. Note: Because of rounding, figures may not add to totals shown. The abbreviation “n.e.s.o.i.” stands for “not elsewhere specified or included.” Data for 2012 include U.S. imports from Panama only for the period during which Panama was eligible for CBERA benefits before the U.S. Panama Trade Promotion Agreement entered into force on October 31, 2013. aTrade in 2011 reported under HTS tariff line 0714.20. bUndefined.
244

Table A.25 WTO dispute settlement cases to which the United States was a party, developments in 2013
Case no. Title Complainant Action (month/day/year) DS217 United States—
Continued Dumping and Subsidy Offset Act of 2000 (Byrd Amendment)
Australia, Brazil, Chile, European Communities (EC), India, Indonesia, Japan, Korea, Thailand
Complaining parties request consultations (12/21/00). Panel established (08/23/01) and composed (10/25/01). Panel report circulated to members (09/16/02). U.S. notifies Dispute Settlement Body (DSB) it will appeal panel decision (10/18/02). Appellate Body circulates its report (06/16/03). Arbitrator finds that U.S. has failed to implement the DSB recommendations and rulings (01/15/04). Arbitrator circulates decisions relating to level of suspension of concessions to offset U.S. Byrd Amendment distributions (08/31/04). Authority to retaliate granted (11/26/04, 12/17/04). DSB authorizes or takes note of various requests or agreements to suspend concessions (2004–05). U.S. states at DSB meeting that recent changes bring U.S. law into conformity with its WTO obligations (02/17/06). Japan and EC notify DSB annually of the new list of products on which the additional import duty would apply, prior to the entry into force of a level of suspension of concessions (2006–13).
DS294 United States—Laws, Regulations and Methodology for Calculating Dumping Margins (Zeroing)
European Communities
EC requests consultations (06/12/03). Panel established (03/19/04) and composed (10/27/04). Panel report circulated (10/31/05). Appellate Body report circulated (04/18/06). DSB adopts Appellate Body report and panel report as modified (05/09/06). U.S. announces that it intends to implement the DSB recommendations and rulings (05/30/06). U.S. and EC agree, pursuant to Dispute Settlement Understanding (DSU) Article 21.3(b), to the reasonable period of time for implementation (07/28/06). U.S. and EC reach an understanding on Article 21 and 22 procedures (05/04/07). EC requests Article 21.5 consultations (07/09/07). Brazil and Korea request to join consultations (07/20/07). EC requests establishment of Article 21.5 panel (09/13/07). Article 21.5 Appellate Body report adopted (06/11/09). EC requests authorization to suspend concessions or other obligations per Article 22.2 of DSU (01/29/10). U.S. informs DSB it objects to suspension level proposed by the EU (02/12/10). DSB refers the matter to arbitration (02/18/10). European Union and United States at various times during 2010–early 2012 jointly requested that the arbitrator suspend work; work suspended through June 28, 2012. EU and U.S. inform the DSB of a memorandum between the U.S. and the EC which envisages a roadmap addressing the dispute (02/06/12). EU withdraws its request for authorization to suspend concessions or other obligations under Article 22.2 of DSU following completion by the U.S. of the steps undertaken pursuant to roadmap notified in February 2012 (06/22/12). Arbitrator informs the DSB of receipt of joint communication of June 22, 2012, from the EU and U.S. and that the U.S. and EU request that the arbitrator notify the DSB that it is not necessary for it to issue a report/ award in this dispute; the arbitrator therefore considers that it has completed its work (07/02/12).
245

Case no. Title Complainant Action (month/day/year) DS316 European
Communities—Measures Affecting Trade in Large Civil Aircraft
United States U.S. requests consultations with EC (10/06/04). Panel established (07/20/05) and composed (10/17/05). Panel circulates its report (06/30/10). EU appeals decision to Appellate Body (07/21/10); U.S. does the same (08/19/10). Appellate Body report circulated (05/18/11). DSB adopts Appellate Body report and panel report (as modified) (06/01/11). EU informs DSB it intends to implement DSB recommendation (06/17/11). EU informs DSB it has taken steps to bring its measures into conformity with obligations (12/01/11). U.S. requests consultations with EU under Article 21.5 and requests authority to take countermeasures (12/09/11). EU objects to requested level of U.S. measures and requests matter be referred to arbitration under Article 22.6; DSB refers to arbitration (12/22/11). U.S. and EU request arbitrator to suspend work (01/19/12). Arbitrator suspends work until either party requests resumption (01/20/12).
DS322 United States—Measures Relating to Zeroing and Sunset Reviews
Japan Japan requests consultations (11/24/04). Panel established (02/28/05) and composed (04/15/05). Panel report circulated (09/20/06). Appellate Body report circulated (01/9/07). DSB adopts Appellate Body report and panel report (as modified) (01/23/07). Agreement reached on the reasonable period of time for implementation (05/04/07). Article 21.3(c) arbitration report circulated (05/11/07). Japan seeks authorization to suspend concessions (01/10/08). Japan asks for establishment of Article 21.5 panel (04/07/08). United States and Japan request arbitrator to suspend work (06/06/08). Article 21.5 panel report circulated (04/24/09). U.S. notifies DSB of intent to appeal (05/20/09). Article 21.5 Appellate Body report adopted (08/31/09). Japan requests arbitrator to resume arbitration proceedings (04/23/10). U.S. and Japan request arbitrator to suspend work (12/15/10). Subsequent requests continue suspension through August 21, 2012 (02/01/12). U.S. and Japan inform DSB of memorandum of understanding regarding the dispute (02/06/12). Japan withdraws request for authorization to suspend concessions/obligations under Article 22.6 after U.S. completes steps notified to the DSB in Feb. 2012 (08/03/12). Arbitrator informs DSB, following receipt of request from Japan and U.S., that no award is necessary, that it is not necessary to issue a decision, and that work is considered completed (08/14/12).
246

Case no. Title Complainant Action (month/day/year) DS344 United States—Final
Antidumping Measures on Stainless Steel from Mexico
Mexico Mexico requests consultations (05/26/06). Panel established (10/26/06) and composed (12/20/06). Panel report circulated (12/20/07). Mexico notifies DSB of decision to appeal (01/31/08). DSB adopts Appellate Body report and panel report (as modified) (05/20/08). Mexico requests that the reasonable period of time for U.S. implementation be determined through binding arbitration pursuant to Article 21.3(c) (08/11/08). Article 21.3 arbitration report circulated (10/31/08), setting April 30, 2009, as a reasonable time for the U.S. to implement. U.S. informs DSB that U.S. and Mexico concluded a sequencing agreement (05/20/09). Mexico requests establishment of a compliance panel (09/07/10). DSB agrees to refer the matter to the original panel if possible (09/21/10). Compliance panel composed (05/13/11). Panel chairman informs DSB that he expects to circulate a final report in March 2012 (11/09/11). Mexico asks compliance panel to suspend work until May 14, 2012 (04/27/12). Mexico asks compliance panel to suspend work until May 31, 2012 (05/14/12). Mexico asks compliance panel to suspend work until further notice (05/31/12), and panel agrees. Mexico and the U.S. notify the DSB that the parties have reached a mutually satisfactory solution (04/08/13).
DS350 United States—Continued Existence and Application of Zeroing Methodology
European Communities
EC requests consultations (10/02/06). Panel established (06/04/07) and composed (07/06/07). Panel report circulated (10/01/08). EC (11/06/08) and U.S. (11/18/08) notify DSB of decision to appeal. Appellate Body and modified panel reports adopted (02/19/09). U.S. and EC agree that a reasonable time for the U.S. to implement is Dec. 19, 2009 (06/02/09). EU and U.S. notify the DSB of agreed procedures under Articles 21 and 22 (01/04/10). EU and U.S. inform the DSB of a memorandum between the U.S. and European Commission which envisages a roadmap addressing the dispute (02/06/12).
247

Case no. Title Complainant Action (month/day/year) DS353 United States—
Measures Affecting Trade in Large Civil Aircraft—Second Complaint
European Communities
EC requests consultations (06/27/05). Panel established (02/17/06) and composed (11/22/06). Panel chairman informs DSB multiple times that panel needs additional time to complete work in light of complexities of the dispute (05/18/07, 07/11/08, 12/16/09, 07/07/10). Panel report circulated to members (03/31/11). EU notifies DSB of its decision to appeal to Appellate Body (04/01/11), and U.S. also notifies decision to appeal (04/28/11). Appellate Body report circulated to members (03/12/12) and adopted (03/23/12). U.S. informs DSB it intends to implement DSB recommendations and rulings (04/13/12). EU and U.S. inform DSB of agreed procedures under Articles 21 and 22 of DSU and Article 7 of SCM Agreement (04/24/12). U.S. notifies DSB of withdrawal of subsidies and adverse effects of dispute, and that it fully complies with DSB recommendations and rulings (09/23/12). EU requests consultations under Article 21.5 (09/25/12). EU requests authority to take countermeasures under Article 22 of DSU and Agreement on Subsidies and Countervailing Measures (SCM Agreement) (09/27/12). EU requests establishment of compliance panel (10/11/12). Compliance panel composed (10/30/12). Compliance panel chairman informs DSB that panel will circulate report during first half of 2014 (01/15/13). U.S. objects to level of suspension of concessions/ obligations sought; U.S. seeks arbitration under Article 22.6 of the DSU (10/22/12). At request of U.S. and EU, arbitrator to suspend arbitration proceedings (11/28/12).
248

Case no. Title Complainant Action (month/day/year) DS363 China—Measures
Affecting Trading Rights and Distribution Services for Certain Publications and Audiovisual Entertainment Products
United States U.S. requests consultations with China (04/10/07). Panel established (11/27/07) and composed (03/27/08). Panel report circulated (08/12/09). China (09/22/09) and U.S. (10/05/09) notify the DSB of their respective decisions to appeal. Appellate Body report circulated to members (12/21/09). DSB adopts Appellate Body report and panel report (as modified) (01/19/10). China and U.S. inform DSB that they have agreed that a reasonable period for China to implement the DSB recommendations is by March 14, 2011 (07/12/10). China reports to DSB that it has made efforts to implement DSB recommendations; U.S. expresses concern about lack of progress by China (03/25/11). U.S. and China inform DSB of agreed procedures under Articles 21 and 22 of the DSU (04/13/11). China reports to the DSB it has completed amendments to most measures and has signed a memorandum of understanding with the U.S. (02/22/12). China tells DSB that it has ensured full implementation of DSB recommendations and rulings except for measures concerning films for theatrical release. U.S. states that it is not in a position to agree that China has fully implemented DSB recommendations and rulings in all areas except films for theatrical release (03/23/12). China and the U.S. inform the DSB of key elements relating to theatrical release as set forth in the MOU noted at the Feb. 22, 2012, DSB meeting (05/09/12). China tells DSB it has taken all necessary steps and has complied with DSB recommendations. U.S. says that MOU represented significant progress but not a final resolution (05/24/12).
DS379 United States—Definitive Anti-Dumping and Countervailing Duties on Certain Products from China
China China requests consultations with U.S. (09/19/08). Panel established (01/20/09) and composed (03/04/09). Panel report circulated (10/22/10). China notifies DSB it will appeal the panel’s decision to the Appellate Body (12/01/10). Appellate Body report circulated (03/11/11). DSB adopts Appellate Body report and panel report (as modified) (03/25/11). China and the U.S. inform DSB that they have agreed that a reasonable time for the U.S. to implement the DSB’s recommendations is Feb. 25, 2012 (07/5/11). China and the U.S. inform the DSB that they have modified the reasonable time period, with the period to expire April 25, 2012 (01/17/12). China and U.S. notify the DSB of agreed procedures under Articles 21 and 22 of the DSU (05/11/12). U.S. tells DSB it has brought the measures at issue into full compliance with DSB recommendations and rulings (08/31/12), but China says that it does not agree with the U.S. claim to such effect (09/28/12).
249

Case no. Title Complainant Action (month/day/year) DS381 United States—
Measures Concerning the Importation, Marketing and Sale of Tuna and Tuna Products
Mexico Mexico requests consultations with the U.S. (10/24/08). Panel established (04/20/09) and composed (12/14/09). Panel chairman informs DSB panel expects to issue report in February 2011 (06/15/10). Parties agree on new panel member following death of one member (08/12/10). Panel report circulated to members (09/15/11). U.S. notifies DSB of its decision to appeal the panel’s decision (01/20/12); Mexico does the same (01/25/12). Appellate Body report is circulated to members (05/16/12) and adopted by DSB (06/13/12). U.S. states that it intends to implement the DSB recommendations and rulings (06/25/12), and the U.S. and Mexico inform the DSB that they have agreed that a reasonable time to do so is by July 13, 2013 (09/17/12). U.S. advises DSB that it has made effective a final rule amending dolphin-safe labelling requirements, bringing its requirements into compliance (07/23/13). Mexico and U.S. inform the DSB of agreed procedures under Articles 21 and 22 of the DSU (08/02/13). Mexico requests establishment of a compliance panel (11/14/13); DSB agrees to refer to original panel (01/22/14), and panel is composed (01/27/14). Panel chair informs DSB that the panel expects to issue its final report by December 2014 (04/16/14).
DS382 United States—Anti- Dumping Administrative Reviews and Other Measures Related to Imports of Certain Orange Juice from Brazil
Brazil Brazil requests consultations with the U.S. (11/27/08). Panel established (09/25/09) and composed (05/10/10). Panel report circulated (03/25/11). DSB adopts the panel report, and Brazil and U.S. notify the DSB that they have agreed that a reasonable time for the U.S. to implement the DSB recommendations expires on March 17, 2012 (06/17/11). U.S. informs the DSB that following a 5-year sunset review the USITC has recently determined to revoke the existing antidumping order on orange juice as of March 9, 2011 (03/23/12). Brazil tells DSB it is still assessing whether the U.S. implementation measure would resolve the dispute. Brazil and the U.S. inform the DSB of agreed procedures regarding Articles 21 and 22 of the DSU (04/03/12). Brazil and the U.S. inform the DSB that the parties have reached a mutually satisfactory solution to the dispute (02/14/13).
250

Case no. Title Complainant Action (month/day/year) DS384 United States—
Certain Country of Origin Labelling (COOL) Requirements
Canada Canada requests consultations with the U.S. (12/01/08). Single panel established to examine this dispute and DS386 (11/19/09); panel composed (05/10/10). Panel report circulated to members (11/18/11). U.S. notifies the DSB of its decision to appeal certain issues of law and legal interpretations (03/23/12), and Canada notifies the DSB it will do the same (03/28/12). Appellate Body report is circulated to members (06/29/12) and adopted (07/23/12). U.S. informs DSB it intends to implement DSB recommendations and rulings (08/21/12). Canada requests that reasonable time to implement be determined through binding arbitration (09/13/12), and requests that the Director-General appoint an arbitrator (09/26/12); arbitrator appointed (10/04/12). Arbitrator determines that the reasonable time is by May 23, 2013 (12/04/12). U.S. informs DSB that USDA has issued a final rule that brings U.S. labelling requirements into compliance (05/24/13). Canada disagrees that changes bring U.S. requirements into compliance, and the U.S. and Canada inform DSB of agreed procedures under Articles 21 and 22 of DSU (06/10/13). Canada requests establishment of compliance panel (08/19/13); DSB refers to original panel if possible (09/25/13); compliance panel composed (09/27/13). Compliance panel chair informs DSB that panel expects to issue its final report towards end of July 2014 (03/26/14).
DS386 United States—Certain Country of Origin Labelling Requirements
Mexico Mexico requests consultations with the U.S. (12/17/08). Single panel established to examine this dispute and DS384 (11/19/09); panel composed (05/10/10). Panel report circulated to members (11/18/11). U.S. notifies the DSB of its decision to appeal certain issues of law and legal interpretations (03/23/12), and Mexico notifies the DSB it will do the same (03/28/12). Appellate Body report is circulated to members (06/29/12) and adopted (07/23/12). U.S. informs DSB it intends to implement DSB recommendations and rulings (08/21/12). Mexico requests that reasonable time to implement be determined through binding arbitration (09/13/12), and requests that the Director-General appoint an arbitrator (09/26/12); arbitrator appointed (10/04/12). Arbitrator determines that the reasonable time is by May 23, 2013 (12/04/12). U.S. informs DSB that USDA has issued a final rule that brings U.S. labelling requirements into compliance (05/24/13). Mexico disagrees that changes bring U.S. requirements into compliance, and the U.S. and Mexico inform DSB of agreed procedures under Articles 21 and 22 of DSU (06/10/13). Mexico requests establishment of compliance panel (08/19/13); DSB refers to original panel if possible (09/25/13); compliance panel composed (09/27/13). Compliance panel chair informs DSB that panel expects to issue its final report towards end of July 2014 (03/26/14).
DS387 China—Grants, Loans and other Incentives
United States U.S. requests consultations (12/19/08).
251

Case no. Title Complainant Action (month/day/year) DS389 European
Communities—Certain Measures Affecting Poultry Meat and Poultry Meat Products from the United States
United States U.S. requests consultations (01/16/09). Panel established (11/19/09).
DS394 China—Measures Related to the Exportation of Various Raw Materials
United States U.S. requests consultations (06/23/09). U.S. requests establishment of a panel (12/21/09). Single panel established to examine this dispute and disputes DS395 and DS398 (12/21/09); panel composed (03/29/10). Panel circulated to members (07/05/11). China notifies the DSB of its decision to appeal (08/31/11). U.S. notifies the DSB of its decision to appeal (09/06/11). Appellate Body report is circulated to members (01/30/12). DSB adopts Appellate Body report and panel report as modified by Appellate Body (02/22/12). China informs DSB of its intention to implement DSB recommendations and of its need for a reasonable time to do so (03/23/12). China and the U.S. notify the DSB that they have agreed that the reasonable time is by Dec. 31, 2012 (05/24/12). China and the U.S. inform the DSB of agreed procedures under Articles 21 and 22 of the DSU (01/17/13). China reports to DSB that the application of export duties and export quotas to certain raw materials has been removed effective January 1, 2013, and that China has fully implemented the DSB’s recommendations and rulings (01/28/13).
DS403 Philippines—Taxes on Distilled Spirits
United States U.S. requests consultations (01/14/10). Single panel established to consider DS403 and DS396 (complaint by the EU) (04/20/10); panel composed (07/05/10). Panel report circulated to members (08/15/11). Philippines notifies the DSB of its decision to appeal to the Appellate Body (09/23/11), as does EU (09/28/11). Appellate Body report is circulated to members (12/21/11). DSB adopts Appellate Body report and panel report as modified by Appellate Body (01/20/12). Philippines states that it intends to implement DSB’s recommendations and ruling and would require a reasonable time to do so (02/22/12). Philippines and U.S. inform DSB that they have agreed that the reasonable time is by March 8, 2013 (04/20/12). Philippines reports enactment of legislation that completes implementation of the DSB’s recommendations and rulings (01/28/13).
DS404 United States—Anti-dumping Measures on Certain Shrimp from Viet Nam
Vietnam Vietnam requests consultations (02/01/10). Panel established (05/18/10) and composed (07/26/10). Panel report circulated to members (07/11/11). DSB adopts panel report (09/02/11). Vietnam and U.S. inform DSB they have agreed that a reasonable time for the U.S. to implement the DSB recommendations expires on July 2, 2012 (10/31/11).
252

Case no. Title Complainant Action (month/day/year) DS406 United States—
Measures Affecting the Production and Sale of Clove Cigarettes
Indonesia Indonesia requests consultations (04/07/10). Panel established (07/20/10) and composed (09/09/10). Panel report circulated to members (09/02/11). U.S. notifies DSB of its decision to appeal to the Appellate Body (01/05/12). Appellate Body report is circulated to members (04/04/12) and adopted (04/24/12). U.S. informs DSB of its intent to implement DSB recommendations and rulings and of need for a reasonable period of time to do so (05/24/12). Indonesia and the U.S. inform the DSB that the reasonable period of time is by July 24, 2013 (06/14/12). Indonesia requests authorization from DSB to suspend concessions or other obligations under Article 22.2 of the DSU (08/12/13). U.S. objects to level of suspension of concessions or other obligations and refers the matter to arbitration pursuant to Article 22.6 of the DSU (08/22/13). Matter referred to arbitration at DSB meeting (08/23/13).
DS413 China—Certain Measures Affecting Electronic Payment Services
United States U.S. requests consultations (09/15/10). Panel established (03/25/11) and composed (07/04/11). Panel report circulated to members (07/16/12) and adopted by DSB (08/31/12). China states that it intends to implement the DSB’s recommendations and rulings and will need a reasonable amount of time to do so (09/28/12). China and U.S. inform DSB that the reasonable period of time for China to implement is by July 31, 2013 (11/22/12). China reports to DSB that it has fully implemented the DSB’s recommendations and rulings; the U.S. states that it does not agree, and that it will monitor and review China’s actions (07/23/13). China and the U.S. inform the DSB of agreed procedures under Articles 21 and 22 of the DSU.
DS414 China—Countervailing and Anti-Dumping Duties on Grain Oriented Flat-rolled Electrical Steel from the United States
United States U.S. requests consultations (09/15/10). Panel established (03/25/11) and composed (05/10/11). Panel report circulated to members (06/15/12). China notifies DSB of its decision to appeal to the Appellate Body (07/20/12). Appellate Body report is circulated to members (10/18/12) and adopted by DSB (11/16/12). China states that it intends to implement the DSB’s recommendations and rulings and will need a reasonable amount of time to do so (11/30/12). U.S. requests that the reasonable period of time be determined through binding arbitration pursuant to Article 21.3(c) of the DSU (02/08/13). Director-General appoints arbitrator (02/28/13). Arbitration report circulated; arbitrator determines that the reasonable period of time is July 31, 2013 (05/03/13). China and U.S. inform DSB of agreed procedures under Articles 21 and 22 of DSU (08/19/13). U.S. requests consultations pursuant to Article 21.5 of the DSU (01/13/14). U.S. requests establishment of a compliance panel (02/13/14); DSB agrees to refer to original panel if possible (02/26/14).
DS419 China—Measures Concerning Wind Power Equipment
United States U.S. requests consultations (12/22/10). EU and Japan request to join consultations (01/12/11 and 01/17/11, respectively).
253

Case no. Title Complainant Action (month/day/year) DS420 United States—Anti-
dumping Measures on Corrosion-Resistant Carbon Steel Flat Products from Korea
Korea Korea requests consultations (01/31/11). Korea requests establishment of a panel (09/15/11). Korea withdraws request for panel (09/27/11). Korea requests establishment of a panel (02/09/12). Korea informs DSB of agreement on procedures between U.S. and Korea (02/14/12). Panel established (02/22/12). Prior to composition of the panel, Korea requests that panel proceedings be suspended in accordance with Article 12.12 of the DSU until further notification (06/12/12).
DS422 United States—Anti- Dumping Measures on Shrimp and Diamond Sawblades from China
China China requests consultations (02/28/11). Panel established (10/25/11) and composed (12/21/11). Panel report circulated to members (06/08/12) and adopted by DSB (07/23/12). China and U.S. inform DSB that they have agreed that the reasonable period of time for the U.S. to implement is by March 23, 2013 (07/27/12). U.S. informs DSB that it has fully implemented DSB recommendations and rulings; China states that it does not share U.S. view as U.S. has not revoked antidumping duty on sawblades (03/26/13).
DS424 United States—Anti- Dumping Measures on Imports of Stainless Steel Sheet and Strip in Coils from Italy
European Union EU requests consultations (04/01/11). Japan requests to join the consultations (04/18/11).
DS427 China—Anti-Dumping and Countervailing Duty Measures on Broiler Products from the United States
United States U.S. requests consultations (09/20/11). Panel established (01/20/12) and composed (05/24/12). Panel report circulated to members (08/02/13) and adopted by DSB (09/25/13). China informs DSB it intends to implement DSB recommendations and rulings (10/22/13). China and U.S. inform DSB that they have agreed that a reasonable period of time to implement is by July 9, 2014 (12/19/13).
DS429 United States—Anti- Dumping Measures on Certain Frozen Warmwater Shrimp from Viet Nam
Vietnam Vietnam requests consultations (02/20/12). Panel established (02/27/13) and composed (07/12/13). Panel chair informs DSB that the panel expects to issue its final report to the parties by Sept. 30, 2014 (01/30/14).
DS430 India—Measures Concerning the Importation of Certain Agricultural Products from the United States
United States U.S. requests consultations (03/06/12). Panel established (06/25/12) and composed (02/18/13). Panel chair informs DSB that the panel expects to issue its final report to the parties no later than June 2014 (08/05/13).
DS431 China—Measures Related to the Exportation of Rare Earths, Tungsten and Molybdenum
United States U.S. requests consultations (03/13/12). Single panel to examine DS431, DS432, and DS433 is established (07/23/12) and composed (09/24/12). Panel report circulated to members (03/26/14). U.S. notifies the DSB of its decision to appeal to the Appellate Body certain issues of law and legal interpretation (04/08/14); China notifies the DSB of its decision to appeal (04/17/14).
DS436 United States—Counter- vailing Measures on Certain Hot-Rolled Carbon Steel Flat Products from India
India India requests consultations (04/24/12). Panel established (08/31/12) and composed (02/18/13). Panel chair informs DSB that the panel expects to issue its final report to the parties by April 2014 (07/08/13).
254

Case no. Title Complainant Action (month/day/year) DS437 United States—
Counter- vailing Duty Measures on Certain Products from China
China China requests consultations (05/25/12). Panel established (09/28/12) and composed (11/26/12). Panel chair informs DSB that the panel expects to issue its final report to the parties by January 2014 (04/29/13). Panel chair informs DSB that panel expects to complete its work in May 2014 (11/18/13).
DS440 China—Anti-Dumping and Countervailing Duties on Certain Automobiles from the United States
United States U.S. requests consultations (07/05/12). Panel established (10/23/12) and composed (02/11/13). Panel chair informs DSB that the panel expects to issue its final report to the parties by March 2014 (09/25/13). Panel report circulated to members (05/23/14).
DS444 Argentina—Measures Affecting the Importation of Goods
United States U.S. requests consultations (08/21/12). Single panel established to examine DS438, DS44, and DS445 (01/28/13); and panel composed (05/27/13). Panel chair informs DSB that the panel expects to issue its final report to the parties by end of May 2014 (11/15/13). Panel chair informs DSB that it estimates it will issue a final report to the parties by the end of June 2014 (05/05/13).
DS447 United States—Measures Affecting the Importation of Animals, Meat and Other Animal Products from Argentina
Argentina Argentina requests consultations (08/30/12). Panel established (01/28/13) and composed (08/08/13). Panel chair informs DSB that the panel expects to issue its final report to the parties in early 2015 (03/07/14).
DS448 United States—Measures Affecting the Importation of Fresh Lemons
Argentina Argentina requests consultations (09/03/12). Argentina requests establishment of a panel (12/06/12); establishment deferred (12/17/12).
DS449 United States—Counter- vailing and Anti-dumping Measures on Certain Products from China
China China requests consultations (09/17/12). Panel established (12/17/12) and composed (03/04/13). Panel report circulated to members (03/27/14). China notifies the DSB of its decision to appeal to the Appellate Body certain issues of law and legal interpretation (04/08/14); the U.S. notifies the DSB of its decision to appeal (04/17/14).
DS450 China—Certain Measures Affecting the Automobile and Automobile-Parts Industries
United States U.S. requests consultations (09/17/12).
DS455 Indonesia—Importation of horticultural products, animals and animal products
United States U.S. requests consultations (01/10/13). Panel established (04/24/13).
DS456 India—Certain Measures Relating to Solar Cells and Solar Modules
United States U.S. requests consultations (02/06/13); U.S. requests supplementary consultations (02/10/14). U.S. requests establishment of a panel (04/14/13).
DS464 United States—Anti-dumping and Countervailing Measures on large residential washers from Korea
Korea Korea requests consultations (08/29/13). Panel established (01/22/14).
255

Case no. Title Complainant Action (month/day/year) DS465 Indonesia—
Importation of Horticultural Products, Animals and Animal Products
United States U.S. requests consultations (08/30/13).
DS471 United States—Certain Methodologies and their Application to Anti-Dumping Proceedings Involving China
China China requests consultations (12/3/13). Panel established (03/26/14).
Source: WTO, “Chronological List of Disputes Cases,” http://www.wto.org/english/tratop_e/dispu_e/dispu_status_e.htm. Note: This list focuses on formal actions in disputes during 2013; some intermediate procedural actions are omitted. Selected pre-2013 and post-2013 actions are noted to place the 2013 actions in context. Actions reflected in the table are generally those posted on the WTO website as of June 1, 2014.
256

Table A.26 NAFTA Chapter 19 substantive challenges to original and five-year review determinations of USITC and USDOC, developments in 2013
File no. Disputea Action (month/day/year) USA-CDA-2009-1904-01 Steel Wire Rod (AD) (Investigating authority:
International Trade Administration) Request for panel review (01/16/09). Oral argument (12/18/12). Status: Active.
USA-MEX-2008-1904-01 Stainless Steel Sheet and Strip in Coils (AD) (Investigating authority: International Trade Administration)
Request for panel review (03/12/08). Status: Terminated: 02/08/13.
USA-MEX-2009-1904-02 Stainless Steel Sheet and Strip in Coils (AD) (Investigating authority: International Trade Administration)
Request for panel review (03/11/09). Oral argument (06/07/12). Status: Terminated: 01/18/13.
USA-MEX-2010-1904-01 Stainless Steel Sheet and Strip in Coils (AD) (Investigating authority: International Trade Administration)
Request for panel review (03/11/10). Status: Terminated: 02/12/13.
USA-MEX-2011-1904-01 Stainless Steel Sheet and Strip in Coils (AD) (Investigating authority: International Trade Administration)
Request for panel review (02/11/11). Status: Terminated: 03/18/13.
USA-MEX-2011-1904-02 Light-Walled Rectangular Pipe and Tube (AD) (Investigating authority: International Trade Administration)
Request for panel review (03/18/11). Decision date 1: 12/05/12. Decision date 2: 08/06/13. Status: Completed.
USA-MEX-2012-1904-01 Light-Walled Rectangular Pipe and Tube (AD) (Investigating authority: International Trade Administration)
Request for panel review (02/10/12). Status: Terminated: 08/09/12.
USA-MEX-2012-1904-02 Bottom Mount Combination Refrigerator-Freezers (AD) (Investigating authority: International Trade Administration)
Request for panel review (04/24/12). Status: Active.
USA-MEX-2012-1904-03 Seamless Refined Copper Pipe and Tube (AD) (Investigating authority: International Trade Administration)
Request for panel review (10/24/12). Status: Terminated: 07/03/13.
MEX-USA-2011-1904-01 Stearic Acid (CVD) (Investigating authority: Secretaría de Economía)
Request for panel review (11/04/11). Decision date 1: 10/10/13. Status: Terminated.
MEX-USA-2012-1904-01 Chicken Thighs and Legs (AD) (Investigating authority: Secretaría de Economía)
Request for panel review (09/03/12). Status: Active.
MEX-USA-2012-1904-02 Ethylene Glycol Monobutyl Ether (AD) (Investigating authority: Secretaría de Economía)
Request for panel review (10/09/12). Status: Active.
Source: NAFTA Secretariat, “Status Report: NAFTA and FTA Dispute Settlement Proceedings,” http://www.nafta-sec-alena.org/en/StatusReport.aspx (accessed March 24, 2014). Note: This list includes active cases during 2013, including those in which little if any formal action occurred during 2013. aAD stands for antidumping duty and CVD stands for countervailing duty.
257

Table A.27 U.S. merchandise trade with the European Union (28 countries), by USITC digest sectors, 2011–13 Sector Grouping Description 2011 2012 2013
% change 2012–13
Million $ Domestic exports:
1 Agricultural products 12,066 12,019 13,554 12.8 2 Forest products 5,244 5,111 5,071 -0.8 3 Chemicals and related products 53,679 54,470 54,394 -0.1 4 Energy-related products 26,597 25,703 26,437 2.9 5 Textiles and apparel 2,140 2,073 2,125 2.5 6 Footwear 56 56 60 7.2 7 Minerals and metals 26,493 23,126 16,737 -27.6 8 Machinery 17,249 16,939 17,344 2.4 9 Transportation equipment 48,299 48,020 47,955 -0.1 10 Electronic products 36,630 35,134 34,836 -0.8 11 Miscellaneous manufactures 5,445 5,715 5,626 -1.6 12 Special provisions 7,689 7,549 7,537 -0.1
Total 241,587 235,916 231,676 -1.8 Imports for consumption:
1 Agricultural products 18,917 19,926 20,833 4.5 2 Forest products 4,560 4,528 4,742 4.7 3 Chemicals and related products 91,738 86,566 86,274 -0.3 4 Energy-related products 26,706 27,033 24,012 -11.2 5 Textiles and apparel 5,259 5,376 5,640 4.9 6 Footwear 1,568 1,683 1,860 10.5 7 Minerals and metals 29,028 30,107 29,061 -3.5 8 Machinery 40,246 41,167 41,564 1.0 9 Transportation equipment 71,357 82,400 88,148 7.0 10 Electronic products 40,863 41,589 42,091 1.2 11 Miscellaneous manufactures 13,692 15,151 17,217 13.6 12 Special provisions 18,923 19,043 20,149 5.8
Total 362,856 374,570 381,591 1.9 Source: Official trade statistics of the USDOC as maintained by the USITC. Note: Because of rounding, figures may not add to totals shown.
258

Table A.28 Leading U.S. domestic exports to the European Union (28), by Schedule B subheading, 2011–13 Schedule B subheading Description 2011 2012 2013
% change 2012–13
Million $ 8800.00 Aircraft, spacecraft, and parts thereof 24,701 23,975 25,723 7.3 2710.19 Petroleum oils and oils (not light) from bituminous minerals or preps n.e.s.o.i. 70%+ by weight from
petroleum oils or bituminous minerals 15,017 16,016 18,148 13.3 3004.90 Medicaments, in measured doses, etc. (excluding vaccines, etc., coated bandages, etc., and
pharmaceutical goods), n.e.s.o.i. 9,470 10,497 8,906 -15.1 3002.10 Antisera and other blood fractions, and modified immunological products 3,229 3,725 4,751 27.5 2701.12 Bituminous coal, whether or not pulverized, but not agglomerated 6,596 6,220 4,542 -27.0 8703.33 Passenger motor vehicles with compression-ignition internal combustion piston engine (diesel), cylinder
capacity over 2,500 cc 1,535 3,671 3,345 -8.9 9018.90 Instruments and appliances for medical, surgical or veterinary sciences, n.e.s.o.i., and parts and
accessories thereof 3,022 2,924 3,001 2.7 3822.00 Composite diagnostic or laboratory reagents, other than those pharmaceuticals in heading 3002 or 3006;
certified reference materials 2,368 2,327 2,514 8.1 9018.39 Medical etc. needles n.e.s.o.i., catheters, cannulae and the like; parts and accessories therof 2,113 2,097 2,209 5.3 8703.32 Passenger motor vehicles with compression-ignition internal combustion piston engine (diesel), cylinder
capacity over 1,500 cc but not over 2,500 cc 344 2,267 1,926 -15.0 2933.59 Heterocyclic compounds containing a pyrimidine ring (hydrogenated or not) or a piperazine ring in the
structure, n.e.s.o.i. 574 1,124 1,874 66.7 8517.62 Machines for the reception, conversion and transmission or regeneration of voice, images or other data,
including switching and routing apparatus 1,991 1,956 1,778 -9.1 1201.90 Soybeans, whether or not broken, other than seed (a) 1,481 1,528 3.2 7108.12 Gold, nonmonetary, unwrought n.e.s.o.i. (other than powder) 8,892 7,363 1,497 -79.7 8411.99 Parts of gas turbines, n.e.s.o.i. (other than parts for turbojets or turbopropellers) 1,658 1,817 1,481 -18.5 0802.12 Almonds, fresh or dried, shelled 938 1,012 1,446 42.8 9701.10 Paintings, drawings and pastels, hand-executed works of art, framed or not framed 1,080 1,126 1,402 24.4 8703.23 Passenger motor vehicles with spark-ignition internal combustion reciprocating piston engine, cylinder
capacity over 1,500 cc but not over 3,000 cc 5,616 1,381 1,319 -4.5 9018.19 Electro-diagnostic apparatus (and apparatus for functional exploratory examination or for checking
physiological parameters) n.e.s.o.i., and parts, etc. 1,376 1,214 1,161 -4.4 9021.39 Artificial parts of the body (other than artificial joints) and parts and accessories thereof, n.e.s.o.i. 754 1,049 1,125 7.3 7112.99 Precious metal (other than of gold or platinum) waste and scrap, including metal clad with precious
metals, n.e.s.o.i. 1,724 1,453 1,122 -22.8 8803.30 Parts of airplanes or helicopters, n.e.s.o.i. 1,179 1,175 1,105 -6.0 2933.39 Heterocyclic compounds containing an unfused pyridine ring (whether or not hydrogenated) in the
structure, n.e.s.o.i. 1,024 1,142 1,072 -6.2 8471.50 Processing units other than those of 8471.41 and 8471.49, n.e.s.o.i.. 1,082 1,244 1,015 -18.5 2934.99 Nucleic acids and their salts, whether or not chemically defined; other heterocyclic compounds; n.e.s.o.i. 952 819 990 21.0
Total of items shown 97,238 99,074 94,980 -4.1 All other HTS subheadings 144,349 136,842 136,696 -0.1
Total U.S. domestic exports to the EU-28 241,587 235,916 231,676 -1.8 Source: USDOC. Note: Because of rounding, figures may not add to totals shown. The abbreviation “n.e.s.o.i.” stands for “not elsewhere specified or included.” aTrade in 2011 reported under HTS tariff line 1201.00.
259

Table A.29 Leading U.S. imports for consumption from the European Union (28), by HTS provision, 2011–13 HTS provision Description 2011 2012 2013
% change 2012–13
Million $ 8703.24 Passenger motor vehicles with spark-ignition internal combustion reciprocating piston engine, cylinder capacity
over 3,000 cc 15,399 18,571 19,012 2.4
8703.23 Passenger motor vehicles with spark-ignition internal combustion reciprocating piston engine, cylinder capacity over 1,500 cc but not over 3,000 cc
12,634 14,839 17,691 19.2
2710.12 Light oils and preparations (a) 17,778 15,250 -14.2 3004.90 Medicaments, in measured doses, etc. (excluding vaccines, etc., coated bandages, etc., and pharmaceutical
goods), n.e.s.o.i. 20,438 16,888 14,871 -11.9
8411.91 Parts of turbojets or turbopropellers 5,909 6,510 6,878 5.6 8802.40 Airplanes and other aircraft n.e.s.o.i., of an unladen weight exceeding 15,000 kg 4,018 3,750 5,510 46.9 2710.19 Petroleum oils and oils (not light) from bituminous minerals or preps n.e.s.o.i. 70%+ by weight from petroleum
oils or bituminous minerals 6,043 4,785 5,458 14.1
9701.10 Paintings, drawings and pastels, hand-executed works of art, framed or not framed 3,745 4,476 5,190 16.0 8803.30 Parts of airplanes or helicopters, n.e.s.o.i. 3,791 4,490 4,522 0.7 3002.10 Antisera and other blood fractions, and modified immunological products 2,576 3,501 4,312 23.2 7102.39 Diamonds, nonindustrial, worked, including polished or drilled 3,792 3,647 4,127 13.2 2933.59 Heterocyclic compounds containing a pyrimidine ring (hydrogenated or not) or a piperazine ring in the
structure, n.e.s.o.i. 2,920 3,259 4,066 24.8
2933.99 Heterocyclic compounds with nitrogen hetero-atom(s) only, n.e.s.o.i. 6,027 5,087 3,845 -24.4 2934.99 Nucleic acids and their salts, whether or not chemically defined; other heterocyclic compounds; n.e.s.o.i. 6,770 4,694 3,698 -21.2 3004.39 Medicaments, in measured doses, etc., containing hormones or other steroids used primarily as hormones, but
not containing antibiotics, n.e.s.o.i. 3,414 4,027 3,606 -10.5
8411.12 Turbojets of a thrust exceeding 25 kn 2,602 3,477 3,594 3.4 3004.31 Medicaments, in measured doses, etc., containing insulin but not containing antibiotics 2,105 2,885 3,587 24.3 9021.39 Artificial parts of the body (other than artificial joints) and parts and accessories thereof, n.e.s.o.i. 2,263 2,519 2,787 10.7 2204.21 Wine of fresh grapes (other than sparkling wine) and grape must with fermentation prevented, etc., by adding
alcohol, containers of not over 2 liters 2,493 2,573 2,765 7.5
3002.20 Vaccines for human medicine 1,548 1,382 2,383 72.4 9018.90 Instruments and appliances for medical, surgical or veterinary sciences, n.e.s.o.i., and parts and accessories
thereof 2,222 2,193 2,318 5.7
8517.62 Machines for the reception, conversion and transmission or regeneration of voice, images or other data, including switching and routing apparatus
1,444 2,153 2,164 0.5
3302.10 Mixtures of odoriferous substances and mixtures (including alcoholic solutions) with a basis of these substances used in the food or drink industries
1,832 1,787 2,044 14.4
3002.90 Human blood; animal blood prepared for therapeutic, etc., uses; toxins, cultures of micro-organisms (excluding yeasts) and similar products n.e.s.o.i.
4,864 3,276 1,779 -45.7
8481.80 Taps, cocks, valves and similar appliances for pipes, vats or the like, including thermostatically controlled valves, n.e.s.o.i.
1,605 1,701 1,777 4.5
Total of items shown 120,454 140,248 143,235 2.1 All other HTS subheadings 242,402 234,322 238,356 1.7
Total U.S. imports for consumption from the EU-28 362,856 374,570 381,591 1.9 Source: Official trade statistics of the USDOC as maintained by the USITC. Note: Because of rounding, figures may not add to totals shown. The abbreviation "n.e.s.o.i." stands for "not elsewhere specified or included." aTrade in 2011 reported under HTS tariff line 2710.11.
260

Table A.30 U.S. merchandise trade with Canada, by USITC digest sectors, 2011–13 Sector Grouping Description 2011 2012 2013
% change 2012–13
Million $
Domestic exports: 1 Agricultural products 20,637 22,285 23,087 3.6 2 Forest products 10,249 10,236 10,257 0.2 3 Chemicals and related products 35,319 36,027 36,043 0.0 4 Energy-related products 17,437 18,204 24,720 35.8 5 Textiles and apparel 3,675 3,873 3,849 -0.6 6 Footwear 94 116 125 7.7 7 Minerals and metals 28,710 28,691 27,585 -3.9 8 Machinery 23,025 24,938 24,658 -1.1 9 Transportation equipment 63,354 67,427 68,452 1.5 10 Electronic products 18,207 18,455 17,731 -3.9 11 Miscellaneous manufactures 5,710 6,451 6,476 0.4 12 Special provisions 7,357 7,496 8,701 16.1
Total 233,774 244,199 251,685 3.1 Imports for consumption:
1 Agricultural products 21,893 23,203 24,913 7.4 2 Forest products 16,521 16,464 18,088 9.9 3 Chemicals and related products 34,515 34,161 33,762 -1.2 4 Energy-related products 103,749 103,042 109,739 6.5 5 Textiles and apparel 2,320 2,413 2,323 -3.8 6 Footwear 55 49 47 -2.8 7 Minerals and metals 35,358 32,529 33,380 2.6 8 Machinery 12,511 13,350 13,521 1.3 9 Transportation equipment 64,420 73,230 71,358 -2.6 10 Electronic products 9,758 9,513 9,074 -4.6 11 Miscellaneous manufactures 4,628 4,472 4,394 -1.7 12 Special provisions 10,668 11,498 12,287 6.9
Total 316,397 323,925 332,887 2.8
Source: Official trade statistics of the USDOC as maintained by the USITC. Note: Because of rounding, figures may not add to totals shown.
261

Table A.31 Leading U.S. domestic exports to Canada, by Schedule B subheading, 2011–13 Schedule B subheading Description 2011 2012 2013
% change 2012–13
Million $ 8704.31 Motor vehicles for goods transport n.e.s.o.i., with spark-ignition internal combustion piston engine,
gross vehicle weight not over 5 metric tons 6,359 6,581 7,291 10.8
2710.12 Light oils and preparations (a) 5,170 7,196 39.2 8703.24 Passenger motor vehicles with spark-ignition internal combustion reciprocating piston engine,
cyclinder capacity over 3,000 cc 5,076 5,304 5,909 11.4
8703.23 Passenger motor vehicles with spark-ignition internal combustion reciprocating piston engine, cylinder capacity over 1,500 cc but not over 3,000 cc
5,622 5,942 5,902 -0.7
2710.19 Petroleum oils and oils (not light) from bituminous minerals or preps n.e.s.o.i. 70%+ by weight from petroleum oils or bituminous minerals
4,951 4,281 5,386 25.8
8800.00 Aircraft, spacecraft, and parts thereof 4,544 4,320 5,363 24.1 8708.29 Parts and accessories of bodies (including cabs) for motor vehicles, n.e.s.o.i. 4,640 5,060 5,071 0.2 2709.00 Petroleum oils and oils from bituminous minerals, crude 1,459 2,183 4,818 120.8 2711.21 Natural gas, gaseous 3,685 2,761 3,655 32.4 8407.34 Spark-ignition reciprocating piston engines for propulsion of vehicles except railway or tramway stock,
over 1,000 cc cylinder capacity 3,029 3,723 3,548 -4.7
8708.40 Gear boxes and parts thereof, for motor vehicles 2,468 2,381 2,788 17.1 8708.99 Parts and accessories for motor vehicles, n.e.s.o.i. 2,060 2,190 2,156 -1.5 8701.20 Road tractors for semi-trailers 1,709 2,032 1,848 -9.1 3004.90 Medicaments, in measured doses, etc. (excluding vaccines, etc., coated bandages, etc., and
pharmaceutical goods), n.e.s.o.i. 2,330 1,939 1,757 -9.4
8481.80 Taps, cocks, valves and similar appliances for pipes, vats or the like, including thermostatically controlled valves, n.e.s.o.i.
1,197 1,357 1,372 1.1
8716.10 Trailers and semi-trailers for housing or camping 1,056 1,123 1,192 6.2 8716.39 Trailers and semi-trailers for the transport of goods, n.e.s.o.i. 928 1,101 1,162 5.5 8708.80 Suspension systems and parts thereof, for motor vehicles 1,151 1,272 1,161 -8.7 2106.90 Food preparations n.e.s.o.i. 941 1,098 1,144 4.2 7108.12 Gold, nonmonetary, unwrought n.e.s.o.i. (other than powder) 180 498 1,111 123.2 7606.12 Aluminum alloy rectangular (including square) plates, sheets and strip, over 0.2 mm thick 1,174 1,162 1,110 -4.4 8704.22 Motor vehicles for goods transport n.e.s.o.i., with compression-ignition internal combustion piston
engine (diesel), gross vehicle weight over 5 but not over 20 metric tons 913 891 1,069 19.9
8708.30 Brakes and servo-brakes and parts thereof n.e.s.o.i., for motor vehicles 973 1,092 1,017 -6.8 8708.94 Steering wheels, steering columns and steering boxes and parts thereof, for motor vehicles 744 841 978 16.2 1905.90 Bread, pastry, cakes, biscuits and similar baked products, n.e.s.o.i., and puddings, whether or not
containing chocolate, fruit, nuts or confectionery 736 847 937 10.6
Total of items shown 57,923 65,146 74,941 15.0 All other HTS subheadings 175,851 179,053 176,744 -1.3
Total U.S. domestic exports to Canada 233,774 244,199 251,685 3.1 Source: Official trade statistics of the USDOC as maintained by the USITC. Note: Because of rounding, figures may not add to totals shown. The abbreviation “n.e.s.o.i.” stands for “not elsewhere specified or included.” aTrade in 2011 reported under HTS tariff line 2710.11.
262

Table A.32 Leading U.S. imports for consumption from Canada, by HTS provision, 2011–13 HTS provision Description 2011 2012 2013
% change 2012–13
Million $ 2709.00 Petroleum oils and oils from bituminous minerals, crude 65,436 69,468 74,053 6.6 8703.24 Passenger motor vehicles with spark-ignition internal combustion reciprocating piston engine, cylinder
capacity over 3,000 cc 25,474 28,787 25,458 -11.6
8703.23 Passenger motor vehicles with spark-ignition internal combustion reciprocating piston engine, cylinder capacity over 1,500 cc but not over 3,000 cc
12,609 16,257 17,679 8.7
2711.21 Natural gas, gaseous 12,825 7,927 9,446 19.2 2710.19 Petroleum oils and oils (not light) from bituminous minerals or preps n.e.s.o.i. 70%+ by weight from
petroleum oils or bituminous minerals 8,645 9,431 9,236 -2.1
2710.12 Light oils and preparations (a) 7,122 7,123 0.0 4407.10 Coniferous wood sawn or chipped lengthwise, sliced or peeled, whether or not planed, etc., over 6 mm
(.236 in.) thick 2,658 3,246 4,226 30.2
7108.12 Gold, nonmonetary, unwrought n.e.s.o.i. (other than powder) 3,646 2,553 3,179 24.5 8708.29 Parts and accessories of bodies (including cabs) for motor vehicles, n.e.s.o.i. 2,615 2,972 3,119 4.9 7601.10 Aluminum, not alloyed, unwrought 2,627 2,242 3,118 39.1 3104.20 Potassium chloride 3,560 3,225 3,073 -4.7 3004.90 Medicaments, in measured doses, etc. (excluding vaccines, etc., coated bandages, etc., and
pharmaceutical goods), n.e.s.o.i. 2,503 2,758 2,579 -6.5
8708.99 Parts and accessories for motor vehicles, n.e.s.o.i. 2,195 2,294 2,312 0.8 8802.40 Airplanes and other aircraft n.e.s.o.i., of an unladen weight exceeding 15,000 kg 1,299 1,467 2,294 56.3 2716.00 Electrical energy 2,096 1,914 2,293 19.8 7601.20 Aluminum alloys, unwrought 2,346 2,157 2,121 -1.7 2711.12 Propane, liquefied 2,156 1,878 1,915 2.0 8407.34 Spark-ignition reciprocating piston engines for propulsion of vehicles except railway or tramway stock,
over 1,000 cc cylinder capacity 2,486 2,612 1,900 -27.3
3901.90 Polymers of ethylene n.e.s.o.i., in primary forms 1,832 1,629 1,823 11.9 2713.20 Petroleum bitumen 1,732 1,546 1,550 0.3 7118.90 Coin, n.e.s.o.i. 1,589 1,237 1,541 24.6 4802.61 Uncoated paper/paperboard for writing/printing/other graphic purposes n.e.s.o.i., over 10% total fiber by
mechanical/chemical process, in rolls 1,639 1,401 1,491 6.4
4703.21 Chemical woodpulp, soda or sulfate, other than dissolving grades, semibleached or bleached, coniferous 1,836 1,398 1,446 3.5 8803.30 Parts of airplanes or helicopters, n.e.s.o.i. 1,030 1,213 1,367 12.6 3901.20 Polyethylene having a specific gravity of 0.94 or more, in primary forms 1,187 1,246 1,357 8.9
Total of items shown 166,024 177,980 185,699 4.3 All other HTS subheadings 150,373 145,945 147,188 0.9
Total U.S. imports for consumption from Canada 316,397 323,925 332,887 2.8 Source: Official trade statistics of the USDOC as maintained by the USITC. Note: Because of rounding, figures may not add to totals shown. The abbreviation “n.e.s.o.i.” stands for “not elsewhere specified or included.” aTrade in 2011 reported under HTS tariff line 2710.11.
263

Table A.33 U.S. merchandise trade with China, by USITC digest sectors, 2011–13 Sector Grouping Description 2011 2012 2013
% change 2012–13
Million $
Domestic exports: 1 Agricultural products 20,089 27,266 27,176 -0.3 2 Forest products 6,722 6,208 6,791 9.4 3 Chemicals and related products 15,021 14,205 14,128 -0.5 4 Energy-related products 2,308 2,785 3,057 9.8 5 Textiles and apparel 1,240 1,243 1,412 13.6 6 Footwear 56 47 44 -5.7 7 Minerals and metals 13,489 12,099 11,998 -0.8 8 Machinery 8,946 8,539 9,085 6.4 9 Transportation equipment 15,827 17,494 25,038 43.1 10 Electronic products 11,889 12,331 14,123 14.5 11 Miscellaneous manufactures 425 458 508 10.9 12 Special provisions 886 834 954 14.3
Total 96,898 103,508 114,313 10.4 Imports for consumption:
1 Agricultural products 6,498 7,043 6,967 -1.1 2 Forest products 7,333 8,080 8,277 2.4 3 Chemicals and related products 25,637 27,975 29,445 5.3 4 Energy-related products 620 390 498 27.7 5 Textiles and apparel 44,798 44,949 46,239 2.9 6 Footwear 16,677 17,026 16,876 -0.9 7 Minerals and metals 25,258 26,890 27,616 2.7 8 Machinery 36,534 40,730 44,024 8.1 9 Transportation equipment 15,284 16,866 17,813 5.6 10 Electronic products 158,671 171,159 175,212 2.4 11 Miscellaneous manufactures 57,041 59,339 60,574 2.1 12 Special provisions 4,116 4,425 4,606 4.1
Total 398,467 424,874 438,147 3.1
Source: Official trade statistics of the USDOC as maintained by the USITC. Note: Because of rounding, figures may not add to totals shown.
264

Table A.34 Leading U.S. domestic exports to China, by Schedule B subheading, 2011–13 Schedule B subheading Description 2011 2012 2013
% change 2012–13
Million $ 1201.90 Soybeans, whether or not broken, other than seed (a) 14,973 13,365 -10.7 8800.00 Aircraft, spacecraft, and parts thereof 6,322 7,874 12,076 53.4 8703.23 Passenger motor vehicles with spark-ignition internal combustion reciprocating piston engine, cylinder
capacity over 1,500 cc but not over 3,000 cc 2,912 2,881 4,916 70.6
8703.24 Passenger motor vehicles with spark-ignition internal combustion reciprocating piston engine, cylinder capacity over 3,000 cc
1,562 1,955 2,996 53.2
7404.00 Copper waste and scrap 3,454 2,944 2,773 -5.8 7602.00 Aluminum waste and scrap 2,731 2,370 2,253 -4.9 5201.00 Cotton, not carded or combed 2,562 3,422 2,181 -36.3 8542.31 Processors or controllers 2,188 1,339 1,549 15.6 2303.30 Brewing or distilling dregs and waste, whether or not in the form of pellets 340 618 1,395 125.8 1001.99 Wheat and meslin other than durum or seed wheat (b) 213 1,295 508.1 1005.90 Corn (maize), other than seed corn 850 1,319 1,255 -4.9 4707.10 Waste and scrap of unbleached kraft paper or paperboard or of corrugated paper or paperboard 1,086 1,210 1,061 -12.3 4101.50 Whole raw bovine or equine hides and skins, of weight exceed 16 kg, fresh, pickled or otherwise preserved
but not tanned or further prepared 618 827 1,040 25.8
9030.40 Instruments and apparatus n.e.s.o.i., specially designed for telecommunications (for example, cross-talk meters, gain measuring instruments, etc.)
149 571 986 72.5
2701.12 Bituminous coal, whether or not pulverized, but not agglomerated 828 1,222 895 -26.7 4403.20 Coniferous wood in the rough, whether or not stripped of bark or sapwood or roughly squared, not treated 825 570 862 51.4 8542.32 Memories 337 301 832 175.9 4703.21 Chemical woodpulp, soda or sulfate, other than dissolving grades, semibleached or bleached, coniferous 782 702 824 17.5 8486.20 Machines and apparatus for the manufacture of semiconductor devices or electronic integrated circuits 565 439 801 82.6 7204.49 Ferrous waste and scrap, n.e.s.o.i. 1,588 678 626 -7.7 2603.00 Copper ores and concentrates 687 664 612 -7.8 8408.90 Compression-ignition internal combustion piston engines (diesel or semi-diesel engines), n.e.s.o.i. 678 569 573 0.7 7108.12 Gold, nonmonetary, unwrought n.e.s.o.i. (other than powder) 156 (c) 572 (d) 2710.12 Light oils and preparations (e) 394 559 41.8 2713.11 Petroleum coke, not calcined 471 342 524 53.3
Total of items shown 31,691 48,398 56,822 17.4 All other HTS subheadings 65,207 55,109 57,491 4.3
Total U.S. domestic exports to China 96,898 103,508 114,313 10.4 Source: Official trade statistics of the USDOC as maintained by the USITC. Note: Because of rounding, figures may not add to totals shown. The abbreviation “n.e.s.o.i.” stands for “not elsewhere specified or included.” aTrade in 2011 reported under HTS tariff line 1201.00. bTrade in 2011 reported under HTS tariff line 1001.90. cLess than $500,000. dOver 1000%. eTrade in 2011 reported under HTS tariff line 2710.11.
265

Table A.35 Leading U.S. imports for consumption from China, by HTS provision, 2011–13 HTS provision Description 2011 2012 2013
% change 2012–13
Million $ 8471.30 Portable automatic data processing machines, weight not more than 10 kg, consisting of at least a
central processing unit, keyboard and display 39,336 40,896 39,612 -3.1
8517.12 Telephones for cellular networks or for other wireless networks 22,916 33,351 36,878 10.6 8517.62 Machines for the reception, conversion and transmission or regeneration of voice, images or other
data, including switching and routing apparatus 9,319 10,871 11,956 10.0
9503.00 Toys, including riding toys other than bicycles, puzzles, reduced-scale models 9,401 9,307 9,454 1.6 8473.30 Parts and accessories for automatic data processing machines and units thereof, magnetic or optical
readers, transcribing machines, etc., n.e.s.o.i. 8,780 8,582 8,803 2.6
9504.50 Video game consoles and machines, other than of 9504.30; parts and accessories (a) 4,733 4,649 -1.8 6403.99 Footwear, with outer soles of rubber, plastics or composition leather and uppers of leather n.e.s.o.i.,
not covering the ankle 4,399 4,148 4,268 2.9
8504.40 Electrical static converters; power supplies for adp machines or units of 8471 3,475 3,619 3,997 10.4 8471.70 Automatic data processing storage units, n.e.s.o.i. 3,614 4,225 3,784 -10.4 6402.99 Footwear, with outer soles and uppers of rubber or plastics n.e.s.o.i., not covering the ankle 3,697 3,977 3,774 -5.1 8443.99 Parts and accessories of printing machinery, n.e.s.o.i. 3,519 3,344 3,721 11.3 8443.31 Machines which perform two or more of the functions of printing, copying or facsimile transmission,
capable of connecting to an automatic data processing machine or to a network 4,018 3,827 3,542 -7.5
6110.20 Sweaters, pullovers, sweatshirts, vests and similar articles of cotton, knitted or crocheted 3,408 3,066 3,301 7.7 4202.92 Container bags, boxes, cases and satchels n.e.s.o.i., with outer surface of sheeting of plastics or of
textile materials 2,893 3,071 3,071 0.0
8528.51 Monitors, other than CRT, designed for use with automatic data processing machines 3,452 3,138 2,999 -4.4 8528.72 Reception apparatus for television, incorporating a screen or video display device, color 4,012 4,224 2,989 -29.2 8471.50 Processing units other than those of 8471.41 and 8471.49, n.e.s.o.i. 3,373 2,838 2,787 -1.8 9401.61 Seats with wooden frames, upholstered, n.e.s.o.i. 2,085 2,464 2,761 12.0 8471.49 Automatic data processing machines and units thereof presented in the form of systems, n.e.s.o.i. 1,957 1,762 2,740 55.5 9403.20 Metal furniture, n.e.s.o.i. 2,299 2,528 2,692 6.5 6403.91 Footwear, with outer soles of rubber, plastics or composition leather and uppers of leather, n.e.s.o.i.,
covering the ankle 2,486 2,537 2,451 -3.4
9405.40 Electric lamps and lighting fittings, n.e.s.o.i. 1,544 2,075 2,421 16.7 9403.60 Wooden furniture, n.e.s.o.i. 2,311 2,390 2,416 1.1 6204.62 Women’s or girls’ trousers, bib and brace overalls, breeches and shorts of cotton, not knitted or
crocheted 2,092 2,335 2,398 2.7
8517.70 Parts of telecommunications apparatus 2,161 2,198 2,378 8.2 Total of items shown 146,547 165,510 169,841 2.6
All other HTS subheadings 251,920 259,364 268,306 3.4 Total U.S. imports for consumption from China 398,467 424,874 438,147 3.1
Source: Official trade statistics of the USDOC as maintained by the USITC. Note: Because of rounding, figures may not add to totals shown. The abbreviation “n.e.s.o.i.” stands for “not elsewhere specified or included.” aTrade in 2011 reported under HTS tariff line 9504.10.
266

Table A.36 U.S. merchandise trade with Mexico, by USITC digest sectors, 2011–13 Sector Grouping Description 2011 2012 2013
% change 2012–13
Million $ Domestic exports:
1 Agricultural products 18,425 18,981 18,258 -3.8 2 Forest products 5,067 5,239 5,391 2.9 3 Chemicals and related products 27,670 30,652 31,736 3.5 4 Energy-related products 23,652 24,152 23,386 -3.2 5 Textiles and apparel 4,075 4,162 4,419 6.2 6 Footwear 65 57 44 -23.2 7 Minerals and metals 15,764 17,766 18,918 6.5 8 Machinery 13,450 15,508 16,491 6.3 9 Transportation equipment 27,130 31,213 33,695 8.0 10 Electronic products 16,733 18,945 20,737 9.5 11 Miscellaneous manufactures 1,755 1,890 1,736 -8.1 12 Special provisions 6,126 6,596 6,878 4.3
Total 159,910 175,159 181,690 3.7 Imports for consumption:
1 Agricultural products 17,122 17,732 19,066 7.5 2 Forest products 1,490 1,525 1,651 8.3 3 Chemicals and related products 8,374 9,101 9,686 6.4 4 Energy-related products 44,475 39,375 34,126 -13.3 5 Textiles and apparel 5,881 5,782 5,826 0.8 6 Footwear 371 492 548 11.3 7 Minerals and metals 21,944 21,997 19,257 -12.5 8 Machinery 23,144 25,280 26,292 4.0 9 Transportation equipment 67,167 77,547 84,769 9.3 10 Electronic products 61,996 65,344 63,627 -2.6 11 Miscellaneous manufactures 3,908 4,976 5,364 7.8 12 Special provisions 6,798 7,258 7,451 2.7
Total 262,671 276,408 277,664 0.5
Source: Official trade statistics of the USDOC as maintained by the USITC. Note: Because of rounding, figures may not add to totals shown
267

Table A.37 Leading U.S. domestic exports to Mexico, by Schedule B subheading, 2011–13 Schedule B subheading Description 2011 2012 2013
% change 2012–13
Million $ 2710.12 Light oils and preparations (a) 11,648 11,373 -2.4 2710.19 Petroleum oils and oils (not light) from bituminous minerals or preps n.e.s.o.i. 70%+ by weight from
petroleum oils or bituminous minerals 5,826 8,269 7,215 -12.7
8708.99 Parts and accessories for motor vehicles, n.e.s.o.i. 4,751 4,971 4,254 -14.4 8800.00 Aircraft, spacecraft, and parts thereof 1,408 2,219 2,859 28.8 8708.29 Parts and accessories of bodies (including cabs) for motor vehicles, n.e.s.o.i. 1,940 2,009 2,347 16.9 8473.30 Parts and accessories for automatic data processing machines and units thereof, magnetic or optical
readers, transcribing machines, etc., n.e.s.o.i. 858 2,165 2,266 4.6
8408.20 Compression-ignition internal combustion piston engines (diesel or semi-diesel), for the propulsion of vehicles except railway or tramway stock
1,682 1,865 2,248 20.5
2711.21 Natural gas, gaseous 1,748 1,584 2,163 36.5 3926.90 Articles of plastics, n.e.s.o.i. 1,458 1,684 1,887 12.1 8708.40 Gear boxes and parts thereof, for motor vehicles 1,421 1,645 1,860 13.1 8703.23 Passenger motor vehicles with spark-ignition internal combustion reciprocating piston engine, cylinder
capacity over 1,500 cc but not over 3,000 cc 1,841 2,178 1,816 -16.6
1005.90 Corn (maize), other than seed corn 2,658 2,560 1,789 -30.1 8703.24 Passenger motor vehicles with spark-ignition internal combustion reciprocating piston engine, cylinder
capacity over 3,000 cc 1,183 1,309 1,597 22.0
2603.00 Copper ores and concentrates 813 922 1,549 68.0 1201.90 Soybeans, whether or not broken, other than seed (b) 1,860 1,544 -17.0 8538.90 Parts for electrical apparatus for electrical circuits, boards, panels, etc., for electric control or distribution
of electricity, n.e.s.o.i. 1,264 1,456 1,492 2.5
2902.43 Para-xylene (1,4-dimethylbenzene) 1,516 1,423 1,456 2.3 7326.90 Articles of iron or steel, n.e.s.o.i. 1,077 1,268 1,288 1.6 8544.49 Insulated electric conductors, for a voltage not exceeding 1000 v, not fitted with connectors 883 1,236 1,279 3.5 8536.90 Electrical apparatus for switching, protecting or making connections to or in electrical circuits, for a
voltage not exceeding 1,000 v, n.e.s.o.i. 887 1,134 1,218 7.4
8409.91 Parts for use with spark-ignition internal combustion piston engines (including rotary engines), n.e.s.o.i. 798 976 1,090 11.7 2909.19 Acyclic ethers (excluding diethyl ether) and their halogenated, sulfonated, nitrated or nitrosated
derivatives 792 1,219 1,060 -13.1
3901.20 Polyethylene having a specific gravity of 0.94 or more, in primary forms 845 856 954 11.4 8708.50 Drive axles with differential and non-drive axles and parts thereof, for motor vehicles 778 917 940 2.6 7606.12 Aluminum alloy rectangular (including square) plates, sheets and strip, over 0.2 mm thick 817 869 939 8.0
Total of items shown 37,244 58,244 58,482 0.4 All other HTS subheadings 122,666 116,916 123,208 5.4
Total U.S. domestic exports to Mexico 159,910 175,159 181,690 3.7 Source: Official trade statistics of the USDOC as maintained by the USITC. Note: Because of rounding, figures may not add to totals shown. The abbreviation “n.e.s.o.i.” stands for “not elsewhere specified or included.” aTrade in 2011 reported under HTS tariff line 2710.11. bTrade in 2011 reported under HTS tariff line 1201.00.
268

Table A.38 Leading U.S. imports for consumption from Mexico, by HTS provision, 2011–13 HTS provision Description 2011 2012 2013
% change 2012–13
Million $ 2709.00 Petroleum oils and oils from bituminous minerals, crude 40,165 36,776 31,208 -15.1 8703.23 Passenger motor vehicles with spark-ignition internal combustion reciprocating piston engine, cylinder
capacity over 1,500 cc but not over 3,000 cc 11,415 12,208 15,501 27.0
8471.50 Processing units other than those of 8471.41 and 8471.49, n.e.s.o.i. 10,503 11,055 11,172 1.1 8528.72 Reception apparatus for television, incorporating a screen or video display device, color 11,973 11,477 10,733 -6.5 8704.31 Motor vehicles for goods transport n.e.s.o.i., with spark-ignition internal combustion piston engine,
gross vehicle weight not over 5 metric tons 7,494 9,016 9,897 9.8
8517.62 Machines for the reception, conversion and transmission or regeneration of voice, images or other data, including switching and routing apparatus
5,234 5,958 6,545 9.9
8544.30 Insulated ignition wiring sets and other wiring sets for vehicles, aircraft and ships 4,735 5,499 5,681 3.3 9401.90 Parts of seats (except parts of medical, dentist’s, barbers’ and similar seats), n.e.s.o.i. 3,917 4,850 5,165 6.5 8701.20 Road tractors for semi-trailers 4,074 4,477 5,010 11.9 8708.29 Parts and accessories of bodies (including cabs) for motor vehicles, n.e.s.o.i. 2,680 3,391 3,797 12.0 7108.12 Gold, nonmonetary, unwrought n.e.s.o.i. (other than powder) 5,543 5,427 3,665 -32.5 8537.10 Boards, panels, consoles, etc., with electrical apparatus, for electric control or distribution of electricity,
for a voltage not exceeding 1,000 v 2,328 2,846 3,438 20.8
8704.22 Motor vehicles for goods transport n.e.s.o.i., with compression-ignition internal combustion piston engine (diesel), gross vehicle weight over 5 but not over 20 metric tons
2,568 2,842 3,293 15.9
8708.99 Parts and accessories for motor vehicles, n.e.s.o.i. 2,531 3,185 3,146 -1.2 9018.90 Instruments and appliances for medical, surgical or veterinary sciences, n.e.s.o.i., and parts and
accessories thereof 2,680 2,682 2,784 3.8
8703.24 Passenger motor vehicles with spark-ignition internal combustion reciprocating piston engine, cylinder capacity over 3,000 cc
2,488 3,347 2,753 -17.8
8407.34 Spark-ignition reciprocating piston engines for propulsion of vehicles except railway or tramway stock, over 1,000 cc cylinder capacity
1,775 2,051 2,743 33.8
7106.91 Silver, unwrought n.e.s.o.i. (other than powder) 3,433 3,469 2,713 -21.8 8418.10 Combined refrigerator-freezers fitted with separate external doors 2,168 2,241 2,441 8.9 8708.40 Gear boxes and parts thereof, for motor vehicles 1,907 2,089 2,309 10.5 8528.71 Reception apparatus for television, not designed to incorporate a screen or video display device 2,211 3,238 2,163 -33.2 8409.91 Parts for use with spark-ignition internal combustion piston engines (including rotary engines), n.e.s.o.i. 1,906 2,069 2,103 1.7 2203.00 Beer made from malt 1,677 1,819 1,917 5.4 8708.95 Safety airbag with inflator system and parts thereof, for motor vehicles 1,396 1,646 1,771 7.6 8704.21 Motor vehicles for goods transport n.e.s.o.i., with compression-ignition internal combustion piston
engine (diesel), gross vehicle weight not over 5 metric tons 980 1,342 1,692 26.1
Total of items shown 137,783 144,998 143,642 -0.9 All other HTS subheadings 124,888 131,411 134,022 2.0
Total U.S. imports for consumption from Mexico 262,671 276,408 277,664 0.5 Source: Official trade statistics of the USDOC as maintained by the USITC. Note: Because of rounding, figures may not add to totals shown. The abbreviation “n.e.s.o.i.” stands for “not elsewhere specified or included.”
269

Table A.39 U.S. merchandise trade with Japan, by USITC digest sectors, 2011–13 Sector Grouping Description 2011 2012 2013
% change 2012–13
Million $
Domestic exports: 1 Agricultural products 15,277 14,585 13,174 -9.7 2 Forest products 2,209 2,156 2,218 2.9 3 Chemicals and related products 11,609 12,201 10,745 -11.9 4 Energy-related products 3,494 3,547 3,199 -9.8 5 Textiles and apparel 518 549 618 12.6 6 Footwear 66 67 56 -16.2 7 Minerals and metals 3,670 3,088 3,213 4.0 8 Machinery 3,467 3,068 3,409 11.1 9 Transportation equipment 7,748 11,463 10,046 -12.4 10 Electronic products 10,631 11,264 10,419 -7.5 11 Miscellaneous manufactures 1,586 1,591 1,589 -0.1 12 Special provisions 1,133 1,020 1,002 -1.8
Total 61,409 64,599 59,689 -7.6 Imports for consumption:
1 Agricultural products 759 780 766 -1.8 2 Forest products 517 531 474 -10.8 3 Chemicals and related products 12,269 12,433 12,138 -2.4 4 Energy-related products 610 616 746 21.2 5 Textiles and apparel 700 739 688 -6.9 6 Footwear 2 2 5 102.6 7 Minerals and metals 6,971 8,024 7,362 -8.3 8 Machinery 19,014 20,461 18,986 -7.2 9 Transportation equipment 55,569 69,277 67,368 -2.8 10 Electronic products 26,697 26,213 24,216 -7.6 11 Miscellaneous manufactures 1,715 1,604 1,218 -24.1 12 Special provisions 3,077 3,859 3,988 3.3
Total 127,901 144,538 137,954 -4.6
Source: Official trade statistics of the USDOC as maintained by the USITC. Note: Because of rounding, figures may not add to totals shown.
270

Table A.40 Leading U.S. domestic exports to Japan, by Schedule B subheading, 2011–13 Schedule B subheading Description 2011 2012 2013
% change 2012–13
Million $ 8800.00 Aircraft, spacecraft, and parts thereof 4,024 7,017 5,997 -14.5 3004.90 Medicaments, in measured doses, etc. (excluding vaccines, etc., coated bandages, etc., and pharmaceutical
goods), n.e.s.o.i. 2,079 2,161 1,838 -15.0
1005.90 Corn (maize), other than seed corn 3,830 2,979 1,767 -40.7 0203.19 Meat of swine, n.e.s.o.i., fresh or chilled 976 1,008 1,077 6.9 1001.99 Wheat and meslin other than durum or seed wheat (a) 1,073 1,028 -4.2 1201.90 Soybeans, whether or not broken, other than seed (b) 1,126 1,003 -10.8 9018.90 Instruments and appliances for medical, surgical or veterinary sciences, n.e.s.o.i., and parts and accessories
thereof 794 935 940 0.5
2710.12 Light oils and preparations (c) 536 749 39.7 0203.29 Meat of swine, n.e.s.o.i., frozen 791 759 723 -4.7 0201.30 Meat of bovine animals, boneless, fresh or chilled 461 570 707 24.0 8486.20 Machines and apparatus for the manufacture of semiconductor devices or electronic integrated circuits 535 243 684 181.7 2909.19 Acyclic ethers (excluding diethyl ether) and their halogenated, sulfonated, nitrated or nitrosated derivatives 634 685 668 -2.5 8803.30 Parts of airplanes or helicopters, n.e.s.o.i. 594 627 651 3.9 2804.61 Silicon, containing by weight not less than 99.99% of silicon 690 625 642 2.7 9018.39 Medical, etc., needles n.e.s.o.i., catheters, cannulae and the like; parts and accessories therof 785 762 624 -18.1 1214.90 Forage products, n.e.s.o.i., including rutabagas (swedes), mangolds, fodder roots, hay, clover, forage kale,
vetches, etc., whether or not in pellet form 503 593 562 -5.2
2701.12 Bituminous coal, whether or not pulverized, but not agglomerated 1,199 897 559 -37.6 2711.12 Propane, liquefied 0 117 544 363.4 7113.19 Jewelry and parts thereof, of precious metal other than silver 429 425 472 11.0 4403.20 Coniferous wood in the rough, whether or not stripped of bark or sapwood or roughly squared, not treated 337 350 457 30.3 0202.30 Meat of bovine animals, boneless, frozen 276 306 456 48.7 3822.00 Composite diagnostic or laboratory reagents, other than those pharmaceuticals in heading 3002 or 3006;
certified reference materials 504 476 451 -5.4
3002.10 Antisera and other blood fractions, and modified immunological products 137 448 432 -3.6 2713.11 Petroleum coke, not calcined 628 484 426 -11.9 9021.39 Artificial parts of the body (other than artificial joints) and parts and accessories thereof, n.e.s.o.i. 492 412 425 3.1
Total of items shown 20,699 25,613 23,883 -6.8 All other HTS subheadings 40,709 38,986 35,806 -8.2
Total U.S. domestic exports to Japan 61,409 64,599 59,689 -7.6 Source: Official trade statistics of the USDOC as maintained by the USITC. Note: Because of rounding, figures may not add to totals shown. The abbreviation “n.e.s.o.i.” stands for “not elsewhere specified or included.” aTrade in 2011 reported under HTS tariff line 1001.90. bTrade in 2011 reported under HTS tariff line 1201.00. cTrade in 2011 reported under HTS tariff line 2710.11.
271

Table A.41 Leading U.S. imports for consumption from Japan, by HTS provision, 2011–13 HTS provision Description 2011 2012 2013
% change 2012–13
Million $ 8703.23 Passenger motor vehicles with spark-ignition internal combustion reciprocating piston engine,
cylinder capacity over 1,500 cc but not over 3,000 cc 17,343 22,252 23,047 3.6
8703.24 Passenger motor vehicles with spark-ignition internal combustion reciprocating piston engine, cyclinder capacity over 3,000 cc
11,655 13,834 13,268 -4.1
8803.30 Parts of airplanes or helicopters, n.e.s.o.i. 2,553 3,226 3,811 18.1 8443.99 Parts and accessories of printing machinery, n.e.s.o.i. 4,108 3,708 3,393 -8.5 8708.40 Gear boxes and parts thereof, for motor vehicles 2,013 2,941 2,873 -2.3 8703.22 Passenger motor vehicles with spark-ignition internal combustion reciprocating piston engine,
cylinder capacity over 1,000 cc but not over 1,500 cc 1,941 2,715 2,499 -7.9
8708.99 Parts and accessories for motor vehicles, n.e.s.o.i. 2,493 2,927 2,288 -21.8 8429.52 Mechanical shovels, excavators and shovel loaders with 360 degree revolving superstructure, self-
propelled 1,571 2,697 1,865 -30.9
8486.20 Machines and apparatus for the manufacture of semiconductor devices or electronic integrated circuits
2,618 2,121 1,665 -21.5
8411.91 Parts of turbojets or turbopropellers 1,149 1,372 1,624 18.3 8525.80 Television cameras; digital cameras and video camera recorders 2,110 2,277 1,422 -37.5 2933.79 Lactams (excluding 6-hexanelactam), n.e.s.o.i. 1,102 1,112 1,278 15.0 8409.91 Parts for use with spark-ignition internal combustion piston engines (including rotary engines),
n.e.s.o.i. 881 1,099 1,088 -1.0
9102.11 Wrist watches, battery powered, with cases of materials (except of or clad with precious metal) n.e.s.o.i., with mechanical display only
842 863 962 11.5
8486.90 Parts and accessories 1,000 968 884 -8.7 8408.90 Compression-ignition internal combustion piston engines (diesel or semi-diesel engines), n.e.s.o.i. 937 1,078 858 -20.5 8481.80 Taps, cocks, valves and similar appliances for pipes, vats or the like, including thermostatically
controlled valves, n.e.s.o.i. 678 798 810 1.5
8701.90 Tractors, n.e.s.o.i. 822 915 785 -14.3 9018.19 Electro-diagnostic apparatus (and apparatus for functional exploratory examination or for checking
physiological parameters) n.e.s.o.i., and parts, etc. 660 726 779 7.3
8457.10 Machining centers for working metal 679 941 729 -22.5 8542.31 Processors or controllers 690 723 702 -2.9 8517.62 Machines for the reception, conversion and transmission or regeneration of voice, images or other
data, including switching and routing apparatus 596 719 675 -6.2
8504.40 Electrical static converters; power supplies for automatic data processing machines or units of 8471 494 636 673 5.7 4011.10 New pneumatic tires, of rubber, of a kind used on motor cars (including station wagons and racing
cars) 917 752 657 -12.7
3818.00 Chemical elements doped for use in electronics, in the form of discs, wafers or similar forms; chemical compounds doped for use in electronics
843 738 624 -15.3
Total of items shown 60,697 72,138 69,258 -4.0 All other HTS subheadings 67,204 72,400 68,695 -5.1
Total U.S. imports for consumption from Japan 127,901 144,538 137,954 -4.6 Source: Official trade statistics of the USDOC as maintained by the USITC. Note: Because of rounding, figures may not add to totals shown. The abbreviation “n.e.s.o.i.” stands for “not elsewhere specified or included.”
272

Table A.42 U.S. merchandise trade with Korea, by USITC digest sectors, 2011–13 Sector Grouping Description 2011 2012 2013
% change 2012–13
Million $ Domestic exports:
1 Agricultural products 7,366 6,516 5,686 -12.7 2 Forest products 962 845 856 1.3 3 Chemicals and related products 6,499 6,693 6,945 3.8 4 Energy-related products 2,858 1,965 1,635 -16.8 5 Textiles and apparel 415 358 374 4.5 6 Footwear 94 101 84 -17.4 7 Minerals and metals 4,170 3,829 3,674 -4.1 8 Machinery 5,499 5,632 5,584 -0.9 9 Transportation equipment 4,807 5,578 6,180 10.8 10 Electronic products 7,158 7,172 6,714 -6.4 11 Miscellaneous manufactures 759 734 707 -3.7 12 Special provisions 724 581 569 -2.0
Total 41,311 40,004 39,008 -2.5 Imports for consumption:
1 Agricultural products 510 558 636 13.9 2 Forest products 523 516 539 4.5 3 Chemicals and related products 5,093 5,443 4,938 -9.3 4 Energy-related products 2,200 2,267 2,487 9.7 5 Textiles and apparel 1,260 1,331 1,301 -2.3 6 Footwear 21 26 23 -13.0 7 Minerals and metals 5,038 5,878 5,539 -5.8 8 Machinery 6,379 6,824 6,572 -3.7 9 Transportation equipment 15,542 18,899 21,368 13.1 10 Electronic products 17,953 14,543 16,560 13.9 11 Miscellaneous manufactures 605 663 827 24.8 12 Special provisions 882 925 1,190 28.7
Total 56,006 57,874 61,979 7.1
Source: Official trade statistics of the USDOC as maintained by the USITC. Note: Because of rounding, figures may not add to totals shown.
273

Table A.43 Leading U.S. domestic exports to Korea, by Schedule B subheading, 2011–13 Schedule B subheading Description 2011 2012 2013
% change 2012–13
Million $ 8800.00 Aircraft, spacecraft, and parts thereof 1,855 2,585 2,568 -0.6 8542.31 Processors or controllers 964 1,976 2,398 21.4 8486.20 Machines and apparatus for the manufacture of semiconductor devices or electronic integrated
circuits 1,487 1,803 1,218 -32.4
7204.49 Ferrous waste and scrap, n.e.s.o.i. 1,131 951 758 -20.3 3004.90 Medicaments, in measured doses, etc. (excluding vaccines, etc., coated bandages, etc., and
pharmaceutical goods), n.e.s.o.i. 344 541 680 25.7
2701.12 Bituminous coal, whether or not pulverized, but not agglomerated 1,020 683 494 -27.6 8803.30 Parts of airplanes or helicopters, n.e.s.o.i. 338 409 466 14.0 8431.43 Parts for boring or sinking machinery, n.e.s.o.i. 368 215 464 115.7 8486.90 Parts and accessories 477 454 384 -15.4 1001.99 Wheat and meslin other than durum or seed wheat (a) 645 340 -47.3 2926.10 Acrylonitrile 424 521 324 -37.8 2707.30 Xylenes 511 397 313 -21.2 8542.39 Electronic integrated circuits, n.e.s.o.i. 314 317 310 -2.2 8703.23 Passenger motor vehicles with spark-ignition internal combustion reciprocating piston engine,
cylinder capacity over 1,500 cc but not over 3,000 cc 199 189 296 56.2
2902.50 Styrene (vinylbenzene; phenylethylene) 88 116 295 155.0 4101.50 Whole raw bovine or equine hides and skins, of weight exceeding 16 kg, fresh, pickled or otherwise
preserved but not tanned or further prepared 180 250 293 17.5
1201.90 Soybeans, whether or not broken, other than seed (b) 395 280 -29.0 2710.12 Light oils and preparations (c) 42 275 547.6 0202.20 Meat of bovine animals, cuts with bone in (other than half or whole carcasses), frozen 213 206 265 28.7 2106.90 Food preparations n.e.s.o.i. 213 208 247 18.4 9031.41 Optical instruments for inspecting semiconductor wafers or devices or for inspecting photomasks or
reticles used in manufacturing semiconductor devices 262 388 244 -37.0
7602.00 Aluminum waste and scrap 294 287 240 -16.1 1214.90 Forage products, n.e.s.o.i., including rutabagas (swedes), mangolds, fodder roots, hay, clover, forage
kale, vetches, etc., whether or not in pellet form 201 234 234 -0.1
8479.89 Machines and mechanical appliances having individual functions, n.e.s.o.i. 96 94 225 137.9 0202.30 Meat of bovine animals, boneless, frozen 368 268 213 -20.3
Total of items shown 11,347 14,174 13,826 -2.5 All other HTS subheadings 29,964 25,829 25,182 -2.5
Total U.S. domestic exports to Korea 41,311 40,004 39,008 -2.5 Source: Official trade statistics of the USDOC as maintained by the USITC. Note: Because of rounding, figures may not add to totals shown. The abbreviation “n.e.s.o.i.” stands for “not elsewhere specified or included.” aTrade in 2011 reported under HTS tariff line 1001.90. bTrade in 2011 reported under HTS tariff line 1201.00. cTrade in 2011 reported under HTS tariff line 2710.11.
274

Table A.44 Leading U.S. imports for consumption from Korea, by HTS provision, 2011–13 HTS provision Description 2011 2012 2013
% change 2012–13
Million $ 8703.23 Passenger motor vehicles with spark-ignition internal combustion reciprocating piston engine, cylinder
capacity over 1,500 cc but not over 3,000 cc 7,617 9,079 8,665 -4.6
8517.12 Telephones for cellular networks or for other wireless networks 7,617 4,501 5,970 32.7 8703.24 Passenger motor vehicles with spark-ignition internal combustion reciprocating piston engine, cylinder
capacity over 3,000 cc 1,375 1,621 2,289 41.3
2710.19 Petroleum oils and oils (not light) from bituminous minerals or preps n.e.s.o.i. 70%+ by weight from petroleum oils or bituminous minerals
1,584 1,953 1,947 -0.3
8542.39 Electronic integrated circuits, n.e.s.o.i. 1,990 1,817 1,692 -6.8 8473.30 Parts and accessories for automatic data processing machines and units thereof, magnetic or optical
readers, transcribing machines, etc., n.e.s.o.i. 1,522 1,136 1,524 34.2
8703.22 Passenger motor vehicles with spark-ignition internal combustion reciprocating piston engine, cylinder capacity over 1,000 cc but not over 1,500 cc
3 188 1,157 517.0
8708.99 Parts and accessories for motor vehicles, n.e.s.o.i. 915 968 1,051 8.6 8418.10 Combined refrigerator-freezers fitted with separate external doors 948 979 1,029 5.1 4011.10 New pneumatic tires, of rubber, of a kind used on motor cars (including station wagons and racing cars) 1,180 1,299 1,010 -22.2 8542.32 Memories 538 542 877 61.8 8708.29 Parts and accessories of bodies (including cabs) for motor vehicles, n.e.s.o.i. 544 782 836 6.9 8905.20 Floating or submersible drilling or production platforms 110 0 830 (a) 7306.29 Seamed steel casing or tubing of kind used in drilling oil/gas, with external diameter 406.4mm or less or
other than circular cross-section 676 831 790 -4.9
8517.62 Machines for the reception, conversion and transmission or regeneration of voice, images or other data, including switching and routing apparatus
283 460 662 44.0
8708.40 Gear boxes and parts thereof, for motor vehicles 148 442 614 38.9 8451.29 Drying machines (except centrifugal type) for textile yarns, fabrics or made-up textile articles, with a dry
linen capacity exceeding 10 kg 540 477 597 25.0
8803.30 Parts of airplanes or helicopters, n.e.s.o.i. 360 409 478 16.9 8429.52 Mechanical shovels, excavators and shovel loaders with 360 degree revolving superstructure, self-
propelled 282 652 456 -30.0
7306.19 Seamed (other than welded stainless steel) pipe, with external diameter 406.4mm or less or other than circular cross-section, line pipe of a kind used for oil and gas pipelines
417 514 428 -16.7
8471.30 Portable automatic data processing machines, weight not more than 10 kg, consisting of at least a central processing unit, keyboard and display
543 566 425 -24.9
8542.31 Processors or controllers 459 340 423 24.5 8523.51 Solid state non-volatile storage devices 329 326 417 28.1 8708.94 Steering wheels, steering columns and steering boxes and parts thereof, for motor vehicles 288 378 411 8.7 8517.70 Parts of telecommunications apparatus 384 359 385 7.1
Total of items shown 30,653 30,615 34,964 14.2 All other HTS subheadings 25,353 27,259 27,015 -0.9
Total U.S. imports for consumption from Korea 56,006 57,874 61,979 7.1 Source: Official trade statistics of the USDOC as maintained by the USITC. Note: Because of rounding, figures may not add to totals shown. The abbreviation “n.e.s.o.i.” stands for “not elsewhere specified or included.” aUndefined.
275

Table A.45 U.S. merchandise trade with Brazil, by USITC digest sectors, 2011–13 Sector Grouping Description 2011 2012 2013
% change 2012–13
Million $
Domestic exports: 1 Agricultural products 1,892 695 1,952 180.8 2 Forest products 481 418 388 -7.2 3 Chemicals and related products 8,875 8,987 9,818 9.2 4 Energy-related products 6,501 7,382 6,712 -9.1 5 Textiles and apparel 271 284 254 -10.4 6 Footwear 4 2 2 -30.1 7 Minerals and metals 1,177 1,257 1,330 5.8 8 Machinery 3,516 3,794 3,961 4.4 9 Transportation equipment 9,140 8,997 8,132 -9.6 10 Electronic products 4,320 4,382 4,079 -6.9 11 Miscellaneous manufactures 291 263 227 -13.7 12 Special provisions 807 790 773 -2.2
Total 37,275 37,252 37,627 1.0 Imports for consumption:
1 Agricultural products 4,643 4,924 4,675 -5.1 2 Forest products 1,793 1,802 2,159 19.8 3 Chemicals and related products 3,191 3,157 2,514 -20.4 4 Energy-related products 8,918 8,631 4,869 -43.6 5 Textiles and apparel 117 111 117 5.1 6 Footwear 253 210 200 -4.8 7 Minerals and metals 5,554 5,603 5,214 -6.9 8 Machinery 1,231 1,279 1,081 -15.5 9 Transportation equipment 2,949 3,325 3,325 0.0 10 Electronic products 288 323 254 -21.2 11 Miscellaneous manufactures 381 418 454 8.6 12 Special provisions 1,049 1,937 1,999 3.2
Total 30,368 31,720 26,861 -15.3
Source: Official trade statistics of the USDOC as maintained by the USITC. Note: Because of rounding, figures may not add to totals shown.
276

Table A.46 Leading U.S. domestic exports to Brazil, by Schedule B subheading, 2011–13 Schedule B subheading Description 2011 2012 2013
% change 2012–13
Million $
8800.00 Aircraft, spacecraft, and parts thereof 4,822 4,742 4,313 -9.0 2710.19 Petroleum oils and oils (not light) from bituminous minerals or preps n.e.s.o.i. 70%+ by weight from
petroleum oils or bituminous minerals 2,440 3,876 3,711 -4.3
1001.99 Wheat and meslin other than durum or seed wheat (a) 13 1,245 9,206.6 2701.12 Bituminous coal, whether or not pulverized, but not agglomerated 1,713 1,237 986 -20.3 2710.12 Light oils and preparations (b) 1,284 787 -38.7 3004.90 Medicaments, in measured doses, etc. (excluding vaccines, etc., coated bandages, etc., and
pharmaceutical goods), n.e.s.o.i. 615 707 736 4.0
2711.12 Propane, liquefied 269 239 676 182.9 3808.91 Insecticides 187 267 419 56.9 2902.50 Styrene (vinylbenzene; phenylethylene) 222 242 305 25.8 2815.12 Sodium hydroxide (caustic soda), in aqueous solution (soda lye or liquid soda) 342 379 304 -19.8 8517.62 Machines for the reception, conversion and transmission or regeneration of voice, images or other
data, including switching and routing apparatus 300 314 289 -8.1
8431.43 Parts for boring or sinking machinery, n.e.s.o.i. 624 403 272 -32.5 3907.20 Polyethers n.e.s.o.i., in primary forms 192 221 262 18.5 3105.30 Diammonium hydrogenorthophosphate (diammonium phosphate) 181 242 253 4.4 2930.90 Organo-sulfur compounds, n.e.s.o.i. 206 197 222 12.7 8708.99 Parts and accessories for motor vehicles, n.e.s.o.i. 211 188 218 15.8 9018.90 Instruments and appliances for medical, surgical or veterinary sciences, n.e.s.o.i., and parts and
accessories thereof 199 204 214 4.7
8431.49 Parts and attachments, n.e.s.o.i., for derricks, cranes, self-propelled bulldozers, graders, etc., and other grading, scraping, etc., machinery
274 226 211 -6.8
3105.59 Mineral or chemical fertilizers containing the two fertilizing elements nitrogen and phosphorus, n.e.s.o.i.
0 25 207 720.5
8502.31 Generating sets, electric, wind-powered 100 134 199 48.2 3901.20 Polyethylene having a specific gravity of 0.94 or more, in primary forms 152 158 198 25.3 3901.90 Polymers of ethylene n.e.s.o.i., in primary forms 139 137 198 43.9 3105.40 Ammonium dihydrogenorthophosphate (monoammonium phosphate) and mixtures thereof with
diammonium hydrogenorthophosphate (diammonium phosphate) 491 306 192 -37.3
3808.93 Herbicides, anti-sprouting products and plant-growth regulators 124 157 190 20.7 3906.90 Acrylic polymers n.e.s.o.i., in primary forms 189 182 186 2.2
Total of items shown 13,992 16,083 16,790 4.4 All other HTS subheadings 23,282 21,170 20,837 -1.6
Total U.S. domestic exports to Brazil 37,275 37,252 37,627 1.0 Source: Official trade statistics of the USDOC as maintained by the USITC. Note: Because of rounding, figures may not add to totals shown. The abbreviation “n.e.s.o.i.” stands for “not elsewhere specified or included.” aTrade in 2011 reported under HTS tariff line 1001.90. bTrade in 2011 reported under HTS tariff line 2710.11.
277

Table A.47 Leading U.S. imports for consumption from Brazil, by HTS provision, 2011–13 HTS provision Description 2011 2012 2013
% change 2012–13
Million $ 2709.00 Petroleum oils and oils from bituminous minerals, crude 6,498 5,374 2,659 -50.5 7207.12 Semifinished products of iron or nonalloy steel, under 0.25% (weight) carbon, rectangular cross-section,
width not less than twice the thickness 1,702 1,890 1,487 -21.4
2710.19 Petroleum oils and oils (not light) from bituminous minerals or preps n.e.s.o.i. 70%+ by weight from petroleum oils or bituminous minerals
1,319 1,816 1,372 -24.5
2207.10 Ethyl alcohol, undenatured, of an alcoholic strength by volume of 80% vol. or higher 568 1,463 1,199 -18.1 8802.40 Airplanes and other aircraft n.e.s.o.i., of an unladen weight exceeding 15,000 kg 365 395 1,135 187.0 4703.29 Chemical woodpulp, soda or sulfate, other than dissolving grades, semibleached or bleached,
nonconiferous 911 820 1,032 25.8
0901.11 Coffee, not roasted, not decaffeinated 1,865 1,242 1,007 -18.9 7201.10 Nonalloy pig iron containing 0.5% (weight) or less phosphorus, in primary forms 1,130 882 688 -22.0 6802.93 Worked monumental or building stone n.e.s.o.i., of granite 447 477 609 27.7 8802.30 Airplanes and other aircraft n.e.s.o.i., of an unladen weight exceeding 2,000 kg but not exceeding 15,000
kg 429 458 448 -2.2
2401.20 Tobacco, partly or wholly stemmed/stripped 271 299 376 26.1 8409.99 Parts for use with compression-ignition internal combustion piston engines, n.e.s.o.i. 472 416 325 -21.9 2902.20 Benzene 192 271 302 11.4 2713.11 Petroleum coke, not calcined 395 694 300 -56.7 1005.90 Corn (maize), other than seed corn 3 215 296 37.6 4409.10 Wood continuously shaped (tongued, grooved, rebated, v-jointed, beaded, molded, etc.) along any of its
edges or faces, planed, etc. or not, coniferous 162 217 278 28.2
7224.90 Semifinished products of alloy steel (other than stainless) n.e.s.o.i. (a) 9 265 2,813.3 1602.50 Meat or meat offal of bovine animals, prepared or preserved, n.e.s.o.i. 146 193 228 17.8 2710.12 Light oils and preparations 0 72 210 193.4 7202.93 Ferroniobium 244 269 205 -23.9 2009.11 Orange juice, frozen, whether or not sweetened 158 91 202 123.0 4802.56 Paper/paperboard for writing/printing/other graphic purpose, weight 40g/m2-150g/m2, not over 10%
fiber by mechanical/chemical process, sized sheets 142 137 186 36.1
8412.90 Parts for engines and motors, n.e.s.o.i. 175 438 183 -58.2 4011.10 New pneumatic tires, of rubber, of a kind used on motor cars (including station wagons and racing cars) 278 256 183 -28.4 1201.90 Soybeans, whether or not broken, other than seed (b) 0 183 (c)
Total of items shown 17,873 18,395 15,359 -16.5 All other HTS subheadings 12,495 13,325 11,502 -13.7
Total U.S. imports for consumption from Brazil 30,368 31,720 26,861 -15.3 Source: Official trade statistics of the USDOC as maintained by the USITC. Note: Because of rounding, figures may not add to totals shown. The abbreviation “n.e.s.o.i.” stands for “not elsewhere specified or included.” aLess than $500,000. bTrade in 2011 reported under HTS tariff line 1201.00. cUndefined.
278

Table A.48 U.S. merchandise trade with Taiwan, by USITC digest sectors, 2011–13 Sector Grouping Description 2011 2012 2013
% change 2012–13
Million $
Domestic exports: 1 Agricultural products 3,706 3,291 3,191 -3.0 2 Forest products 495 469 532 13.5 3 Chemicals and related products 4,714 4,416 4,266 -3.4 4 Energy-related products 314 653 1,336 104.7 5 Textiles and apparel 95 99 96 -3.2 6 Footwear 5 5 4 -13.0 7 Minerals and metals 2,867 2,547 2,128 -16.4 8 Machinery 4,529 4,602 4,691 1.9 9 Transportation equipment 1,315 1,309 2,286 74.7 10 Electronic products 4,929 3,735 3,520 -5.8 11 Miscellaneous manufactures 331 297 818 175.3 12 Special provisions 476 411 401 -2.3
Total 23,775 21,832 23,270 6.6 Imports for consumption:
1 Agricultural products 453 467 474 1.5 2 Forest products 193 208 215 3.5 3 Chemicals and related products 2,933 3,119 3,194 2.4 4 Energy-related products 140 278 26 -90.7 5 Textiles and apparel 1,154 1,156 1,139 -1.5 6 Footwear 56 52 50 -3.0 7 Minerals and metals 4,793 5,163 5,081 -1.6 8 Machinery 3,487 3,908 3,942 0.9 9 Transportation equipment 2,797 3,074 3,155 2.6 10 Electronic products 20,990 17,214 16,130 -6.3 11 Miscellaneous manufactures 2,646 2,899 2,819 -2.8 12 Special provisions 1,572 1,185 1,315 11.0
Total 41,213 38,722 37,539 -3.1
Source: Official trade statistics of the USDOC as maintained by the USITC. Note: Because of rounding, figures may not add to totals shown.
279

Table A.49 Leading U.S. domestic exports to Taiwan, by Schedule B subheading, 2011–13 Schedule B subheading Description 2011 2012 2013
% change 2012–13
Million $ 8486.20 Machines and apparatus for the manufacture of semiconductor devices or electronic integrated
circuits 1,371 1,935 2,345 21.2
7204.49 Ferrous waste and scrap, n.e.s.o.i. 1,339 1,235 971 -21.4 8800.00 Aircraft, spacecraft, and parts thereof 600 641 904 41.0 2710.12 Light oils and preparations (a) 352 894 154.0 1201.90 Soybeans, whether or not broken, other than seed (b) 763 582 -23.8 9306.90 Bombs, grenades, torpedoes, mines, missiles and similar munitions of war and parts thereof; other
ammunition and projectiles and parts thereof, n.e.s.o.i. 33 21 564 2,640.8
8542.32 Memories 1,344 678 469 -30.8 8486.90 Parts and accessories 422 406 456 12.3 8542.31 Processors or controllers 412 347 425 22.5 8803.30 Parts of airplanes or helicopters, n.e.s.o.i. 161 159 401 151.6 8542.39 Electronic integrated circuits, n.e.s.o.i. 569 406 389 -4.0 1001.99 Wheat and meslin other than durum or seed wheat (c) 357 364 1.9 8802.12 Helicopters of an unladen weight exceeding 2,000 kg 0 0 346 (d) 3824.90 Chemical products and preparations of the chemical or allied industries, n.e.s.o.i.; residual products
of the chemical or allied industries, n.e.s.o.i. 203 202 281 39.2
9031.41 Optical instruments for inspecting semiconductor wafers or devices or for inspecting photomasks or reticles used in manufacturing semiconductor devices
443 466 272 -41.7
2707.30 Xylenes 54 16 246 1,394.3 2933.71 6-hexanelactam (epsilon-caprolactam) 231 153 234 53.0 3004.90 Medicaments, in measured doses, etc. (excluding vaccines, etc., coated bandages, etc., and
pharmaceutical goods), n.e.s.o.i. 142 168 206 22.8
1005.90 Corn (maize), other than seed corn 807 310 181 -41.6 7204.21 Stainless steel waste and scrap 268 227 171 -24.8 3908.10 Polyamide-6,-11,-12,-6,6,-6,9,-6,10 or -6,12 (nylon type), in primary forms 223 145 157 8.0 2804.61 Silicon, containing by weight not less than 99.99% of silicon 197 159 156 -1.6 0207.14 Chicken cuts and edible offal (including livers), frozen 109 160 156 -2.5 2106.90 Food preparations n.e.s.o.i. 112 130 152 17.2 8401.30 Fuel elements (cartridges), non-irradiated, for nuclear reactors, and parts thereof 131 66 143 116.3
Total of items shown 9,168 9,503 11,465 20.7 All other HTS subheadings 14,606 12,329 11,804 -4.3
Total U.S. domestic exports to Taiwan 23,775 21,832 23,270 6.6 Source: Official trade statistics of the USDOC as maintained by the USITC. Note: Because of rounding, figures may not add to totals shown. The abbreviation “n.e.s.o.i.” stands for “not elsewhere specified or included.” aTrade in 2011 reported under HTS tariff line 2710.11. bTrade in 2011 reported under HTS tariff line 1201.00. cTrade in 2011 reported under HTS tariff line 1001.90. dUndefined.
280

Table A.50 Leading U.S. imports for consumption from Taiwan, by HTS provision, 2011–13 HTS provision Description 2011 2012 2013
% change 2012–13
Million $ 8517.12 Telephones for cellular networks or for other wireless networks 6,609 2,410 1,797 -25.4 8542.32 Memories 1,072 1,060 1,399 32.0 8473.30 Parts and accessories for automatic data processing machines and units thereof, magnetic or optical
readers, transcribing machines, etc., n.e.s.o.i. 1,426 1,301 1,397 7.4
8542.39 Electronic integrated circuits, n.e.s.o.i. 1,139 1,134 1,197 5.6 8542.31 Processors or controllers 956 889 882 -0.8 8526.91 Radio navigational aid apparatus 978 1,377 807 -41.4 8541.40 Photosensitive semiconductor devices, including photovoltaic cells; light-emitting diodes 256 478 635 32.9 8517.62 Machines for the reception, conversion and transmission or regeneration of voice, images or other
data, including switching and routing apparatus 391 544 623 14.6
8525.80 Television cameras; digital cameras and video camera recorders 401 546 600 9.8 8523.51 Solid state non-volatile storage devices 579 514 553 7.6 8528.71 Reception apparatus for television, not designed to incorporate a screen or video display device 874 950 531 -44.1 8512.20 Electrical lighting or visual signaling equipment, for use on cycles or motor vehicles, except for use
on bicycles 426 446 490 9.9
7318.15 Threaded screws and bolts n.e.s.o.i., with or without their nuts or washers, of iron or steel 513 510 490 -3.8 8708.29 Parts and accessories of bodies (including cabs) for motor vehicles, n.e.s.o.i. 399 437 454 4.0 8712.00 Bicycles and other cycles (including delivery tricycles), not motorized 411 427 435 2.0 7318.14 Self-tapping screws, threaded, of iron or steel 388 427 428 0.2 8471.30 Portable automatic data processing machines, weight not more than 10 kg, consisting of at least a
central processing unit, keyboard and display 773 436 366 -16.2
8534.00 Printed circuits 353 351 363 3.5 8471.70 Automatic data processing storage units, n.e.s.o.i. 269 324 352 8.8 7318.16 Nuts, threaded, of iron or steel 311 310 324 4.4 8481.80 Taps, cocks, valves and similar appliances for pipes, vats or the like, including thermostatically
controlled valves, n.e.s.o.i. 302 321 318 -0.8
8504.40 Electrical static converters; power supplies for automatic data processing machines or units of 8471 355 308 304 -1.5 9506.91 Articles and equipment for general physical exercise, gymnastics or athletics, n.e.s.o.i.; parts and
accessories thereof 312 288 301 4.6
8708.99 Parts and accessories for motor vehicles, n.e.s.o.i. 247 268 268 0.0 8471.50 Processing units other than those of 8471.41 and 8471.49, n.e.s.o.i. 184 225 261 16.1
Total of items shown 19,926 16,281 15,578 -4.3 All other HTS subheadings 21,287 22,441 21,960 -2.1
Total U.S. imports for consumption from Taiwan 41,213 38,722 37,539 -3.1
Source: Official trade statistics of the USDOC as maintained by the USITC. Note: Because of rounding, figures may not add to totals shown. The abbreviation “n.e.s.o.i.” stands for “not elsewhere specified or included.”
281

Table A.51 U.S. merchandise trade with India, by USITC digest sectors, 2011–13 Sector Grouping Description 2011 2012 2013
% change 2012–13
Million $
Domestic exports: 1 Agricultural products 732 865 873 1.0 2 Forest products 836 745 740 -0.7 3 Chemicals and related products 4,533 3,624 3,222 -11.1 4 Energy-related products 1,912 1,786 1,329 -25.6 5 Textiles and apparel 162 168 166 -0.8 6 Footwear 4 4 3 -20.8 7 Minerals and metals 2,835 4,645 2,640 -43.2 8 Machinery 1,727 1,778 1,488 -16.3 9 Transportation equipment 2,089 2,449 3,760 53.5 10 Electronic products 2,304 2,306 2,145 -7.0 11 Miscellaneous manufactures 172 212 224 5.8 12 Special provisions 363 392 320 -18.4
Total 17,670 18,972 16,911 -10.9 Imports for consumption: 1 Agricultural products 3,105 5,790 4,444 -23.2 2 Forest products 160 158 177 12.4 3 Chemicals and related products 6,674 8,021 8,267 3.1 4 Energy-related products 3,138 2,976 3,703 24.4 5 Textiles and apparel 6,447 6,397 6,865 7.3 6 Footwear 196 264 290 9.7 7 Minerals and metals 9,149 8,668 10,286 18.7 8 Machinery 1,653 2,003 1,801 -10.1 9 Transportation equipment 1,471 1,743 1,436 -17.6 10 Electronic products 1,393 1,287 1,197 -7.0 11 Miscellaneous manufactures 2,201 2,260 2,477 9.6 12 Special provisions 418 538 515 -4.2
Total 36,003 40,105 41,459 3.4
Source: Official trade statistics of the USDOC as maintained by the USITC. Note: Because of rounding, figures may not add to totals shown.
282

Table A.52 Leading U.S. domestic exports to India, by Schedule B subheading, 2011–13 Schedule B subheading Description 2011 2012 2013
% change 2012–13
Million $ 8800.00 Aircraft, spacecraft, and parts thereof 620 1,215 1,607 32.4 7108.12 Gold, nonmonetary, unwrought n.e.s.o.i. (other than powder) 769 2,903 1,389 -52.2 8802.40 Airplanes and other aircraft n.e.s.o.i., of an unladen weight exceeding 15,000 kg 0 0 1,152 (a) 2707.99 Oils and products of the distillation of high temperature coal tar, n.e.s.o.i.; similar products which have a
predominate (weight) aromatic constituent, n.e.s.o.i. 537 485 426 -12.3
2701.12 Bituminous coal, whether or not pulverized, but not agglomerated 917 856 400 -53.3 0802.11 Almonds, fresh or dried, in shell 256 279 324 16.2 3105.30 Diammonium hydrogenorthophosphate (diammonium phosphate) 1,237 557 315 -43.4 2713.11 Petroleum coke, not calcined 107 196 229 16.8 2809.20 Phosphoric acid and polyphosphoric acids 272 221 191 -13.6 2710.19 Petroleum oils and oils (not light) from bituminous minerals or preps n.e.s.o.i. 70%+ by weight from
petroleum oils or bituminous minerals 94 90 190 110.7
7102.39 Diamonds, nonindustrial, worked, including polished or drilled 577 262 163 -37.7 4707.10 Waste and scrap of unbleached kraft paper or paperboard or of corrugated paper or paperboard 150 145 150 3.7 8517.62 Machines for the reception, conversion and transmission or regeneration of voice, images or other data,
including switching and routing apparatus 178 171 146 -14.4
7204.49 Ferrous waste and scrap, n.e.s.o.i. 416 379 142 -62.5 4801.00 Newsprint, in rolls or sheets 186 128 120 -6.5 9018.90 Instruments and appliances for medical, surgical or veterinary sciences, n.e.s.o.i., and parts and
accessories thereof 109 100 117 17.5
3824.90 Chemical products and preparations of the chemical or allied industries, n.e.s.o.i.; residual products of the chemical or allied industries, n.e.s.o.i.
85 109 111 2.4
8409.99 Parts for use with compression-ignition internal combustion piston engines, n.e.s.o.i. 112 118 103 -13.1 3822.00 Composite diagnostic or laboratory reagents, other than those pharmaceuticals in heading 3002 or 3006;
certified reference materials 91 88 95 7.9
5201.00 Cotton, not carded or combed 93 73 90 23.7 8803.30 Parts of airplanes or helicopters, n.e.s.o.i. 50 62 89 43.0 7113.19 Jewelry and parts thereof, of precious metal other than silver 77 87 85 -2.3 7602.00 Aluminum waste and scrap 82 90 83 -7.3 8431.43 Parts for boring or sinking machinery, n.e.s.o.i. 74 66 77 16.3 7204.21 Stainless steel waste and scrap 38 74 73 -0.2
Total of items shown 7,129 8,755 7,869 -10.1 All other HTS subheadings 10,541 10,218 9,043 -11.5
Total U.S. domestic exports to India 17,670 18,972 16,911 -10.9 Source: Official trade statistics of the USDOC as maintained by the USITC. Note: Because of rounding, figures may not add to totals shown. The abbreviation “n.e.s.o.i.” stands for “not elsewhere specified or included.” aUndefined.
283

Table A.53 Leading U.S. imports for consumption from India, by HTS provision, 2011–13 HTS provision Description 2011 2012 2013
% change 2012–13
Million $ 7102.39 Diamonds, nonindustrial, worked, including polished or drilled 6,263 5,398 7,353 36.2 3004.90 Medicaments, in measured doses, etc. (excluding vaccines, etc., coated bandages, etc., and pharmaceutical
goods), n.e.s.o.i. 2,465 3,500 3,654 4.4
2710.12 Light oils and preparations (a) 2,405 2,825 17.4 1302.32 Mucilages and thickeners, whether or not modified, derived from locust beans, locust bean seeds or guar
seeds 914 3,373 1,615 -52.1
7113.19 Jewelry and parts thereof, of precious metal other than silver 1,127 1,103 1,191 7.9 0306.17 Other shrimps and prawns, cooked in shell or uncooked, dried, salted or in brine, frozen (b) 531 967 82.0 2710.19 Petroleum oils and oils (not light) from bituminous minerals or preps n.e.s.o.i. 70%+ by weight from
petroleum oils or bituminous minerals 425 552 859 55.6
6302.31 Bed linen (other than printed) of cotton, not knitted or crocheted 635 764 848 10.9 6302.60 Toilet and kitchen linen of cotton terry toweling or similar cotton terry fabrics 532 575 583 1.3 3004.20 Medicaments, in measured doses, etc., containing antibiotics, n.e.s.o.i. 361 378 424 12.2 6110.20 Sweaters, pullovers, sweatshirts, vests and similar articles of cotton, knitted or crocheted 399 341 398 16.7 7113.11 Jewelry and parts thereof, of silver 343 335 366 9.4 8528.71 Reception apparatus for television, not designed to incorporate a screen or video display device 282 200 274 37.0 0801.32 Cashew nuts, fresh or dried, shelled 307 264 265 0.2 6206.30 Women’s or girls’ blouses, shirts and shirt-blouses of cotton, not knitted or crocheted 241 208 247 18.7 6205.20 Men’s or boys’ shirts of cotton, not knitted or crocheted 250 207 220 6.4 7210.49 Flat-rolled iron or nonalloy steel products, not corrugated, 600 mm or more wide, plated or coated with
zinc other than electrolytically 151 197 219 11.4
2902.20 Benzene 163 210 213 1.2 8701.90 Tractors, n.e.s.o.i. 199 221 193 -12.7 8481.90 Parts for taps, cocks, valves and similar appliances for pipes, vats or the like, including pressure-reducing
and thermostatically controlled valves 170 188 188 0.3
6109.10 T-shirts, singlets, tank tops and similar garments of cotton, knitted or crocheted 233 191 172 -10.0 6105.10 Men’s or boys’ shirts of cotton, knitted or crocheted 214 165 170 3.4 6802.93 Worked monumental or building stone n.e.s.o.i., of granite 150 157 166 5.8 8708.30 Brakes and servo-brakes and parts thereof n.e.s.o.i., for motor vehicles 155 175 159 -8.8 8708.99 Parts and accessories for motor vehicles, n.e.s.o.i. 237 192 159 -17.5
Total of items shown 16,216 21,830 23,728 8.7 All other HTS subheadings 19,788 18,275 17,731 -3.0
Total U.S. imports for consumption from India 36,003 40,105 41,459 3.4 Source: Official trade statistics of the USDOC as maintained by the USITC. Note: Because of rounding, figures may not add to totals shown. The abbreviation “n.e.s.o.i.” stands for “not elsewhere specified or included.” aTrade in 2011 reported under HTS tariff line 2710.11. bTrade in 2011 reported under HTS tariff line 0306.13.
284