year in review - jhu...
TRANSCRIPT

FY13
DIVISIONAL SUSTAINABILITY
REPORT
School of Medicine
SEPTEMBER 2013
FAST FACTS:
Total electricity usage de-creased by 7.1% from 2012. (p. 2)
Total greenhouse gas emis-sions were reduced by 3.5%for 2013. (p. 5)
To help reduce the amount of purchased bottled water, the school installed their first Quench water filtration sys-tem at the Asthma and Al-lergy building. (p. 8)
Medicine increased their recycling rate to 67%, a 4%improvement over the pre-vious year. (p. 9)
In 2013, the School of Medi-cine purchased 1,180 fewer cases of white copy paper than in 2012. (p. 9)
YEAR IN REVIEW 2013 was a strong year for School of Medicine’s sustainability initia-tives and projects. The school completed twelve different energy con-versation projects, helping to reduce their total electricity consumption by 7.1% from 2012. This decrease also helped them to reduce their car-bon emissions by 3.5%. Each of these initiatives, as well as information on water, recycling, and paper, have been explained in more detail throughout the report.
FACULTY, STAFF, & STUDENT ENGAGEMENT Throughout the year, many members of the Medicine community re-mained active in sustainability practices and programs. In 2013, the School of Medicine Facilities Management Office received the first ever 3 Blue Jay Feather Green Office Certification for implementing as many sustainable features as suitable for their office. This recognition led to a fun competition with the Public Health’s Facilities Management Office. On Earth Day, each of the facilities directors were awarded with the Spirit of Sustainability award. The student group, Leadership Initiative for the Environment (LIFE), continued promoting sustainabil-ity to other fellow students throughout the year. In 2013, LIFE started a collaboration with TreeFill Baltimore to help revitalize a construction site into a wildlife sanctuary, held their biannual electronics recycling event, participated in JHU’s Earth Week events in April 2013, and worked closely with Medicine students and staff to provide better un-derstanding of things like waste diversion and reducing energy and emissions. To learn more about LIFE and their upcoming events and programs, please visit their Facebook page.
————————————————————
2
ENERGY
MEDICINE OVERVIEW
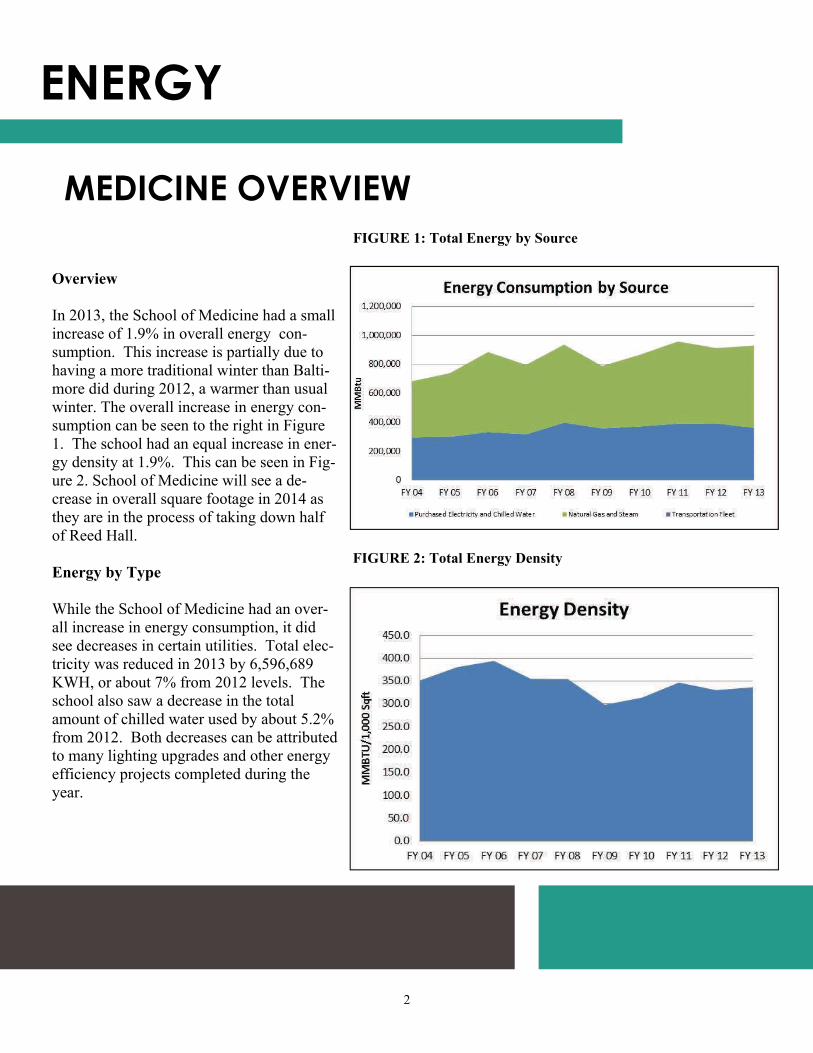
Overview In 2013, the School of Medicine had a small increase of 1.9% in overall energy con-sumption. This increase is partially due to having a more traditional winter than Balti-more did during 2012, a warmer than usual winter. The overall increase in energy con-sumption can be seen to the right in Figure 1. The school had an equal increase in ener-gy density at 1.9%. This can be seen in Fig-ure 2. School of Medicine will see a de-crease in overall square footage in 2014 as they are in the process of taking down half of Reed Hall. Energy by Type While the School of Medicine had an over-all increase in energy consumption, it did see decreases in certain utilities. Total elec-tricity was reduced in 2013 by 6,596,689 KWH, or about 7% from 2012 levels. The school also saw a decrease in the total amount of chilled water used by about 5.2% from 2012. Both decreases can be attributed to many lighting upgrades and other energy efficiency projects completed during the year.
FIGURE 1: Total Energy by Source
FIGURE 2: Total Energy Density

3
ENERGY CONTINUED
MEDICINE BUILDING LEVEL DATA Overview of Building Level Data Total KBTU per square foot per year is a common way to measure total energy consumed at the building level. Depend-ing on the building use, the KBTU/sqft/year quantity should fall into a particular data range to measure its overall efficien-cy. This metric is being used more often because it is the common metric used by LEED and Energy Star to compare and demonstrate building energy perfor-mance and efficiency. The following table summarizes the total KBTU/sqft/year numbers for 2013 and is compared to the previous year’s energy consump-tion. Many buildings reflect the energy savings projects completed by having a negative percent change from 2012 to 2013. The only exceptions to this are the David H. Koch Cancer Research Build-ing (CRB II) and Reed Hall. During Hurricane Sandy, mechanical equipment was damaged in CRB II causing the relo-cation of building tenants during the month of October. Reed Hall is also an exception because half of the building has reduced occupancy and will be re-moved from the building portfolio in the coming year. The remaining buildings with increased energy consumption are due to the colder winter. Table 1 reflects the building level changes from 2012 to 2013.
Building Name FY12 FY13 % Change
2024 East Monument 92 89 ‐3.3%
98 North Broadway* 43 39 ‐9.3%
Armstrong Medical Educa on Building 189 205 8.5%
Asthma and Allergy 252 212 ‐15.9%
Basic Science 426 453 6.3%
Bun ng‐Blaustein Research Building (CRB I) 423 415 ‐1.9%
Cooley 84 99 17.9%
Koch Research Building (CRB II) 390 379 ‐2.8%
Miller Research Building 455 459 0.9%
Reed Hall 227 136 ‐40.1%
Ross Research Building 574 579 0.9%
Traylor 415 487 17.3%
Turner 205 200 ‐2.4%
Welch Library 240 245 2.1%
TABLE 1: Building Energy Density (KBTU/Sqft/Yr)
*Based on electricity data only.

4
ENERGY CONTINUED
SOM ENERGY PROJECTS Overview In 2013, fourteen different energy conservation projects were completed. Of the projects completed, one of the most successful ones was the replacement of the Chiller Plant at the Asthma and Allergy Center. The plant accounted for approximately 40% of the total electrical energy consumed by the building when operat-ing. Data from the first four months of operation of the new plant indicate the electricity consumption in the building has been re-duced by about 28% on average. Photos of the project can be seen to the right. Energy Projects Completed The following buildings had energy projects completed this past year: 2024 E. Monument: Added Variable Frequency Drives (VFD) to
Air Systems Asthma & Allergy: Chiller Plant Replacement; Vacuum System
Replacement; Lab Air System Replacement; a lighting retrofit; and added VFDs to Clinical Wing Air Systems
CRB I: Transformer Replacement CRB II: Transformer Replacement PCTB: Added VFDs to Air Systems; Transformer Replacement MRB: Grey Water System Upgrades Rangos: Lighting Retrofit Ross: Variable Air Volume Conversion, Phase I Turner: Lighting Retrofit
BGE Rebates School of Medicine received the largest sum of BG&E rebates of all of the JHU divisions. The school received $784,508 in rebates for twelve different energy conservation projects. To date, School of Medicine has received over $1.4 million in rebates for fifteen energy conservation projects.

5
ENERGY AND GHG EMISSIONS
UNIVERSITY OVERVIEW University GHG Reduction Goal Johns Hopkins University continues to strive to reach their 2025 greenhouse gas goal to reduce emissions 51% from 2008 levels by 2025. This section of the report reflects the University’s com-bined energy and greenhouse gas reduction pro-gress. JHU’s Five Year Progress After five years, a population increase of 11% and an increase in buildings by 9%, JHU has kept their total energy consumption to 3%. The in-crease in energy is primarily due to the increase in natural gas and steam use. Since 2008, JHU has seen a decrease in emissions by almost 23%. A large amount of the emissions reductions can be attributed to the cleaner regional electricity grid. Moving Forward The Office of Sustainability and former members of the Climate Action Plan Task Force are as-sessing JHU’s progress thus far. This will help determine what changes should be made to the plan, if any, to ensure our progress toward the re-duction goal. We plan to evaluate how to reduce site energy and emissions and whether electric grid carbon changes should be used. We are also evaluating how to better account for “business as usual” growth versus actual growth in the target goals, something that was not fully understood in the original plan.
FIGURE 3: Total Energy
FIGURE 4: Total Emissions

6
GREENHOUSE GAS EMISSIONS
MEDICINE GHG DATA
Overview 2013 was particularly good for School of Medicine. Over the year, the school reduced total emissions by 2.9%. This decrease in emissions can be attributed to the 7.1% combined decrease in electricity and chilled water emissions. Natural gas and steam emissions increased by just over 9% but these fuels do not have as high of a carbon content that grid electricity does. The proportion of emissions can be seen in the figure to the right (Figure 5). Overall, electricity and chilled water contributes to 71% of the total emissions for School of Medicine while natural gas and steam were only 29%. When comparing transportation fuels to the overall total, the amount is minimal. The breakdown of emissions by fuel source can be seen in Figure 6 below.
FIGURE 5: FY2013 Emissions Proportions
FIGURE 6: Emissions by Source

7
GHG CONTINUED
EMISSIONS: SOLAR CONTRIBUTION
Overview 2013 marked the first full year of solar con-tribution to the 2024 East Monument Street building on the School of Medicine Campus. Over twelve months, the solar array contrib-uted over 180,000 kwh to the building, ap-proximately 11% of the total electricity used. By using carbon free power, the School of Medicine avoided approximately 129 metric tonnes of emissions. Figure 7 shows the aerial view of the solar array on the 2024 building. The next figure (Figure 8) shows the solar generated over the life of the system. Since February of 2012, the system has generated 271,363 kwh of electricity.
FIGURE 7: Solar Array on 2024 E Monument St.
FIGURE 8: Solar Electricity Generated Since In-

8
WATER
WATER USAGE
BOTTLED WATER Over the past couple of years, the Office of Sustainability has been encouraging the different JHU divisions to find alternatives to disposable plastic bottle usage at their respec-tive campuses. Some of the alternatives include installation of a Quench system, which filters tap water in an office set-ting, and the other is retrofitting a traditional water fountain with a goose neck or a bottle filling station. In 2013, the School of Medicine installed their first Quench system in the Asthma and Allergy building at Bayview. The school also installed two more bottle filling stations in the Post Clinical Teaching Building. An example of one of these stations can be seen in Figure 10 to the left. The school an-ticipates installing more stations in the coming year.
In 2013, School of Medicine stayed relatively consistent from 2012 with their domestic water consumption de-spite consistent meter challenges. School of Medicine continues to explore different avenues to reduce domes-tic water consumption within its buildings. Figure 9 shows the total number of gallons consumed per year since 2005. It is important to note that the school has added a couple buildings since 2005.
FIGURE 10: Bottle Filling Station in School of Medicine
FIGURE 9

9
CHANGING BEHAVIORS
RECYCLING Recycling Highlights Concluding 2013, School of Medicine rec-orded their highest recycling rate to date at 67%. The majority of the recycling rate is due to the success of their compost program. In 2013, Medicine diverted 758 tons of compost from the landfill. Other traditional recycled products in-cluding cardboard, paper, cans, and bottles to-taled 339 tons for the year. With continued success, the school saw a 4% increase in their overall recycling rate from their 2012 rate. Figure 11 demonstrates the increase in the recycling rate since 2010. To date, Medi-cine remains as the campus with the highest recycling rate university wide. COPY PAPER
Paper Highlights 2013 represents the fourth year of paper collection data from our University office supplier As we continue to collect information on paper purchasing, the data im-proves. The Office of Sustainability strives to encourage faculty and staff throughout the University to purchase recycled content copy paper and to find alternatives to printing but if needed to do so double sided. The School of Medicine continued to improve their paper purchasing habits in 2013. Of the paper purchased, 59% contained recycled content. This is about 3% higher than 2012 totals. School of Medicine also purchased 1,180 fewer cases than they did in the year before. Figure 12 summarizes the data for the year and compares to past trends.
FIGURE 12: Copy Paper
FIGURE 11: Recycling