year 1 report - department of basic education
TRANSCRIPT

A
Year 1 ReportLearner performance after
one year of implementation
The Second Early Grade Reading Study
Contents
Acronyms ............................................................................................................................................................................................... 04
Executive Summary ............................................................................................................................................................................ 05
1 Why Focus on Early Grade Reading in English as First Additional Language? ��������������������������������������������� 07
2 Research Context �����������������������������������������������������������������������������������������������������������������������������������������������������092.1 The Evolution of Early Grade Reading Studies in South Africa ........................................................................... 092.2 South African EFAL Curriculum ...................................................................................................................................... 11
3 Study Design ��������������������������������������������������������������������������������������������������������������������������������������������������������������123.1 Research Site ....................................................................................................................................................................... 123.2 Interventions ........................................................................................................................................................................ 123.3 Theory of Change ............................................................................................................................................................... 143.4 Evaluation ............................................................................................................................................................................. 163.5 Ethical Clearance ................................................................................................................................................................ 213.6 Sample Characteristics ..................................................................................................................................................... 213.7 Balance at Baseline ............................................................................................................................................................23
4 Implementation Fidelity ������������������������������������������������������������������������������������������������������������������������������������������244.1 Interventions 1 and 2 .........................................................................................................................................................244.2 Intervention2Specifically ................................................................................................................................................24
5 Midline Results ���������������������������������������������������������������������������������������������������������������������������������������������������������� 275.1 Attrition ................................................................................................................................................................................. 275.2 Item Level Learner Assessment Results .....................................................................................................................285.3 Main Results .........................................................................................................................................................................365.4 InterventionEffectsonSubgroupsofInterest ......................................................................................................... 38
6 Changes in Instructional Practices ���������������������������������������������������������������������������������������������������������������������� 41
7 Sensitivity Checks ����������������������������������������������������������������������������������������������������������������������������������������������������447.1 Switching Schools ............................................................................................................................................................. 447.2 Multi-grade and Attrition ................................................................................................................................................ 457.3 Improvements due to Increased Time Teaching EFAL ........................................................................................... 457.4 Crowding-out of Home Language Teaching Time ....................................................................................................47
8 Cost-effectivenessDiscussion ������������������������������������������������������������������������������������������������������������������������������48
9 USAID Indicators �������������������������������������������������������������������������������������������������������������������������������������������������������49
10 Next Steps in the Project �����������������������������������������������������������������������������������������������������������������������������������������51
References ..............................................................................................................................................................................................52

List of Figures
Figure 1: Year 2 results of EGRS I...........................................................................................................................................................10Figure 2: Map of the research site .........................................................................................................................................................13Figure 3: Did you receive any in-service training in the teaching of EFAL? ........................................................................... 26Figure4: Averagenumberofdaystaught,perweek ...................................................................................................................... 26Figure 5: Lesson plan coverage ............................................................................................................................................................ 26Figure6: Attritionratebyinterventiongroup ................................................................................................................................... 27Figure7: HLvocabulary ...........................................................................................................................................................................32Figure 8: Percentage of learners who could not read a single word correctly .......................................................................32Figure9: Phonemeisolation–percentagecorrectbyinterventiongroup ..............................................................................33Figure10: Distributionoflettersreadcorrectlybyinterventiongroup .......................................................................................33Figure 11: Pecentage of learners correctly responding to each English instruction ..............................................................35Figure12: PercentagecorrectonEnglishListeningComprehensionandVocabulary ..........................................................36Figure13:Differentialimpactbasedonbaselineperformance .....................................................................................................40Figure 14: Frequency of English used in the classroom ..................................................................................................................42Figure 15: Instructional practices in Shared Reading .......................................................................................................................42Figure 16: Instructional support ..............................................................................................................................................................43Figure17: TimespentteachingEFALperweek..................................................................................................................................46
List of Tables
Table1: Comparisonofinterventions ................................................................................................................................................ 14Table2: Subtestscontainedintheinstrumentsateachpointintime .................................................................................... 18Table3: Percentageoflearnerstestedduringbaselinedatacollection .................................................................................20Table4: Percentageofteacherinterviewsconductedduringmidlinedatacollection ......................................................20Table5: Percentageofhomebackgroundquestionnairesreturned........................................................................................20Table6: Samplecharacteristics ..........................................................................................................................................................22Table7: Balancetestspersubtask .....................................................................................................................................................23Table8: BalancetestonteacherEnglishproficiency ...................................................................................................................23Table9: Teacherattendanceattrainingsessions .........................................................................................................................25Table10: Usingtechnologyintheclassroom ....................................................................................................................................25Table11: Itemdescriptivestatistics .....................................................................................................................................................29Table12: Itemcorrelationsbetweenbaselineandmidline .......................................................................................................... 30Table13: ComparinglettersoundrecognitionbetweenMpumalangaandNorthWest .......................................................35Table14: Meancomparisonofindexscores ......................................................................................................................................37Table15: Subtaskmeancomparisonscores,byinterventiongroup ..........................................................................................37Table16: Mainregression ........................................................................................................................................................................37Table17: Heterogeneouseffects–baselineperformance .......................................................................................................... 40Table18: Robustnesscheck–reallocatinginterventionstatus ................................................................................................. 44Table19: Sensitivitycheck–multi-gradeandattrition ................................................................................................................ 46Table20: Restrictingtoonlyincludelearnersinthree-hours-a-weekclasses ..................................................................... 46Table21: TheeffectofreducedHomeLanguageteachingtime ................................................................................................47Table22: SpecificUSAIDindicators ......................................................................................................................................................49Table23: CustomUSAIDIndicators ..................................................................................................................................................... 50

Acronyms
CAPS Curriculum and Assessment Policy Statement
ANA AnnualNationalAssessment
CAPS Curriculum and Assessment Policy Statement
DBE Department of Basic Education
EFAL English as First Additional Language
EGRA Early Grade Reading Assessment
EGRS Early Grade Reading Study
EGRS II Second Early Grade Reading Study
GPLMS Gauteng Primary Literacy and Mathematics Strategy
HBQ HomeBackgroundQuestionnaire
HOD Head of Department
ICT Information and Communications Technology
LoLT Language of Learning and Teaching
LTSM Learning and Teaching Support Materials
NECT NationalEducationCollaborationTrust
PIRLS Progress in International Reading and Literacy Study
PMT Project Management Team
RCT Randomised Control Trial
RCUP ReadingCatch-UpProgramme
SMT School Management Team
USAID UnitedStatesAgencyforInternationalDevelopment
The Second Early Grade Reading Study04

Executive Summary
Project OverviewThe second Early Grade Reading Study (EGRS II) forms partofaseriesofstudiesconductedbytheSouthAfricanDepartment of Basic Education (DBE) in collaborationwiththeUniversityoftheWitwatersrandandtheUnitedStates Agency for International Development (USAID).Buildingon the lessons learned through thefirstEarlyGradeReadingStudy (EGRS),EGRS II aims toevaluatetwo models of supporting and strengthening the teaching of English as First Additional Language (EFAL) in the Foundation Phase. This study therefore aims to contribute to the evidence base about what works toimprove the learning and teaching of early grade reading and will therefore guide the DBE in the implementation of programmes in future.
The study is designed as a Randomised Control Trial (RCT) which randomly allocated schools to two intervention groups and one control group where typicalschoolingtakesplace.Thismeansthatthethreegroupsofschoolsareessentiallythesame,withtheonlydifferencebetweenthembeingthemannerinwhichtheteachers are trained and supported in the teaching of EFAL.At the endof the study,wewould thereforebeable to see whether the learners in the interventiongroups learned more than the learners in the control group and so determine whether the interventions have beensuccessful.
The interventions are intended to improve and strengthen teachers’ implementation of the EFAL Curriculum and Assessment Policy Statement (CAPS) curriculum in the Foundation Phase. Both interventions consist of three components:
1. Lesson plans
2. Integrated Learning and Teaching Support Materials (LTSM)
3. Instructional coaching and training.
The key differences between the two interventions liein the delivery mode of coaching support that teachers receive and the format in which teachers receive the lesson plans. In both interventions, teachers receiveinitialblocktraining,aswellasone-daytrainingat thestartofeachschoolterm.Inintervention1,theteachersreceiveapaper-basedversionof the lessonplansandbenefitfromregularon-sitecoaching.Inintervention2,
theteachersreceiveatabletwithanelectronicversionof the lesson plans, including various audiovisualresources,andaresupportedthroughavirtualcoachingmodel that includes telephone calls and cell phone messagingtotheteacherbyavirtualreadingcoach.
Evaluation FindingsTo evaluate the success of each of the interventions afterthefirstyearofintervention,thelanguageabilitiesof 20 learners in each school that forms part of the study sample was tested at the start of Grade 1 (January 2017).AttheendofGrade1(OctoberorNovember2017),wetestedexactlythesamelearnersagaintodeterminewhether there was any difference in the learnerperformance.
Theyear1resultsseemtosuggestthatbothinterventionshavebeenequallysuccessful in improving theEnglishoral language proficiency of the Grade 1 learners.Learnersinthetwointerventiongroupswerefoundtobesignificantly aheadof their control groupcounterpartson the core instructional outcomes associated with the Grade 1 curriculum for learning English as an additional language. The scope of learning in the curriculum for Grade1English learning isoral languagedevelopment,with reading and phonics being addressed throughmethods such as SharedReading, listening to stories,and total physical response. All three of these practices essentiallyfocusonreceptivelanguageproficiencyandtoalesserextentonexpressivelanguagedevelopmentpractices.
ForthethreesubteststhatfocusonEnglishorallanguagedevelopment – English listening (and following instruction with actions), English listening comprehension, andEnglishvocabulary– the learners in the twocoachinginterventions did significantly better than theircounterparts in the control schools. On the higher-order skillssubtestthatassessedchildren’scomprehensioninEnglish,learnersintheinterventionclassroomsdidonlymarginally better than learners in the control schools,suggesting that while vocabulary development wasstrongerasaresultoftheinterventions,thishadnotyettranslatedintostrongercomprehensionskills.Thatsaid,iforalvocabularydevelopmentinthesecondlanguageisadevelopmentalbuildingblockforreadingacquisition,then the interventionsmaybeworking to improve the
Year 1 Report: Learner performance after one year of implementation 05

basicskillstargetedintheGrade1curriculumbutarenotyetimpactingthehigher-orderskills.
Thelackofpositive impact(andevenweakindicationsofsomenegativeeffects)onHomeLanguagesubtestsand on decoding outcomes (which is really only targeted intheHomeLanguagecurriculum)raisesthepossibilitythattheEnglishinterventionmaybesuccessfulthoughcrowding-out teaching time in the other areas of the curriculum.Theresultsontheotherlearningareasare,however,verytentativeatthisstageandwarrantfurtherinvestigation through subsequent rounds of datacollectionbeforeanyconcretestatementscanbemade.
Next Steps in the ProjectThetwointerventionscontinuedthroughout2018,withtheinitialtraininghavingbeenconductedwiththeGrade
2 teachers in January 2018. Teachers further attended clusteredworkshoptrainingforonedayatthestartofeachterm,andthereadingcoachesprovidedcontinuingsupport throughout the year. The third round of data collection took place from 22 October to 9 November2018 and provides the data necessary to determine the impact of the interventions after two years of implementation. The interventions are set to continue to Grade3teachersin2019andthesamelearnerswillbetested at the end of Grade 3 in 2019 and again at the end ofGrade4in2020.InOctober2018asetofCaseStudieswas conducted to gain more detailed information on the aspects of the interventionwhichmay be driving thesuccess. Similarly, lesson observations in 60 schoolsand a further set of Case Studies are planned for 2019.
The Second Early Grade Reading Study06

Reading is often used as an indicator of how well an education system is delivering on its mandate. International assessments such as the Progress in International Reading Literacy Study (PIRLS) have shown thatatGrade4andGrade5level,SouthAfricanlearnershave not yet learned to read with meaning. In the 2011 pre-PIRLS assessment, 29% of learners did not evenreach the low international benchmark and, therefore,when reading information texts these learners couldnotmake any inferences about logical connections toprovidereasonsorinterpretobviousreasonsandcauseswhen reading literary texts (Howie, et al., 2012). TheresultsofthePIRLSLiteracy2016furtherconfirmedtheliteracycrisisinthecountrywhere78%ofSouthAfricanlearners who were tested could not reach the same Low InternationalBenchmark.Bythesegradelevelslearnersare required to use these specific skills to accumulateall further knowledge, signifying that for the largestmajorityofSouthAfricanlearners,further learningwillalwaysbeconstrained.
SouthAfrica, likemanyothercountrieson theAfricancontinent, has a rich linguistic heritagewith 11 officiallanguages.ThelanguagepolicyinSouthAfricaexplicitlypromotes primary Home Language instruction in the Foundation Phase and the choice of the specificLanguage of Learning and Teaching (LoLT) in the Foundation Phase is left to the governing bodies ofschools. From Grade 4 onwards, learners are taughtmostsubjectsineitherEnglishorAfrikaans,butEnglishis the language chosen by the majority of schools.Although African languages are not used as the LoLT fromGrade4 onwards, African language speakers areexpected to continue studying their Home Languageas a school subject until Grade 12. To ameliorate thelanguagetransitionthatlearnersfaceinGrade4,Englishis introduced as an additional language from Grade 1. The language policy therefore promotes an additive approachtobilingualismwheretheHomeLanguage isdeveloped together with the additional language (Matjila &Pretorius,2004).
AdditivebilingualismisanapproachechoedintheEFALCurriculum, where proficiencies in the first languageare to be used as a base for developing English
proficiency.However, it isnotalwaysthecasethattheCAPSisimplementedasintended,whichmaydelaythesuccessfulacquisitionofEnglish,thelanguagethatwillultimatelybeusedforinstructionfromGrade4.InSouthAfrica,theliteracycrisisthereforecanbeexplainedbythe poor acquisition of literacy in the first language,compoundedbytheinadequate implementationoftheEFAL curriculum.
Strengthening the teaching of English in the Foundation Phaseisthereforecriticaltoeffectingimprovedlearningperformance in the later grades. In understanding the main constraints to more effective teaching, schooleffectiveness studies in South Africa have found thatprimary school classrooms are mainly characterised by a lack of print material, a lack of opportunities forreading and writing, chorusing practices, low levelsof cognitive demand and slow pacing (Taylor, 2007;Hoadley, 2012). However, while a range of factorsinfluences learning outcomes, it is widely recognisedthat instruction or instructional practice is critical to improvinglearningoutcomes(Coe,etal.,2014).Oneofthe key characteristics of South African education isthatthedualisticnatureoflearningoutcomesbetweenthewealthy and thepoor ismirroredbydual typesofinstructional practice happening in the schools serving these communities (Hoadley, 2012). It is likely thatweak instructional practices have a causal impact onlearning outcomes in the poorly performing part of the schoolsystem.Tosubstantiallyshiftachievementintheweakpartoftheschoolingsystemitmaybenecessaryto apply a comprehensive instructional change intervention, involving a set of coherent and alignedinstructional inputs. For this study, the instructionalinputs include lesson plans, aligned learningmaterialsand in-classroom support to teachers.
The study is designed as a Randomised Control Trial (RCT) to allow the robust evaluation of the causalimpact of the two interventions trialled. This impact evaluation will thus inform credible policy decisionsaround interventions that have been implemented ona relatively large scale. The main benefit of the RCTdesign is the inclusion of a randomly selected control groupintheevaluation,whichallowsthemeasurement
1 Why Focus on Early Grade Reading in English as First
Additional Language?
/Year 1 Report: Learner performance after one year of implementation 07

oftheamountof learningthatwouldhavetakenplacein schools, should the interventions not have beenimplemented. This, in turn, provides a benchmark towhich the learning gains in the intervention groups can becomparedinordertoestablishtheadditionallearninggainedbyimplementingtheinterventions.Furthermore,the comparison of the two interventions with the control group also allows a direct comparison of the costsinvolvedtoeffectthelearninggains,andthereforeallows the determination of the cost-effectiveness ofeach of the interventions.
The study aims to consider four main research questions:
1. Did the face-to-face support model improve learnerEnglishreadingproficiency?
2. Did the technological support model improve learnerEnglishreadingproficiency?
3. Did the impact on reading proficiency differbetween the two models of training andsupport delivery?
4. Whichmodelofdelivery is themost cost- and resource-effective?
The primary implementing partner is the South African government, in particular, the DBE. The NationalDepartment has partnered with the Provincial Education Department in Mpumalanga and the University ofthe Witwatersrand to implement and evaluate theinterventions in the province. Service providers have been appointed to assist with the implementation oftheinterventions,aswellasthedatacollectionfortheevaluation of the programme. The evaluation side of the project is being supervised by the research team.The study is completely funded through USAID, withthefundinghousedandadministeredthroughtheWitsHealth Consortium.
Strengthening the teaching of English in the Foundation Phase is therefore critical to effect improved learning performance in the later grades.
The Second Early Grade Reading Study08

There is a desperate need to improve the teaching of early grade reading in South Africa, but very littlerobustevidenceonprogrammesorinterventionswhichhavebeenabletoshiftpracticeatasystemiclevel.Thepurpose of the government-led initiative, which hasbecomeknownastheEarlyGradeReadingStudies,istoinfluencepolicybasedonrigorousevidence.Aseriesofthreeexperiments,ledbytheDBEincollaborationwithacademics,haveaimedtoevaluatetheeffectivenessofstructured learning programmes through various modes of delivery.
2�1 The Evolution of Early Grade Reading Studies in South Africa
The Gauteng Primary Language and Mathematics Strategy (GPLMS) was the first major interventionthat made use of a structured pedagogic programme and instructional coaching at a systemic level. The programme was implemented across the Gauteng provincefrom2011 to2014and included lessonplans,quality educational materials and instructional coaching in underachieving primary schools. Unfortunately, theprogramme was not implemented in a way that allowed a rigorous evaluation of its effectiveness, but using aregression discontinuity design, Fleisch et al. (2017)found that the programme showed strong promise. The implied effectiveness of the GPLMS providedthe motivation for exploring structured pedagogicprogrammesfurtherintheSouthAfricancontext.
The first experiment to evaluate the effectivenessof structure pedagogy was the Reading Catch-UpProgramme (RCUP) study,whichusedon-site teachercoaches over an 11 week time period to boost theteaching and subsequent learning of English readingamong Grade 4 learners whose Home Language was
1 InSouthAfrica,mostchildrenlearnintheirHomeLanguageasthelanguageofinstructioninthefirstthreegradesandthentransitiontoEnglishas the language of instruction in the fourth grade.
2 DuringthefirstthreegradestherearefourlearningareasrequiredbytheSouthAfricancurriculum:HomeLanguageliteracy,FirstAdditionalLanguage(whichisusuallyEnglish),NumeracyandLifeOrientation.
not English.1 The catch-up programme had reportedly beenverysuccessfulinimprovingEnglishreadingintheGautengprovince (Hellman,2012).Moreover, theshortduration of this programme renders it relatively cost- and resource-effective, since reading coaches couldbe rotated between different schools each term. Theimplementation of the catch-up programme in Gauteng was, however, not independently evaluated and hadno counterfactual. An RCT was therefore conducted in thePinetowndistrictofKwaZulu-Natal toevaluatetheimpact of the programme. Fleisch et al. (2017) found that theaverageimpactwasnotsignificantlydifferentfromzero, although children with a higher baseline Englishproficiency did register statistically significant gains.Twokey lessonsweregainedthroughthisexperiment.Firstly, the language foundation ofmost learners wastoolowtobenefitfromanadditionalsupportprogrammeand pointed to the need for interventions prior to Grade 4.Secondly,thedurationofcoachingwastooshorttoeffectrealchange.
Buildingontheselessons,thefirstEGRS1wasdesignedto introduce a structured pedagogic programme includingreadingcoachesforanextendedperiodintheFoundationPhase.Starting in2015,EGRSIspecificallyset out to evaluate the effectiveness of the on-sitecoaching approach versus the traditional government training model – centralised teacher training. Both interventions were implemented in a group of 50 schools which received the same daily lesson plans and additional reading materials. A further 80 schools served as the control, in which regular schooling continued.The interventions specifically targeted the teachingofreadingandliteracyinlearners’HomeLanguage,whichin the case of EGRS I was Setswana.2 The centralised teachertrainingoccurredfortwodaysatatime,atthestart of each year and again midway through each year. The major cost in this intervention was the travel and accommodation for teachers. The on-site coaching intervention included a half-day cluster meeting to
2 Research Context/
Year 1 Report: Learner performance after one year of implementation 09

disseminate lesson plans and reading materials at the startofeachquarter,aswellason-sitecoachingvisitsaboutonceamonth.Theratioofcoachestoschoolswasroughly 1:17 and the main cost in the coaching intervention was the salaries of coaches. The coaching intervention was therefore about 30% more expensive than thecentralised training intervention. The impact evaluation showed that after two years of the implementation of theinterventions,theon-sitecoachinginterventionhadreturned an average Home Language test score impact of 0.24 standard deviation relative to control. The impact of the central training intervention was half as large at 0.12standarddeviation.Moreimportantly,thecoachingintervention had a statistically positive impact on all of theearlygradesubtests,aswellasontheEnglishitems
(Figure1).Consideringthecost-effectivenessofthetwointerventions, the coachingmodel proved to be morecost-effectivewitha0.41standarddeviationincreaseintestscoresperUS$100.
Having shown that coaching plays an important role in shifting teacher instructional practice to improve learner reading proficiency, it was necessary for the researchto shift focus toquestionsabout thefinancial viabilityof implementing coaching across the board. Furtherquestionsalsoremainabouttheabilitytorecruit, trainandmanagethelargernumberofreadingcoaches,andwhetherthestructuredlearningprogrammeiseffectivein teaching EFAL in the Foundation Phase. EGRS II therefore sets out to consider these research questions.
0
0,05
0,1
0,15
0,2
0,25
0,3
Letters Words Non-words Paragraphreading
Comprehension Phon.awareness
Writing Math English
Est
imat
ed e
ffec
t si
ze (S
D)
Intervention 1 - Training Intervention 2 - Coaching Intervention 3 - Parents
Figure 1: Year 2 results of EGRS I
The Second Early Grade Reading Study10

2�2 South African EFAL Curriculum
Asmentionedabove,theinterventionlessonplansintendto strengthen the implementation of the South African EFAL curriculum. The EFAL curriculum comprises four learning areas in the Foundation Phase. These are:
1. Listeningandspeaking
2. Reading and phoneme awareness or phonics
3. Supported writing and handwriting
4. Language use
Thinking and reasoning, aswell as language structureanduse,are integrated into thedomainsaboveduringGrade1andGrade2,but languageusebecomesafulllearning area in Grade 3.
The EFAL curriculum takes an additive bilingualismapproach which intends for EFAL proficiencies to bebuiltonHomeLanguageproficiencies.Forexample,ifalearnercanidentifytheletter‘m’intheirHomeLanguage,itiseasiertobuildtheEnglishknowledgeof‘m’ontothis.Moretimecanthenbespentonareaswheretherearenosimilarities,e.g. thevoicelessdentalclick ‘c’ incula (sing – isiZulu) vs the voiceless velar plosive ‘c’ in cat (English).
In Grade 1, the EFAL curriculum prioritises thedevelopment of English oral proficiency. Learners areonly expected to gain incidental reading exposure,whichgraduallytransitionstomoreexplicitreadingandwriting instruction in Grades 2 and 3. The curriculum furtherhighlightstheneedformaximumtimedevotedto EFAL instruction especially for those learners who have to transition to English as the LoLT in Grade 4.
The time allocated for all languages in Grades 1 and 2 is 10hourseachwith11hoursinGrade3.InGrades1and2,thetimeallocationforEFALcanvarybetweentwohoursminimumtothreehoursmaximumandthisaffectsthetimeallocatedforHomeLanguage instruction.Thus, ifthemaximumtimeofthreehoursisallocatedtoEFAL,seven hours are allocated to Home Language in Grade 1. InGrade4,EFALcanvarybetweenthreeandfourhours,andagainaffectsthetimeallocatedtoHomeLanguageinstruction.Basedonthistimeallocation,itisimportantforteacherstomaximisesimilaritiesbetweentheHomeLanguage and English so that they can use their time effectively on vocabulary and reading and writingdevelopment in English.
The EFAL curriculum therefore rests on the following assumptions:
• EnglishoralproficiencyisnecessaryforEnglishliteracy acquisition.
• Three hours aweek of English instruction forthreeyearsissufficientforlearnerstodevelopthe necessary conceptual vocabulary andunderstanding to transition to English medium instruction in Grade 4.
• There is a strong Home Language literacy foundation on which to springboard Englishliteracyproficiencies.
• Teachers are able to use English as themainlanguage of instruction in EFAL lessons to increaselearners’exposuretoEnglish.
ItiswithinthisframeworkthattheEGRSIIlessonplanswere developed.
The EFAL curriculum takes an additive bilingualism approach which intends for EFAL proficiencies to be built on Home Language proficiencies
Year 1 Report: Learner performance after one year of implementation 11

The EGRS II is designed as a Randomised Control Trial (RCT),whichaimstomeasuretheeffectsofeachoftheinterventions and compare it to the situation among a comparison group of learners where typical teaching is taking place. The study entails the implementation oftwo early grade reading interventions in South Africa in 180 primary schools in Mpumalanga province from 2017 to 2019. The EGRS II focuses on the early learning ofEFALand the interventionsconsistof lessonplans,additional reading resources and instructional coaching and training. Two alternative strategies to training and coaching are used:
1. The traditional face-to-face format2. Acombinationofface-to-facetrainingandan
Information and Communications Technology (ICT) component that includes scripted lesson planson tabletsandcell phonemessaging tothe teacher.
Thesectionsthat followwillelaborateontheresearchsite,thespecificinterventions,thetheoryofchange,thesampleselection,theinstrumentdesignandthemidlinedata collection.
3�1 Research Site
The study was implemented in the Gert Sibande andEhlanzeni districts of Mpumalanga. Relative to the other provincesinSouthAfrica,Mpumalangaisamid-tolow-performing province. In the 2016matric examination,3 Mpumalanga ranked fifth out of the nine provinces.Unfortunately, South Africa does not currently havea standardised assessment with which to compare schools, districts and provinces in the Primary Phase,but various other indicators can provide an indicationof the current schooling conditions. The 2016 General Household Survey reports that 94.3% of five- to six-year-olds in Mpumalanga are currently attending an educational institution and 91.4% of Grade 1 learnersreported having attended Grade R prior to Grade 1. Povertyanalysisshowsthat28.4%oflearnersattending
3 The final school leaving examination in South Africa. This examination is standardised across all schools in South Africa, and is the only credible standardised assessment which can be used to make cross-province comparisons.
schoolsinMpumalangafallbelowthefoodpovertyline(monthlypercapitaincomeisbelowR442.00)and47%belowthelowerboundpovertyline(monthlypercapitaincomeisbelowR660.00).
3�2 Interventions
The EGRS II focuses on the early learning of EFAL byproviding specific resources, training and continuingsupport to teachers. The interventions aim to support FoundationPhaseteachersintheirinstructionofEFAL,in accordance with the DBE’s National CurriculumStatement,includingtheCAPS.
The interventions are intended to improve and strengthen teachers’ implementation of the EFAL CAPS curriculum in the Foundation Phase.
Both interventions consist of three components:
1. Lesson plans2. Integrated LTSM3. Instructional coaching and training.
The key differences between the two interventions liein the delivery mode of coaching support that teachers receive and the format in which teachers receive the lesson plans. In both interventions, teachers receiveinitial block training, as well as one-day training atthe start of each school term. In intervention 1, theteachers receive a paper-based version of the lessonplans and benefit from regular on-site coaching. Inintervention 2, the teachers receive a tablet with anelectronicversionofthelessonplans,includingvariousaudiovisualresources,andaresupportedthroughanICTcoaching model that includes telephone calls and cell phone messaging to the teacher. The electronic lesson plans in the second intervention are delivered using an application which is specifically developed for thestudy, and the additional electronic resources includeshorttrainingvideos,soundclipsofthephonicsounds,songsandrhymesandexamplesoflearners’work.Thefocus of both the interventions is explicitly onhow to
3 Study Design/
The Second Early Grade Reading Study12

LegendIntervention Groups
ControlIntervention 1Intervention 2
Figure 2: Map of the research site
deliverEFAL instructionandonhowtoeffectivelyusethe newmaterials as well as other availablematerials– especially the government-providedworkbooks – tomosteffectively teach reading inaccordancewith theNationalCurriculumStatementGradesR–12.
Intervention 1 is implemented in 50 randomly selected schools and provides teachers with regular face-to-facecoaching,aswellasquarterlytrainingworkshops.Thetrainingworkshopsinbothinterventionsaresimilarand focus specifically on supporting teachers withthe integration of the lesson plans and LTSM into the teachingofEFAL,aswellasonvariousmethodologiesfortheteachingofreadingandliteracyinEnglish.Unliketypical trainingworkshops, this is best understood as‘just-in-time’ training: not on general principles, butspecifically on how to implement the EFAL literacyprogramme in the upcoming weeks. The provision ofspecialist reading coaches is an alternative model of support, involving regular (once a month) in-schoolcoaching. The reading coaches play a number ofdistinct and overlapping roles, firstly inmodelling newpractices and secondly in monitoring implementation fidelity.Astheteachersbecomemorefamiliarwiththenewpractices,thecoach’sroleshiftsfromintroducingnewpracticestowardsthatof‘criticalfriend’,observingandprovidingreal-timeinputtoteachersastheybeginto master the new practice. The coaches also play an importantmonitoringrole,providingregularfeedbackto
the Project Management Team (PMT) on the level and quality of programme implementation. The monitoring is alwaysdoneinanencouragingmanner,whichthereforecontributes to teachers being more motivated andencouraged to implement the programme throughout the year. The reading coaches also initiate needs-driven clusteredworkshops throughout the school termwithidentified teachers invited to attend. Finally, teachersin both interventions are supplied with sets of LTSMincluding graded reading booklets, posters, big books,sentencestripsandvocabularywords.
Intervention2isimplementedinadifferentgroupof50randomlyselectedschoolsandusesadifferentmodelofteacher support and mode of delivering the lesson plan. The technology-supplemented intervention aims to provide new forms of support and guidance on teaching strategies througha rangeof resources, electronicallyavailablelessonplansandinteractivesupportplatformsthat are available at all times to the teacher. Theapplication further includes various resources such as videoclipsonbestpractice,andaudioclipsofEnglishsounds,thesongsandtherhymesinthelessonplans.The intervention makes use of WhatsApp or textmessaging to create virtual reading coaching practices and virtual communities of practice. The virtual reading coach uses instant messaging to communicate with teachersregularly,providingthemwithteachingtipsonaweeklybasis,andansweringanyquestionstheymay
Year 1 Report: Learner performance after one year of implementation 13
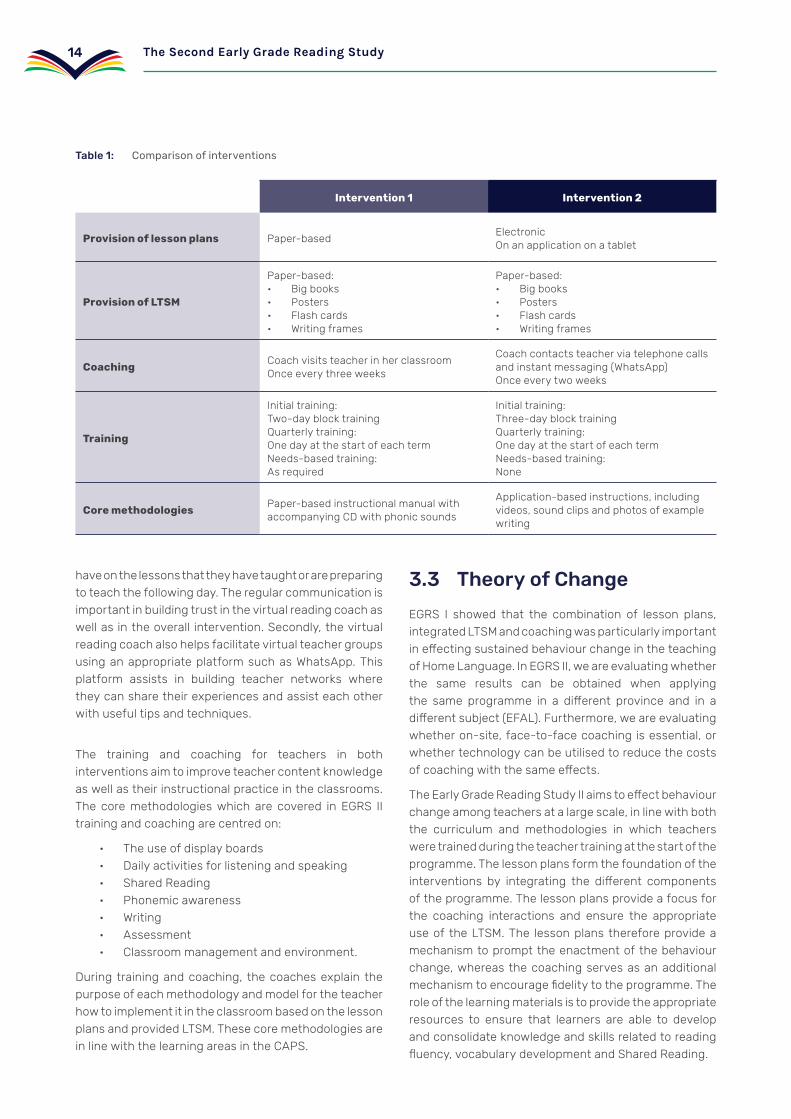
Table 1: Comparison of interventions
Intervention 1 Intervention 2
Provision of lesson plans Paper-basedElectronic Onanapplicationonatablet
Provision of LTSM
Paper-based:• Bigbooks• Posters• Flash cards• Writingframes
Paper-based:• Bigbooks• Posters• Flash cards• Writingframes
CoachingCoach visits teacher in her classroomOnceeverythreeweeks
Coach contacts teacher via telephone calls andinstantmessaging(WhatsApp)Onceeverytwoweeks
Training
Initial training: Two-dayblocktrainingQuarterlytraining:One day at the start of each termNeeds-basedtraining:As required
Initial training: Three-dayblocktrainingQuarterlytraining:One day at the start of each termNeeds-basedtraining:None
Core methodologiesPaper-basedinstructionalmanualwithaccompanying CD with phonic sounds
Application-basedinstructions,includingvideos,soundclipsandphotosofexamplewriting
have on the lessons that they have taught or are preparing to teach the following day. The regular communication is importantinbuildingtrustinthevirtualreadingcoachaswellasintheoverall intervention.Secondly,thevirtualreading coach also helps facilitate virtual teacher groups usinganappropriateplatformsuchasWhatsApp.Thisplatform assists in building teacher networks wheretheycansharetheirexperiencesandassisteachotherwith useful tips and techniques.
The training and coaching for teachers in bothinterventionsaimtoimproveteachercontentknowledgeas well as their instructional practice in the classrooms. The core methodologies which are covered in EGRS II training and coaching are centred on:
• Theuseofdisplayboards• Dailyactivitiesforlisteningandspeaking• Shared Reading• Phonemic awareness• Writing• Assessment • Classroom management and environment.
During trainingandcoaching, thecoachesexplain thepurpose of each methodology and model for the teacher howtoimplementitintheclassroombasedonthelessonplans and provided LTSM. These core methodologies are in line with the learning areas in the CAPS.
3�3 Theory of Change
EGRS I showed that the combination of lesson plans,integrated LTSM and coaching was particularly important ineffectingsustainedbehaviourchangeintheteachingofHomeLanguage.InEGRSII,weareevaluatingwhetherthe same results can be obtained when applyingthe same programme in a different province and in adifferentsubject(EFAL).Furthermore,weareevaluatingwhetheron-site,face-to-facecoaching isessential,orwhethertechnologycanbeutilisedtoreducethecostsofcoachingwiththesameeffects.
TheEarlyGradeReadingStudyIIaimstoeffectbehaviourchangeamongteachersatalargescale,inlinewithboththe curriculum and methodologies in which teachers were trained during the teacher training at the start of the programme. The lesson plans form the foundation of the interventions by integrating the different componentsof the programme. The lesson plans provide a focus for the coaching interactions and ensure the appropriate use of the LTSM. The lesson plans therefore provide a mechanismtoprompttheenactmentofthebehaviourchange,whereas thecoachingservesasanadditionalmechanismtoencouragefidelitytotheprogramme.Therole of the learning materials is to provide the appropriate resources to ensure that learners are able to developandconsolidateknowledgeandskillsrelatedtoreadingfluency,vocabularydevelopmentandSharedReading.
The Second Early Grade Reading Study14

Given the perceived high costs of direct in-class coaching,thestudyteststherelativecost-effectivenessoftwokindsofcapacitybuilding:thetraditionalface-to-facemodelandthenewcombinedface-to-facemodelsupplemented by electronic support in the form of atabletwithvideodemonstrationlessonsandcellphonemessaging support. The technology-supplemented intervention aims to provide new forms of support and guidance on teaching strategies through a range of materials, teaching guides, videos and interactivesupportplatforms thatareavailableatall times to theteacher. While the Early Grade Reading Programmecannotaddressall the learningchallenges,particularlyfor learnerswithasevere learningdisability, itaims tostrengthen English reading performance for the majority oflearnersacrosstheperformancedistribution.
Common Aspects of the Two InterventionsThe lesson plans provide specifications of thenew instructional practice including faster-paced instruction,moreappropriatelysequencedcontent,anddramatically expanded pedagogic repertoires. In theprimaryschool teachingof reading inEFAL, thenewlyexpanded repertoires include the systematic teachingof phonemic awareness and phonics, strategies thatfocus on increased reading speeds or fluency, SharedReading strategies, vocabulary development andstrategies that improve comprehension. The lessons requirelittleadditionallessonpreparationfromteachers,which makes the adoption of a more productiveteachingpracticemoremanageable.The faster-pacedinstruction (relative to typical practice) also ensures that the teachers cover the full prescribed curriculumfortheyear.Furthermore,lessonplansfreeupteachers’time,becausetheynolongerneedtoallocateasmuchtime to planning. This could improve reading acquisition if teachers allocate this time to productive teaching activities.
The role of the learning materials is to provide the appropriate resources to ensure that learners are abletodevelopandconsolidateknowledgeandskillsrelatedtoEnglishlanguageproficiency,Englishreadingfluency,English vocabulary development and Guided Reading.Flash cards, big books and posters are provided toteachers to use in an integrated manner when teaching vocabulary,phonicsandreading.FromGrade2onwards,10titlesofgradedreadingbookswillbeprovidedforeachclassroom. The accompanying graded reading materials provide ample material for learners to practise decoding
and reading at their level of development. It is recognised in South Africa that the opportunity to learn EFAL may behinderedbya lackofsuitablematerials toassist inthe progression from one phase of reading acquisition to the next, and this is likely to be particularly true inAfricanlanguageschools,thefocusofourintervention.Furthermore, teachers are required to provide regularassessmentof learners’ readingproficiency inorder toassign learners to the appropriate graded readers and smallreadinggroups,basedonability.
Inadditiontotheabove,coaching isprovidedasmoreintensive training to improve teacher capacity. In essence,theroleofcoachingsupportistofusecapacitybuilding and accountability. The assumption is that,just like learning to read, the ability to teach is a skillthatneedstobedevelopedovertimeandmightnotbeaccomplished in onedayof training. Furthermore, thecoachalsoplaystheroleofa‘champion’whokeepstheteacher accountable for implementing theprogrammethrough encouragement and motivation.
Intervention 1 Specifically In intervention 1, specialist reading coaches visit eachintervention school about once amonth. The in-classsupport allows for the modelling of the new practice on site and the gradual development of teachers in the new practice from novice to expert. The in-classsupport also allows teachers to manage the emotional labour, i.e. stress, insecurity and anxiety associatedwith developing a new professional practice mid-career. The presence of the in-class support allows for the development of professional accountability in anenvironment of trust, where the coach monitors andevaluates the teachers’ teaching practices in order to encourage more productive teaching practices. The continuing support from the coach also encourages the teachertokeepupwiththeincreasedpaceofthelessonplans throughout the course of the year.
Intervention 2 SpecificallyThe technology-supplemented intervention aims to provide new forms of support and guidance on teaching strategies through a range of materials, teachingguides, videos and interactive support platformsthat are available at all times to the teacher. Theseresources are intended to encourage more productive teaching practices among the teachers. Lesson plans areprovidedinanelectronicformatonatabletandareintegrated with various audio and visual resources to support teachers in the teaching of EFAL. The resources
Year 1 Report: Learner performance after one year of implementation 15

are supplemented with virtual coaching through phone calls and cell phone messaging. Similar to intervention 1,thecontinuingsupportfromthevirtualcoachintendstoencouragetheteachertokeepupwiththeincreasedpace of the lesson plans throughout the course of the year.However,giventhatthevirtualcoachwillnotbeintheclassrooms,theroleofthecoachwillfocusmoreonencouragement and less on monitoring.
3�4 Evaluation
The study was designed as an RCT and consisted of an implementation and evaluation side. Implementation serviceproviderswereappointedtoensuretheeffectiveimplementation of the interventions. The evaluation component of the study is conducted independently of the implementation service providers to ensure that the impact of the interventions minimises service provider bias.Datacollectionserviceprovidersarerecruitedforeach round of data collection and the PMT is ultimately responsiblefortheinstrumentdesignanddataanalysis.
Overview of Evaluation MethodsTheEGRSII isbeingevaluatedusingamixedmethodsapproach, whereby quantitative and qualitativemethodsareintegratedtoensurebothrobustnessanddepth in evaluating the impact of the interventions. The evaluation analysis for the midline report therefore relies on three rounds of research: the Case Studies in September2017,thelessonobservationsinSeptember2017andthemidlinelearnerassessmentsinNovember2017.
Quantitative estimation of impact: ThedesignisbasedonanRCTapproach,whereasampleofaround3 600 learners inthe180schools is trackedthroughout the duration of the study. The baselineperformanceof the learnerswas takenat the start ofGrade 1 (February 2017) and the follow-up testing onwhich this report is basedwas conducted at the endofGrade1(November2017).ThreemoreroundsofdatacollectionareplannedattheendofGrade2,theendofGrade3andagainattheendofGrade4,allowingustotrackthelearnersthroughouttheFoundationPhaseandinto Grade 4 where the LoLT switches to English. The RCTdesignwill allow for thecomparisonbetween theaverage learner performance among the intervention
4 TheAnnualNationalAssessmentshavenotbeenadministeredsince2014.Thisisthereforethemostrecentstandardisedmeasureofschoolperformance we have for the full population of schools.
andcontrolgroupstoestablishtherelativeeffectivenessof the respective interventions.
Qualitative estimation of intermediate outcomes: Thisapproachcombinesevidence fromtheClassroomObservation Study and the Case Studies, in orderto understand the key channels through which theinterventions influence teacher instructional practice.The information gained through these studies can also shed some light on any programme ineffectiveness,specifically in identifying weaknesses in programmeimplementation. The research questions that will be considered using this data will be in line with theresearchquestionsspecifiedinthepre-analysisplan.
Costing study: The costing study is intended to investigate the cost of theprogramme,aswellasotherresourcerequirementsnecessary to scale up the interventions. The costing is largelybasedonspendingdatafromtheimplementationof the programme.
Sample Selection and Intervention AssignmentThroughaprocessofelimination,wedevelopedasamplingframeof180eligibleschools.Beginningwith731primaryschools registered in the 2016 administrative data in the districts of Ehlanzeni and Gert Sibande, we firstlyexcludedrelativelyaffluentschools(thoseinquintiles4and5).Next,weexcludedschoolsinwhichthelanguageof instruction in the Foundation Phase was neither SiswatinorisiZulu.Wealsoexcludedschoolswhichweremissinginthe2014AnnualNationalAssessment(ANA)dataset.4Wefurtherexcludedparticularlysmallschools(fewer than 30 Grade 1 enrolments) since many of these schoolswouldpractisemulti-gradeteaching,renderingthegrade-specificlessonplanslessappropriate.Wealsoexcludedparticularlylargeschools(morethan160Grade1enrolments,ormorethanthreeclassesinGrade1,orclasses with more than 60 learners) to limit intervention costs.Afteralloftheseexclusions,193eligibleschoolsremained.Usinga randomnumbergenerator,we thenexcludedthreefurtherschoolstoremainwithasampleof 190 schools. The 190 school sample included a sample of 10 replacement schools (one in each of the strata) should the need arise to drop one of the sample schools. Wethusobtainedthesamplingframeof190schools.
The Second Early Grade Reading Study16

To increase power and assure balance betweenintervention arms, we performed stratifiedrandomisation.Wecreated10strataof19similarschoolsbasedonschoolsize,socioeconomicstatusandpreviousperformanceintheAnnualNationalAssessments.Withineachstratum,wethenrandomlyassignedfiveschoolsto each intervention group, eight to the control groupand one as a replacement school. Thus we randomly assigned 50 schools to each intervention and 80 to the control. Given that we aimed to collect data on 20 Grade 1learnersperschool,thissamplewouldbesufficienttoidentifyaminimumeffectsizeof0.21standarddeviationwhen comparing an intervention group with the control group and a minimum effect size of 0.23 standarddeviation when comparing two intervention groups. Thesecalculationsassumea95%confidenceinterval,analphavalueof0.8,anintra-classcorrelationcoefficient(rho)of0.3andacorrelationbetweenpre-andpost-testscores of 0.7.
Classroom Observation StudyTheClassroomObservationStudywasconductedwithasample of 60 schools (one classroom from each school) from the larger 180 school sample. This comprises 20 schoolsfromthecontrol,intervention1andintervention2groupseach.Sixtyschoolswereconsideredtobetheoptimalnumberofschoolsinwhichitwouldbepossibleto conduct the fieldworkgiven thebudget constraintsand cost of collecting such in-depth data. The collection of in-depthdataalsorequiredspecialisedfieldworkers,which further drove up the cost. Having 20 schools in each of the three groups allowed for an analysis of trends emerging as a result of the interventions implemented. After data collection was completed, however, it wasfound that 21 intervention 1 schools had been visitedand 19 control schools had been visited. Thismistakeoccurredbecauseanintervention1andacontrolschoolshared the same name.
The following criteria were used to select the schools from each group:
• Five top-performing urban schools (based onbaselineresultsatthestartofGrade1)
• Fiveadditionalurbanschools
5 asclassifiedbytheprincipalsinaquestionnaireatbaseline
• Fiveschoolsinthetop-performing25%ofruralschools(basedonbaselineresultsatthestartof Grade 1)
• Fiveschools inthebottom-performing75%ofrural schools.
Anurban/ruraldistinctionwasmadesinceEGRS Ihadshown that the intervention had the largest effect inurban rather than rural schools. Since therewere fewurban5 schools in the 180-school sample, all urbanschools sampled at the start of the year were visited for an EGRS II classroomobservation. Top-performingschools were over-sampled for this study because,according to the EGRS I findings, the top-performingschoolsaremorelikelytofollowtheEGRSIIprogramme.The Classroom Observation Study thus examines thechanges in the instructional practice of teachers who aremorelikelytotakeupnewpractices.
Case StudiesA sample of six schools was drawn for in-depthqualitative observations. Themethod employed aimedtofindtwoaverage-performingschools ineachof theintervention groups and control group, one rural andoneurbanschool,andtosampleschoolssuchthattheschoolsineachpair(urban,rural)werecloseenoughtoeach other to allow for school visits on consecutive days. Unfortunately,theresearcherwasunabletovisitoneofthesampleintervention1(I1)urbanschoolsasplanneddue toservicedeliveryunrest.A replacement I1urbanschoolthereforehadtobefoundthatwascloseenoughtooneof theother schools thatwere tobevisited sothat the researcher could cover two schools in one day.
Belowarethebasicdescriptorsofthesixschoolsactuallyvisited for the in-depth Case Studies (the names of the schools have been changed to protect the identity ofparticipants):
1. Lerato Primary School: a rural intervention 1 (I1) school near Piet Retief
2. ThamiPrimaryschool:anurban intervention1(I1)[replacement]schoolnearNelspruit
3. Busi Primary School: a rural intervention 2 (I2) school near Malelane
4. ThabisoPrimarySchool:anurbanintervention2(I2)schoolnearNelspruit
5. Nowazi Primary School: a rural control schoolnearNelspruit
6. Siyabonga Primary School: an urban controlschool near Malelane.
Year 1 Report: Learner performance after one year of implementation 17
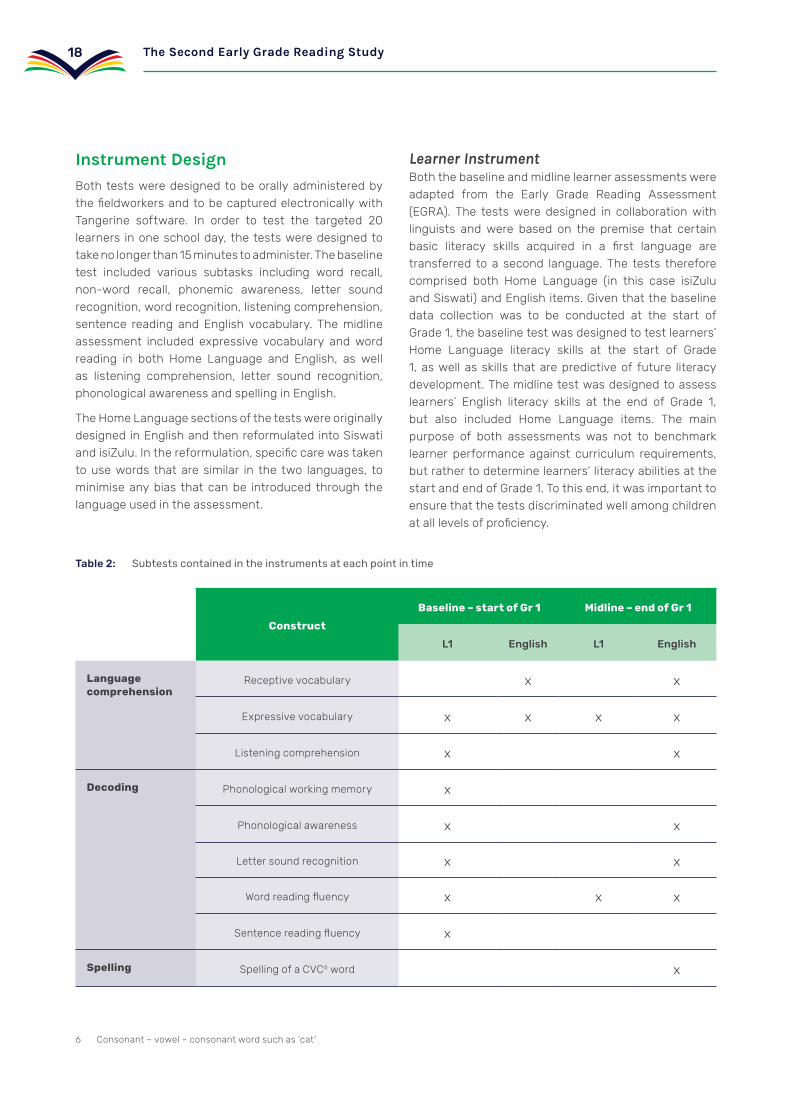
Instrument DesignBoth testsweredesigned tobeorallyadministeredbythefieldworkersandtobecapturedelectronicallywithTangerine software. In order to test the targeted 20 learners inoneschoolday, thetestsweredesignedtotakenolongerthan15minutestoadminister.Thebaselinetest included various subtasks including word recall,non-word recall, phonemic awareness, letter soundrecognition,wordrecognition,listeningcomprehension,sentence reading and English vocabulary. Themidlineassessment included expressive vocabulary andwordreading in both Home Language and English, as wellas listening comprehension, letter sound recognition,phonological awareness and spelling in English.
The Home Language sections of the tests were originally designed in English and then reformulated into Siswati andisiZulu.Inthereformulation,specificcarewastakentousewords that are similar in the two languages, tominimiseanybias thatcanbe introduced through thelanguage used in the assessment.
6 Consonant – vowel – consonant word such as ‘cat’
Learner InstrumentBoththebaselineandmidlinelearnerassessmentswereadapted from the Early Grade Reading Assessment (EGRA). The testswere designed in collaborationwithlinguists and were based on the premise that certainbasic literacy skills acquired in a first language aretransferred to a second language. The tests therefore comprised both Home Language (in this case isiZuluandSiswati)andEnglishitems.Giventhatthebaselinedata collection was to be conducted at the start ofGrade1,thebaselinetestwasdesignedtotestlearners’Home Language literacy skills at the start of Grade1, aswell as skills thatarepredictiveof future literacydevelopment. The midline test was designed to assess learners’ English literacy skills at the end of Grade 1,but also included Home Language items. The mainpurpose of both assessments was not to benchmarklearner performance against curriculum requirements,butrathertodeterminelearners’literacyabilitiesatthestartandendofGrade1.Tothisend,itwasimportanttoensure that the tests discriminated well among children atalllevelsofproficiency.
Table 2: Subtests contained in the instruments at each point in time
Construct
Baseline – start of Gr 1 Midline – end of Gr 1
L1 English L1 English
Language comprehension
Receptivevocabulary x x
Expressivevocabulary x x x x
Listening comprehension x x
Decoding Phonologicalworkingmemory x
Phonological awareness x x
Letter sound recognition x x
Wordreadingfluency x x x
Sentencereadingfluency x
Spelling Spelling of a CVC6 word x
The Second Early Grade Reading Study18

Contextual QuestionnairesDuringboththebaselineandthemidlinedatacollectioncontextualquestionnaireswereadministeredtoparents,the Grade 1 teachers and the school principal. The contextual questionnaires were designed by adaptingthe instruments which were administered in the EGRS in NorthWesttothecontextinMpumalanga.AnadditionalfocusonthefrequencyofusingEnglishbothathomeand in the classroom was included in both the homebackground questionnaire (HBQ) and the teacherquestionnaire.
Classroom Observation Study QuestionnairesThree observation-based instrumentswere developedfor the Classroom Observation data collection tocapture elements of teacher instructional practice. These instruments were developed for the South Africancontexttocaptureinformationontheclassroomlevel factorshighlightedasaffecting learneracademicachievement in South African classrooms (Hoadley,2016).Becauseof the focuson factors specific to theSouth African context, other classroom observationinstruments such as Classroom Assessment Scoring System (CLASS) (Pianta, La Paro, & Hamre, 2008),Stallings classroom snapshot method (World BankGroup,2015)andIndividualisingStudentInstruction(ISI)(McDonaldConnor,etal.,2009)werenotused.
The list below outlines the subsections of eachinstrument designed for this study:
• Classroom Observation Schedule comprising 11 sections focusing on: teaching and learning environment;timeontaskandpacing;discipline;useofLTSM;languageofinstruction; listeningand speaking; literacy and language; phonicsandvocabularydevelopment;opportunitiestowrite;cognitivedemand;andassessment.
• Classroom Document Review Schedule comprisingfivesectionsfocusingon:areviewof the teacher’s classroom book collection;work schedule and work plan; records ofassessment; school timetable; and learners’workbooks.
• Teacher Interview Schedule comprising eight sections focusing on: teacher and lesson details; class size; time on task; planning andcurriculum coverage; availability and use
of learning material; approaches to Englishlanguage teaching; assessment; and teachingsupport received for EFAL.
Data CollectionBoth the baseline and midline data collection wereconducted by external service providers. Each roundemployed 15 pairs of fieldworkers over a three-weekperiod.Duringbaseline,arandomsampleof20learnerswas selected tobe tested ineach school, andexactlythe same learners were retested again at midline.
For each round of data collection, each school wasvisited by a pair of fieldworkers, with one fieldworkerbeing responsible for the individual administration ofthe learner assessment, and the second fieldworkerbeing responsible for the structured questionnaires.Thefieldworkerresponsibleforthelearnerassessmentwasalsoresponsibleforarrangingthecompletionofastructuredcontextualquestionnaire(homebackgroundquestionnaire) by the parents or caregivers of all thesampled learners. The contextual questionnairesweretakenhomeby the learnersandfieldworkersarrangedto retrieve them from the schools again via the learners’ teachers within the three-week fieldwork period. ThesecondfieldworkerwasresponsibleforadministeringastructuredquestionnairetoalltheGrade1teachers,aswell as the school principal. Both these instruments also involved completing some school and classroom facility observations.
The learner assessments, teacher and principalquestionnaires were administered using Tangerine software.Thehomebackgroundquestionnairewassenthomewiththelearnersforaparentorguardiantofillout.These questionnaires were subsequently collected bythe data collection company and captured and cleaned. Thefinaldataset,aswellas.dofilesusedtocleanthedata in thestatisticalsoftware,Stata,wasprovidedtothe PMT at the conclusion of the data collection contract.
Thequalityof thefieldworkatbaselineand the issuesthatwerefacedduringthedatacollectionaredescribedin theBaselineReport. Themainproblemwascausedbyateacherstrikewhichmadeitmoredifficultforthefieldworkers to test 20 learners in one day. For thisreason, the baseline sample does not consist of theexpected3 500learners,butratherof3 482learners.
Themidlinedatacollectionexperiencedfewerproblems,with all fieldwork teams having been well received in
Year 1 Report: Learner performance after one year of implementation 19

schools. Some teams encountered minor problemsat first, but none of which led to serious constraints.Duringthefirstweekofdatacollections,variousteamsreported that some communities experienced strikes.Thesestrikesweremainlylocaltransportationandunion
strikes. However, the schools affected by the strikeswere very understanding and willing to reschedule the visits. Apart from the strikes, absenteeism of learnersand teachers was the biggest challenge experiencedduringfieldwork.
Table 3: Percentage of learners tested during baseline data collection
Intended sample
Baseline Midline
Number tested Percentage tested
Number retested and matched
Percentage retested and
matched
Control 1 500 1 459 94% 1 347 92%
Intervention 1 1 000 924 95% 820 89%
Intervention 2 1 000 944 98% 873 92%
Total 3 500 3 482 97% 3 040 91%
Table 4: Percentage of teacher interviews conducted during midline data collection
Number of
teacher interviews
Number of teacher
exercises
Number of learners matched to teachers
Percentage of questionnaires merged
Control 141 133 1 204 83%
Intervention 1 90 90 747 81%
Intervention 2 88 88 786 83%
Total 319 315 285 82%
Table 5: Percentage of home background questionnaires returned
Number returned Number matched Learners matched to HBQ
Control 1 459 1 422 97%
Intervention 1 924 914 99%
Intervention 2 944 935 99%
Total 3 327 3 271 98%
The Second Early Grade Reading Study20

The teacher questionnaireswere linked to the learnerassessmentsandtheprincipalquestionnairesbymeansofalinkingformthatwasfilledoutbythefieldworkers.Unfortunately, the linking forms were filled out verypoorly,specificallywithregardtotheteachernamesandsurnames.Thishasmeantthatthelinkingoftheteacherquestionnaire to the learner questionnaires has beenchallenging, and only 82% of the teacher interviewscouldbe linked to the learnerassessmentsduring themidline.
The principal interview asked general questions abouttheschooltogainabetterunderstandingofthecontextin which the Grade 1 teachers and learners function. The instrumentwasadministeredateachschool,witha deputy-principal or another School Management Team(SMT)memberstandinginfortheprincipalwherenecessary.
The final instrument administered was the homebackgroundquestionnairewhichlearnerstookhome.Thepurpose of the questionnaire was to collect information about the learners’ homecircumstances, and3 271 ofthe returned questionnaires were successfully matched with learners in the sample.
3�5 Ethical Clearance
The research methodology, with the intendedinstruments and research consent forms related to the baselinedatacollection,wasformallysubmittedtotheUniversity of Witwatersrand Human Research EthicsCommittee(Non-medical)inMay2016.Theprojectwasapprovedon3November2016andwasgrantedethicalclearanceforthedurationofthestudy,upto2November2019.Duringthebaselinedatacollection,consentformswere provided to all principals and teachers interviewed. Consentformswerealsosentwiththehomebackgroundquestionnaire to parents.
3�6 Sample Characteristics
The sample population more or less mirrored the larger school population in the province. The average age of learners in the study was 6.7 years at the end of Grade 1and28.6%of learners reported themselvesasfirst language isiZuluspeakers,with theother learnersreporting Siswati as their Home Language; 56% oflearners are from households where the responding parentdidnotcompleteanysecondaryschooling,andafurther23%onlycompletedsecondaryschooling,buthave not pursued any further education. The parents werealsoaskedsomequestionsonhowregularlytheyspeakEnglish to their child and60%of theparents inthissamplereportedthattheysometimesspokeEnglishtotheirchild.However,27.5%reportedthattheyneverspokeEnglishtotheirchild.
Aswiththecountryasawhole,theteachersinthestudyhad an average age of close to 50 years, with over aquarterofallteachersbeingolderthan55years.Allwerefemaleteachers.GiventheICTfocusof intervention2,allteacherswereaskedaboutthetechnologicaldevicestheyhaveintheirhousehold,aswellashowregularlytheyuse certain technological features. It was interesting to notethat72%ofteachersownedasmartphoneand54%ownedacomputer.However,only44%ofteachersusedemail,only28%accessededucationalresourcesontheinternetandonly25%usedMicrosoftWord.
More than half the schools were classified as Quintile1 schools (poorest), with 32.8% in Quintile 2 and only13.5% Quintile 3. The majority of the principals in thesurveydescribedthelocationoftheschoolsasremoterural,withasmallnumberinsmallvillages,townshipsorinformal settlements in a city.
Overall the sample seems balanced on observablecharacteristics, with the only significant differencesseeninthebaselinescore,classsizeandprincipalage.Thevirtualcoachinggroupperformedslightlybetteratthebaselineandhadsmallerclasssizesrelativetothecontrolgroup.Theon-sitecoachinggroup,ontheotherhand,hada loweraverageprincipalage,butaslightlyhigher proportion of teachers who are older than 55 years.
Year 1 Report: Learner performance after one year of implementation 21

Table 6: Sample characteristics
Control On-site coaching
(I1)Virtual coaching
(I2)N I1 vs
I2
Mean Coefficient s.e. Coefficient s.e.
p- value
Learner characteristics
Learner = boy 0.522 0.020 (0.019) 0.026 (0.022) 3 040 0.820
Learner age 6.658 -0.004 (0.048) 0.004 (0.046) 3 039 0.885
Learner language = isiZulu
0.296 -0.038 (0.052) -0.023 (0.054) 3 327 0.809
Baseline score -0.020 -0.016 (0.067) 0.113* (0.068) 3 327 0.075
Teacher characteristics
Teacher age 49.58 0.815 (1.144) -0.252 (1.090) 306 0.372
Older than 55 0.241 0.108* (0.064) 0.000 (0.060) 306 0.130
Teacher language = isiZulu
0.299 -0.02 (0.059) -0.021 (0.052) 306 0.984
Teacher language = Siswati
0.672 0.025 (0.056) 0.019 (0.052) 306 0.918
Multi-grade classroom
0.044 0.025 (0.034) 0.002 (0.035) 306 0.542
Class size 42.75 -2.368 (1.531) -4.007*** (1.476) 306 0.317
At least a bachelor’s degree
0.547 0.006 (0.077) -0.019 (0.071) 306 0.779
Teacher English proficiency
3.821 -0.083 (0.284) 0.436 (0.289) 268 0.112
Principal and school characteristics
Principal age 52.55 -2.338** (0.948) -1.372 (0.944) 180 0.360
Older than 55 0.375 -0.177** (0.081) -0.034 (0.080) 180 0.112
Gr 1 teacher vacancies
0.063 -0.021 (0.042) 0.005 (0.042) 180 0.590
Quintile 1 school 0.537 -0.014 (0.054) 0.001 (0.053) 180 0.801
The Second Early Grade Reading Study22

3�7 Balance at Baseline
Furthermore, balance tests were conducted on eachsubtaskatbaselinetoensurethatthesampleisbalanced.Table7showstheresultsbasedonregressionanalysisto test for balance. These tests evaluatewhether thedifferences in learning outcomes among the differentintervention groups are statistically significantlydifferentfromzero.
EachcolumninTable7isaseparateregressionrunforeach subtask on intervention indicators, controllingfor strata and district fixed effects. The significantdifferencesinthetablewillberepresentedbystars.Forinstance,theonestatisticallysignificantresultinTable7istheperformanceonthe‘NamingtheAnimals’subtaskofthelearnersintheintervention2group,relativetothecontrol group.
Table 7: Balance tests per subtask
Animals Word Recall
Non-word
Recall
Phoneme Isolation
Compre-hension
Letter Sounds
Words Correct
Sentence Reading
Visual Perception
English Vocabulary
Paper-based 0.15 -0.02 -0.02 -0.06 -0.02 -0.16 -0.05 -0.03* 0.17 -0.04
(0.152) (0.118) (0.067) (0.12) (0.064) (0.484) (0.136) (0.016) (0.121) (0.066)
Tablet-based 0.39*** 0.12 0.03 0.04 0.1 0.07 0.14 -0.02 0.19 0.01
(0.149) (0.118) (0.094) (0.131) (0.063) (0.48) (0.165) (0.016) (0.124) (0.057)
Control mean 7.155 9.981 4.208 1.129 2.179 4.652 0.387 0.051 1.46 0.836
N 3 327 3 327 3 327 3 327 3 327 3 327 3 327 3 327 3 327 3 327
Paper = Tablet: p-value 0.158 0.245 0.573 0.448 0.092 0.66 0.27 0.518 0.857 0.511
Note:Eachcolumnrepresentsaseparateregressiononinterventiondummiesandstratificationdummies.Standarderrorsareclusteredatschoollevel.*forp<.1;**forp<.05;***forp<.01
Table 8: Balance test on teacher English proficiency
Teacher score
Paper-based -0.4
(0.256)
Tablet-based 0.14
(0.267)
N 2 963
Paper = Tablet: p-value 0.063
Note:Teacherscoreregressedoninterventionandstratificationdummies.Standarderrorsareclusteredatschoollevel.*forp<.1;**forp<.05;***forp<.01
Thetwostarsindicatethatthisdifferenceissignificantata5%level.Thefinalrowinthetableshowsthep-value
for the pair-wise test comparing the means betweenthe two intervention groups (i.e. not the means of the intervention groups with the control group). A p-value of lessthan0.05wouldindicatethatthereisanimbalancebetween the two groups for the specific learningoutcome.Thereareonly twoslight imbalancesvisible,butoverallthesamplesareclearlybalanced.
A short English proficiency task was administered toteachers. Themain purpose of the task is to serve asa control in the learner regressions, but it also allowsan additional balance check. Table 8 shows that theteachers in the various intervention groups are similar in their English proficiency. Although teacher Englishproficiency is not the focus of the interventions, it islikely that improved English proficiency might be theresult of increased use of English during the lessons. ThebalancebetweenthegroupsatthebaselinemeansthatanydifferencesinteacherEnglishproficiencyinthewave2datacollectioncouldbeascribedasasecondaryoutcome of the interventions.
Year 1 Report: Learner performance after one year of implementation 23

Asafirststeptocheckingthesuccessoftheinterventions,it is useful to consider the quality of implementation. Successful implementation would entail teachers attending the teacher training sessions, as well asteachers using the methodologies and materials in their classrooms.Administrativedata,aswellasinformationfromboththeteacherquestionnaireandtheClassroomObservationStudy, areused toevaluate the fidelity ofimplementation.
4�1 Interventions 1 and 2
Table 9 presents the teacher attendance statistics atthe training sessions for each term. Overall teacher attendance was high and remained high throughout the year. In term 3 the teacher training had a lower attendancerate,butthereisnorealdifferencebetweenthe attendance rates of the two intervention groups.
Various questions were included in the teacher questionnaire to gain a better understanding of thefidelityof implementation (Figure3).Thefirstquestionunder consideration asked teachers whether theyreceivedanyin-servicetrainingduringtheyear:94%and96%of teachers in the intervention 1 and intervention2 schools respec-tively responded that they received in-service training on the teaching of EFAL during the year.About74%ofteachersinthecontrolschoolsalsoresponded that they received in-service training in the teaching of EFAL during the year. This training was most likely conductedby either theprovince or thedistrict,and itwill be interesting to compare the effect of theregular training model to the EGRS training and coaching model.
4�2 Intervention2Specifically
The virtual coaching intervention lends itself to further monitoringof implementationbyconsideringteachers’usage of the tablets in the classroom. Two questions
7 ItisrecognisedthattheschooldayisoftendisruptedinSouthAfricanschoolsbyvariousexternalfactors.Togivetheteachersthebenefitofthedoubt,thethresholdfor‘alessontaught’wasthereforesetat15minutes.
in the teacher questionnaire aim to gauge the usage of technologyandtabletsintheclassroom.Itisnecessary,however,tokeepinmindthattheseresponsesareself-reported, and teachers in interventionmayhavebeenmorelikelytorespondfavourablyknowingthattheyweresupposedtobeusingthetablets.Tofurtherinvestigatetheactualusageofthetablets,thetimestampdatafromthe tabletswereanalysedtodetermine theproportionof teachers that opened the lesson plans at least three times a week, and the proportion of teachers thatcoveredatleast75%oflessons.
Table10reportstheresultsfromthequestionsincludedin the teacher questionnaire relating to using technology in the classroom:92%of the teachers responded thatthey use technology in the classroom, and similarly,92% of teachers responded that they make use of atablet intheclassroom.Inthecontrolandintervention1 schools, a small proportion of teachers reportedusing a tablet in the classroom, and a slightly higherproportion indicated that they use technology. A radio was the most prevalent form of technology teachers in the control and intervention 1 schools reported as using intheclassroom,followedbyasmartphone.Usingthetime-stampdatawhich iscapturedbytheapplication,Figures 4 and 5 provide further information regarding thetimeateacherspentusingthetablet.Thefirstgraphconsiders the average number of days per week thata teacher used the application for at least 15 minutes. The lesson plans scheduled 30 minutes of teaching timeeachday;however,alowerthreshold7 was chosen to calculate the average number of times the teachertaughtalessonaweek.Itisnecessarytonotethatthetime-stamp data only provides us with information on when the teacher entered and exited a lesson. Usingthisinformationitispossibletoderivewhentheteacheraccessedthelesson,aswellastheamountoftimetheteacher spent in a lesson.
Aday‘taught’wascalculatedbyconsideringwhetherateacher spent at least 15 minutes during school hours intheapplication,regardlessofthenumberof lessons
4 Implementation Fidelity/
The Second Early Grade Reading Study24

she accessed. Using this measure, it is evident that70% of the teachers in the virtual coaching schoolsonaveragetaughtat least three lessonsaweekusingthelessonplansontheapplication.Aboutaquarterofteacherstaughtatleastfourdaysaweek,andfinally,7%ofteachersmanagedtoteacheverydayoftheweek.
Figure 5 shows the lesson plan coverage for the teachers in the virtual coaching schools. A lesson was considered as covered if a teacher spent more than 10
minutes in totalonaspecific lessononaspecificday.Usingthismeasure,Figure5showsthatonly20%oftheteachersmanagedtocover50%ofthelessons,whereasonly 10% of teachersmanaged to cover two-thirds ofthe lessons. The information from Figure 4 and Figure 5 seem to suggest that the teachers managed to spend regular time using the application (and therefore most likelyteachingEnglish),butthattheydidnotnecessarilymanagetocovertherequirednumberoflessons.
Table 9: Teacher attendance at training sessions
Term 1 Term 2 Term 3 Term 4
No % No % No % No %
On-site coaching 82 86% 90 95% 75 79% 90 95%
Virtual coaching 88 95% 91 98% 73 78% 89 96%
Table 10: Using technology in the classroom
Percentage of teachers who use
technology in classPercentage of teachers who use a
tablet in class
Control24% (0.037) 7% (0.022)
On-site coaching
19% (0.043) 5% (0.023)
Virtual coaching
92% (0.030) 92% (0.030)
The virtual coaching intervention lends itself to further monitoring of implementation by considering teachers’ usage of the tablets in the classroom.
Year 1 Report: Learner performance after one year of implementation 25

0% 20% 40% 60% 80% 100% 120%
Control
On-site coaching
Virtual coaching
Figure 3: Did you receive any in-service training in the teaching of EFAL?
0
0,05
0,1
0,15
0,2
0,25
0,3
0,35
0,4
0 days 1 day 2 days 3 days 4 days 5 days
Per
cen
tage
of
teac
her
s
Average number of days taught
Figure 4: Average number of days taught, per week
0
0,1
0,2
0,3
0,4
0,5
0,6
0,7
0,8
0,9
1
0%
4%
5% 6% 7% 8%
10%
11%
12%
13%
15%
16%
19%
20%
21%
25%
27%
31%
34%
36%
39%
41%
44
%
45%
48
%
51%
53%
62%
67%
75%
77%
78%
102%
Per
cen
tage
of
teac
her
s
Percentage of lessons covered
Figure 5: Lesson plan coverage
The Second Early Grade Reading Study26

The sections to follow report on the data collected through the midline data collection. This will entail considering the attrition rate for each of the intervention and control groups, a detailed analysis of the learnerperformance on each of the subtests, as well as themain impact evaluation results.
5�1 Attrition
During themidlinedatacollection,3 040of the3 327learners who were tested during the baseline datacollection were retested and successfully matched to theirbaselineresults.Theoverallattritionrateof9%isinline with what other longitudinal studies in South Africa have found.When breaking down the attrition rate by
interventiongroup, thedifferencesarenotstatisticallysignificant,butfromFigure6itisclearthattheattritionrateoflearnersintheon-sitecoachingschools(11%)wasslightly higher than the attrition rate among learners in thevirtualcoachingandcontrolschools(eachatabout8%).
The only learner or school characteristic that was significantly correlated to the likelihood of a learnersufferingattritionwasthelearner’sbaselinescore,whichsuggests that poorer-performing learners were more likelytonothavebeeninthemidlinesample.Therewasno significant interaction effect between interventionassignment and the baseline score. Nevertheless, thefinal resultswill be evaluatedusing inverse probabilityweightsasafinalsensitivitycheck.
Figure 6: Attrition rate by intervention group
0% 2% 4% 6% 8% 10% 12% 14% 16% 18% 20%
Control
On-site Coach
Virtual Coach
5 Midline Results/
Year 1 Report: Learner performance after one year of implementation 27

5�2 Item Level Learner Assessment Results
The midline learner assessment consisted of nine different tasks that assessed variousHome Languageand EFAL reading, writing and comprehension skills.Sixoftheseassessmenttaskswererepeatedfromthebaselineassessmenttofurtherallowthemeasurementof the learningthat tookplacethroughouttheGrade1year.
Table11providesinformationonthedescriptivestatisticsofboththebaselineandthemidlineassessmenttasks.Thescoresinthetablehavenotbeenstandardisedandtheaveragesshould,therefore,beinterpretedrelativetotheminimumandmaximumvalueintherangecolumn.Forexample,inthebaselineexpressivevocabularytask,the average performance was 7.2 items correct out of 12. Learners at the 10th percentile of the performance distribution on this itemmanaged to score four itemscorrect on average, whereas learners at the 90th percentile managed to score 10 out of the 12 correct. The table shows that in some of the subtasks therewereflooreffects (e.g.baselinevisualperception),andtwo itemshada ceiling effect (e.g. baselinenon-wordrecallandmidlineexpressivevocabulary).KnowledgeofEnglishvocabularywaslowwithonly25%ofthesamplecorrectly identifying at least one animal in English. Overall,boththeassessmentsseemtoprovideenoughinformation to discriminate among learners in various partsoftheperformancedistribution.
In general, there is variability in learners’ vocabularylevels, phonological working memory and listeningcomprehensionabilityatthestartofGrade1.Learnershavevaryinglevelsoflettersoundknowledgewithhalfthe learnersnamingfiveor fewer letterscorrectly inaminute, and 18%of learnersnot being able to identifya single letter correctly. Most learnerswere unable toidentifythefirstphonemeofatwo-syllablewordintheirHomeLanguage,withlearnersonlyatthe75th percentile abletoidentifytwoofsixphonemescorrectly.Halfthe
learners could not name or point to farm animals in English and even at the 90th percentile learners could identifyonlytwoofsixanimals.
By the end of Grade 1, most of these skills showedimprovements, but a large proportion of learners stillscoredzeroonsomeofthetasks.Withregardtowordreading, learnersatthe50th percentile could only read oneHomeLanguagewordcorrectly;whilethiswaszerobelowthe50thpercentile,atthe90th percentile learners could read 17 words per minute correctly. Similar results were found for English word reading. Learners belowthe 50th percentile could not perform English phoneme identification tasks correctly by the end of Grade 1.Learners could recognise more letter sounds correctly on average moving from a mean of 6.98 at the start of theyear toameanof 17.62by theendof theyear.However,learnersatthe10thpercentilewerestillunableto identify a single letter correctly in the given time at theendofGrade1.Overall,learnerknowledgeofEnglishvocabulary ismoderatewith regard to the listening toinstructions taskand learnersonaveragemanaged tocorrectlyrespondtoaboutthreeofthefiveinstructionsgiven in English. The listening comprehension and the Englishexpressivevocabularytasksprovedtobemoredifficult.Onlyatthe90th percentile did learners manage to correctly answer one of the listening comprehension questions and at the 75th percentile learners managed to give the correct English word for a picture. Finally,only learners at the 90thpercentilewereabletospelltheEnglish word dog.
Table12showstheinter-itemcorrelationsbetweenthesubtasks assessed at baseline and atmidline. Overall,there was a correlation of 0.4 between the baselineand midline assessment index scores. Letter soundrecognitionandphonemeawarenessatbaselinehadthestrongestcorrelation to themidlinesubtasks, followedby the English vocabulary subtask at baseline. TheHome Languageword recognition subtask had a verylowcorrelationtothemidlinesubtasks,butthisisduetothesevereflooreffectsonthistaskatthebaseline.
The Second Early Grade Reading Study28

Table 11: Item descriptive statistics
N Mean s.e. p10 p25 p50 p75 p90 Min. Max. % zero
score
Bas
eli
ne
1.HLNamingtheAnimals
3 327 7.3 0.41 4 6 7 9 10 0 12 1.3%
2.HLWordRecall 3 327 10.0 0.04 7 9 10 12 13 0 14 0.0%
3.HLNon-wordRecall 3 327 4.2 0.02 3 4 5 5 5 0 5 1.5%
4. HL Phoneme Isolation
3 327 1.1 0.03 0 0 0 2 4 0 6 62.9%
5. HL Story Comprehension
3 327 2.2 0.02 1 1 2 3 4 0 4 8.7%
6. HL Letter Sound Recognition
3 327 6.9 0.13 0 2 5 9 18 0 30 18.7%
7.HLWordsCorrect 3 327 0.4 0.02 0 0 0 0 1 0 6 88.3%
8.HLSentenceWordsCorrect
3 327 0.0 0.01 0 0 0 0 0 0 6 98.5%
9. HL Visual Perception
3 327 1.6 0.03 0 0 1 3 4 0 10 35.9%
10.EFALVocabulary 3 327 0.8 0.02 0 0 0 1 2 0 6 50.4%
Mid
lin
e
10.HLExpressiveVocabulary
3 067 4.9 0.01 5 5 5 5 5 0 5 0.0%
10.HLWordsCorrect 3 066 5.0 0.12 0 0 1 11 17 0 18 48.3%
11. EFAL Phoneme Isolation
3 066 3.6 0.06 0 0 3 6 8 0 9 28.2%
14. EFAL Letters Correct
3 068 16.7 0.31 0 3 11 26 40 0 80 12.1%
15.EFALWordsCorrect
3 062 5.1 0.13 0 0 2 7 16 0 36 35.6%
16. EFAL Listening 3 062 2.9 0.02 1 2 3 4 4 0 5 8.3%
17. EFAL Listening Comprehension
3 062 0.2 0.01 0 0 0 0 1 0 3 82.1%
18.EFALVocabulary 3 060 0.7 0.02 0 0 0 1 2 0 2 51.1%
19.EFALWriting 3 056 0.2 0.01 0 0 0 0 1 0 1 76.5%
Year 1 Report: Learner performance after one year of implementation 29

Table 12: Item correlations between baseline and midline
Baseline
Home Language EFAL
Nam
ingAnimals
WordRecall
Non-w
ordRecall
Ph
onem
e Is
olat
ion
Sto
ry
Com
pre
hen
sion
Lett
er S
oun
d R
ecog
nit
ion
HLWordsCorrect
EnglishVocab
Mid
line
Ho
me
La
ng
uag
e
ExpressiveVocabulary 0.09 0.08 0.06 0.05 0.07 0.06 0.04 0.02
WordsCorrect 0.11 0.11 0.09 0.25 0.14 0.33 0.02 0.16
Phoneme Isolation 0.12 0.15 0.08 0.27 0.19 0.23 0.00 0.19
EF
AL
Letters Correct 0.12 0.10 0.10 0.26 0.15 0.34 0.00 0.15
EnglishWordsCorrect 0.14 0.09 0.05 0.20 0.10 0.27 0.02 0.15
Listening 0.16 0.12 0.09 0.19 0.21 0.20 0.01 0.28
Listening Comprehension
0.09 0.07 0.08 0.09 0.12 0.12 -0.04 0.23
Vocabulary 0.19 0.07 0.06 0.22 0.15 0.24 0.02 0.29
Writing 0.11 0.08 0.06 0.21 0.10 0.28 0.03 0.20
Subtask 1: Home Language Expressive VocabularyAshortHomeLanguagevocabularytaskwasdevelopedfor the midline assessment which required learners to identify the actions which were being performedby characters in pictures shown to the learners. Thelimitationsofassessingvocabularyinthiswayarenoted,but unfortunately, more com-prehensive vocabularytestssuchasthePeabodyPictureVocabularyTestandtheWoodcock-Mun᷈oz LanguageSurvey are too time-consuming for the purposes of evaluating the EGRS II.
This task was intentionally included as a very easytask toenablesomediscriminationamongthe lowest-performing learners. It is therefore to be expectedthat the learnersperformedverywelloverall,with themajorityoflearnershavingbeenabletocorrectlyidentifythe actions. Given the ceiling effects, no significantdifferences were observed between the control andintervention groups.
Subtask 2: Home Language Word RecognitionAt baseline, learners were asked to read an isiZulu orSiswatiword list (sixwords) depending on their HomeLanguage. The words were all two syllables long andsimilar in structure in both languages. Learners wererequired to complete a longer Home Language word reading task at midline (18 words), with the first sixwordstothislistbeingexactlythesamewordsthatwereusedatbaseline.Duringboththebaselineandmidlineadministrationof thissubtask, learnerswere timed forone minute per word list and errors were recorded and subtractedfromthetotalnumberofwordsattempted.
Learners are not expected to be able to read wordsat the start of Grade 1 and therefore the severe flooreffectsonthisitematbaselineisnotsurprising.AttheendofGrade1,learnersarehoweverexpectedtobeabletoreadbasicdecodablewords.Themidlineresultsshowthatlearnersonaveragereadfivewordscorrectly.This
The Second Early Grade Reading Study30

isslightlylowerthanexpected,relativetotheSetswanareaders in EGRS I at the end of Grade 1 who on average readsevenwordscorrectly(Tayloretal.,2017).
Figure 8 shows the percentage of learners who could not read a single word correctly at the start and end of Grade 1, disaggregated by intervention group. Thepercentage of learners who did not read any words correctly decreased by the end of Grade 1, but is stillquite high with around half of the Grade 1 sample of learners still not able to read a single word correctlyin their Home Language by the end of Grade 1. Theintervention disaggregation further shows that there arenosignificantdifferencesbetween thecontrolandintervention groups when doing a descriptive mean comparison.However, the control grouphada slightlylower proportion of learners who could not read any words correctly.
Subtask 3: English Phoneme IsolationA Home Language phonological awareness task wasadministeredatthestartofGrade1.Aftertwoexamples,learners were asked to identify the first phoneme oftwo-syllable real words (for example, what is the firstsound of gogo – grandmother?). These words are similar in structure and meaning in isiZulu and Siswati.
At the end of Grade 1 learners were administered phoneme identification tasks where they were askedtoidentifythefirst,lastormiddlesoundofCVCEnglishwords (e.g. cat). Three words were presented per condition. In order to reduce the cognitive load learners were given bottle tops. For each subtask, learnerswere presented with two examples, using the bottletops to represent soundsat the start, endandmiddleof theword. Corrective feedbackwas provided in theexamples,butnotwhenthelearnerhadtocompletethenon-exampletasks.
At thestartofGrade1, learners identified1.1phonemeisolationtasks,whereas learnersat theendofGrade1could identify 3.6 of the nine phoneme isolation sounds at the end of Grade 1. It is concerning that learners belowthe50th percentile could not perform any of the English phoneme identification tasks correctly by theend of Grade 1. A further concern is that the control group learners performed slightly better than bothof the intervention groups, with the difference beingstatistically significant between the control and thevirtual-coaching group.
Subtask 4: English Letter RecognitionA letter sound knowledge task was administeredto learners at both the start and end of Grade 1 toassess their automatic knowledge of letter soundcorrespondences.AtthestartofGrade1,learnerswereasked to provide the isiZulu or Siswati (depending ontheir Home Language) letter sound for amaximum of20 letterspresented inachart.At theendofGrade 1,learners were required to provide English letter sounds for maximum 80 letters presented in a chart. SomeEnglish letters which are not pronounced the same as in the Home Language (such as ‘c’ pronounced [k]inEnglishbutasavoicelessdentalclick in isiZuluandSiswati) were included, but were arranged to appearlaterintheletterlist.Forthemostpart,theEnglishandHome Language letter sounds are pronounced the same. Letters which sounded different in English comparedto isiZulu and Siswati were only included 17th,23rd,28th,34th and 58th in the chart. Learners were timed for one minuteanderrorswere recordedandsubtracted fromthetotalnumberoflettersattempted.Learners’scoresare reported as letters correct per minute.
Learners could recognise more letter sounds correctly on average moving from a mean of seven letter sounds correct at the start of Grade 1 to 16.7 letter sounds correct by the end of Grade 1. However,learners at the 10th percentile were still unable toidentify a letter correctly at the end of Grade 1. Figure 10 shows the distribution of the number of lettersounds read correctly by the intervention group.
Once again it is evident that the control group learners performedmarginallybetterthanboththeinterventiongrouplearnersinthistask.
Comparing learner performance on the letter recognition between the North West and Mpumalanga samples,it is evident that the Mpumalanga sample of learners performedbetteratthestartofGrade1,butthattheywereperformingworsethantheNorthWestsamplebythe end of Grade 1. This is the case for learner
performance in both the control and interventionschools,whichcouldthereforereflecttheinstructionalpractices in each province or the effect of learningthemore transparentSetswana language.With regardto the effect of on-site coaching between the twosamples, there was a statistically significant positivedifferencebetweenthelearnerperformanceintheon-sitecoachingschoolsandthecontrolschools inNorthWest, but that this was not the case in Mpumalanga.
Year 1 Report: Learner performance after one year of implementation 31

0
1
2
3
4
5
Control On-site coach Virtual coach
Ave
rage
nu
mbe
r co
rrec
t
Figure 7: HL vocabulary
0
0.1
0.2
0.3
0.4
0.5
0.6
0.7
0.8
0.9
1
Control On-site Coach Virtual Coach
Baseline Midline
Figure 8: Percentage of learners who could not read a single word correctly
The Second Early Grade Reading Study32

0%
10%
20%
30%
40%
50%
60%
70%
80%
90%
100%
/T/ap /P/et /M/at Be/ll/ Su/n/ Loo/k/ B/e/d R/u/n B/oo/k
First Sound Last Sound Middle Sound Overall
Control On-site Coach Virtual Coach
Figure 9: Phoneme isolation – percentage correct by intervention group
0 20 40 60 80
Letters Correct
Control On-site CoachVirtual Coach
Figure 10: Distribution of letters read correctly by intervention group
Year 1 Report: Learner performance after one year of implementation 33

Subtask 5: English Word RecognitionLearners completed two English word reading lists timed for 30 seconds each. One list contained CVC regularly spelled nouns and one list contained high-frequency wordsfromtheDolchsightwordlist(Dolch,1936).Thenumber of words read correctly in each English wordreading task were added to give a words correct perminute score.
On average learners could read 4.9 of the decodablewordsand5.1of thesightwordsperminutecorrectly,with there being no statistically significant differencebetween the two types of words. No statisticallysignificantdifferencewasobservedbetweenthecontroland intervention groups.
Interestingly, comparing these results to subtask 2(Home Language word recognition), it is evident thatthere is also no statistically significant differencebetween learners’ ability to readHome Language andEnglish words. That Home Language and English word readingfluencyaredevelopingalmostinparallelratherthan Home Language reading far surpassing English reading could indicate that learners have not automated theirlettersoundcorrespondenceknowledgeneededtoautomatically decode the very transparent isiZulu and Siswati words. Measures of text reading fluency werenotincluded.Nevertheless,with50%oflearnersreadinglessthantwowordsinaminute,itcanbeexpectedthatlearners would be very slow text readers, and wouldlikelynotbeabletounderstandwhattheyread.
Subtask 6: English ListeningAt midline, learners’ knowledge of basic Englishinstructions was assessed using a custom-made instructionstask.ThistaskrequiredlearnerstoperformanumberofEnglishinstructionssuchas‘pleasestandup’. This task has not been used in EGRAs before butwas specifically designed to evaluate basic Englishcomprehension.
Figure 11 shows the percentage of learners in each of the control and intervention groups which managed to respond correctly to the English instructions given them. Overall, it is clear that there was a significantdifferencebetweenthecontrolandinterventiongroups,but that therewere no clear differences between thetwo intervention groups. On average, learners in the
control group managed to respond correctly to 2.6 out ofthefiveEnglishinstructions,whereaslearnersintheintervention groups responded correctly to three out of thefiveinstructions.
Subtasks 7–9: English Listening Comprehension, Vocabulary and SpellingA further three small subtasks were included in themidline assessment to evaluate various aspects of learners’ English oral and writing proficiency. Thesesubtasks included English listening comprehension,EnglishexpressivevocabularyandEnglishspelling.Forallthreetasks,instructionsandexamplesweregiveninthelearners’HomeLanguagetoensurethatwecanbeconfident that the learnerunderstoodthe ‘rulesof thegame’.
A short English vocabulary task which assessed farmanimal knowledge was developed for the baselineand midline assessment. To assess learners’ English receptivevocabulary,learnerswereshownapictureoffarmanimalsandasked:‘WhatdowecallthisanimalinEnglish?’(twoitems).Furthermore,anEnglishlisteningcomprehension taskwasadministeredusing thesamestory that was used during the Home Language listening comprehension that was administered at the start of Grade 1. The enumerator read a short paragraph twice withexpressionaboutagirlplayingintherain.Learnerswere then asked three inferential questions about thestory.At theendofGrade 1, anEnglishversionof thesame paragraph was used for the English listening comprehension.Finally, learnerswereshownapictureof a dog,tolditwasadoginEnglishandwereaskedtowrite the word dog on a piece of paper. Learners were givenamaximumoftwominutestocompletethistask.
Figure 12 shows the learner performance on each of these tasks, disaggregated by intervention group.Learners performed moderately on the English receptive vocabularytasks,with learners inthetwo interventiongroupsperformingsignificantlybetterthanthelearnersin the control schools. The average performance on the listeningcomprehensionandthespellingtaskwasverypoor,withlearnersintheinterventiongroupsonlydoingmarginallybetterthanthecontrolgrouplearnersonthefirstlisteningcomprehensionquestion.
The Second Early Grade Reading Study34

0
0.1
0.2
0.3
0.4
0.5
0.6
0.7
0.8
0.9
1
Close your eyes Stand up Put your hands in theair
Turn around Sit down and put yourhands on the table
Control On-site coaching Virtual coaching
Figure 11: Pecentage of learners correctly responding to each English instruction
Table 13: Comparing letter sound recognition between Mpumalanga and North West
Start of Grade 1
(s.e.) End of Grade 1 (s.e.)
EGRS I Control 5.40 (0.28) 22.70 (0.60)
On-site coaching 5.80 (0.29) 25.10 (0.72)
EGRS II Control 6.98 (0.01) 17.67 (0.19)
On-site coaching 6.78 (0.01) 16.72 (0.25)
Virtual coaching 7.02 (0.01) 15.06 (0.25)
Year 1 Report: Learner performance after one year of implementation 35

Figure 12: Percentage correct on English Listening Comprehension and Vocabulary
0
0.1
0.2
0.3
0.4
0.5
0.6
0.7
0.8
0.9
1
Cow Pig Where did
they go?
Why did they
take their
shoes andsocks off?
When did theyplay in the
mud?
Dog
Vocabulary Listening comprehension Spelling
Control On-site coaching Virtual coaching
5�3 Main Results
Thefirstmajorfindingsofthestudyrelatetotherelativeperformance of the three groups on the midline learner assessment.AcombinedtestscorewasderivedusingPrincipal Component Analysis to do a simple mean comparison of the average learner performance. The index score was standardised relative to thecontrol group, with the control group having a meanof zero and a standard deviation of 1. Table 14 showsthe mean performance of each of the control and intervention groups on both the baseline and midlinelearner assessment. From a descriptive perspective,there is no significant difference between the controland intervention groups. Although not statistically significant, the virtual coaching group had a slightadvantage over the other two groups at baseline, butthat this advantage was not evident at midline.
Giventhenatureoflearningasecondlanguage,theratioof English to Home Language items increases with each waveofdatacollection.Wethereforecontrolseparately
foreachdomainofreadingproficiency:vocabulary,letterrecognition,phonological awareness,word recognitionandEnglish oral proficiency. Table 15 shows themeanscores for each of the intervention groups on each of the reading domains, as well as whether the meanscores are statistically significant between the controlandinterventiongroups.Thissignificanceisindicatedbythethreestarsnexttothemeanscore.
Thistablesuggeststhatatadescriptivelevel,boththeintervention 1 and intervention 2 learners performed slightly worse than the control group learners on the reading of Home Language words. It further suggests that the intervention 2 learners also performed slightly worse than the control group learners on the phonemic awarenesstaskandthe letterrecognitiontasks.HomeLanguagewordreading,phonemicawarenessandletterrecognition are all skills which are developed mainlythrough the teaching of Home Language. The slightly worse performance may be indicative of potentialcrowding-outeffectsoftheinterventionontheteachingofHomeLanguage.Thiswillbeexploredfurther intheanalysis.
The Second Early Grade Reading Study36

Table 14: Mean comparison of index scores
Baseline (s.e.) Midline (s.e.)
Control 0.00 (0.03) 0.00 (0.03)
On-site coaching -0.03 (0.03) -0.02 (0.04)
Virtual coaching 0.10 (0.03) -0.07 (0.03)
Table 15: Subtask mean comparison scores, by intervention group
Control Intervention 1 Intervention 2
N = 1 459 N = 924 N = 944
Mean (s�e�) Mean (s�e�) Mean (s�e�)
HL Expressive Vocab (/5) 4.9 (0.01) 4.9 (0.01) 4.9 (0.01)
HL Word Recognition (/18) 5.6 (0.19) 4.6 *** (0.23) 4.7 *** (0.22)
EFAL Phonemic Awareness (/9) 3.8 (0.09) 3.6 (0.11) 3.4 *** (0.11)
EFAL Letters Recognition (/80) 17.6 (0.46) 16.7 (0.64) 15.1 *** (0.53)
EFAL Word Recognition (/36) 5.2 (0.20) 5.2 (0.27) 4.6 (0.24)
EFAL Listening (/5) 2.7 (0.04) 3.2 *** (0.04) 3.1 *** (0.04)
EFAL Comprehension (/3) 0.2 (0.01) 0.3 *** (0.02) 0.2 (0.02)
EFAL Vocabulary (/2) 0.5 (0.02) 0.9 *** (0.03) 1.0 *** (0.03)
EFAL Writing (/1) 0.2 (0.01) 0.2 (0.01) 0.2 (0.01)
English Oral Proficiency 3.1 (0.06) 3.8 *** (0.08) 4.0 *** (0.07)
Note:***indicatesasignificantdifferencebetweenthemeanscoreofthecontrolandspecificinterventiongroup
Table 16: Main regression
(1) (2) (3) (4) (5) (6) (7) (8) (9) (10)
HL Vocab HL Word Recog-nition
Phonemic Aware-
ness
ESL Letter
Sounds
ESL Word Recog-nition
ESL Listening
ESL Compre-hension
ESL Vocab ESL Writing
English Oral Pro-ficiency
On-site
coach
-0.129** -0.133 -0.072 -0.049 0.030 0.365*** 0.204*** 0.526*** -0.011 0.529***
(0.054) (0.085) (0.091) (0.087) (0.079) (0.082) (0.075) (0.071) (0.075) (0.083)
Virtual
coach
0.014 -0.162* -0.171* -0.180** -0.104 0.288*** 0.105 0.547*** -0.083 0.456***
(0.056) (0.083) (0.094) (0.077) (0.069) (0.083) (0.065) (0.073) (0.067) (0.084)
Obs 3 067 3 066 3 066 3 068 3 062 3 062 3 062 3 060 3 056 3 060
R2 0.023 0.140 0.130 0.138 0.106 0.148 0.059 0.205 0.113 0.218
p-value 0.0191 0.742 0.328 0.122 0.100 0.383 0.236 0.780 0.303 0.434
Note:Eachoutcomevariableisstandardisedtoameanofzeroandastandarddeviationofone.Learnergender,baselinescore,learnerage,learnerHomeLanguage,districtandstratificationdummiescontrolledfor.Standarderrorsareclusteredatschoollevel.*forp<.1;**forp<.05;***forp<.01
Year 1 Report: Learner performance after one year of implementation 37

Totakeintoaccountthestratificationvariables,separateregressions were run on each subtest. For the sakeof comparability, the scores were standardised to amean of zero and a standard deviation of 1. The skillsincolumns1and2inTable16relatetoHomeLanguageproficiencyanddecoding,theskillsincolumns3,4and5 relate toEnglishdecoding, the skills in columns6, 7and8indicateEnglishorallanguageproficiency,column9referstoEnglishspellingand,finally,column10isanaggregatescore.
The coefficients for both intervention groups arenegativeforHomeLanguagewordrecognition,EnglishphonemicawarenessandEnglishletterrecognition,butareonlystatisticallysignificantforthevirtualcoachinggroup.Giventhatthelearnerswouldhavebeentaughtdecoding skills in their Home Language, and that theskill of decoding is considered transferable betweenthe languages, this further confirms the possibilityof a crowding-out effect to the teachingof theHomeLanguage. In future rounds of data collection, this issomething which will be evaluated rigorously. If theproblempersists, itwillwarrantstrongerclaimsof theconsequences of the crowding-out.
Nevertheless,weseefromcolumns6,7and8thatbothinterventions seem to have had an equally large positive impact on the various English language proficiencyskills.TheCurriculumandAssessmentPolicyStatement(CAPS)specifiesthatamaximumofthreehoursperweekbe given to the teaching of English (as the additionallanguage)inGrade1,withamaximumofoneandahalfhoursforlisteningandspeaking,oneandaquarterhoursforreadingandphonics,and15minutesforwriting.Thescope of learning in the curriculum for Grade 1 English learning is oral language development, with readingandphonicsbeingaddressedthroughmethodssuchasSharedReading, listening tostories,and totalphysicalresponse. All three of these practices essentially focus onreceptivelanguageproficiency,andtoalesserextentonexpressivelanguagedevelopmentpractices.
ForthethreesubtasksthatfocusonEnglishorallanguagedevelopment – English listening (following instructions with actions), English listening comprehension, andEnglishvocabulary– the learners in the twocoachinginterventions did significantly better than theircounterparts in the control schools. On the higher-order skill subtasks that assess learners’ comprehension inEnglish,learnersintheinterventionclassroomsdidonlymarginally better than learners in the control schools,which suggests that while vocabulary development isstrongerasaresultoftheinterventions,thishasnotyet
8 Thepre-analysisplanwasregisteredontheAmericanEconomicAssociationsRCTregistryon26September2017.
translatedintostrongercomprehensionskills.Thatsaid,iforalvocabularydevelopmentinthesecondlanguageisadevelopmentalbuildingblockforreadingacquisition,then the interventionsmaybeworking to improve thebasicskillstargetedintheGrade1curriculum,buttheyarenotyetimpactingthehigher-orderskills.
5�4 InterventionEffectsonSubgroups of Interest
Understandingthedifferentialeffectoftheinterventionsonvarioussubgroupsisimportantfromapolicy-makingperspective, although we recognise the risks of themultiple comparison problem. This problem stemsfrom an increased probability of finding at least onestatistically significant result, related to the increasednumber of subgroups analysed. Nevertheless, we arealso aware that it is necessary to have a comprehensive understanding of the effect of an intervention on adifferentgroupoflearnersandschools.Topreservetheintegrity of the research study, we pre-specified thetheory underlying our decision to investigate various subgroups in our pre-analysis plan.8 Furthermore, weare also cautious in interpreting any heterogeneous effectsatthispoint;however,wewillbemoreconfidentin our interpretation should these effects persist infuture waves of data collection.
Anotherchoicewhichstraddlesthefinebalancebetweenunderstandingthedynamicsoftheinterventions,whileheeding the multiple comparisons problem, relates tothe outcome indicator which will be used to evaluatetheheterogeneouseffects.GiventhattheinterventionstargetedtheteachingofEFAL,anargumentcanbemadetoonlyconsidertheEFALitems.AsimilarargumentcanbemadetoonlyincludetheEFALorallanguageproficiencyitems,sincetheEFALGrade1curriculumonlyfocuseson oral language proficiency. Since the main resultssuggest that the interventions have impacted learners’ Englishorallanguageproficiency,anindexincludingthethreesubtaskswillbeusedat theoutcomevariable intesting for heterogeneous effects. Caution thereforeneeds to be taken not to over-interpret these resultsandtheresultswillinnowayberegardedasdefinitive.Thesolepurposeof theseheterogeneouseffects is toinformfurtherresearchquestionnairedesign,aswellasfocusqualitativeresearcheffortstofurtherunderstandthe full impact of the interventions.
At the learner level, we expect two opposingheterogeneous intervention impacts based onmidline
The Second Early Grade Reading Study38

learner reading proficiency. The scripted lesson plansrequirestreamingbyabilitywithinthesameclassroom,which provides opportunities for individualised attention. Itisthereforeexpectedthattheinterventionswillbenefitlearnerswhohaveotherwisebeenleftbehind.However,atthesametime,thescriptedlessonplansarealignedtothenationalcurriculum,whichprescribesanambitiouspaceintheSouthAfricancontext.Theworst-performinglearnersmightactuallybenefitlessiftheteacherswhofollow the scripted lesson plans now progress at too fast a pace. Furthermore, boys or girls might benefitmore or less from the individualised attention. Finally,the emphasis on individualised attention and trackingmeans that learners might benefit more from thescripted lessonplanswhentheclasssize is large,andtheworse-performinglearners,inparticular,willbenefitmore.
Giventheseexpectations,heterogeneouseffectswerefirst investigated for learner gender and learner age(to see whether under- or overage learners benefitedmore or less). No heterogeneous effectswere evidentfor learnergenderor learnerage,whichsuggests thatnoneofthesegroupswasdifferentiallyimpactedbytheinterventions.
Thenext considerationwaswhether the interventionsimpacted stronger or weaker learners differently.Althoughthe interventionsaredesignedtospecificallysupport the no-fee-paying schools, it is recognised
that there is still a large variance in learner performance in these schools. If the impact of the interventions is greateramongtheweakerlearners,theseinterventionscanbeconsideredasequity-enhancing.Nodifferentialeffectbasedonbaselineperformancewasfoundforthevirtualcoachingintervention,buttheon-sitecoachingintervention seems to have benefitted learners whohad a higher baseline performance score marginallymore (Table 17). As a sensitivity check, these modelswerealso runby includingvariablesbasedonparentsreporting their own English proficiency, aswell as thefrequency of speaking English at home. The inclusionofthesevariablesdidnothaveamarkedeffectonthecoefficientsoftheinteractionvariables.
Figure 13 assists us to better understand which partof the baseline performance distribution benefittedthe most from the on-site coaching intervention. To construct thegraph, thesamplewasdivided into foursubsamples, based on the performance distributionofbaselinescores.Separate re-gressionswere runoneachof the four subsamplesandFigure 13 shows theinterventioncoefficient ineachof the regressions run.This figure firstly shows that learners from all partsof the performance distribution did benefit from theon-site coaching, but that the top 50% of learnersbenefittedmarginallymorethanthebottom50%oftheperformancedistribution.
Although the interventions are designed to specifically support the no-fee-paying schools, it is recognised that there is still a large variance in learner performance in these schools
Year 1 Report: Learner performance after one year of implementation 39

Table 17: Heterogeneous effects – baseline performance
(1) (2)
EnglishOralProficiency EnglishOralProficiency
On-site coach 0.529*** 0.531***
(0.083) (0.083)
Virtual coach 0.456*** 0.454***
(0.084) (0.083)
Baseline score 0.390*** 0.325***
(0.022) (0.030)
BL score x T1 0.151***
(0.051)
BL score x T2 0.080
(0.049)
Observations 3 060 3 060
R-squared 0.218 0.221
p-value 0.434 0.414
Note:Learnergender,learnerage,learnerHomeLanguage,districtandstratificationdummiescontrolledfor.Standarderrorsare clustered at school level. *forp<.1;**forp<.05;***forp<.01
Figure 13: Differential impact based on baseline performance
.43
.41
.55
.72
.2 .4 .6 .8 1
Quartile 1 Quartile 2 Quartile 3 Quartile 4
The Second Early Grade Reading Study40

Asdiscussedearlier,aClassroomObservationStudywasconductedonasubsampleof60schoolsparticipatingin the EGRS II study to provide a more qualitative perspective on the intermediate outcomes of the two interventions. In addition to the lesson observations,aneducationspecialistdidsixCaseStudiesinafurthersubsample of schools, to provide an educationalist’sperspective of the difference between the schoolsin the intervention and the comparison schools. The research design, process and results are reported inmorecomprehensivereportsseparatetothisreport.Wewill,however,shortlydiscussthemainfindingsofthesestudies here.
To ensure integrity in the reporting of the classroom observationresults,differencesininstructionalpracticesare only reported if observed in both the ClassroomObservation Study and the Case Studies. Three maindifferences were observed between the interventionand the control classrooms, namely the frequency ofEnglishusagebybothlearnersandteachers,systematicteaching of oral language proficiency in English usingextended texts and more efficient use of time, whichallows for greater learner exposure to the Englishcurriculum.
Given the South African context of teachers who arenotalwaysconfidentEnglishspeakersbeingresponsibleforteachinglearnersEnglish,onepotentiallyimportantachievement was the increased use of English during the teaching of the English lesson. The observationsin the control classrooms attest to the English lesson being taught in the Home Language, with limiteduse of English during these lessons. It is evident from Figure 14 that learners and teachers in the intervention classroomsweremore likely touseEnglishduring theEnglishlessonandtheteacherswerealsolesslikelytomakeuseofcode-switching.
SharedReadingformsasubstantialpartoftheGrade1EFAL curriculum and is instrumental in teaching learners
English oral proficiency. A wide array of instructionalpractices should be employed in the Shared Readinglessons to enable the more effective learning of newvocabulary (see Figure 15). Although teachers in thecontrolschools,onaverage,introducedmorevocabularywords on a given day, these words were often onlyrepeated, without any emphasis on the meaning. Bycontrast, the intervention schools’ teachers used thenew vocabulary words in the context of a sentence,soastopromoteunderstanding.DifferenceswerealsoseenintheSharedReadingpractices,with90%oftheintervention 2 teachers and 76% of the intervention1 teachers having used extended texts during theirlessons. Of the teachers that made use of extendedtexts, fewer intervention 1 teachers were observedusingchorusing.Thisfindingsuggeststhatintervention1 teachersmayhavemadesubstantialprogress in theuse of the methodology.
In addition to reading aloud, Shared Reading shouldinvolve teachers asking learners questions about thestory, so as to build learners’ English oral languageproficiency and increase their receptive Englishvocabulary. Intervention 2 teachers were more likelyto ask their learners comprehension questions basedon the story as compared to either intervention 1 or control teachers. Further differences in groups aroseingettinglearnerstoretell,actoutordrawinresponsetothestory,wheremore intervention2teachers(67%)than control (33%) or intervention 1 (44%) teachersgot learners involvedinretelling,actingoutordrawingresponses to stories. The interventions therefore seem to be expanding the teachers’ pedagogic repertoires,throughsystematicteachingofEnglishvocabularyandEnglish language proficiency. The greater exposure tovocabulary development and language developmentthrough theSharedReadingof extended texts shouldtherefore lead to learners having a stronger command of the English language.
6 Changes in Instructional Practices
Year 1 Report: Learner performance after one year of implementation 41

Figure 14: Frequency of English used in the classroom
0 0.2 0.4 0.6 0.8 1 1.2
Teacher uses English to give simpleinstructions
Minimal or no code-switching
Teacher uses mostly English in class
Learners use mostly English in class
Virtual coaching On-site coaching Control
Figure 15: Instructional practices in Shared Reading
0 0.1 0.2 0.3 0.4 0.5 0.6 0.7 0.8 0.9 1
Learners retell/act/draw story
Teacher identifies front cover
Teacher identifies title
Learners can see texts
Learners answer first in HL, then in English
Learners respond to pictures
Learners answer oral comprehension questions
Intonation and expression used
Gestures/real objects used
Extended texts are read
Virtual coaching On-site coaching Control
The Second Early Grade Reading Study42

ItiswellrecognisedthatFoundationPhaseteacherslackongoing instructional support in South Africa. The 2011 School Monitoring Survey indicated that Foundation Phase teachers received less monitoring and support fromtheschoolprincipal,theSMTandthegovernancestructures than their secondary school counterparts (Wills,2016).Only45%ofthe4 128teachersinterviewedinthesurveyindicatedthattheyhadbeenvisitedduringtheyearbyadistrictofficial responsibleforcurriculumadvice(Wills,2016).Inthedistrictsthatareparticipatingin theEGRS II study, the curriculumadviser-to-schoolratio is around 130 schools per adviser. This means that teachers,onaverage,receiveavisitfromthecurriculumadvisers once every two years. Heads of department (HODs) inschoolsare further responsible forprovidinginstructional support to teachers. However, a recentevaluation of implementation of the curriculum found that the fact that HODs have full teaching loads and the fact that inappropriate promotion practices are followed when appointing HODs often means that HODs do not have the capacity or the ability to provide effectivesupporttoteachers(DPME,2017).
The presence of the individualised support provided through both the on-site coaches and the virtualcoach in theEGRS II study thereforefillsacriticalgapin providing instructional support. The coaches promote the development of professional accountability in an
environment of trust, where the coach monitors andevaluates the teachers’ teaching practices in order to encourage more productive teaching practices. The coach-to-school ratio for the on-site coaches is designed toalloweachteachertobevisitedbyacoachat leastthree times a term.Moreover, by removing the barrierof needing to be physically present in the classroom,the virtual coach communicates with teachers on a weeklybasis.Figure16suggeststhatteachers inbothintervention groups are much more likely than thecontrol group to have contact with a coach or mentor regardingtheirEnglishteachingpractices,with42%ofcontrol group teachers indicating that they never meet with a coach or mentor regarding their English teaching. Whenaskedhowoftenteachersmeetwiththeirheadsofdepartment(HODs)regardingtheirEnglishteaching,teachers from both intervention groups reportedmeeting with their HODs more regularly. Of intervention 1teachers,66%reportedmeetingwiththeHODsatleastonceaweek,asdid63%ofintervention2teachers,whileonly 50% of control group teachers reportedmeetingtheir HOD weekly. This indicates that coaching is notonly providing more instructional support to teachers directly, through their presence, but also indirectly,through encouraging the HODs to support teachers more regularly.
Figure 16: Instructional support
Never Less than twice a year Once a term Once a month Once a week or more
0%
20%
40%
60%
80%
100%
Control Intervention 1 Intervention 2
Frequency of meeting with coach
0%
20%
40%
60%
80%
100%
Control Intervention 1 Intervention 2
Frequency of meeting with HOD
Year 1 Report: Learner performance after one year of implementation 43

7�1 Switching Schools
Duringthefirsttermofimplementingtheinterventionsin2017,twoissuesemergedwhichmayaffectthesamplebalance. Firstly, one school had to be dropped fromintervention 2 due to trouble caused by the principal.Secondly, in inviting the schools to the initial teachertraining, confusion arose regarding two schools withthe same name. This meant that the incorrect school attended the teacher training.
With regard to the first issue, the PMT decided to stillinclude the school in the data collection for the ensuing waves of data collection, but that the school will beconsidered as a non-compliant school. With regard tothesecondissue,themistakewasonlyrecognisedlaterin the study after implementationwaswell underway,and it was therefore decided to continue with the implementationashasbeendoneforthefirstpartoftheyear.ThePMTdeterminedthatthemix-upwasmerelyanadministrativemistakeandthereforestillconsideredthe school allocation to be random. The concern,however,lieswiththeimpactthatthiswillhaveonfuture
9 Thestratumallocationofthetwoschoolswasalsoswoppedaround.Thisdecisionessentiallymakestheassumptionthattheallocationoftheseschoolstotheirnewinterventionstatuswasrandom,andcouldhavebeenbasedonthestratumtheywereallocatedto.Thisensuresthatthestrata also remain equally sized.
analysis.Bothschoolsare intheGertSibandeDistrict,both schools are Quintile 1 schools and both schoolswereclassifiedas lowperformersfor thestratification.The original school was in stratum 6 (large Quintile 1schools who have weaker performers), whereas thenew intervention school is in stratum 2 (medium-sized schoolsfromallquintileswhohaveweakerperformers).
Sensitivity analyses will be conducted in all futurereports to gauge the effect that this new allocationhas on the final results. Table 18 shows the balancetestresultsonthebaselinedata,oncetheinterventionstatus of the two schools was swopped.9 It is evident that thischangedoesnotaffectthebalanceofthesamplesignificantly,with only aminor additional imbalance inthe visual perception task. This difference, however,doesnotinfluencetheoverallbalanceofthesample.Afurthertestwasdonebydroppingbothschoolsfromthesample,butthisdidnothaveanysignificantdifferencein the sample balance. As a further check, the mainresults at the end of Grade 1was runwhile excludingthe two schools that were switched. This did not cause a significantchangeintheresults.
Table 18: Robustness check – reallocating intervention status
Naming Animals
Word Recall
Non-word
Recall
Phoneme Isolation
Compre-hension
Letter Sounds
Words Correct
Sentence Reading
Visual Perception
English Vocab
Paper-based
0.15 -0.01 -0.02 -0.06 -0.01 -0.19 -0.06 -0.03* 0.20* -0.02
(0.154) (0.118) (0.068) (0.12) (0.064) (0.486) (0.137) (0.016) (0.12) (0.067)
Tablet-based
0.39*** 0.12 0.03 0.04 0.1 0.06 0.13 -0.02 0.21 0.01
(0.149) (0.118) (0.095) (0.13) (0.063) (0.477) (0.164) (0.016) (0.125) (0.057)
Control mean
7.155 9.981 4.208 1.129 2.179 4.652 0.387 0.051 1.46 0.836
N 3 327 3 327 3 327 3 327 3 327 3 327 3 327 3 327 3 327 3 327
Paper =Tablet: p-value
0.154 0.259 0.557 0.448 0.101 0.649 0.26 0.507 0.965 0.594
7 Sensitivity Checks/
The Second Early Grade Reading Study44

7�2 Multi-grade and Attrition
As noted under section 5.1., the attrition rate ofintervention 2 learners was slightly higher than in the controlofintervention1group.Althoughthedifferencebetween the groups was not statistically significant,amodelwas run including inverse probabilityweightsto see whether this may influence the interventioncoefficients.
Another check involves determining whether theinclusion ofmulti-grade schoolsmay be affecting theresults.Thedailylessonplansarespecificallydesignedto follow the Grade 1 curriculum and are therefore not appropriate formulti-gradesettings.Althoughspecificcarewastakentoexcludemulti-gradeschoolsfromthesample,therewerestillsometeacherswhorespondedthat they were teaching a multi-grade school in 2017. Table 19 shows that neither of these issues had anysignificanteffectontheinterventioneffectsinthemainresults.
7�3 Improvements due to Increased Time Teaching EFAL
As discussed earlier, the CAPS curriculum providesteachers with the choice of teaching EFAL for two or three hours aweek. The lesson plans used in EGRS IIarebasedonamaximumtime(threehours)allocation.OnesensitivitycheckisthereforetodeterminewhethertheimprovementsintheEnglishoralreadingproficiencyitems are due to improved teaching practices as a result oftheinterventions,ormerelybecauseoftheincreasein time spent on teaching EFAL.
The concern in trying to disentangle these mechanisms liesincontrollingforteacherselectioneffects.Theremaybesomeunobservablecharacteristicsthatleadcertainteachers to decide teaching the maximum English
time. These unobservable characteristics may alsobe correlated with learner performance and thereforeinfluencethecoefficientsofinterest.Todisentanglethetwomechanisms,wethereforeneedtocontrolfortheseunobservablecharacteristics.
In the baseline questionnaire, teachers were askedhow much time they plan to spend on teaching EFAL per week. Since the baseline questionnaire wasconducted before the schools received the training,there is no reason to expect that any teachers in theintervention groups would be systematically morelikely tohaveplanned to teach themaximumhoursofEFALcurriculum.Wecanthereforecomparethelearnerperformance in the intervention groups to the learner performance of control learners in classrooms where the teachers responded that they are planning to teach for three hours.
Figure 17 suggests that the teachers in the intervention groupsmayhavebeenmorelikelythantheteachersinthe control group to have planned to teach EFAL for three hours aweek. To test for this, a balance testwas runonthevariablewhichcapturestheamountoftimethatteachers plan to spend on teaching EFAL. The results from this test support the theory that the teachers in thedifferentgroupswerenotsystematicallymorelikelyto have planned to teach for three hours.
To determine whether the intervention effects are aresultoftheincreasedtimespentonteachingEFAL,thesample was restricted to only include learners that were in classrooms in which the teachers responded that theywereplanningtoteachEFALforthreehoursaweekin 2017. Table 20 shows that the intervention effectshave remained similar in size and significance despitethisrestriction,suggestingthattheeffectsarenotonlycausedbytheincreasedtimespentonteachingEFAL,butthattheinterventionitselfissuccessfulinimprovinglearning outcomes.
Intervention effects have remained similar in size and significance, suggesting…that the intervention itself is successful in improving learning outcomes.
Year 1 Report: Learner performance after one year of implementation 45

8%
7%
10%
32%
17%
23%
37%
52%
47%
23%
24%
20%
0% 20% 40% 60% 80% 100%
Control
On-site coaching
Virtual coaching
1 hour 2 hours 3 hours > 4 hours
Figure 17: Time spent teaching EFAL per week
Table 19: Sensitivity check – multi-grade and attrition
(1) (2) (3)
Main Multi-grade Attrition
On-site coach 0.529*** 0.501*** 0.558***
(0.083) (0.090) (0.086)
Virtual coach 0.456*** 0.440*** 0.451***
(0.084) (0.094) (0.084)
Observations 3 060 2 583 3 059
R-squared 0.218 0.208 0.232
p-value 0.434 0.434 0.434
Table 20: Restricting to only include learners in three-hours-a-week classes
(1) (2) (3) (5)
ESL Listening ESL Comprehension ESL Vocabulary EnglishOralProficiency
On-site coach 0.452*** 0.271** 0.609*** 0.641***
(0.109) (0.116) (0.097) (0.116)
Virtual coach 0.307** 0.039 0.591*** 0.454***
(0.120) (0.115) (0.104) (0.133)
Observations 1 214 1 214 1 212 1 212
R-squared 0.187 0.079 0.205 0.228
p-value 0.189 0.0531 0.874 0.179
The Second Early Grade Reading Study46

7�4 Crowding-out of Home Language Teaching Time
The increased time spent on teaching EFAL can also have a negative effect on the teaching of HomeLanguagethroughacrowding-outeffect.Thecrowding-outeffectcanworkthroughtwodifferentmechanisms;firstly,optingforteachingEFALforthreehoursaweekmeans teaching Home Language for seven hours a week instead of the eight hours under the minimumEFAL time option. The secondmechanism flows fromteachers’ receiving additional support in EFAL and for this reason also giving more attention to teaching EFAL thanHomeLanguage.Thismayparticularlybethecasewhen teachers have lost some teaching time and need todecidewhichsubjecttoprioritise.
Evaluating the first effect is very tricky, since it is notpossible to control for the unobservable teachercharacteristics that would have caused teachers to switchfromtheminimumtomaximumEFALtime.Thesecondmechanismiseasiertomeasure,sincewewould
liketodeterminewhetherthereareanynegativeeffectson the Home Language items, regardless of teachershaving planned to spend three hours teaching EFAL a week. That is, comparing the learner performance inthecontroland interventionschools toeachother, forlearners who are in classrooms where the teachers planned from the start to teach three hours of EFAL a week.Thesamplewasthereforeonceagainrestrictedto only include learners in classes of teachers who respondedthattheyspentthreehoursaweekteachingEFAL. The model was then run on the subtasks thatrelated to the skill which learners would have beentaught during their Home Language lessons. Table 21shows that while the coefficients on the interventionvariables are still negative, they are mostly no longersignificant.Thenegativecoefficientonthefirstsubtasksremainssignificant,butgiventheceilingeffectsinthesesubtasks,itismostprobablycausedbyadataanomaly.More concerning is the negative and significantcoefficientontheLetterSoundRecognitiontaskswhichseemstosuggestsomenegativespillovereffect.
Table 21: The effect of reduced Home Language teaching time
(1) (2) (3) (4) (5)
HL Vocabulary HL Word Recognition
Phonemic Awareness
Letter Sounds ESL Word Recognition
On-site coach -0.175** 0.004 -0.005 -0.005 0.052
(0.072) (0.125) (0.131) (0.123) (0.123)
Virtual coach -0.026 -0.151 -0.216 -0.307** -0.131
(0.076) (0.129) (0.136) (0.125) (0.127)
Observations 1 217 1 215 1 215 1 217 1 214
R-squared 0.040 0.162 0.186 0.190 0.121
p-value 0.126 0.239 0.0991 0.0313 0.182
Year 1 Report: Learner performance after one year of implementation 47
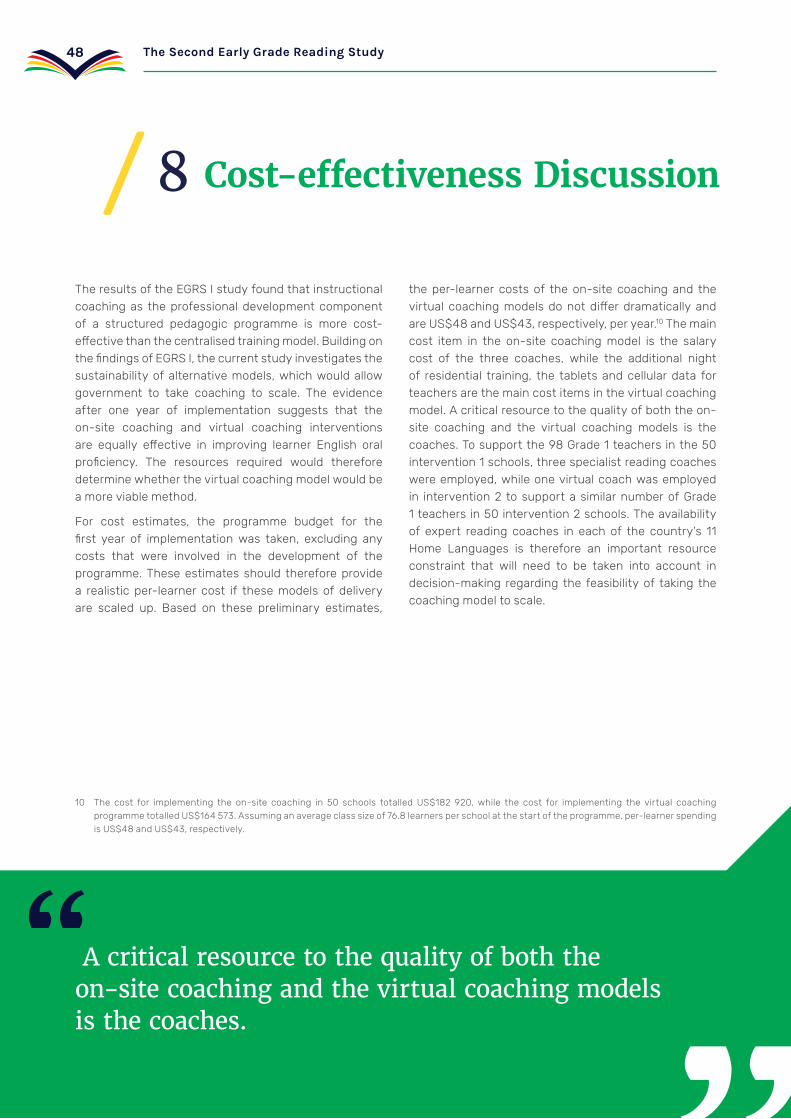
The results of the EGRS I study found that instructional coaching as the professional development component of a structured pedagogic programme is more cost-effectivethanthecentralisedtrainingmodel.BuildingonthefindingsofEGRSI,thecurrentstudyinvestigatesthesustainabilityofalternativemodels,whichwouldallowgovernment to take coaching to scale. The evidenceafter one year of implementation suggests that the on-site coaching and virtual coaching interventions are equally effective in improving learner English oralproficiency. The resources required would thereforedeterminewhetherthevirtualcoachingmodelwouldbeamoreviablemethod.
For cost estimates, the programme budget for thefirst year of implementation was taken, excluding anycosts that were involved in the development of the programme. These estimates should therefore provide a realistic per-learner cost if these models of delivery are scaled up. Based on these preliminary estimates,
10 The cost for implementing the on-site coaching in 50 schools totalled US$182 920, while the cost for implementing the virtual coachingprogrammetotalledUS$164 573.Assuminganaverageclasssizeof76.8learnersperschoolatthestartoftheprogramme,per-learnerspendingisUS$48andUS$43,respectively.
the per-learner costs of the on-site coaching and the virtual coachingmodelsdonotdifferdramatically andareUS$48andUS$43,respectively,peryear.10 The main cost item in the on-site coaching model is the salary cost of the three coaches, while the additional nightof residential training, the tablets andcellular data forteachers are the main cost items in the virtual coaching model.Acriticalresourcetothequalityofboththeon-site coaching and the virtual coaching models is the coaches. To support the 98 Grade 1 teachers in the 50 intervention1schools,threespecialistreadingcoacheswereemployed,whileonevirtualcoachwasemployedin intervention2 tosupporta similarnumberofGrade1teachersin50intervention2schools.Theavailabilityof expert reading coaches in each of the country’s 11Home Languages is therefore an important resource constraint that will need to be taken into account indecision-making regarding the feasibilityof taking thecoaching model to scale.
8 Cost-effectiveness Discussion/
A critical resource to the quality of both the on-site coaching and the virtual coaching models is the coaches.
The Second Early Grade Reading Study48

Table 22: Specific USAID indicators
FY October 2015 – September 2016
FY October 2016 – September 2017
Indicator no
Indicators Target Actual Male Female Target Actual Male Female
ES. 1-1 Proportion of learnerswho,bytheendoftwo grades of primaryschooling,demonstrate that they can read and understand the meaning of grade leveltext
0% 0% 0% 0% 0% 0% 0% 0%
ES.1-1a;b Percentage of learners
0% 0% 0% 0% 0% 0% 0% 0%
ES.1-1c;d Numerator 0 0 0 0 0 0 0 0
ES.1-1e;f Denominator 0 0 0 0 0 0 0 0
ES. 1-5 Numberoflearners reached in reading programmes at the primary level
0 0 0 0 7 000 7 600 4 114 3 486
ES. 1-7 Numberofprimaryschool educators who complete professional development activities on implementing evidence-basedreadinginstruction with USGassistance
0 0 0 0 212 188 0 188
ES. 1-11 Numberofprimaryschool classrooms that receive a complete set of essential reading instructional materialswithUSGassistance
0 0 0 0 212 188 0 188
9 USAID Indicators/
Year 1 Report: Learner performance after one year of implementation 49

Table 23: Custom USAID Indicators
FY October 2015 – September 2016
FY October 2016 – September 2017
Indicator no Indicators Target Actual Male Female Target Actual Male Female
2.1. Proportion of teachers that attended each compulsory training session
0 0 0 0 95% 94% 0% 100%
2.2. Numberofprincipalsor HODs that attended each training session
0 0 0 0 50 27 1 26
2.3. Numberteacherswhoattended needs-drivenworkshops
0 0 0 0 50 66 0 66
2.4. Averagenumberofinteractionsbetweenthe virtual coach and a teacher
0 0 0 0 1 per week
1 per week
0 93
2.5. Averagenumberof visits a teacher receives from a reading coach
0 0 0 0 1 per month
0.75 per month
0 93
2.6. Comparison of baselineandendlinescores
0 0 0 0 0 0 0 0
3.1. Numberoflearnerbackgroundquestionnaires completed,aswellasactual data
0 0 0 0 3 500 3 327 1 801 1 526
3.2. Numberofteacherquestionnaires completed,aswellasactual data
0 0 0 0 360 320 0 320
3.3. Numberofprincipalquestionnaires completed,aswellasactual data
0 0 0 0 180 180 98 82
4.1. Numberanddetailsofkeystakeholdersinvolved in planning
10 0 0 0 5 4 2 2
4.2. Numberanddetails of research dissemination sessions with provinces and schools
0 0 0 0 5 4 . .
4.3. Numberanddetailsofreports,journal articles and conferences
0 0 0 0 0 0 0 0
The Second Early Grade Reading Study50

Interventions continued throughout 2018, with theinitial training having been conducted with the Grade2 teachers in January 2018. Teachers further attended clusteredworkshoptrainingforonedayatthestartofeachterm,andthereadingcoachesprovidedcontinuingsupport throughout the year. The third round of data collection took place from 22 October to 9 November2018 and will provide the data necessary to determine the impact of the interventions after two years of
implementation. The interventions were set to continue to Grade 3 teachers in 2019 and the same learners will betestedattheendofGrade3in2019andagainattheGrade4in2020.InOctober2018asetofCaseStudieswas conducted to gain more detailed information on the aspects of the interventionwhichmay be driving thesuccess. Similarly, lesson observations in 60 schoolsand a further set of Case Studies were planned for 2019.
10 Next Steps in the Project/
Year 1 Report: Learner performance after one year of implementation 51

References
Coe,R.A.C.H.S.M.L.,2014.What makes great teaching? Review of the underpinning research, London: Sutton Trust.
Dolch,E.W.,1936.Abasicsightvocabulary.TheElementarySchoolJournal,36(6),pp.456-460.
DPME,2017.CAPS Implementation Evaluation, Pretoria:DepartmentofPlanning,MonitoringandEvaluation.
Fleisch,B.T.S.,Schoër,V.&Mabogoane,T.,2017.Failingtocatchupinreadinginthemiddleyears:ThefindingsoftheimpactevaluationoftheReadingCatch-UpProgrammeinSouthAfrica. International Journal of Educational Development, 53(1),p.36–47.
Hellman,L.,2012.GPLMSIntersenCatch-UpProgramme:AnalysisofResults,Memo.
Hoadley,U.,2012.Whatdoweknowabout teachingand learning inSouthAfricanprimaryschools?.Education as Change, 16(2),p.187–202.
Hoadley,U.,2016.A review of the research literature on teaching and learning in the Foundation Phase in South Africa, Stellenbosch:ResearchonSocioeconomicPolicy,DepartmentofEconomics,StellenboschUniversity.
Howie,S.etal.,2012.PIRLS 2011 South Afrcan Children’s reading literacy achievement: Summary Report, Pretoria: CentreforEvaluationandAssessment,UniversityofPretoria.
Matjila,D.&Pretorius,E.,2004.BilingualandBiliterate?AnexploratorystudyofGrade8readingskillsinSetswanaandEnglish. Per Linguam, 20(1),p.1-21.
McDonaldConnor,C.etal.,2009.TheISIClassroomObservationSystem:ExaminingtheLiteracyInstructionProvidedto Individual Students. Educational Researcher, 38(2),p.85–99.
Pianta,R.C.,LaParo,K.M.&Hamre,B.K.,2008.Classroom Assessment Scoring System: Manual K-3. Baltimore: Paul H.BrookesPublishing.
Taylor,N.,2007.Equity,efficiencyandthedevelopmentofSouthAfricanschools.In:T.Townsend,ed. International Handbook of School Effectiveness and Improvement. Springer International Handbooks on Education. Dordrecht: Springer.
Taylor,S.,Cilliers,J.,Prinsloo,C.,Fleisch,B.,Reddy,V.(2017)TheEarlyGradeReadingStudy:Impactevaluationaftertwo years of interventions. Technical Report.
WorldBank.2015. Conducting classroom observations: analyzing classrooms dynamics and instructional time – using the Stallings ‘classroom snapshot’ observation system: user guide (English).Washington,D.C.:WorldBankGroup.
The Second Early Grade Reading Study52

Tel: (021) 486 7000
Fax: (021) 461 8110
Call Centre: 0800 202 933
222 Struben Street, Pretoria, 0001
Private Bag X985, Pretoria, 0001
Private Bag X9035, Cape Town, 8000
www�education�gov�za
www�facebook�com/BasicEd
www�twitter�com/dbe_sa