a 25 year review of progress in the basic education sector
TRANSCRIPT

A 25 Year Review of progress in the basic
education sector
2019
Compiled by the Department of Basic Education:
Directorate: Research Coordination, Monitoring & Evaluation

i
Contents
List of Tables ................................................................................................................................. iii
List of Figures ................................................................................................................................ iii
Introduction ..................................................................................................................................... 1
Overview: Trends in educational outcomes .................................................................................... 2
Access to school .......................................................................................................................... 2
Efficiency in school progression ................................................................................................. 5
Quality of learning ...................................................................................................................... 7
Equity in educational outcomes ................................................................................................ 10
Equity in expenditure ................................................................................................................ 12
Output 1: Teacher development, supply and effective utilisation of teachers .............................. 13
1.1) Introduction/ Problem Statement ................................................................................... 13
1.2) Achievements and journey since 1994 ........................................................................... 14
1.4) Challenges and how to improve ........................................................................................ 19
Output 2: Improved quality teaching and learning, through provision of adequate, quality
infrastructure and LTSM............................................................................................................... 21
2.1) Problem statement ............................................................................................................. 21
2.2) Achievements and journey since 1994 .............................................................................. 22
Hard Infrastructure ................................................................................................................ 22
Soft Infrastructure ................................................................................................................. 29
Source: School Monitoring Survey 2017/2018......................................................................... 35
2.4) Becoming better as a state to overcome the challenges in infrastructure .......................... 36
Output 3: Improving assessment for learning to ensure quality and efficiency in academic
achievement .................................................................................................................................. 38
3.1) Problem statement ............................................................................................................. 38
3.2) Achievements and journey since 1994 .............................................................................. 39
3.4) Becoming better as a state to overcome the challenges in assessments ............................ 44
Output 4: Expanded access to ECD and improvement of the quality of Grade R, with support for
pre-Grade R provision................................................................................................................... 46
4.1 Introduction/ Problem Statement ........................................................................................ 46
4.2) Journey since 1994: Early Childhood Development Policy .............................................. 47
4.3) Achievement: Participation in Early Childhood Development (ECD) programmes and
Grade R ..................................................................................................................................... 48
4.4) Challenges: Quality of Service Provision .......................................................................... 49

ii
Output 5: Strengthening accountability and improving management at school, community and
district level ................................................................................................................................... 53
5.1) Introduction/ Problem Statement ....................................................................................... 53
5.2) Achievements and journey since 1994: ............................................................................. 54
5.3) Challenges and how to improve: ....................................................................................... 57
Output 6: Partnerships for educational reform and improved quality .......................................... 63
6.1) Problem statement ............................................................................................................. 63
6.2) Achievements and journey since 1994 .............................................................................. 63
6.3) Challenges and how to improve: ....................................................................................... 69
Bibliography ................................................................................................................................. 70

iii
List of Tables
Table 1: The percentage of primary and secondary schools combined where allocated teaching
posts were filled in terms of categories of compliance level by province .................................... 15
Table 2: Number and percentage of schools which complied with nationally determined
minimum physical infrastructure needs in 2011, by province ...................................................... 24 Table 3: Percentage of primary and secondary schools combined, by province, where certain
facilities were available, 2017....................................................................................................... 26 Table 4: Provision of school resources by percentage, 1996 ........................................................ 29
Table 3: Percentages for Essential Classroom Resources for South Africa in 2000 (SEACMEQ
II)................................................................................................................................................... 30 Table 5: DBE Partnerships funding in 2017/18 ............................................................................ 66
Table 6: NECT funding amounts and sources, 2014-2018 ........................................................... 67
List of Figures
Figure 1: Percentage of 5 & 6-year-olds attending an educational institution, 2002-2017 ............ 3 Figure 2: National Primary and Secondary completion rates ......................................................... 4
Figure 3: Secondary school completion rates ................................................................................. 4 Figure 4: Proportion of children having completed grade 1 by age, 2002 - 2017 .......................... 5 Figure 5: Percentage of learners who were repeating a grade, 2009- 2017 .................................... 6
Figure 6: Percentage of repeaters by grade and gender, 2017 ........................................................ 6
Figure 7: Age-for-grade in 2009 and 2017 ..................................................................................... 7 Figure 8: Change in provincial performance between TIMSS 2002 and TIMSS 2015 .................. 9 Figure 9: 1994 to 2016 increase in ‘Bachelors-level’ attainment ................................................. 10
Figure 10: Percentage of 7 to 15 year old with disabilities and those without disabilities attending
educational institutions by province, 2014-2017 .......................................................................... 11
Figure 11: Number of educators 1987 - 2007 ............................................................................... 14 Figure 12: Average age of educators 2004 - 2017 ........................................................................ 17 Figure 13: Entry of young joiners, 2005 - 2017............................................................................ 18 Figure 14: Complaints about education, 2002 – 2017 .................................................................. 28 Figure 15: Percentage of Grade 3 learners with Mathematics and Home Language workbooks 1
and 2 by quintile, 2017.................................................................................................................. 34
Figure 16: Percentage of Grade 6 learners per province with access to home language, first
additional language and mathematics textbooks (Indicator 4), 2017 ........................................... 35 Figure 17: The number of students obtaining the ‘Matric’, 1994 – 2016 ..................................... 41 Figure 18: 2008 to 2016 Grade 12 mathematics and science trends............................................. 42 Figure 19: Percentage of learners in Grade 1 who attended Grade R, 2009-2017 ....................... 48 Figure 20: Percentage of 4-year-olds attending ECD facilities, 2009-2017 ................................. 49
Figure 21: Practitioner Qualifications by Province ...................................................................... 51 Figure 22: Learner-educator ratios 2000 - 2016 ........................................................................... 61
1
Introduction
April 2019 denotes the 25th anniversary of the advent of democracy in South Africa. In order to
mark this significant milestone, Cabinet has directed the Department of Planning, Monitoring and
Evaluation (DPME) to initiate and coordinate a 25-year review of progress with service delivery
at each historical epoch of our democracy. The 25th anniversary of the democratic dispensation
requires government departments and institutions to pause and reflect on the journey to date, and
review the achievements, challenges experienced, and actions taken to address these challenges
since 1994.
The key objective of the 25-year review is to assess the extent to which government has succeeded
in delivering on the promise of a better life for all South Africans. Specifically, the review aims to
assess the extent to which:
- government is on track towards achieving the priorities set out in the National Development
Plan (NDP) 2030;
- non-state actors such social partners, civil society, labour, the private sector and other non-
state actors have contributed towards accelerated progress towards achieving the goals set
out in the NDP;
- specific constraints and obstacles have impeded progress towards the set objectives and
targets and the extent to which this has occurred;
- and effective strategies have been developed to address identified constraints and obstacles.
This report serves as an addendum to the consolidated DPME 25-year review. The DBE’s “Action
Plan to 2019” has 27 goals – 13 which state the educational outcomes we aim to achieve and 14
which relate to activities that must be done in order to achieve those outcomes. The structure of
this review is similar. The opening section reviews the educational outcomes that have been
achieved over the past 25 years, with a focus on the themes of access to schooling, efficiency of
the school system, the quality of learning outcomes, and equity in educational outcomes.
Thereafter, the majority of the report assesses progress in regard to key building blocks of the basic
education sector, using the six sub-outcomes for Outcome 1 (Basic Education) within the
government’s Medium Term Strategic Framework (Department of Planning, Monitoring and
Evaluation, 2014) to structure the discussion:

2
1. Improved quality teaching and learning through development, supply and effective utilisation
of teachers;
2. Improved quality teaching and learning, through provision of adequate, quality infrastructure
and LTSM;
3. Improving assessment for learning to ensure quality and efficiency in academic achievement;
4. Expanded access to ECD and improvement of the quality of Grade R, with support for pre-
Grade R provision;
5. Strengthening accountability and improving management at school, community and district
level; and
6. Partnerships for educational reform and improved quality.
Throughout, the report aims to highlight the significant achievements within the sector as well as
grapple with the constraints and challenges that plague the sector. Some suggestions are made
about how to improve the provision of basic education into the future, but this report is a review
rather than a comprehensive plan.
Overview: Trends in educational outcomes
Access to school
The most dramatic improvement in access to education has been in the area of pre-school
attendance, driven mainly by the expansion of the Grade R programme since the White Paper of
2001. The numbers of children enrolled in Grade R in schools has increased from 241 525 in 2001
to 839 515 in 2017. When one looks at the daily activities of 5 and 6 year-old children in South
Africa, this has clearly had a massive impact. As Figure 1 shows, about 40% of 5 year-olds were
attending an educational institution in 2002, but by 2017 this figure is approaching 90%. Amongst
6 year-olds there is now almost universal attendance of an educational institution, and
approximately 95% of children entering Grade 1 have previously attended Grade R (according to
2017 General Household Survey data).

3
Figure 1: Percentage of 5 & 6-year-olds attending an educational institution, 2002-2017
Source: Statistics South Africa, General Household Survey (GHS), DBE own calculations
In 2017 approximately 99% of 7 to 15 year-olds were attending educational institutions, up from
about 96% in 2002. Amongst 16 to 18 year-olds the participation rate is about 86%, indicating that
it is within this age range that school dropout begins to occur in large numbers, although this figure
has also been steadily improving over the years. Primary and secondary school completion rates
yield a similar trend, as illustrated in Figure 2. Whilst primary school completion has increased
from about 85% in 2002 to about 95% in 2017, the secondary school completion rate has increased
from about 40% to just over 50%. These are significant improvements yet there is clearly much
work to be done in order to reach the NDP’s vision for secondary school completion. Figure 3 puts
this in an international perspective. South Africa achieves high rates of secondary school
completion relative to most African countries but lags behind many countries in Asia, Eastern
Europe and South America.
2002 2003 2004 2005 2006 2007 2008 2009 2010 2011 2012 2013 2014 2015 2016 2017
5 year old 39.6 48.7 52.2 59.2 61.7 60.4 63.9 78.6 83.6 84.9 84.6 85.3 87.2 85.8 88.1 88.0
6 year old 69.3 75.8 83.2 86.1 84.6 87.7 86.8 95.2 96.2 95.6 95.8 95.5 95.9 98.2 97.3 96.6
0.0
10.0
20.0
30.0
40.0
50.0
60.0
70.0
80.0
90.0
100.0P
erc
en
tage

4
Figure 2: National Primary and Secondary completion rates
Source: Statistics South Africa, General Household Survey (GHS), DBE own calculations
Note: For Grade 7 completion age 16 to 18 used and for Grade 12 completion age 22-25 was used.
Figure 3: Secondary school completion rates
Source: Graph compiled using data extracted from UNESCO Institute for Statistics database
Note: Data is for 2011 to 2016, depending on the country.
2002 2003 2004 2005 2006 2007 2008 2009 2010 2011 2012 2013 2014 2015 2016 2017
Gr 7 Completion 84.9 87.1 87.9 88.8 89.2 90.3 90.3 90.9 92.2 92.8 93.4 94.2 94.4 94.4 94.1 95.2
Gr 12 Completion 40.3 40.6 41.6 40.1 41.8 41.7 43.4 44.9 45.6 47.1 47.4 47.9 51.4 50.1 50.0 50.7
0.0
10.0
20.0
30.0
40.0
50.0
60.0
70.0
80.0
90.0
100.0P
erc
en
tage
Gr 7 Completion Gr 12 Completion
0
10
20
30
40
50
60
70
80
90
100
Nig
er
Be
nin
Mya
nm
ar
Mo
zam
biq
ue
Sen
ega
l
Un
ited
Re
pu
blic
of
Tan
zan
ia
Ch
ad
Gab
on
Leso
tho
Hai
ti
Zim
bab
we
Lib
eri
a
Eth
iop
ia
Cô
te d
'Ivo
ire
Mal
awi
Uga
nd
a
Togo
Co
ngo
Gu
inea
Cam
ero
on
Mal
i
Sud
an
Rw
and
a
Iraq
Ban
glad
esh
Sie
rra
Leo
ne
Pak
ista
n
Cam
bo
dia
Bra
zil
Afg
han
ista
n
Nep
al
Lao
Pe
op
le's
Dem
ocr
atic
Rep
ub
lic
Dem
ocr
atic
Rep
ub
lic o
f th
e C
on
go
Zam
bia
Alg
eria
Co
mo
ros
Gam
bia
Esw
atin
i
Gu
atem
ala
Nam
ibia
Uru
guay
Ho
nd
ura
s
Egyp
t
Ke
nya
Ind
ia
Tun
isia
Gh
ana
The
form
er Y
ugo
slav
Re
pu
blic
of
Mac
edo
nia
Sou
th A
fric
a
El S
alva
do
r
Co
sta
Ric
a
Mo
nte
neg
ro
Vie
t N
am
Thai
lan
d
Gu
yan
a
Re
pu
blic
of
Mo
ldo
va
Mex
ico
Par
agu
ay
Nig
eria
Pan
ama
Do
min
ican
Rep
ub
lic
Tajik
ista
n
Pal
esti
ne
Ecu
ado
r
Arm
enia
Ve
ne
zue
la (
Bo
livar
ian
Rep
ub
lic o
f)
Co
lom
bia
Serb
ia
Mo
ngo
lia
Bo
livia
(P
luri
nat
ion
al S
tate
of)
Kyr
gyzs
tan
Jam
aica
Sain
t Lu
cia
Pe
ru
Ch
ile
Cu
ba
Be
laru
s
Bo
snia
an
d H
erze
govi
na
Kaz
akh
stan
Bar
bad
os
Ukr
ain
e
Turk
me
nis
tan
5
Efficiency in school progression
When children do not participate in school, or drop out before achieving their potential, this is a
grossly inefficient use of a country’s human capital. On the other hand South Africa’s schooling
system has struggled with inefficiency caused by high levels of grade repetition, low levels of
learning achieved by those in school, and high dropout late in the school programme (Grades 10 –
12). In effect, this means many years of per student funding per matric pass. Late entry into school
is also inefficient since crucial formative phases would have been missed and by the time these
children reach secondary school they are more likely to drop out of school due to family
responsibilities, pregnancy or the pressure to find work.
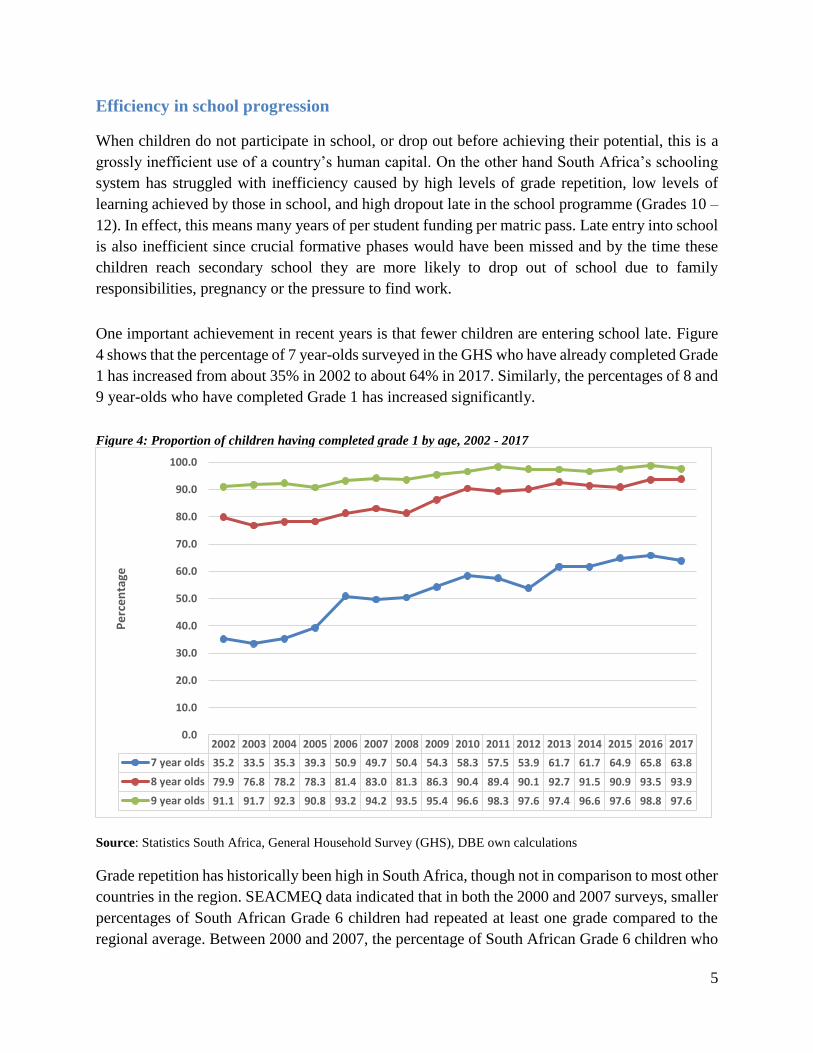
One important achievement in recent years is that fewer children are entering school late. Figure
4 shows that the percentage of 7 year-olds surveyed in the GHS who have already completed Grade
1 has increased from about 35% in 2002 to about 64% in 2017. Similarly, the percentages of 8 and
9 year-olds who have completed Grade 1 has increased significantly.
Figure 4: Proportion of children having completed grade 1 by age, 2002 - 2017
Source: Statistics South Africa, General Household Survey (GHS), DBE own calculations
Grade repetition has historically been high in South Africa, though not in comparison to most other
countries in the region. SEACMEQ data indicated that in both the 2000 and 2007 surveys, smaller
percentages of South African Grade 6 children had repeated at least one grade compared to the
regional average. Between 2000 and 2007, the percentage of South African Grade 6 children who
2002 2003 2004 2005 2006 2007 2008 2009 2010 2011 2012 2013 2014 2015 2016 2017
7 year olds 35.2 33.5 35.3 39.3 50.9 49.7 50.4 54.3 58.3 57.5 53.9 61.7 61.7 64.9 65.8 63.8
8 year olds 79.9 76.8 78.2 78.3 81.4 83.0 81.3 86.3 90.4 89.4 90.1 92.7 91.5 90.9 93.5 93.9
9 year olds 91.1 91.7 92.3 90.8 93.2 94.2 93.5 95.4 96.6 98.3 97.6 97.4 96.6 97.6 98.8 97.6
0.0
10.0
20.0
30.0
40.0
50.0
60.0
70.0
80.0
90.0
100.0
Pe
rce
nta
ge

6
had already repeated a grade decreased from 42% to 29%. Figure 5 below shows grade repetition
rates (all grades combined) according to the GHS since 2009. After an increase in grade repetition
between 2009 and 2013, the average repetition rate has returned to a little under 10%.
Figure 5: Percentage of learners who were repeating a grade, 2009- 2017
Source: Statistics South Africa, General Household Survey (GHS), DBE own calculations
Despite the improvements in grade repetition rates, the problem is more prevalent amongst boys
than girls. Figure 6 shows that boys are always more likely to repeat than girls, across the grades.
Figure 6: Percentage of repeaters by grade and gender, 2017
Source: Statistics South Africa, General Household Survey (GHS), DBE own calculations
8.7 9.0 9.8 11.1 11.8 10.8 10.4 10.1 9.60.0
2.0
4.0
6.0
8.0
10.0
12.0
14.0
2009 2010 2011 2012 2013 2014 2015 2016 2017
Pe
rce
nta
ge
Grade1
Grade2
Grade3
Grade4
Grade5
Grade6
Grade7
Grade8
Grade9
Grade10
Grade11
Grade12/
Primary Level Secondary Level
Male 6.3 9.6 8.1 10.5 6.6 8.7 5.8 13.1 14.2 26.5 21.0 9.7
Female 5.2 5.4 5.3 7.1 4.9 4.3 3.5 7.7 8.2 18.2 20.0 10.6
0.0
5.0
10.0
15.0
20.0
25.0
30.0
Pe
rce
nta
ge

7
Perhaps as a result of decreasing late entry into school and declining grade repetition rates, there
has also been an improvement in age-for-grade distributions. Figure 7 shows the age ranges for
grades 3, 6, 9 and 12. It is evident that for all of these grades, the age range was younger in 2017
than in 2009, although the difference is least noticeable at the grade 12 level. For example, in 2009
only 65% of grade 6 children were 12 or younger, but this figure improved to about 79% in 2017.
Figure 7: Age-for-grade in 2009 and 2017
Source: Statistics South Africa, General Household Survey (GHS), DBE own calculations
The recently introduced so-called “progressed learner policy” may also have an impact on the
efficiency of learner progression through the schooling system, although this requires closer
analysis. Under this policy learners are only permitted to repeat at most one grade per phase. The
result of this policy is that, since the 2015 NSC examinations, there have been large numbers of
NSC candidates sitting for the examinations despite not having fulfilled the formal requirements
for passing Grade 11. Historically, we observe high repetition rates and high dropout rates in
grades 10, 11 and 12. Therefore, it is important to understand that many of the so-called
“progressed learners” would probably have dropped out of school without sitting for the NSC
examination after repeating several times – a highly inefficient outcome. Although the matric pass
rate for progressed learners has been lower than that for non-progressed learners, many progressed
learners did pass matric. It seems likely, therefore, that the overall effect of this new policy will be
to increase the numbers of matriculants annually, by discouraging overly restrictive grade
repetition leading to dropout.
Quality of learning
In a country like South Africa, where the quality of education provision is in the public eye and
gets a lot of critique, a perception may exist that education quality is stagnant or even deteriorating.
Meanwhile, there is now global recognition that widening access to schooling does not always
equate to satisfactory levels of learning, and yet there is mounting evidence of how important
0
20
40
60
80
100
6 7 8 9 10 11 12 13 14 15 16 17 18 19 20 21 22 23
Pe
rce
nta
ge o
f le
arn
ers
th
is a
ge o
r yo
un
ger
Age
gr3 2009 gr3 2017 gr6 2009 gr6 2017
gr9 2009 gr9 2017 gr12 2009 gr12 2017

8
acquiring basic cognitive skills in school is for a country’s subsequent economic growth. For these
reasons, it is critical to undertake careful analysis of the best available data sources to gauge
whether the system is making progress in the core business of learning outcomes.
The best available data sources designed explicitly for measuring trends in learning at a national
level come from three international assessments in which South Africa has participated – TIMSS
(in 1995, 1999, 2002, 2011 and 2015), PIRLS (in 2006, 2011 & 2016) and SEACMEQ (in 2000,
2007 & 2013)1. These surveys have been instrumental in raising awareness throughout the sector
that the levels of learning in primary school maths, reading and literacy as well as mathematics
and science in junior secondary school are worryingly low in South Africa. The PIRLS
assessments, for example, have revealed that large proportions of South African children reach
grade 5 without having learned to read with comprehension.
The good news is that in recent rounds of TIMSS, PIRLS and SEACMEQ we have observed that
the country’s levels of learning have been on an improving trend. In the TIMSS assessment (grade
9 mathematics and science), South Africa has been the fastest improving country between the
surveys of 2002, 2011 and 2015. There appears to have been a significant improvement in the
country’s PIRLS results between 2006 and 2011, although no significant change between 2011
and 2016. In SEACMEQ, a large improvement at the grade 6 level was noted between 2007 and
2013 in both mathematics and reading.
Figure 8 shows the changes in TIMSS mathematics and science performance between 2002 and
2015 for each province. Large improvements appear to have taken place, especially in some of the
lowest-performing provinces. It should also be noted that the Western Cape probably did not
actually regress over the period – analysis conducted by the HSRC has suggested that the sample
for Western Cape schools was not really comparable between 2002 and 2015. However, despite
these important improvements, the absolute levels of learning achieved are still substantially below
desirable levels.
1 TIMSS stands for Trends in International Mathematics and Science Study. PIRLS stands for Progress in International
Reading Literacy Study. SEACMEQ stands for the Southern and East African Consortium for Monitoring Educational
Quality.

9
Figure 8: Change in provincial performance between TIMSS 2002 and TIMSS 2015
Source: Graph adapted from Human Sciences Research Council presentation on the release of TIMSS
The NSC results have also shown consistent improvements in recent years, both in terms of pass
rates and the numbers passing every year. One important reflection of quality in the system is the
numbers of NSC candidates achieving a “Bachelors-level” pass each year as this is required for
access to a degree programme at university. Figure 9 shows that this number fluctuated a bit but
was relatively stagnant between the mid-1990s and 2007. However, the number of Bachelor passes
has roughly doubled since 2007. Encouragingly, increases in the number of Black African bachelor
passes almost entirely accounts for the overall improvement. This leads to the next section on
equity in educational outcomes.
-60 -40 -20 0 20 40 60 80 100 120 140
WC
NC
NW
FS
MP
KZ
EC
GT
LP
Change in TIMSS score
Science Mathematics

10
Figure 9: 1994 to 2016 increase in ‘Bachelors-level’ attainment
Source: Department of Basic Education (2017) National Senior Certificate Examination Report
Equity in educational outcomes
South Africa’s history of institutionalised inequality on the basis of race has left a persistent legacy
of inequality, which manifests starkly in educational outcomes. In the 2017 NSC examinations,
for example, more than 80% of Quintile 5 schools (fee-charging schools serving mainly a middle
class population) achieved pass rates of 80% or higher. In Quintile 1 to 3 schools (non-fee schools
serving mainly black children in less affluent communities) less than a third of schools achieved
pass rates of 80% or more.
A major focus of education policy and planning since 1994 has, therefore, been on introducing and
extending pro-poor programmes, and this section will indicate that these interventions are bearing
fruit even though the inequalities in outcomes are still considerable. Key pro-poor programmes
include the introduction of no-fee schools since 2007 to the point where about two-thirds of
children now do not pay fees, the provision of daily meals to over 9 million children through the
National School Nutrition Programme, the expansion of the Learner Transport Programme to
ensure that children in remote areas arrive at school safely, on time and ready to learn, and a
number of initiatives to provide suitable learning opportunities for children with special needs.
Access to schooling has improved consistently since 1994, and this has also been the case for
learners with disabilities. However, there remain gaps in school participation rates between
children with disabilities and those without disabilities. Figure 10 indicates that whereas school
participation is approaching 100% for 7 to 15 year-old children without disabilities, for those with
disabilities (which is approximately 4% of the school-aged population as classified in the General
60
80
100
120
140
160
180
19
93
19
94
19
95
19
96
19
97
19
98
19
99
20
00
20
01
20
02
20
03
20
04
20
05
20
06
20
07
20
08
20
09
20
10
20
11
20
12
20
13
20
14
20
15
20
16
20
17
Tho
usa
nd
s o
f le
arn
ers

11
Household Survey of 2017) the participation rate ranges between 85% and 95% depending on the
province.
Figure 10: Percentage of 7 to 15 year old with disabilities and those without disabilities attending educational
institutions by province, 2014-2017
Source: Statistics South Africa, General Household Survey (GHS), DBE own calculations
Note: Data for 2014 to 2017 pooled together to overcome small sample challenges
Although the critical inequalities in the sector are along racial and socio-economic lines, the
important trend to note is that the improvements we are witnessing are being driven by the
historically disadvantaged parts of the school system. For example, the TIMSS improvements
since 2002 were largest at the bottom end of the performance distribution and in poorer provinces.
The annual numbers of Black and Coloured NSC bachelor passes has roughly doubled since 2008,
whilst the numbers of White and Indian NSC bachelor passes was stagnant over the same period,
thus indicating that the former improvement is genuine and unlikely to be reflective of changing
standards.
Another important equity dimension to consider is gender. Whilst a lot of work still has to be done
to address numerous forms of violence and barriers to educational success that affect females in
particular, many of the standard indicators of gender parity with regard to educational outcomes
are now favouring girls in South Africa. We observe substantially higher literacy scores amongst
girls across the grades – in PIRLS 2016, for example, female learners outperformed boys by the
equivalent of a grade level of learning on average nationally. Boys are more likely to repeat grades
than girls and more likely to drop out of school prior to Grade 12. The end result of this is that
there are considerably more female NSC passes annually than male passes – in 2017, for example,
217 387 females passed matric compared to 184048 males. Research by Van Broekhuizen and
Spaull (2017) demonstrates how the female advantage compounds the further along the academic
EC FS GP KZN LP MP NW NC WC
Disabled 89.7 86.4 95.1 85.2 93.8 91.7 93.3 91.4 90.7
Not Disabled 99.0 98.9 99.3 99.3 99.8 99.2 97.9 98.7 98.7
0.0
10.0
20.0
30.0
40.0
50.0
60.0
70.0
80.0
90.0
100.0
Pe
rce
nta
ge

12
path to the point where 66% more females complete a bachelor degree at university relative to
males.
There have clearly been improvements in the equity of educational outcomes since 1994, whether
one considers racial gaps, socio-economic gaps, children with special needs or gender. However,
the magnitude of the inequality that still remains means that the challenge of creating a more
equitable schooling system will be with us for many years to come.
Equity in expenditure
There are two distinct reasons why education funding should be pro-poor. Firstly, the poor are less
able to pay for the various costs associated with receiving an education; and secondly, it has been
extensively demonstrated that learners with less educated parents require more extensive, and
hence, more costly support than advantaged learners. Moreover, it is a basic tenet of progressive
fiscal policy, which has been pursued by South Africa since 1994, to target tax incidence to the
more affluent and to target government expenditure to the poorer sections of the population.
The fact that a large proportion of government spending on education goes to personnel spending
(teachers and non-teaching staff), and the reality that better qualified teachers who enjoy moderate
pay benefits tend to work in more affluent schools limits the extent to which such spending can be
pro-poor. However, studies on fiscal incidence in South Africa have found that education spending
has become well-targeted to the poor, which can be largely attributed to the effects of non-
personnel spending (Van der Berg S. , 2009; Gustafsson & Patel, 2008).
The National Norms and Standards for School Funding, introduced in 2000, stipulated that poorer
schools within each province should receive greater allocations of non-personnel spending. This
was refined in 2006 by the Education Law Amendment Act, which categorised schools into
nationally divided poverty quintiles – where the breakdown into five quintiles is according to some
indicator of poverty or socio-economic status, and made the poorest 40% of schools “no-fee
schools” (Quintile 1- 2 schools). The generally positive reception to the no-fee policy has led to
this being expanded to include Quintile 1 – 3 schools (which is in fact more than 60% of schools
and children).
Government targets have clearly been pro-poor, however, the amounts actually received by
schools were slightly less pro-poor than intended. Potential reasons for this include funds intended
for non-personnel spending being used by schools to supplement personnel spending, financial
transfers coming through late, and schools receiving departmentally purchased goods and services
too late. Private spending through fees dramatically increases the total expenditure for the richest
quintile. The resource base of quintile 5 schools is, therefore, considerably better than that of

13
poorer schools, but this is due to private spending, with public spending serving to counteract this
to some extent.
The next sections review the various inputs that go into building an effective schooling system
capable of improving the educational outcomes that have been discussed above. The sections are
organised according to the six sub-outputs linked to Outcome 1 of the Medium Term Strategic
Framework.
Output 1: Teacher development, supply and effective utilisation of teachers
1.1) Introduction/ Problem Statement
Teachers are the cornerstone of our education system. The successful functioning of schools
depends on teachers being trained, recruited, and placed in schools effectively. Policies regulating
teacher development, teacher supply and the effective utilisation of teachers are, therefore, central
to ensuring improved quality teaching and learning. The Sustainable Development Goals (SDG)
recognise the importance of teacher development and teacher supply and has lent support to this
priority area through SDG Target 4.c: “By 2030, substantially increase the supply of qualified
teachers”.
Aligned to the SDG goals, the National Development Plan (NDP) provides a four-pronged strategy
to ensuring an adequate supply of skilled teachers in the system: (1) Produce more and better
qualified teachers through the university and other systems; (2) Develop in-service strategies and
support systems that will continually develop the skills of teachers; (3) Cooperate with professional
bodies and teacher unions to enhance member expertise and commitment and; (4) Ensure an
appropriate pay structure which also rewards good teachers (NPC, 2013: p70).
The NDP strategy is translated in the Medium Term Strategic Framework (MTSF) in Sub-
Outcome 1: “Improved quality of teaching and learning through development, supply and effective
utilisation of teachers”. The MTSF lays out various targets to realising this outcome including the
average number of hours teachers spent on professional development, the number of qualified
Grade R-12 teachers aged 30 and below entering the public service as teachers for the first time,
the number and percentage of Funza Lushaka bursary holders placed in schools within six months
of their completion of studies, teacher absenteeism, and the percentage of schools where allocated
teaching posts are all filled.
The quality of teacher development and effective teacher recruitment and management strategies
are government policy priorities – as demonstrated in the NDP, the MTSF and the Action Plan to
2019. It is recognised that teacher salaries comprise approximately 80% of the education budget

14
and that teachers are the custodians of classroom practice. Teacher development, supply and the
effective utilisation of teachers are, therefore, integral to improving teaching and learning in South
Africa.
1.2) Achievements and journey since 1994
At the advent of democracy, resource distribution in terms of teacher remuneration, teacher
qualifications and learner-educator ratios were severely skewed. Massive strides have since been
made in the redistribution of available resources, especially in terms of teacher numbers and
teacher remuneration. Figure 11 illustrates the steady increase in the number of teachers for the
period 1987 until 2007. In response to the enrolment increases that took place during the same
period, the number of teachers increased by 100,000, thereby allowing the system to maintain
constant learner-educator ratios (Gustafsson & Patel, 2008).
The relatively constant learner-educator ratios mask the redistribution between schools, in favour
of previously disadvantaged schools. Much of the redistribution was achieved through teacher
rationalisation in the period following 1994. The rationalisation entailed the movement of
educators from areas of oversupply to areas of need, as well as the option of voluntary severance
packages for teachers who were not willing to be part of the rationalisation.
Figure 11: Number of educators 1987 - 2007
Source: Gustafsson & Patel (2008)
The 1998 Post Provisioning Norms specifies how the total number of educator posts to schools in
a provincial department should be calculated. The norms have evolved over time, with a focus on
the equality of inputs and poverty ranking, weighted by the number of learners to ensure fairness
in the distribution of teacher posts. In order to achieve quality teaching and learning for all learners,
policymakers must ensure that all schools are provided with the required number of teaching staff

15
as specified by the policy. Key to implementing this policy is a thorough understanding of how
many vacancies exist, where they are, and what the most recent trend is over time.
The School Monitoring Survey 2017/18 reports the percentage of schools in which allocated
teaching posts are filled. The results reveal that the percentage of primary and secondary schools
combined where all allocated teaching posts were filled improved from 69% in 2011 to 78% in
2017. A substantially lower proportion of primary schools in the Eastern Cape, compared to the
national average for primary schools, had all their posts filled. In Gauteng, KwaZulu-Natal and the
Western Cape the situation seemed to be better than the national average for primary schools. In
secondary schools, lower proportions of schools in the Eastern Cape and the North West had all
their teaching posts filled, in comparison to the country average for secondary schools. In
KwaZulu-Natal and the Northern Cape, the situation seemed to be better than the national average
(Department of Basic Education, 2018).
Table 1: The percentage of primary and secondary schools combined where allocated teaching posts were filled in
terms of categories of compliance level by province
Source: School Monitoring Survey 2017/2018, Summary Report
The establishment of the Education Labour Relations Council (ELRC) has also contributed to the
redistribution of resources and teachers have directly benefited through the signing of collective
agreements. In the mid-1990s, the salaries of most teachers rose dramatically, with the real increase
in the minimum pay notch for black teachers with four years of post-secondary education being
approximately 25%. This shift was due to a post-apartheid pay equalisation that essentially brought
all teachers up to the favourable level enjoyed by the minority of white teachers in the past
(Gustafsson & Patel, 2008). More recently there has been further large increases, with the average
salary of teachers increasing by about 28% in real terms between 2007 and 2012 (Department of
Basic Education, 2015). These increases have typically been attributed to agreements with unions
relating to the Occupation Specific Dispensation emanating from the ELRC Resolution 1 of 2008
and Resolution 4 of 2009. Although these increases has been a positive development from an
Province 50%-74% 75%-99% 100% Unknown Total
EC 5,4% 30,9% 63,4% 0,2% 100,0%
FS 0,0% 22,4% 77,2% 0,3% 100,0%
GT 0,0% 15,6% 83,7% 0,7% 100,0%
KZN 0,5% 10,8% 88,3% 0,3% 100,0%
LP 0,5% 22,9% 76,6% 0,0% 100,0%
MP 0,2% 20,1% 79,7% 0,0% 100,0%
NC 0,0% 16,9% 81,1% 2,1% 100,0%
NW 0,0% 26,2% 72,7% 1,1% 100,0%
WC 0,0% 13,5% 86,5% 0,0% 100,0%
SA 1,5% 20,3% 77,9% 0,3% 100,0%

16
educational perspective, these increases have limited provincial departments in their ability to hire
more educators and spend on non-personnel items.
Teacher development also experienced major changes since 1994. Teacher training in public
institutions was generally fully funded by the government before 1994. However, from 1995 to
2005 bursaries were abandoned for teacher training, thereby introducing a financial barrier for
many individuals who may have considered teaching as a potential career. To add to the financial
burden, the 110 teacher colleges were merged into the 22 higher education institutions in 2002,
which subsequently led to a further increase in tuition fees. This resulted in fewer previously
disadvantaged African individuals pursuing teaching as a career choice and it was understood that
a key reason was the unaffordability of teacher training. A further unintended consequence of the
dissolution of teacher colleges in the rural areas was that student teachers were less likely to return
to the rural areas to teach after completing their studies at university.
By 2009, a departmental analysis of teacher demand and supply signalled that the overall number
of teachers was increasing, marked by the annual supply of qualified educators exceeding the
annual replacement demand of qualified educators (Department of Basic Education, 2009).
However, only a minority of qualified educators joining the education system each year were aged
30 and below. The average age of educators also increased from 40.7 in 2004 to 42.7 in 2008,
indicating that the system was experiencing an ageing workforce. The fact that there were so few
young graduates available to join the system was considered to be a potentially serious supply
problem in the future, and this prompted increased monitoring of young joiners and interventions
to encourage young joiners.
The ageing workforce trend has been evident ever since. Figure 12 illustrates the increase in the
average age of teachers from around 41 years in 2004 up to almost 45.5 years in 2014. In this
figure, the years 2014 and 2015 represent an important turning point in the schooling system, with
the dropping of the average age of teachers after a long period of increases (Department of Basic
Education, 2018).

17
Figure 12: Average age of educators 2004 - 2017
Source: Department of Basic Education (2018) Basic education remuneration issues, Internal DBE document
In response to this crisis, government initiated several efforts to increase the development of new
teachers, including launching the Funza Lushaka Bursary Programme (FLBP) in 2007. The FLBP
has made a considerable contribution by improving the attractiveness of teaching as a choice for
many South African youth. Between 2007 and 2017, the programme has awarded 120,5112 Funza
Lushaka bursaries at a cost of R7.21 billion to prospective teachers. An implementation evaluation
of the FLBP in 2016 indicated that the programme has made an important contribution to the
substantial increase in enrolment in Initial Teacher Education (ITE) since its introduction, with
FLBP students constituting on average 15% of the total ITE student intake. The programme was
further deemed successful in attracting quality students to become teachers.
Since 2005 we have also seen a steady increase in the number of young joiners from around 6,000
up to almost 14,000 in 2017 (Figure 13). The FLBP was seen as one of the mechanisms
contributing to this increase by enhancing access for high achieving students to qualify as teachers,
thereby alleviating some of the pressure on the demand for teachers (Department of Basic
Education, 2018).
2 The number of Funza Lushaka bursaries awarded include bursaries awarded to new applicant and returning students.
It is therefore possible that a student will receive more than one award until the student graduates. The Funza Lushaka
Policy stipulates a maximum of five (5) awards.

18
Figure 13: Entry of young joiners, 2005 - 2017
Source: Department of Basic Education (2018) Basic education remuneration issues, Internal DBE document
It is important to note that approximately two-thirds of teachers currently working in public
schools received their ITE before the reforms in the early 2000s. It is, therefore, especially
important to offer Continuous Professional Teacher Development (CPTD). Teachers require the
ongoing updating of their skills, in part because teaching methods evolve as new technologies
emerge. More importantly, teachers with weak ITE foundations require particularly good support.
Emerging evidence from around the world suggests that it is especially difficult to change
classroom practices through CPTD (World Bank, 2003), however, some approaches tend to work
better than others. This has led to a strong emphasis on evaluating existing programmes, and a
keen interest in the use of Professional Learning Communities (PLCs) which are needs-driven and
stimulate collaborative learning (VVOB, 2017).
Previously, there has been little to no evidence on the types of teacher support mechanisms to
impact on early grade reading outcomes in South Africa. The DBE’s Early Grade Reading Study
(EGRS) has systematically aimed to provide evidence on alternate models of teacher support for
the teaching of reading. After two years of implementation, formal impact evaluation results
revealed that the largest impact on reading outcomes was observed when the form of professional
support to teachers included on-site coaching. Instructional coaching in schools is when mentors,
considered experts in their field are paired with individual teachers to provide hands-on, ongoing
support on matters of curriculum and pedagogical practice (Department of Basic Education, 2017).
Over the past 25 years, key developmental priorities have been addressed through various policies
and initiatives, including:

19
1. The development of a new and strengthened Integrated Strategic Planning Framework for
Teacher Education and Development in South Africa, 2011–2025. The framework puts
forward improved and expanded teacher education and development opportunities in order to
improve the quality of teaching and learning in schools.
2. The enactment of the Employment of Educators Act, 1998 (Act 76 of 1998), which provides
for the employment of educators by the state and for regulation of the conditions of service,
discipline, retirement and discharge of educators. This act and the resultant professional
council, the South African Council of Educators (SACE) has played a significant role in
developing teacher professional standards and supported the broader professionalisation of
teaching.
3. The introduction of the Advanced Certificate in Education: School Leadership, which is
a two-year qualification aimed to prepare aspirant principals to be qualified and competent
for the role as a Principal. The certificate is set to be replaced by an Advanced Diploma in
Leadership and Management and it is envisaged that this qualification will become a
mandatory qualification for the appointment of school principals.
4. The development of the Framework for the Induction of Newly Appointed Principals to
ensure uniformity in the sector in the way that principals are prepared for their new
responsibility.
5. Improving the quality of education through ensuring equitable distribution of educators by
maintaining reasonable learner -educator (LER) ratios within the context of financial
constraints.
6. For over a decade, the Integrated Quality Management System (IQMS), has governed the
way educators assess their own capabilities and have this peer reviewed by colleagues and
managers. The system is comprised of the Development Appraisal, Performance
Management and Whole School Evaluation. IQMS scores have been found to be well
correlated with HoD promotions, which suggests that on the whole, the IQMS is able to gauge
teacher quality and that more capable teachers are being promoted – pointing to better teacher
accountability in the system.
1.4) Challenges and how to improve
The continued shortages of young graduates available to join the system represents a serious
supply problem, especially in light of increasing learner enrolment numbers. In addition, the
ageing workforce in conjunction with the rising unit costs of teacher salaries has placed immense
pressure on provincial expenditure- leading to the instability of provinces to spend more on

20
learning activities. However, the expected increase in the number of young joiners will bring down
the average cost of an educator in real terms as younger educators cost less than older educators
(due to experience-related remuneration benefits).
Further, evidence has pointed to younger teachers being better equipped to teach than their older
peers who received their initial training in the previous system. Results from mathematics and
language teacher tests in SEACMEQ 2007 and 2013, point to younger teachers displaying a level
of subject knowledge which was considerably higher than that of older teachers. It is likely that
stronger subject knowledge among younger teachers would have played some role in improving
outcomes for learners. Yet the systemic impact of this would be limited as it takes time for older
teachers to be replaced by younger teachers.
In tracking the Department’s performance towards the MTSF outcome of improved quality of
teaching and learning through the development, supply and effective utilisation of teachers,
various indicators have been measured in 2011 and again in 2017 through the School Monitoring
Survey (SMS). The results suggest that some improvement have been made, but that a lot more
work can be done towards achieving the outcome.
In terms of the effective utilisation of teachers, the SMS measured the percentage of schools that
had all their teaching posts filled, as well as teacher absenteeism. Although there has been an
approximate3 improvement from 69% to 78% in the percentage of schools that had all their
teaching posts filled, it is recognised that the 2017 level is still below the target of 95% that was
set-out in the MTSF. Furthermore, teacher absenteeism also remained relatively consistent
between 2011 and 2017, with 10% of teachers being absent on an average day.
To evaluate the changes in teacher development between the 2011 and 2017 surveys, the average
number of hours that teachers spent on professional development was measured. In 2017,
significant increases in the average hours spent on professional development was evident among
secondary school teachers, with the overall average improving from 28 hours to 44 hours. For
Limpopo, the increase was 18 hours on average, for Gauteng 34 hours on average and the Western
Cape reported an increase of 51 hours on average. Nevertheless, across the country, teacher on
average spent 40 hours on professional development, half the specified target of 80 hours.
The Funza Lushaka bursary programme is key to ensuring the effective supply of teachers. The
implementation evaluation of the Funza Lushaka bursary programme, however, highlighted some
challenges in the programme that needs to be addressed. The main intended outcome of the
3 A comparison between 2011 and 2017 is only an approximation, since there was ambiguity in the 2011 SMS
questions, and temporarily filled allocated posts may or may not have been reported as vacant.

21
programme is for graduates to be placed in priority subject areas and in identified geographical
areas of need. The evaluation found that the intention to place Funza Lushaka bursary programme
graduates predominantly in rural and poor schools has not been achieved. Greater attention will
have to be paid to modernised information management systems and improved provincial human
resources planning to inform teacher recruitment and the placement of graduates.
Furthermore, it is recognised that the implementation model of the Funza Lushaka bursary
programme in the context of free higher education must be re-engineered. Options such broadening
school based initial teacher education models linked to rural and/or “difficult to teach” contexts
should be explored. The emphasis should be on strict identification and selection criteria, deepened
content knowledge linked to early exposure to classroom practices with planned mentoring
opportunities.
Output 2: Improved quality teaching and learning, through provision of
adequate, quality infrastructure and LTSM
2.1) Problem statement
The development of children is influenced by the physical and social environments they find
themselves in. In the education sector, school infrastructure is important in facilitating the delivery
of education and creating an atmosphere conducive for learning. Infrastructure may be categorised
into what the Medium Term Strategic Framework 2014-2019 (MTSF) refers to as “hard
infrastructure”, for example, school buildings, desks and sanitation, as well as “soft infrastructure”,
for example, books and computers. Sub-outcome 2 in the basic education MTSF 2014-2019,
“Improve the quality of teaching and learning through the provision of infrastructure and learning
materials”, provides the required actions and targets for the schooling sector.
Goal 19 and Goal 20 of the DBE’s Action Plan address the provision of a minimum set of textbooks
and workbooks required according to national policy, and increased access to a library or
multimedia centre fulfilling certain minimum standards.. These are generally referred to as
Learning and Teaching Support Materials (LTSMs)4. Goal 24 is about ensuring that the physical
4 The DBE refers to LTSMs under the following definitions and contexts: (i) LTSM: a variety of learning and teaching
materials used in classrooms. These range from teacher and learner created resources to commercially produced
classroom resources, such as wall charts, workbooks, textbooks, e-books, readers, stationery, science kits, dictionaries
etc.; (ii) e-LTSM: an e-book composed in or converted to digital format for display on a computer screen or handheld
device; (iii) Core-LTSM: the category of LTSM that is used to teach the entire curriculum of a subject for a grade.
This would generally be comprised of textbooks/learner workbooks and teacher guides; (iv) Supplementary LTSM:
refers to LTSM that accompanies core LTSM and is generally used to enhance a specific part of the curriculum.

22
infrastructure and environment of every school inspires learners to want to come to school to learn,
and teachers to teach.
These mandates and plans demonstrate government’s commitment to supporting the infrastructure
needs in education. Notwithstanding this, the historical absence of specific norms for physical
infrastructure, and backlogs in the provision of sanitation have been an area of public contention
and controversy resulting in several court cases, particularly over the past five years. The provision
of LTSMs was also initially plagued with similar controversies which have included court cases
and extensive coverage in the media. However, the development of standards for textbook quality,
interventions in procurement and the development of LTSM provisioning systems over the past
five years have positively changed the discourse in the sector.
2.2) Achievements and journey since 1994
Hard Infrastructure
In 1996, two years after the democratic transition, the then Department of Education (DoE)
launched the first ever school register of needs (SRN) survey. The survey was the first of its kind
as it included every school in the country and reported on the conditions of school buildings and
available facilities. The survey provided an invaluable baseline database on the provision of school
infrastructure and basic services. This baseline database indicated that the majority of learners
were taught in decrepit and unsafe buildings; their schools had no electricity, safe water, sanitation,
telephones, or co-curricular facilities and equipment.
According to the SRN, in 1996 the country had 26 734 ordinary schools with an average learner-
classroom ratio of 43:1. Out of these, only 11 000 were reportedly in good or excellent condition.
Approximately 55% of learners (6.6 million) were in schools without toilet facilities and the
learner-toilet ratio was 41:1, while 35% of learners did not have access to water at school.
Nationally, only 42% of schools had access to electricity; 40% had access to telephones and only
9% (2 330 schools) had access to computers for learning and teaching. The SRN also surveyed
what was then known as “Education for Learners with Special Education Needs (ELSEN)”
schools. Out of the 270 ELSEN schools surveyed, 20% of the schools were reportedly in good or
excellent condition and only 33% had wheelchair ramps. Approximately 5% of ELSEN schools
reported no access to water and 4% had no toilets.
Based on this endowment in 1996, the key policy challenge was to deal with imbalances in the
basic mix of educational resource inputs that constitute an enabling physical teaching and learning
environment. In response, the sector provided infrastructure through several initiatives. Two recent
programmes are the Provincial Schools Building Programme and the Accelerated School
infrastructure Delivery Initiative (ASIDI). The Provincial Schools Building Programme is

23
implemented by Provincial Education Departments (PEDs) and is funded through the Education
Infrastructure Grant (EIG) and provincial contributions through the standard National Treasury
funding mechanisms. The ASIDI is driven by the DBE to address inappropriate structures and
basic services and is funded through the Schools Infrastructure Backlogs Grant and accounts for
25% of the EIG spend. Some of the key ASIDI areas include construction; maintenance; upgrading
and rehabilitation of new and existing infrastructure in education, including district and circuit
accommodation; providing infrastructure to match curriculum requirements; replacing
inappropriate schools; provision of basic services; addressing damage to infrastructure caused by
natural disasters; extending existing schools with additional classrooms/facilities; addressing the
achievement of the targets set out in the minimum norms and standards for school infrastructure;
and enhancing capacity to deliver infrastructure in education.
The first development in consolidating information on the state of schools following the SRN was
the developments of the National Education Infrastructure Management System (NEIMS) in 2006.
Following a comprehensive audit of public ordinary schools5, the NEIMS report details
information, including digital photographs, about every school. This includes the land and
buildings and their condition as well as teacher and pupil numbers. This information is also mapped
using Geographic Information Systems (GIS), which provides a useful overview of the spatial
location and distribution of schools. The first pivotal policy developed over the past 25 years are
the gazetted 2010 National Policy for an Equitable Provision of an Enabling School Physical
Teaching and Learning Environment (Department of Basic Education, 2010) which was initially
drafted in 2008 along with the Draft National Minimum Uniform Norms and Standards for School
Infrastructure (Department of Education, 2008). The norms were, however, not published in 2010
with the national policy.
The first sector plan (Action Plan to 2014: Towards the Realisation of Schooling 2025), published
in 2010, reported that the shortfall of classrooms was estimated to be 63 000 nationally (there are
approximately 390 000 classrooms across all public schools), and that approximately 10 000 of
the country’s almost 25 000 public schools had libraries in the form of a separate room dedicated
for this purpose. In 2011, the DBE commissioned a nationally representative School Monitoring
Survey (SMS) to measure progress in the sector (Department of Basic Education, 2013).
According to this independent survey, 55% of schools met the nationally determined minimum
infrastructure needs. Gauteng had the highest level of compliance at 90% while Eastern Cape had
the lowest at 33%. The 10 260 schools, affecting approximately 3.45 million children, that did not
comply were mainly in Eastern Cape, KwaZulu-Natal and Limpopo. The table below provides the
5 Schools in South Africa are classified into ordinary, special education, specialisation and technical, and independent
schools.

24
number of schools that complied with nationally determined minimum physical infrastructure
needs, by province (Department of Education, 2008).
Table 2: Number and percentage of schools which complied with nationally determined minimum physical
infrastructure needs in 2011, by province
Province Do not comply Comply
Unspecified/
Missing Total
No. % No. % No. % No. %
EC
3 475 67 1 722 33 15 0 5 212 100
FS
525 39 824 61 0 0 1 349 100
GP
182 10 1 704 90 0 0 1 886 100
KZN
2 805 51 2 638 48 30 1 5 473 100
LP
1 662 44 2 106 56 0 0 3 768 100
MP
637 39 982 61 0 0 1 619 100
NC
217 39 344 61 0 0 561 100
NW
571 38 931 62 0 0 1 502 100
WC
186 14 1 115 85 8 1 1 309 100
Total
10 260 45 12 366 55 53 0 22 679 100
Source: Department of Basic Education. (2013). Report on the National School Monitoring Survey
The promulgation of the Minimum Uniform Norms and Standards for Public School Infrastructure
only took place in 2013 as an out of court agreement following sustained public pressure, media
coverage and a 2012 court case compelling the basic education sector to publish the norms. For
the first time ever it became the law that every school must firstly, have water, electricity, working
toilets, safe classrooms – with a maximum of 40 learners, security, and thereafter libraries,
laboratories and sports facilities. The norms also provided minimum uniform standards in the
design and construction of new schools and additions, alterations and improvements to schools
which exists. The provision of incremental deadlines for meeting specific targets in the eradication
of infrastructure backlogs and new infrastructure was also a landmark feature of the norms.
There have been several recent court cases, from 2017 to date, on the inadequate implementation
of the norms and standards and the loss of life that has resulted from inadequate sanitation. In July
2018 the Bhisho High Court6 ruled that there are unconstitutional components of the norms and
standards which the DBE should amend. The main area of contestation was the provision for
6 Equal Education v Minister of Basic Education (2018).

25
compliance subject to the availability of resources and co-operation of other government agencies7.
The tension between the provision of basic education by the DBE and infrastructure by the
Department of Public Works as well as the need to collaborate with PEDs was judged to be an
insufficient justification for the delay in implementing the norms. The Court also ruled that the
implementation plans received from PEDs should be made publically accessible by the DBE
within reasonable timeframes as the last publication of these plans was in 2015.
In terms of hard infrastructure, the MTSF (2014-2019) has indicators in relation to eradicating
inappropriate school structures, constructing new structures and providing infrastructure facilities
– particularly in relation to the number of schools built through ASIDI. In addition, with regards
to infrastructure facilities, the MTSF targets are in relation to the number and percentage of public
ordinary schools provided with water supply, electricity, and sanitation facilities in line with
agreed norms and standards. Each of these targets were set at 100% in the 2016/17 financial year
(Department of Planning, Monitoring and Evaluation, 2014).
The historical backlog in physical infrastructure has required substantial efforts, while the
seriousness of the challenge has resulted in societal pressure to respond urgently and promptly.
Significant progress has been achieved over the past 25 years. The number of schools with
electricity has increased from 11 174 in 1996 to 99% of all schools in 2018, according to the
NEIMS database (Department of Basic Education, 2018). Substantial improvements have also
been recorded in the number of schools with access to running water and the number of schools
with some form of sanitation. However, this includes pit latrines which are now regarded by the
sector as unacceptable.
The strategic objective of ASIDI is to provide basic infrastructure services, namely, water,
sanitation and electricity. The second component of the objective is to replace schools built using
inappropriate materials on an annual basis (Department of Basic Education, 2018). The audited
figures, according to the DBE Annual Report for 2017/18 for the total cumulative delivery of
ASIDI (Department of Basic Education, 2018) are 425 schools provided with appropriate
sanitation, 615 provided with access to water, and 306 provided with access to electricity.
According to the same source, 179 inappropriate structures have been replaced. These schools are
new, but were intended to replace schools built from inappropriate material either partially or in
their entirety. In the 2017/18 financial year, a total of 36 new and replacement schools, 1 624
maintenance or upgrading projects, 819 water projects, 659 sanitation projects, 208 electricity
projects, 199 fencing projects, 26 libraries, 89 laboratories, 2 299 additional classrooms, 551 Grade
R classrooms, and 36 administration blocks were provided through the Provincial Schools
Building Programme (Department of Basic Education, 2018). The overall figure cited internally
at the time of writing for new and replacement schools through this provincial programme is 784.
In the case of this provincial programmes new and replacement schools is a combination of
7 Regulations Relating to Minimum Uniform Norms and Standards for Public School infrastructure (2013) Sub-
regulation 4 (5)(a).
26
inappropriate schools that have been replaced as well as completely new schools that have been
built.
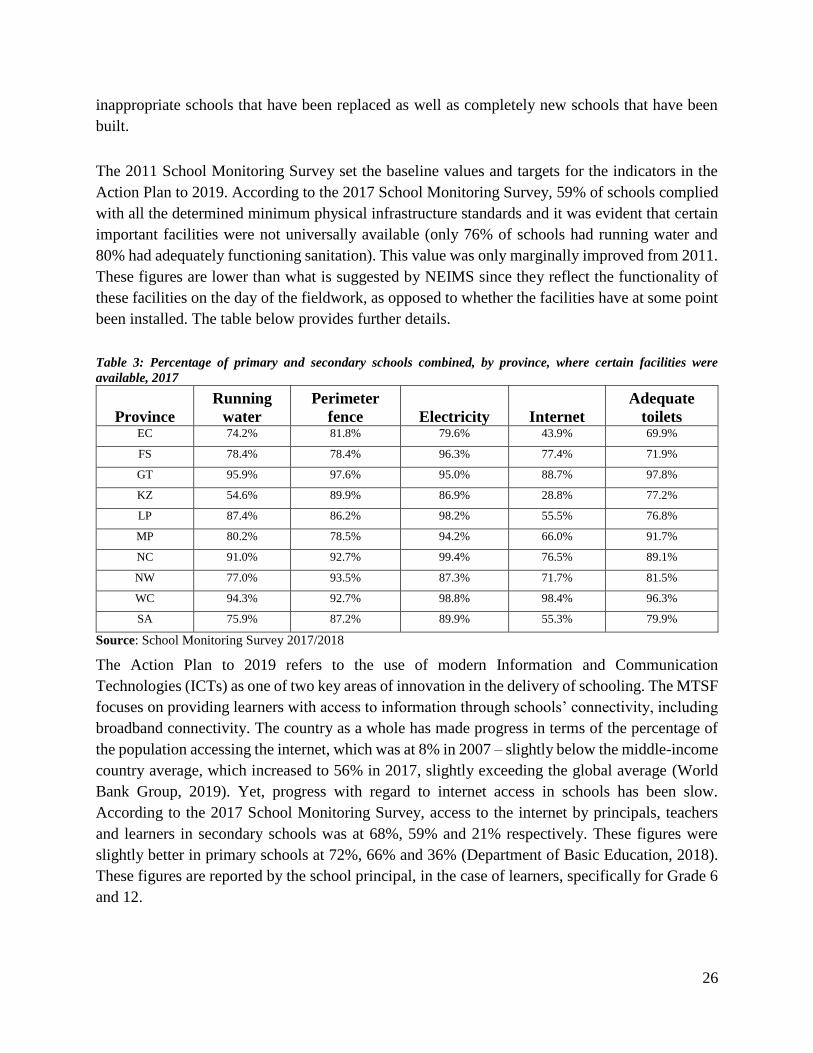
The 2011 School Monitoring Survey set the baseline values and targets for the indicators in the
Action Plan to 2019. According to the 2017 School Monitoring Survey, 59% of schools complied
with all the determined minimum physical infrastructure standards and it was evident that certain
important facilities were not universally available (only 76% of schools had running water and
80% had adequately functioning sanitation). This value was only marginally improved from 2011.
These figures are lower than what is suggested by NEIMS since they reflect the functionality of
these facilities on the day of the fieldwork, as opposed to whether the facilities have at some point
been installed. The table below provides further details.
Table 3: Percentage of primary and secondary schools combined, by province, where certain facilities were
available, 2017
Province
Running
water
Perimeter
fence Electricity Internet
Adequate
toilets EC 74.2% 81.8% 79.6% 43.9% 69.9%
FS 78.4% 78.4% 96.3% 77.4% 71.9%
GT 95.9% 97.6% 95.0% 88.7% 97.8%
KZ 54.6% 89.9% 86.9% 28.8% 77.2%
LP 87.4% 86.2% 98.2% 55.5% 76.8%
MP 80.2% 78.5% 94.2% 66.0% 91.7%
NC 91.0% 92.7% 99.4% 76.5% 89.1%
NW 77.0% 93.5% 87.3% 71.7% 81.5%
WC 94.3% 92.7% 98.8% 98.4% 96.3%
SA 75.9% 87.2% 89.9% 55.3% 79.9%
Source: School Monitoring Survey 2017/2018
The Action Plan to 2019 refers to the use of modern Information and Communication
Technologies (ICTs) as one of two key areas of innovation in the delivery of schooling. The MTSF
focuses on providing learners with access to information through schools’ connectivity, including
broadband connectivity. The country as a whole has made progress in terms of the percentage of
the population accessing the internet, which was at 8% in 2007 – slightly below the middle-income
country average, which increased to 56% in 2017, slightly exceeding the global average (World
Bank Group, 2019). Yet, progress with regard to internet access in schools has been slow.
According to the 2017 School Monitoring Survey, access to the internet by principals, teachers
and learners in secondary schools was at 68%, 59% and 21% respectively. These figures were
slightly better in primary schools at 72%, 66% and 36% (Department of Basic Education, 2018).
These figures are reported by the school principal, in the case of learners, specifically for Grade 6
and 12.

27
The 2011 Trends in International Mathematics and Science Study (TIMSS) data confirms that over
the past decade and a half, access to computers in schools has improved substantially. In 2011,
49% of Grade 9 learners had access to computers in schools against 28% in 2002. However, the
same TIMSS data reveals that South Africa was considerably behind other developing countries
in 2011 at 49%, compared to 86% in Botswana, 78% in Ghana and 82% in Indonesia (Department
of Basic Education, 2015). While there has been continuing progress, it has been at a slow pace.
The 2015 TIMSS data confirms that around half of Grade 5 and Grade 9 learners had access to a
tablet or computer in schools. This puts South Africa roughly on par with other middle-income
countries at the primary level, but below the average of these countries at the secondary level.
The 2017 School Monitoring Survey provides valuable information which is roughly in line with
the findings emerging from TIMSS. In public schools, of Grade 12 learners are in schools which
have a computer laboratory. However, this figure remains skewed in favour of the historically
advantaged i.e. at 93% for learners in quintile 5 schools and 40% for learners in quintile 1 schools.
The survey also found large inter-provincial differences, in particular, this figure was at 91% for
the Free State, a successful province in this regard, while it was at 25% for Limpopo.
In reflecting on the provision of infrastructure, understanding the public’s perception is important.
High profile court cases and mainstream media have highlighted some of the infrastructure
challenges already referred to. The General Household Survey (GHS), however, provides a
nationally representative picture of public perceptions around educational facilities. According to
this source the developments in infrastructure provisioning have been seen positively by the public.
The GHS asked whether any member in the household who was attending an educational
institution experienced any problems at the institution over the last six months. In 2017, only 2.6
percent of households complained about inadequate school facilities, which is a significant
decrease from 10 percent in 2002 (Department of Basic Education, 2018).

28
Figure 14: Complaints about education, 2002 – 2017
Source: Statistics South Africa, General Household Survey (GHS), DBE own calculations
2002 2003 2004 2005 2006 2007 2008 2009 2010 2011 2012 2013 2014 2015 2016 2017
Lack of books 20.3 18.0 14.0 15.0 12.9 10.0 9.7 6.3 6.2 6.1 6.3 6.5 3.7 4.3 3.5 4.0
Poor quality of teaching 4.4 3.5 2.8 3.7 3.4 6.0 3.5 2.3 2.3 2.9 2.1 1.9 1.7 1.7 1.4 1.5
Lack of teachers 5.1 4.2 3.8 4.5 4.0 8.4 3.7 2.7 2.1 2.6 2.8 2.1 2.0 2.7 2.4 2.1
Facilities in bad conditions 10.2 9.7 7.7 7.4 7.7 5.4 5.4 3.4 3.9 4.2 3.8 3.6 2.9 3.6 3.2 2.6
Fees to high 17.7 16.7 14.1 13.4 11.7 7.1 7.8 5.2 5.4 6.0 3.7 4.4 4.2 4.3 4.2 3.4
Classes too large 6.6 6.7 6.9 6.6 7.4 4.9 4.8 3.8 4.8 4.9 4.4 4.1 3.2 4.3 4.0 3.5
0.0
5.0
10.0
15.0
20.0
25.0
Pe
rce
nta
ge

29
Soft Infrastructure
According to the 1996 SRN, textbook provisioning was adequate in only 50% of schools nationally and varied across provinces with
the highest adequacy of provisioning found in Free State, 63%, and the lowest in Eastern Cape, 38%, and North West, 39%. Although
in six provinces 60% of schools did not have any materials, it is unclear what material is referred to in the report. As indicated in the
following table, the worst affected province was KwaZulu-Natal, at 78%.
Table 4: Provision of school resources by percentage, 1996
Provinces Media Equipment Materials Stationary Textbooks
Adequate Inadequate None Adequate Inadequate None Adequate Inadequate None Adequate Inadequate None
Eastern
Cape 3 6 91 6 21 73 62 36 2 38 60 2
Free State 8.1 10 81.9 14.6 17 68.4 78.6 18.4 3 62.9 35.1 2
Gauteng 22.9 21 56.1 26 27.5 46.5 64.3 31.3 4.4 45.2 51.4 3.4
KwaZulu-
Natal 6 5 89 8 14 78 62 35 3 55 43 2
Limpopo 2 3 95 6 21 73 46 47 7 47 50 3
Mpumalanga 5 15 80 6 24 70 63 36 2 53 45 1
Northern
Cape 15 20 65 29 35 36 64 34 2 55 43 1
North West 5 9 86 6 19 75 60 36 4 39 58 2
Western
Cape 34 27 39 41 39 20 76 23 1 53 45 2
South Africa 11 13 76 16 24 60 64 33 3 50 48 2
Source: Own calculations based on “The condition of education”. Pretoria: HSRC, 1998.

30
When comparing the 2000 SEACMEQ II to the SRN, provisioning of textbooks seems to have largely been similar at 50% in the SRN
and 46% for reading and 41% for Maths in SEACMEQ. Provisioning was below 50% across most provinces with North West having
the least at 35% for reading and 25% for Maths. This challenge was compounded by the changes in curriculum and the need to provide
quality LTSMs. The availability of teacher guides was fairly high at 73%, and 70% for dictionaries. Since there was no prior measure
of these resources it is not possible to assess whether this represents an increase or not. That being said the significance and legal mandate
of LTSM provisioning was emphasised by the South African Humans Rights Council (SAHRC) in their charter of basic education rights
(South African Human Rights Council, 2012), which pronounced on the right to teaching and learning support materials and equipment.
According to the SAHRC, the responsibility for delivering this right lies with the national and provincial departments of education.
Table 3: Percentages for Essential Classroom Resources for South Africa in 2000 (SEACMEQ II)
TEACHING AND LEARNING MATERIALS EQUIPMENT & FACILITIES
20
00
Teach
er Gu
ide
(Read
ing
)
Teach
er Gu
ide
(Math
)
Dictio
nary
Ex
ercise Bo
ok
&
Pen
/ Pen
cil &
Ru
ler
Ow
n R
eadin
g
Tex
tbo
ok
s
Ow
n M
ath
Tex
tbo
ok
s
Writin
g B
oard
Learn
er Sittin
g &
Writin
g P
lace
Teach
er Tab
le &
Ch
air
Lib
rary (C
lass/
Sch
ool
Rad
io
% SE % SE % SE % SE % SE % SE % SE % SE % SE % SE % SE
Eastern Cape 68.8 9.23 66.8 9.75 66 9 65 5.4 42 5 42 4.8 95 4.9 88 4 79 8.2 54.1 10 16 6.7
Free State 78.3 14.67 59.8 15.02 61 15 69 5.7 61 9 49 12 85.1 14 97 1 92.8 7.2 51.7 15 73 13
Gauteng 81.3 9.6 90.5 6.75 93 4 81 6.3 55 11 51 12 97.8 2.2 100 0 93.3 4.7 77.1 12 46 15
KwaZulu-
Natal 85.8 7.63 66 10.97 77 9 77 5.4 40 7 40 7.7 96.1 3.9 95 2 91.3 6.2 84.2 7.1 47 10
Mpumalanga 61 14.13 58 14.12 36 13 48 11 45 8 35 6.5 100 0 97 1 85.1 9.1 36.5 14 92 7.8
Northern Cape 47.8 13.32 78.2 10.66 84 11 66 6.3 30 8 28 7.2 75.3 13 99 1 75.3 13 60.4 13 32 13
Limpopo 61.3 11.52 50.6 11.57 50 11 51 8.7 44 6 43 7.4 100 0 95 3 73.4 11 63.7 11 42 11
North West 55.4 14.35 54 13.8 66 14 77 6.4 35 6 25 6.5 100 0 97 1 82.4 11 56.3 14 57 14
Western Cape 84.7 10.47 84.7 10.47 100 0 71 6.9 49 11 37 9.2 100 0 98 1 100 0 100 0 70 14
South Africa 73.1 3.85 67.4 4.06 70 4 68 2.6 46 3 41 3 96.6 1.5 95 1 86.2 2.9 67.8 3.9 48 4.2
Source: (Moloi & Chetty, 2011)

31
31
It is important to be cognisant of the various seasons of development that accompany curriculum
change, and specifically, the LTSM provisioning models which complements each of these. Since
the dawn of democracy, this included the introduction of the Curriculum 2005 in 1997, the Revised
National Curriculum Statement in 2002, the National Curriculum Statement in 2006 and the
Curriculum and Assessment Policy Statement (CAPS) in 2012. A Ministerial Committee was
established in 2010 for Learner Teacher Support Material, largely to serve as a roadmap towards
the implementation of CAPS. The committee arrived at several recommendations which can be
summarised as follows: (i) develop a national LTSM catalogue, per grade and subject; (ii) a system
of nationally centralised ordering of LTSM, drawing on the school-based choice of LTSM. Sub-
recommendations relate to the key building blocks such as providing sufficient information for
decision making decentralised delivery and tracking; (iii) establishing a research and development
unit focusing on LTSM; and (iv) reconfigure the role of government and private companies in
LTSM provision (Department of Basic Education, 2010).
The DBE is mandated to develop the national catalogues of textbooks, while the responsibilities
of PEDs are to procure for schools in their provinces as well as to ensure that the procured books
are delivered to each school. The responsibility of monitoring lies with both the PEDs and the
DBE, with the DBE providing support and oversight to all PEDs. South Africa has traditionally
relied on the publishing industry for the development of textbooks while government maintained
the role of developing the curriculum. The centralisation of the development of the national
catalogue for textbooks, where emphasis is placed on the educational merit as well as compliance
to the curriculum of textbooks, was a major development and departure from this practice. In
addition, clause 11 of the Basic Education Laws Amendment (BELA) bill (Department of Basic
Education, 2017) seeks to amend Section 21 of the South African Schools Act (1996) to empower
the Head of Department to centrally procure identified learning support materials for public
schools – after consultation with the governing body, and on the basis of efficient, effective, and
economic utilisation of public funds. This amendment was introduced to bring about economies
of scale.
Based on the recommendations stemming from the Ministerial Committee for Learner Teacher
Support Material, the process began, in 2011, with the national catalogue for Grades 1-3 and 10;
Grades 4-6 and 11, in 2012 and, lastly, Grades 7-9 and 12, in 2013. The national workbooks remain
a vital means not only for improving access in the classroom to high quality texts with stimulating
graphics, but also serves as a resource for learners to take home. The national workbooks initiative
has been heralded as one of the most ambitious and most successful projects ever undertaken by
government. The number of workbooks, textbooks and study guides printed and distributed by just
the national government for the 2011 to 2013 school years was around 117 million. In addition, in
response to the Incremental Introduction of African Languages (IIAL), The DBE has developed
Grade 1 – 3 Second Additional Language (SAL) resources which include anthologies, workbooks,

32
32
lesson plans, big books, and posters in ten languages. These resources have been distributed to
schools that are implementing the IIAL.
The 2008 Foundations for Learning Campaign, gazetted (Department of Education, 2008) by the
then DoE, was another pivotal response to the right to resources, stating that “Every teacher must
have sufficient resources to ensure the effective teaching and learning of Literacy and Numeracy.
This should include wall charts, number and phonic friezes, writing materials, suitable apparatus
for teaching concepts, textbooks, reading series, workbooks and writing materials”. The policy
furthermore recommended minimum resources for Grades 1 to 6, categorised as resources for the
classroom, learners and the teacher in Literacy/Language and Numeracy/Mathematics. These
minimums were then extended to other grades. Generally these would comprise of textbooks,
workbooks, learner books and teacher guides. However, for the Foundation and Intermediate
Phases, these include graded readers, while in the Senior Phase these include a core reader for the
teaching of literature.
In order to supplement LTSM provisioning in response to concerns about the quality and
effectiveness of textbooks and poor learners’ performance throughout the system, in 2011, the
DBE developed and delivered the first set of workbooks for Grade 1 to 9 and Siyavula textbooks
for Grade 10 in Mathematics and Physical Science. These were intended to assist teachers and
learners directly in the classroom through the provision of worksheets; activities to reinforce
Language and Literacy, Mathematics and Numeracy and Physical Science skills; frameworks for
teachers to monitor learner performance; lesson plans; and an appropriate pace for curriculum
coverage. An independent formative evaluation of the workbooks and Siyavula textbooks was
undertaken by the Australian Council for Educational Research (ACER) starting in 2012. The key
findings of the evaluation (Department of Basic Education, 2013) are summarised as follows:
Learners, teachers and Heads of Departments (HoDs) indicated that workbooks are used
daily
Workbooks are seen as an effective teaching and learning tool but indicated that they see
it as supplementary to the textbooks and teaching notes they were already utilizing
Workbooks and textbooks are perceived to cover a sufficient range of activities
The sequence of teaching is largely aligned to the sequence of the workbooks
The independent researchers assessed the workbooks and textbooks against a quality rubric
considering a range of factors and concluded that they were of good quality.
Challenges for full utilisation included a lack of delivery or late delivery, the absence of a
user guideline, and insufficient teacher orientation to the workbooks and textbooks.
Even with the existence of these policies and guidelines, LTSM provisioning has been fraught with
poor and inconsistent access, receiving huge media coverage in 2012 following specific

33
33
shortcomings in Limpopo in that year. This led to several civil society campaigns and court cases.
A Presidential Task Team was established to verify the reported challenges in Limpopo. The
recommendations from the task team cited poor communication and coordination between
different stakeholders including schools, provinces and the DBE, a lack of comprehensive
monitoring and recording of LTSM provisioning and the lack of capacity to manage national
procurement and provisioning. The DBE accepted these recommendations. The matter was also
investigated by the SAHRC in 2013 (South African Human Rights Commission, 2013). The
SAHRC investigation focused on establishing the extent to which other provinces had the same
provisioning shortcomings as Limpopo. The recommendations were that an audit should be
undertaken to establish the logic framework of provisioning and identify specific gaps, a separate
investigation should be undertaken for provisioning learners with special needs, and monitoring at
the national level should be continuous and uniform, facilitated through an electronic system.
Subsequent business processes and polices that have supported LTSMs were developed and
strengthened following these 2012 challenges.
In strengthening monitoring from 2013, efforts were undertaken to standardise provincial textbook
provisioning functions and to provide oversight and support to provinces. This internal document
is known as the Basic Education Sector Management Plan for the Procurement and Delivery of
Textbooks. In line with this plan, the DBE receives regular written reports (quarterly or weekly)
from provinces on the progress in the provincial textbook procurement and delivery process and
also engages with provinces telephonically. A current tension is the different mechanisms for
LTSM procurement between Section 20 and Section 21 schools. Section 20 Schools receive books
through central procurement which includes advantages such as bulk orders made by the Provincial
Education Departments resulting in cheaper unit costs. Section 21 Schools have the right to
complete their own LTSM procurement, but this makes the monitoring of the quantity and quality
of materials a challenge. The average cost of the 2011 national catalogue textbook in the
Foundation Phase (Grades 1-3) was estimated at R 74.00, R60.62 for the Intermediate Phase,
R96.54 for the Senior Phase and R132.89 for the FET Phase.
The DBE has demonstrated commitment to ensuring that every learner and teacher has access to
the minimum set of materials required to implement the national curriculum. The “Action Plan to
2019” states that learners should be provided with a textbook for each subject and- the same
mandate is stipulated in the 2014-2019 MTSF. The baseline figure in the Action Plan for both
textbook and workbook provisioning was 61% in 2011 with the goal of 95% provision in
2018/19.The current figures for workbook provisioning are near 100% in delivery and coverage
as reflected in several research studies including the ACER evaluation mentioned above. The DBE
Annual Report for 2017/18 (Department of Basic Education, 2018) reflected that delivery of Grade
R and Grade 1 workbooks was at 100%. A total of 59,779,360 Volume 1 and 2 Grade 1-9
workbooks were printed and delivered to 23,712 public schools in all languages in
Literacy/Languages and Numeracy/Mathematics during the financial year. The first set of Braille

34
34
workbooks were provided to 22 special schools in 2017/18 for Grades 1 and 2 in Life Skills and
Mathematics. It is worth noting that this only refers to workbooks, not textbooks. The nationally
representative School Monitoring Survey 2017 confirmed the near universal provisioning across
provinces and quintiles. The figure below shows that workbooks have been accessible regardless
of the poverty status of schools.
Figure 15: Percentage of Grade 3 learners with Mathematics and Home Language workbooks 1 and 2 by quintile,
2017
Source: School Monitoring Survey 2017/2018
Access to textbooks has also seen improvements primarily through the development of the national
catalogue, the development of sound monitoring practices as well as the increased development of
state textbooks. National coverage of LTSMs excluding workbooks but including textbooks was
at 93% in 2016/17 (Department of Basic Education, 2017), exceeding the sector plan target for
that year, while retention and retrieval were at 85%. The development of state textbooks has
included the Siyavula textbooks mentioned earlier and is increasingly a focus with the latest
textbooks developed for Grade 12 Technical Mathematics and Science, Grade 1-3 Graded Readers
and Big Books (Department of Basic Education, 2018).
The Mind the Gap study guide series for Grade 12 learners has also proven to be a significant
development. Study Guides were initially produced in both English and Afrikaans for Accounting,
Economics, Geography and Life Sciences and then later expanded to a total of 25 subjects
(Department of Basic Education, 2017). Each study guide provides explanations of key
terminology, simple explanations and examples of the types of questions that learners can expect
to be asked in an exam. Model answers are included to assist learners in building their
understanding. The study guides also refer to specific questions in past national exam papers and
exam memos that are available on the Department’s website. Through a randomised control trial,
9296 97 97 98 9695 96 97 96 98 96
9296 94 96 99
9595 95 97 97 98 96
0
10
20
30
40
50
60
70
80
90
100
1 2 3 4 5 SA
Per
cen
tage
Quintile
Maths 1 Maths 2 Language 1 Language 2

35
35
(Department of Basic Education, 2013) the DBE measured the impact of the Mind the Gap study
guides. Learners who received the study guides in Geography scored 1.9 percentage points more
than they would have had they not received the guides. For Life Sciences the impact was 2.17
percentage points. Results in Accounting and Economics did not indicate statistically significant
differences between learners who received the study guide and those who did not. A simulation
exercise using NSC 2010 data demonstrates that 5,609 children who did not pass matric in 2010
would have passed matric had the Geography and Life Sciences study guides been distributed
nationally. This demonstrates the material significance and achievements of the sector as well as
the strategic importance of LTSM inputs into the sector, particularly in view of the situation
observed in the 1996 School Register of Needs.
The figure below shows a substantial increase in textbook provisioning across all provinces for
home language, first additional language and mathematics in grade 6; this is substantially higher
than the figures from 1996 or even from 2000. The national averages for these are above 80% in
all three subjects. However, these figures should be at 100%.
Figure 16: Percentage of Grade 6 learners per province with access to home language, first additional language
and mathematics textbooks (Indicator 4), 2017
Source: School Monitoring Survey 2017/2018
With regard to the use of technology for learning in the classroom, there have been significant
strides made by the DBE to produce digital learning materials. In particular, building on the
success of the national workbooks, the DBE has worked with partners to produce an even greater
variety of materials that can be freely copied and distributed. In addition, many of the national
workbooks have been converted to interactive digital materials and are in the process of being
piloted. The advantage of interactive materials is that it is easier for different learners to progress
at their own pace, assess themselves, and repeat specific tasks in line with their learning needs.
7583
96
86
7773
8489 90
84
73
83
97
8378
69
8591 88
8382 84
97
8780
71
88 91 9186
0
10
20
30
40
50
60
70
80
90
100
EC FS GT KZ LP MP NC NW WC SA
Per
cen
tage
Province
Home language First additional language Mathematics

36
36
However, the migration to such materials requires careful planning and testing, as well as ensuring
that teachers are adequately capacitated for their use.
2.4) Becoming better as a state to overcome the challenges in infrastructure
Despite the sustained interventions through the ASIDI and the EIG, there are still substantial
numbers of schools with unsafe facilities that do not comply with the Schools Infrastructure Norms
and Standards. The greatest publically cited challenge is the large number of schools with
undignified and unsafe pit toilets, as well as non-functional or inadequate sanitation infrastructure.
The latest sanitation audit (Department of Basic Education, 2018) reflects that there are currently
3 898 schools which still have pit latrines or another form of inappropriate sanitation. The figure
is largest in Eastern Cape at 1 598 followed by 1 365 in KwaZulu-Natal. It is not clear from the
audit how many learners are affected by this. When comparing this to the School Monitoring
Survey (Department of Basic Education, 2018) only 80% of schools nationally have access to
appropriate sanitation in line with the infrastructure norms. Confirming the sanitation report
findings, the lowest figures for compliance were found in Eastern Cape at 70% while the highest
was in Gauteng at 97%; when considered by quintile, the lowest compliance was in Quintile 1
schools at 75% while 94% of Quintile 5 schools complied. The urgency of responding to this
challenge particularly amongst less resourced provinces and lower quintiles has been highlighted
by recent deaths resulting from children using pit latrines. The response from the public and private
sector has seen the initiation of several public-private partnerships to fund these specific areas of
infrastructure. These include the recently launched Sanitation Appropriate for Education (Safe)
initiative by the President of South Africa and the Minister of Basic Education. In terms of
improving current practice there needs to be mechanisms in place for joint planning of common
programmes. That would save resources and avoid duplication of programmes and efforts.
Furthermore, system-wide and specific inhibitors for implementation by PEDs need to be
addressed. These include providing additional planning and monitoring tools and techniques aimed
at improving implementation of infrastructure programmes. This can only be possible with a better
understanding of the implementation issues in PEDs which can only be achieved through
strengthened monitoring.
The second challenge is poor maintenance of school infrastructure, which significantly contributes
to the early deterioration of new school infrastructure, in particular sanitation facilities. Poor
maintenance of education facilities is one of the well-acknowledged and most spoken about
problems on infrastructure delivery. The ongoing neglect exposes learners to danger, de-motivates
educators and costs the state more as buildings deteriorate further and collapse. While there is a
wide coverage of maintenance related requirements of public assets legislatively and in the general
literature, maintenance of facilities, particularly in the public sector, remains one of the most
elusive infrastructure interventions. Challenges associated with poor upkeep and maintenance
arise in new and old facilities alike, although the nature of these challenges and their extent may
differ. The strengthening of this area through embedding routine monitoring and evaluation as an

37
37
integral part of planning and building is necessary. Furthermore, the current information systems
should be updated to enable the availability and use of better information and better monitoring of
the implementation of the norms and budget for maintenance at the school level through funds that
have already been allocated. Finally, vandalism and theft have also been contributing factors in
the dilapidation of schools infrastructure. This requires ownership and improvements in
community collaboration so that schools are seen as community assets.
While sanitation continues to be an issue, the availability of classrooms to enable policy
compliance in learner-teacher ratios should receive equal attention. According to the infrastructure
norms and standards, there should be a classroom for every 40 learners enrolled in the school in
Grades 1 to 12 and a classroom for every 30 Grade R learners. According to the School Monitoring
Survey (Department of Basic Education, 2018) only 67% of schools complied with this standard.
The lowest compliance was in North West at 53% and 55% in Mpumalanga. Classroom adequacy
was highest in quintile 5 primary and secondary schools at 84% and 91% respectively and lowest
in quintile 3 schools at both the primary, at 61% and secondary schools at 58%. Addressing class
size particularly amongst poorer schools would arguably create the required environment for more
equitable learning and teaching conditions.
Further, there are several implementation challenges which are largely related to the poor services
offered by implementing agents. For example, during the 2017/18 financial year, the DBE
experienced challenges with contractors who were either not qualified to do the job, or were
liquidated at some point during the year. (Department of Basic Education, 2018). Poor contractor
performance in many provinces, and the time consuming procedures to replace contractors also
contributes to under-expenditure. The DBE has identified the needs for improved record
management, information sharing, administrative procedures, and planning in the area of
infrastructure provisioning at the levels of the school, province and nationally.
The access and provisioning of LTSMs demonstrate sustained and consistently improving efforts
to fulfil the minimum guidelines and policies both in letter and spirit. There have also been efforts
to assess the quality of the resources as well as usage, although these have been harder to measure.
The current areas of work remain as improving the quality of LTSMs through revisions of the
national catalogue but with a greater emphasis on specifications on graded readers in African
languages. The expected quantity of provision of these in home language and English requires
revisiting based on developments in the understanding of resources needed for effective teaching
as well as benchmarking against material resourcing in Quintile 5 schools. A further area to guide
the quality of LTSMs may be developing more detailed guidelines on the content for African
language material especially in the Foundation Phase.
The efforts to develop state textbooks is an area of development which would allow for further
reduction of costs through state owned content as well as economies of scale through centralised

38
38
provincial and national textbooks where publishers produce resources. The tension in procurement
responsibility between Section 20 and Section 21 materials is an area that should continue to be
reviewed.
The quality of workbooks should continue to be reviewed and considered, particularly as this
seems to be the main resource used in the Foundation Phase. The manner in which they are used,
as the core Foundation Phase material rather than a supplementary resource may require rethinking
of the content, structure and sequence. This may entail the provision of extended reading texts to
offer learners a range of texts at the individual level, considering the current limited graded reader
provisioning.
Further, the introduction of ICTs is a complex area of innovation. Technologies are continuously
changing, there are many stakeholders involved and the cost-benefit dynamics are complex. There
is a need for a national strategy to clarify the following: (i) how technological innovations should
be aligned to the aim of improving learning outcomes; (ii) what are the available technologies and
their likely costs and benefits; and (iii) how different stakeholders should work together to promote
e-education (Department of Basic Education, 2015).
Output 3: Improving assessment for learning to ensure quality and efficiency
in academic achievement
3.1) Problem statement
The benefits of improved education quality are wide-ranging, however, despite the progressive
funding regime, prioritisation of public investment in social services and the expansion in
schooling access over the past two decades, low and inequitable levels of learning outcomes still
prevail in South Africa. The World Development Report 2018 highlights that education systems
have little systematic information on who is learning and who is not, and as a result, it is impossible
to generate an impetus for action, or simply plan (World Bank, 2018). Measuring progress in
learning outcomes is, therefore, an essential part of monitoring development at a country-level in
the education system, and this provides the rationale for strengthening efforts to better measure
progress through assessments.
The rise of evidence-based and accountability-focused reforms also provides a reason for the
increased interest in measuring the quality of learning outcomes. In addition, the NDP calls for a
‘reliable system-wide measure’ of learning outcomes in primary schools to target support to
schools and advance school-level accountability and planning in general (National Planning
Commission, 2013). This call in the NDP is translated through the Sub-Outcome 3 in the MTSF:
“Regular annual national assessments to track improvements in the quality of teaching and
learning, ANA”.

39
39
The sector plans provide an extended discussion on the importance of assessment; both in the
initial Action Plan to 2014: Towards the Realisations of Schooling 2025 and the latter version,
Action Plan to 2019: Towards the Realisation of Schooling 2030. Though innovation is needed in
many areas of the basic education sector, the ANA, and e-education have been selected as
innovation priorities. The consistent availability of assessment data at the learner level across
selected subjects underpins several Action Plan goals. The importance of assessments is also
reflected as one of four outputs, “Output 2: Undertake regular assessments to track progress” in
the Minister of Basic Education’s Delivery Agreement with the President.
While Sub-Outcome 3 of the MTSF places a strong emphasis on the ANA, this chapter reflects on
the full assessment journey in the last 25-years. Assessment as a tool for improving teaching and
learning has evolved over the last 10-years, and important lessons have been learnt which will help
shape the way forward. Measuring progress in learner outcomes is essential for monitoring
development at a country-level. It provides the rationale for strengthening measurement through
assessment.
3.2) Achievements and journey since 1994
Democratic South Africa inherited a racially differentiated education system, with 19 different
departments of education, each maintaining different standards and administering its own
examinations (The Presidency: Republic of South Africa, 2014). Further, the only systemic
assessment instrument in the pre-Apartheid system was the Grade 12 (matriculation) examination
(Muller, 2004), which was inconsistent in quality, had little emphasis on school-based formative
assessments, and was administered in different forms in the various departments using a
fragmented curriculum framework (Lubis & Murphey, 2002).
With the birth of the new political administration in 1994, the 19 education departments were
integrated into a single national Department of Education which was tasked with establishing a
single national examination system - with common content and common standards for
examinations, administration, moderation, analysis, and certification. The African National
Congress’s (ANC’s) Policy Framework for Education and Training articulated for democratic
South Africa in 1994 advocated for a comprehensive and integrated system of assessment to be
introduced in the democratic dispensation (ANC, 1994). The policy proposed a new national
qualification system, and radically sought to introduce a General Education Certificate (GEC)
which marks an exit point/completion of general education (10 years of schooling). Further, the
policy insisted that the three-year post-compulsory stage (up to the current Grade 12) should be
redesigned in order to provide for a variety of options leading to the award of a Further Education
Certificate, intended to replace the Grade 12 Senior Certificate. The GEC was not implemented,
however, consultations are underway to consider future implementation (Department of Basic
Education, 2014).

40
40
In South Africa, examinations which occur at the end of twelve years of schooling have been
administered for a long period of time before the dawn of democracy and was largely used to select
candidates for post-schooling opportunities. From 1994, the provincial administration of the Grade
12 Senior Certificate examination was effected as a feature of the education system.
Between 2000 and 2007, provincially based examinations still took place, but standardised and
centrally developed common papers were introduced for the Grade 12 Senior Certificate - initially
for high enrolment subjects, and expanded to all subjects in 2008 through the National Curriculum
Statement. With the introduction of the National Curriculum Statement (NCS) in 2008, the
Department of Education took responsibility for setting all Grade 12 examination papers, with
well-documented processes and procedures which are standardised in order to provide improved
reliability, validity and a minimisation of assessment bias. This also enables a fair comparison of
performance across provinces.
The standard of the NSC has improved and is generally measured against the quality of the
question papers developed. The DBE has benchmarked the NSC question papers and qualifications
against international institutions. Particularly, in 2007, 10 NSC subjects were benchmarked against
those of the Scottish Qualification Authority (SQA), Cambridge International Examinations (CIE)
and the Board of Studies in New South Wales (BSNSW) Australia. In 2011, 7 subjects were
benchmarked with the SQA, CIE, BSNSW and Higher Education South Africa (HESA). In 2016,
10 NSC subjects were benchmarked with Universities South Africa (USAF) and 2017, 6 subjects
were benchmarked with CIE. There is a consensus among these institutions that the questions are
well designed by international standards and do assess what they purport to assess. The three
international assessment bodies have also confirmed that the content assessed by these questions
are in the main, comparable to the CIE, SQA, and BSNSW (Department of Basic Education, 2017).
The 2017 Grade 12 examination results point towards a long-term trajectory with far more youths
having access to a school qualification which enables them to participate meaningfully in the
economy. Since the advent of democracy, South African schools have become more inclusive with
far more learners remaining in school till Grade 12. By 2016, around 58% of the youth were
successfully obtaining the NSC or an equivalent qualification from a college (Department of Basic
Education, 2017). As illustrated in the figure below, the number of learners obtaining what was
colloquially known as “Matric” or formally known as the NSC today, increased from around
275 000 in the late 1900s to over 400 000 in recent years.

41
41
Figure 17: The number of students obtaining the ‘Matric’, 1994 – 2016
Source: Department of Basic Education (2017) National Senior Certificate Examination Report
In addition, the number of learners attaining a Matric which would allow them to study for a
Bachelors degree has grown even more (in percentage terms) than the number of learners attaining
a Matric. In particular, whilst the number of Matrics grew by around 50% over the period under
consideration, ‘Bachelors-level’ passes grew by around 100%.
An analysis of Grade 12 mathematics and physical science examinations data in 2016 (adjusted
for slight fluctuations in the levels of examination difficulty across years) reveals an increase in
the number of learners reaching critical performance thresholds, such as marks of 50, 60 and 70
percent in either subject. This is depicted in the figure below. In addition, the number of black
learners obtaining a mark of 60 in mathematics increased by as much as 65%, reflecting that this
trend has been towards diminishing racial inequalities. The DBE has also initiated the Second
Chance Programme which provides support to learners who have not met the requirements of the
NSC or extended Senior Certificates.

42
42
Figure 18: 2008 to 2016 Grade 12 mathematics and science trends
Source: Gustafsson. M (2017) An update on improvements in schooling outcomes in South Africa, Addendum to
report on progress in the schooling sector against key learner performance and attainment indicators (August 2016)
In addition to the NSC, examinations have also been supplemented by large-scale sample-based
surveys of educational inputs and learning outcomes. Of particular importance are the three
international assessments South Africa participates in, which are the Trends in International
Mathematics and Science Study (TIMSS) in Grade 8 mathematics and science conducted in 1995
and 1999, Grade 8 and 9 in 2002, and Grade 9 2011 and 2015 – South African also participated
in TIMSS Numeracy in Grade 5 in 2015; the Southern and Eastern African Consortium for
Monitoring Educational Quality (SEACMEQ) for Grade 6 reading and mathematics conducted in
2000, 2007 and 2013; and the Progress in International Reading and Literacy Study (PIRLS) in
Grade 5 conducted in 2006, 2011, and following on from 2011, PIRLS 2016 in South Africa
included the Grade 4 learners taking the pre-PIRLS assessment and sub-populations of Grade 5
learners (learners writing in Afrikaans, English and isiZulu) participating in PIRLS as
benchmarking participants (Howie, et al., 2017).
The TIMSS 2015 results confirmed noteworthy growth patterns, which when compared with other
countries since 2003 at the Grade 9 level, South Africa has shown the largest improvement.
However, South Africa is still one of the lower-performing countries in mathematics and science
in comparison to other TIMSS participating countries. Average performance in the public school
system and among historically weaker provinces have clearly improved, but most Grade 9 learners
are yet to achieve a minimum level of competency in mathematics and science (Zuze, Reddy,
Visser, Winnar, & Govender, 2017).The SEACMEQ IV study results further affirmed the upward
trends and showed that for the first time, South African learners at the Grade 6 level achieved
Reading and Mathematics scores above the significant centre point of 500 points. More
importantly, the largest gains were evident within the historically disadvantaged sections of the
school system, that is, quintiles 1-3 schools.

43
43
The response of Government to low, but improving, achievement levels in the cross-national and
regional studies, particularly TIMSS and SEACMEQ, has been to conduct regular national
assessments at key stages. Since 1994, the Department of Education has made use of two types of
national assessments to report the results of learner performance. Following on the designs of the
cross-national and regional studies, the first type involved Systemic Evaluations (SE) conducted
on a five-year cycle on random samples of public schools at either Grade 3, 6 or 9 (Department of
Basic Education, 2014). This became a six-year cycle for on grade only (Grade 3). The SE was the
pre-cursor of what emerged as the Annual National Assessment (ANA) in 2011.
The ANA was introduced in 2011 in Grades 3 and 6 and in 2012 Grade 9, and were based on a
similar framework to the previously conducted systemic evaluations, but targeted a more
diagnostic interpretation of learner achievement. One important aim of the ANA programme was
to measure learner performance in a standard manner, so that comparisons across schools, districts
and provinces, and over time, become possible. The Universal ANA, which was conducted in all
schools in the country, was primarily focused on providing information to teachers, parents, and
schools for use in improving learning and teaching practices.
The introduction of ANA was seen a significant milestone in the education sector, as it sought to
provide valuable information on the performance of the system at the level of the school, district,
and province, as well as provide useful information on the performance of the individual learner,
which is meant to be used to identify critical areas of weakness, and subsequently develop relevant
interventions for improving teaching and learning in schools. In essence, it served as an
accountability tool at the national level, as well as lower levels to a large extent, and played a more
diagnostic role at the ground level. The Action Plan to 2019 in discussing innovations in
assessments focussed on better test design, scoring and feedback approaches in the ANA
programme.
The ANA programme was discontinued in 2015 due to disagreements between education
departments and teacher unions over the purpose and way forward for the programme.
Government favoured gradual design improvements without suspending the programme, however,
teacher unions favoured suspending the programme until the redesign had been completed. During
the four years in which the ANA as implemented, it played a major role in bringing to the fore the
quality of learning and teaching in the national debates, as well as at the local level. School
principals, parents and district officials were able to compare the quality of learning in schools –
in particular, primary schools, in ways which had not been possible previously. However,
following an intensive evaluation of the strengths and weaknesses of ANA (Department of Basic
Education, 2016), stakeholders have agreed that there were specific problems in the design of ANA
– problems which should be avoided in the future.

44
44
The ANA is now, however, evolving into what is known as the National Assessment Programme
(NAP)8 which is using a sample-based systemic evaluation tool to measure progress and report
against indicators. The NAP is comprised of three tiers, namely: (i) The Systemic Assessment,
which will be sample-based, and administered in Grades 3, 6 and 9, once every three years - this
will provide the Basic Education Sector, especially those involved in planning and evaluation, with
valuable data on the health of the system and trends in learner performance; (ii) The Diagnostic
Assessment, which will be administered by teachers in the classroom to identify learning gaps,
and to plan remedial measures early in the learning process, so as to avoid learning deficits; and
(iii) The Summative Assessment, which will be a national examination, administered in selected
grades (with an emphasis on Grade 9) and subjects to provide parents and teachers with a national
benchmark to measure the performance of their children. It will also be used for
promotion/progression purposes (Department of Basic Education, 2017).
The new national assessment system is currently under development and is planned to be
administered in 2019 for the first time. However, this will at least initially be conducted in a sample
of schools, which will serve certain important national and provincial monitoring and evaluation
functions, but there remains a need for better information and accountability for learning at a
school level. In time, it may be worth including a universal summative assessment to one primary
school grade and then using innovative school report cards to share the information with parents
and school communities. Over time, a lot has been learnt in terms of assessment systems. These
learnings have facilitated the development and improvement of the national system as a whole,
and will continue to do so as the system evolves.
The significant role of Umalusi, the Council for Quality Assurance in General and Further
Education and Training needs to be acknowledged since its establishment in 2002. The main
functions of the assessment unit are to set standards for assessment of qualifications on the General
and Further Education and Training Qualifications Framework and to ensure that assessment for
certification in schools, Further Education and Training Colleges and Adult Education and
Training Centres is of the required standard.
3.4) Becoming better as a state to overcome the challenges in assessments
The United Nation’s Sustainable Development Goals (SDGs) formalised a strong global
commitment to tracking progress over time in the learning outcomes of children, and to having
evidence inform education quality interventions. The SDGs were adopted by United Nations
members in 2015 and the SDG indicators in 2017. A key indicator in relation to assessments is
“4.1.1. Proportion of children and young people (a) in grades 2/3; (b) at the end of primary; and
8 What has previously been referred to as the National Integrated Assessment Framework (NIAF) has, since 2019,
been referred to as the National Assessment Programme (NAP)

45
45
(c) at the end of lower secondary achieving at least a minimum proficiency level in (i) reading and
(ii) mathematics, by sex” – there is a clear need for innovations to monitor progress against this
indicator.
Above all, a world-class national assessment is required to gauge whether the desired
improvements in learning outcomes are being achieved. This needs to involve sophisticated
planning and management, specifically in relation to sampling, test design, using secure anchor
items which are repeated across years, and generating meaningful reports which bring about better
education policy discourse. Note that effective assessments improve teachers’ ability to teach, and
provide vital information for managers in the system to take action and be held accountable.
The lessons from the recent past need to be carefully considered if innovative ways of tracking
progress in learning outcomes are to be realised – in particular, the weaknesses in the design of the
ANA. These include the limited comparability over time of the ANA results – a critical issue if
progress is to be monitored, and an insufficient use of contextual and background information
when results were presented. The absence of a clear policy stating the overall role of ANA was
arguably at the heart of disagreements between departments and teacher unions. It was not clear
how information emerging from the ANA should, and should not, be used to inform programmes
and hold various actors accountable.
The NAP will also include the re-introduction of the sample-based Systemic Evaluation as a focal
tool for measuring progress and reporting against national targets and the SDG target on learning
proficiency. A key strength of the Systemic Evaluation was that it included background
questionnaires administered to learners, teachers, the school principal, and in some cases to
parents. This allowed for reporting on learning outcomes relative to socio-economic context.
However, there were also problems which the Systemic Evaluation which should not be repeated.
The time lag between assessments of the same grade were long and the depth of analysis in the
national reports was insufficient. Many of these problems can be traced to limited capacity to run
assessments.
The NDP’s call for reliable measures of learning outcomes for every primary school requires both
technical and societal innovations which need to be carefully managed. Accountability
mechanisms, such as school report cards should be informed by the experiences of other countries
and tailored to the South African context, while also being carefully negotiated with teacher
unions. School-level reliable measures should be taken into consideration together with the socio-
economic background of the school in order for accountability to be seen as being fair and
effective. In addition, the burden of ‘assessment overload’ in schools should be avoided. The
observation made by the 2009 curriculum implementation review (Department of Basic Education,
2009), that there was too much ‘layering’ brought about by different layers of administration
running similar initiatives in parallel, is to some extent still a problem.

46
46
In addition, the Grade 12 pass rate has been subjected to mounting criticism, since the pass rate
used refers to candidates obtaining the NSC divided by all candidates, which can be widely
distorted by differences across schools in terms of who becomes a candidate i.e. those who make
it to Matric and do not drop out before. There is an innovation need in relation to how statistics are
presented and used, something which the DBE’s new inclusive basket of NSC indicators is
intended to address.
Output 4: Expanded access to ECD and improvement of the quality of Grade
R, with support for pre-Grade R provision
4.1 Introduction/ Problem Statement
The early years of a child’s life are critical for the acquisition of concepts, skills and attitudes that
lay the foundation for lifelong learning. These include acquiring language, perceptual and motor
skills required for learning to read and write, basic numeracy concepts and skills, problem-solving,
self-regulation, executive functioning and a love of learning. Internationally, the importance of
early childhood development (ECD) is signalled through the priority focus that the Sustainable
Development Goals (SDGs) have placed on quality care. Explicit mention is made in SDG Target
4.2 which states that by 2030 countries should: ‘ensure that all girls and boys have access to quality
early childhood development, care and pre-primary education so that they are ready for primary
education’.
In line with the SDG goal, South Africa has placed an equal importance on ECD through the
National Development Plan (NDP), the Medium Term Strategic Framework (MTSF) 2014 – 2019
and the Action Plan to 2019: Towards the realisation of schooling. The NDP outlines the vision
for ECD in South Africa as high quality, universal ECD for the two years preceding Grade 1. In
order to achieve this vision, the NDP emphasises the need for increased resources in the sector, as
well as increased investment in training ECE practitioners. The Action Plan concretises the NDP
through making “Improved access of children to quality Early Childhood Development below
Grade 1” a specific goal. To ensure that the Department of Basic Education (DBE) systematically
moves towards achieving this goal, the MTSF measures four indicators pertaining to both the
access and quality of ECD provided through Grade R.
Early childhood development in South Africa applies to all children from birth to nine years of
age. Until 2019 the Department of Social Development has been responsible for the overall
oversight and coordination of ECD until the child enters formal schooling, whereas the Department
of Basic Education has been responsible for Grade R – 12. South Africa’s commitment to
expanding access to ECD for five-year-olds, through the provision of Grade R, has been a
remarkable achievement over the past 25 years, with participation rates more than doubling over
this period. However, considering the policy imperatives laid out by the NDP, Action Plan and

47
47
MTSF, two main policy pressures stand out. Firstly, the quality of Grade R needs to be
strengthened and secondly, access should be expanded so that all children can eventually have
access to the year of education preceding Grade R. Both these priorities require particularly
complex planning, specifically in terms of physical and human resource management.
4.2) Journey since 1994: Early Childhood Development Policy
Policy formulation for ECD in South Africa started in the early 1990s as one of the focus areas of
the 1992 National Education Policy Investigation (NEPI, 1992). Drawing on the recommendations
of this investigation, the 1994 ANC policy framework for Education and Training included ECD
as a separate component (ANC, 1994). This has meant that ECE was recognised as a key element
in the process of reconstruction and human resource development. The 1995 White Paper on
Education and Training recognised early childhood as the foundation for human development and
committed Government to provide free and compulsory schooling, starting at the reception year
for 5-year olds. For children aged zero to four years, the White Paper prioritised the development
of a strategic plan for inter-sectoral collaboration (Department of Education, 1995). This
collaboration was incorporated into the National Integrated Plan for ECD zero to four years,
published in 2005 (Department of Education, Department of Health, Department of Social
Development, 2005).
Following the Integrated Plan, the National Early Learning Development Standards (NELDS)
were developed and released in 2009. The NELDS is a curriculum-related policy initiative
focusing primarily on the early learning needs of children from birth to four years and provides
early learning standards expressed as desired results, indicators and competencies of expected
learning achievements for young children in a designated age range (Department of Basic
Education, 2009).
More recently, in 2015, the DBE released the National Curriculum Framework (NCF) for children
from Birth to Four. The NELDS and the NCF from Birth to Four provide guidance for the design
of early learning programmes. The NCF builds on the NELDS, taking account of the norms and
standards in the Children’s Act and the Department of Social Development Guidelines for Early
Childhood Development Services. It also indicates the relationship with the Curriculum and
Assessment Policy Statements (CAPS for Grade R).
Finally, during the same period, the 2015 National Integrated Policy for Early Childhood
Development was developed and released. The policy incorporates the goals highlighted in the
National Development Plan and clarifies the roles and responsibilities of the departments
collaborating in the delivery of ECD services (Department of Social Development, 2015). The
policy is aimed at transforming ECD service delivery in South Africa, in particular, to address
critical gaps and to ensure the provision of a comprehensive, universally available and equitable
early childhood development services. The policy covers the period from conception until the year

48
48
before children enter formal school or, in the case of children with developmental difficulties and
disabilities, until the year before the calendar year they turn seven, which marks the age of
compulsory schooling or special education.
4.3) Achievement: Participation in Early Childhood Development (ECD)
programmes and Grade R
Over the last decade, the main ECD policy priority for the DBE has been providing Grade R to all
five to six-year-old children. This policy was implemented in 2001, with the target of making
Grade R compulsory for all children of the appropriate age by 2010. As described in the section
on trends in educational outcomes, General Household Survey (GHS) data illustrates that trends
in the overall participation rate of five and six-year-olds has increased substantially. The
proportion of five-year-olds attending an educational institution has increased dramatically from
about 40% in 2002 to just under 90% in 2016. Disaggregating the trends by province show that
Limpopo had the highest percentage of five to six-year-olds that participated in educational
institutions in 2016, whereas KwaZulu-Natal had the lowest percentage.
Another way to analyse participation in ECD is to look at those learners in Grade 1 who attended
Grade R. The method used to calculate the number of learners who attended Grade R entails
dividing the number of Grade 1 learners who reported that their highest grade attained is Grade R,
by the number of Grade 1 learners whose highest Grade attained is reported as being either Grade
R or ‘No Schooling’ in the GHS. Using this method, it is evident that in recent years we have
witnessed a fairly constant percentage of Grade 1 learners who have attended Grade R and it has
remained above 90% across the past eight years (Figure 22).
Figure 19: Percentage of learners in Grade 1 who attended Grade R, 2009-2017
Source: Department of Basic Education, General Household Survey (GHS): Focus on Schooling 2016
97.1 94.8 95.0 92.2 94.9 94.8 94.8 93.9 94.4
0.0
10.0
20.0
30.0
40.0
50.0
60.0
70.0
80.0
90.0
100.0
2009 2010 2011 2012 2013 2014 2015 2016 2017
Pe
rce
nta
ge

49
49
To gain a better understanding of the ECD of learners younger than five years old, the GHS
questionnaires ask parents with children in this age group whether their children attend day-care
centres, crèches, playgroups, nursery schools, a day-care-mother or gogo, or pre-primary schools.
Figure 23 shows that the attendance of ECD programmes among four-year-olds had been
increasing over time with a small drop in the participation rate in 2015. A part of this drop can be
ascribed to the questionnaire change in 2015, which entailed the addition of a specific module on
ECD which asked households with individuals younger than 6 years old which institution their
child is attending.
Figure 20: Percentage of 4-year-olds attending ECD facilities, 2009-2017
Source: Statistics South Africa, General Household Survey (GHS), DBE own calculations
A further priority for the DBE has been the training of practitioners in terms of the implementation
of the NCF, as well as upgrading the qualifications of Grade R practitioners. The DBE started to
monitor and support the training of Pre-Grade R practitioners towards NQF Level 4 from 2014.
The provinces were given a mandate of training the Pre-Grade R practitioners, and by March 2019
20,102 Pre-Grade R practitioners have at least obtained a NQF Level 4 ECD qualification.
4.4) Challenges: Quality of Service Provision
It is evident that there has been a remarkable expansion in the provision of Grade R in South
Africa. However, in the same way that increasing access to education is no guarantee for an
increase in learning (Pritchett, 2013), a place in Grade R does not automatically boost the requisite
early learning skills.
An impact evaluation of the introduction of Grade R was conducted in 2013 and showed that Grade
R does indeed improve learning in both mathematics and in the home language. The results,
30.432.8 35.0 36.5
44.748.3
45.7
53.1 51.4
0.0
10.0
20.0
30.0
40.0
50.0
60.0
70.0
80.0
90.0
100.0
2009 2010 2011 2012 2013 2014 2015 2016 2017
Per
cen
tage
50
50
however, indicated that the effects of attending Grade R were quite small and also differentiated
across the system. On average, the effect found was equivalent to only 6% of a year of learning in
mathematics and 25% for home language. These effects were also the strongest in the traditionally
stronger provinces and wealthier schools, particularly in quintile 5 schools. Learners attending
schools that have the largest deficits (quintile 1 to 3 schools) unfortunately did not gain as much
by attending Grade R, indicating that the quality of Grade R provision is critical to learners
benefiting from the additional year of schooling (Department of Planning, Monitoring and
Evaluation, 2013). This evaluation, considered the period 2005 to 2011 and ever since important
quality enhancement initiatives have been implemented, including the introduction of the Grade R
workbooks.
The findings of this impact evaluation point to problems of implementation in the quality of Grade
R, despite the great success with access and roll-out. Although many factors influence the quality
of pre-school or Grade R provision, the evaluation suggest that there are two key quality
dimensions that may differ across the different parts of the system. The first relates to teacher
training, the quality and support they receive from both the department and their schools, their
qualifications and the pedagogical rigour of these, and their knowledge of how children learn and
how to facilitate learning through structured play in order to achieve Grade R learning outcomes.
The second quality dimension pertains to the curriculum, and specifically, practical curriculum
guidelines and standards, and confidence in teachers’ knowledge and understanding of the
curriculum. That is, the practical implementation of ‘how’ to achieve the learning outcomes
stipulated in CAPS (Department of Planning, Monitoring and Evaluation, 2013).
It is currently not possible to gain a clear sense of the qualifications of Grade R practitioners which
are employed in schools. However, in considering the policy of extending ECD to two-years before
Grade 1, it is necessary to gain a realistic picture of the current ECE practitioners.
Using data from the 2013 ECD audit, Figure 24 illustrates the distribution of ECD practitioner
qualifications by province. It is evident that almost half of ECD practitioners nationally have not
completed Grade 12, and that a further third of practitioners have obtained Grade 12, but has no
further qualifications. Only 2% of ECD practitioners have any post-matric qualifications, and only
1% have a degree. Although the same pattern exists across the provinces, it is clear that certain
provinces (Northern Cape, Eastern Cape and Western Cape) have a slightly larger proportion of
practitioners (at least 20%) who have some post-school qualifications compared to the other
provinces. With regards to ECD practitioners’ specialisation in early childhood care and education,
the picture is even bleaker with roughly 70% of practitioners nationally, not having any specialised
training in working with children. This proportion decreases to 50% in provinces such as Western
Cape, Northern Cape, Eastern Cape and KwaZulu-Natal, with practitioners being more likely to
have a certificate specialising in ECE than in the other provinces. Given these percentages, it is
clear that ECD practitioners are mostly un- or under-qualified individuals and lack the knowledge

51
51
and skills necessary to provide children with the required cognitive and physical stimulation at that
critical age.
Figure 21: Practitioner Qualifications by Province
Source: 2013 ECD Audit data. DBE own calculations
Notes: The majority of responses under the category “Other” mention the attendance of some training received
through an NGO.
To address the quality in practitioner training concern, the new Policy on Minimum Requirements
for Programmes Leading to Qualifications in Higher Education for Early Childhood Development
Educators was published in March 2017 (Department of Higher Education and Training, 2017).
The purpose of the new Policy is to establish a set of qualifications for prospective or existing
ECD educators who are delivering or assisting in delivering ECD programmes. Each of the
qualification types specified by the Policy involves a work-integrated learning component which
should take place in an ECD environment where registered programmes are offered. The new
Policy also introduces a Bachelor of Education in Early Childhood Care and Education Degree
which will equip graduates with the required knowledge, theory and methodology to enable them
to demonstrate competence and responsibility as academically and professionally qualified ECD
educators.
Tied to the low levels of qualification among practitioners, wages and benefits for ECD
practitioners are also particularly low in South Africa. This, in turn, contributes to a host of
problems that impact the quality of services, such as high turnover rates and low educational levels
among teachers. ECD centres are currently funded through fees charged and subsidies from the
Department of Social Development. ECD practitioner salaries are then paid from this funding. .
Using the 2013 ECD Audit data, it is possible to get a rough indication of the average hours that
practitioners work as well as the daily income that practitioners earn. Assuming that ECD
practitioners do not work shifts, the operating hours will constitute a teachers’ work hours. Using
this information, it is evident that the average ECD practitioner works nine hours a day. The
0%10%20%30%40%50%60%70%80%90%
100%
< Grade 12 Grade 12 ABET Level Other Post-matric Degree

52
52
questionnaire further asked staff members to state their monthly gross salary.9 The minimum
monthly salary reported by an ECD practitioner was R 500 per month, whereas the highest salary
was R 6 100 per month. On average, ECD practitioners reported receiving a monthly salary of R
1 431. The average daily wage is calculated by dividing the average monthly salary by the average
number of working days per month (20 days). This results in an average daily wage of R 71.55 per
day for the average ECD practitioner.
The final challenge lies in the lack of credible information systems relating to ECD. This challenge
is two-pronged, characterised with weak information for both monitoring and planning purposes,
as well as deficient information on learners’ early learning outcomes. Nationally agreed upon sets
of indicators exist. What does not appear to exist is collation at one national point (this could be
either the Department of Basic Education or the Department of Social Development) of key figures
from the provincial reports, together with some commentary on the validity and comparability of
the provincial statistics. This need not be a costly process, but it is one that could greatly assist
planning and the policy discourses relating to ECD. The lack of standardised measures of early
learning outcomes further means that both practitioners and researchers do not have any
information to measure the quality of programmes or to determine whether learners are sufficiently
prepared to start Grade 1. Quality measurement tools which can be used by practitioners and
provinces to self-assess would add immense value in targeting support to where it is most needed.
In 2018 the DBE has embarked on a process to develop a standardised measure to evaluate early
learning outcomes. It is envisaged that this tool would enable provinces to better target their
training initiatives to ensure that practitioners are confident in preparing children for schooling.
Grade R and ECD practitioners are in a unique position to develop the fundamental skills and
knowledge that children will need for the transition into the first years of formal schooling,
regardless of whether the children come from impoverished or wealthy environments.
Practitioners, therefore, have the potential to make an invaluable contribution to the early
development of children and it is imperative to ensure that they have the training, tools and
motivation to undertake this task.
9 Generally in household or labour market surveys, questions regarding salary levels are not very well answered, since
respondents often do not report accurate figures, or the more wealthy respondents refuse to answer the question. In
the 2013 ECD Audit data no outlier responses were given, but 25% of assistant practitioners and 22% of practitioners
did not respond to this question. The response rate, however, was lower for ECD principals and supervisors, where
40% did not respond to this question. Given the low response rates of principals and supervisors, the average daily
salary of only the ECD practitioners in particular were calculated.

53
53
Output 5: Strengthening accountability and improving management at school,
community and district level
5.1) Introduction/ Problem Statement
The fifth sub-outcome in Basic Education’s Medium Term Strategic Framework is “Strengthening
accountability and improving management at school, community and district level” (Department
of Basic Education, 2016: 18). This outcome envisages a credible, outcomes-focused planning and
accountability system and aims to build the capacity of the state to intervene and support quality
education.
Although learning happens in classrooms throughout the country as learners engage with teachers
and their peers, the extent to which this interaction can happen effectively is influenced by the
quality of support provided by the state in numerous ways and at various levels – legislation,
policies and plans and the way these are implemented by national, provincial and district-level
administration as well as within schools themselves.
Research shows that the quality of administrative support provided to schools matters. A paper by
Gustafsson and Taylor (2018) found that the quality of support provided by provincial education
departments had a significant impact on National Senior Certificate examinations results. It was
possible to measure this by looking at schools which experienced a change in their provincial
department as a result of provincial boundary changes that occurred in 2006. Schools moving to a
better administration improved by more than nearby schools remaining in the original province.
When the capacity to support quality education is limited, the impact of otherwise good policies
and programmes is restricted. For example, an impact evaluation of the Grade R programme found
that the effect of attending Grade R on later learning outcomes was negligible in Quintile 1-3
schools located in less well-performing provinces (Van der Berg, et al., 2013). Similarly, it has
sometimes been argued that the effectiveness of additional resources to schools may depend on
the quality of school management (Van der Berg S. , 2008). For these sorts of reasons, many feel
that the main challenge now is about effective implementation rather than about new or better
policies (for example, OECD, 2008).
One particular challenge to navigate in the area of state capacity to support education is related to
the fact that, according to the constitution, national government and provincial governments are
concurrently responsible for the provision of basic education. This leads to coordination challenges
and makes good planning systems imperative. There are six specific concurrent functions:
1. Curriculum and assessment management and delivery.

54
54
2. Supply, monitoring and professional development of education personnel.
3. Provision of teaching and learning support materials and equipment.
4. Leadership and management at school, district and head office level.
5. Financial management at school and provincial level.
6. Provision and management of physical infrastructure.
The challenge to improve state capacity is well recognised in the National Development Plan as
well as basic education sector plans (the Strategic Plan and the Action Plan). The Action Plan to
2019 has specific goals around improving school management practices and about the quality of
district support provided to schools.
5.2) Achievements and journey since 1994:
When South Africa became a democracy, it inherited a racially fragmented education system,
comprising thirteen different departments organised along racial lines with vast inequalities
throughout the system. Funding was disproportionally allocated according to race. At the height
of apartheid, government was spending nine times more on white learners than on black African
learners in homelands. As a result of this poor and unequal support offered to schools, the
education of black Africans was characterised by low quality and limited resources evidenced in
high learner-teacher ratios, inadequate infrastructure and ill-prepared teachers.
Therefore, a vast amount of policy development work had to be done in the early years of
democracy to reform public spending on education, the school curriculum, and the ways in which
a unified Department of Education would operate and coordinate around concurrent
responsibilities with provincial education departments. There are three key pieces of legislation
governing basic education that have been passed and amended since 1994: the National Education
Policy Act of 1996 (NEPA), the South African Schools Act of 1996 (SASA) and the Employment
of Educators Act of 1998 (EEA). The development and subsequent amendments of this legislation
as a key component of the state’s capacity to support quality education represents an important
achievement within the sector.
The NEPA specifies the responsibilities of national and provincial education departments. The
Minister is given the authority to set standards for the provision of education as well as to monitor
and evaluate the sector. This latter role of the national department is one which may not have
received sufficient attention up till now but one which creates an imperative for a key aspect of
building state capacity to implement quality education through strengthening accountability and
coordinating the work at provincial, district and school management levels. The NEPA has been
amended several times (1997, 1999, 2007, 2011, 2016), culminating with the Policy on the South
African standard for principals in 2015.

55
55
The SASA ascribes rights and responsibilities to schools and the duty of parents to send their 7-15
year-old children to school. The rights and rules about school funding and management is
important to note, especially the 2006 amendment on national norms and standards for school
funding. The EEA prescribes the Ministers right to determine salary scales and the MEC’s
responsibility to announce a set of posts for each school. One area of current debate that will have
important implications for effective school management surrounds whether to reduce the
responsibilities of the School Governing Body relative to the employer (the PED) when it comes
to appointing senior managers in schools.
Education spending is one key enabler through which the state has capacity to support education
provision. Government has demonstrated considerable prioritisation of education in the budgets
ever since 1994, spending between 5 and 6% of GDP on education. Historically, there were
massive differentials in spending on children from different race groups. Analyses of fiscal
incidence (Gustafsson and Patel, 2006; Van der Berg, 2009) have demonstrated that most of these
spending differentials had been eliminated by 2000 and that there were virtually no spending
differentials remaining by 2005. Since then, the picture has become even more pro-poor with the
introduction of non-fee paying schools, which receive considerably higher per learner funding
allocations than fee-charging quintile 4 and 5 schools. General Household Survey data shows that
by 2016 approximately two-thirds of children attending schools were not paying fees. Personnel
spending, however, has not been pro-poor given the salary scales and post-provisioning policies.
A case could potentially be made to investigate ways to make personnel spending more progressive
either through lowering learner-teacher ratios in non-fee paying schools or through targeted
support staff, such as specialist reading coaches which have been shown to positively impact on
learning outcomes.
The introduction and development of an Education Management Information System (EMIS) in
the late 1990s was an important component in building the capacity of the state to monitor and
support education provision. In particular, the Annual Schools Survey and the SNAP surveys were
run for the first time in 1997 and these have provided critical system information. More recently,
the development of a Learner Unit Record Information Tracking System (LURITS) has increased
the analytic capability of the state. This has also allowed the department to share its information
with other government departments like Home Affairs and Social Development to improve other
forms of support available to children.
The capacity of the state to monitor the quality of education provision has also benefited from the
regular participation in highly respected independent international assessments. Our participation
in the Trends in International Mathematics and Science Studies (TIMSS) of 1995, 1999, 2003,
2011 and 2015, and in the Progress in International Reading Literacy Study (PIRLS) of 2006, 2011
and 2016, and in the Southern and East African Consortium for Monitoring Education Quality
(SEACMEQ) surveys of 2000, 2007 and 2013, have revealed alarmingly low levels of learning

56
56
outcomes in South Africa but has also empowered us with information about what is happening in
our schools and potential ways to address the shortcomings. More recently, the School Monitoring
Surveys of 2011 and 2017 have collected information linked to the various goals and indicators
contained in the DBE’s Action Plan to 2019. Human capacity within the ten departments to use
data has probably also increased in recent years, but here much still needs to be done.
Improving accountability systems within schools is an area that needs considerable attention, but
there are certain points of progress that can be noted. The Integrated Quality Management System
(IQMS) has gradually expanded and strengthened since its inception in 2003, and has an important
role to play in promoting teacher professionalism. The 2012 national IQMS report, the first of its
kind, indicated that within schools there is some degree of differentiation in the way teachers are
rated. The majority of teachers are in schools where at least two of the four IQMS levels were
assigned to teachers, whilst a quarter are in schools where three different levels were assigned.
This is relevant to note since the IQMS ratings are based largely on self-assessments, though peers
at the school influence the final rating. This means that school leaders can be aware of which
teachers have the strongest need for further professional development, which is a prerequisite for
effective teacher development programmes.
A prerequisite for a capable state and an effective accountability system is good planning through
government. The production of the National Development Plan, through an extensive process of
research and consultation, represents a significant step towards effective planning. The NDP sets
strategic direction for the Medium Term Strategic Framework and the DBE’s sector plan, known
as the “Action Plan”, The first “Action Plan to 2014” was developed in 2011 and was followed up
by the “Action Plan to 2019”, which had extensive continuity from the first Action Plan. These
plans are also based on a rich process of research and consultation, and commit the department to
very specific goals with measurable indicators allowing for the tracking of progress.
Following on good legislation, policies and plans, an effective accountability system requires good
monitoring and evaluation systems. Whilst various information systems for monitoring have
already been mentioned above, it is worth highlighting the development of the National Evaluation
System (NES) by the Department of Planning, Monitoring and Evaluation (DPME), in which the
DBE has been an active participant. Through the NES, which was developed since 2011, the DBE
has evaluated a number of key programmes (the Grade R programme, the National Schools
Nutrition Programme, and the Funza Lushaka Bursary Programme, amongst others). It is only in
recent years that the value of programme evaluation for ensuring better use of government
resources is being recognised.
In bringing to a close this section on the achievements of the last 25 years with respect to the
capacity of the state to provide quality education, it is worth considering what factors contributed
to the improvements in quality that were observed through the TIMSS, PIRLS and SEACMEQ

57
57
assessments. Although there is no research that has been able to convincingly demonstrate what
caused the improvements, the DBE has suggested at least three plausible factors: (1) better access
to books amongst learners (something which was a clear policy priority with for instance the DBE
Workbook programme and which can be observed in TIMSS data), (2) strong signals sent out
through standardised testing about the centrality of acquiring basic skills (even if the ANA testing
system was imperfect), and (3) more suitable curriculum documents following the introduction of
the Curriculum and Assessment Policy Statements (CAPS). All three of these factors can be
considered elements of the state’s capacity to support schools.
5.3) Challenges and how to improve:
This section considers the challenges and areas for improving accountability and capacity to
support education provision at the levels of school, district offices, provincial education
departments and the national department. An overarching theme is that learning is the core
business of the education system and, therefore, that there needs to be accountability and capacity
specifically to support learning.
A first point to note is that if the system is to be orientated around learning one should start by
measuring learning, as the 2018 World Development Report has argued. The NDP recommends
externally administering a national assessment for at least one primary school grade in all schools
so that there is a reliable measure of performance available for each school. The NDP also
recommends providing meaningful information to parents about school performance. This forms
part of a proposal in the NDP to create a results oriented mutual accountability between schools
and communities. Whilst the Annual National Assessments (administered in all schools for grades
1-6 and 9 between 2011 and 2014) were by no means perfect in their implementation, they did
serve a basic function of communicating to all school communities that learning outcomes matter
and providing a measure of learning at each school in the country.
A new national assessment system is currently under development and is planned to be
administered in 2019 for the first time. However, this will at least initially be conducted in a sample
of schools, which will serve certain important national and provincial monitoring and evaluation
functions, but there remains a need for better information and accountability for learning at a
school level. In time, it may be worth including a universal summative assessment to one primary
school grade and then using innovative school report cards to share the information with parents
and school communities.
The South African Schools Act assigns important school governance and leadership functions to
School Governing Bodies (SGBs), which comprise representatives of both school staff and
parents. A 2016 report by a Ministerial Task Team to investigate allegations about the selling of

58
58
educator posts by members of teacher unions pointed to serious weaknesses and corruption linked
to promotion posts in many SGBs, and consequently recommended reducing their powers to
appoint level 2 posts and above.
One of the Action Plan indicators is the percentage of SGBs meeting minimum functionality
requirements (being correctly comprised, meeting regularly, etc.). Although this indicator seems
to have improved from 54% of schools in 2011 to 62% in 2017, improving the functioning of
SGBs should remain one important part of improving the capacity of schools to support quality
education.
Another critical aspect of school capacity relates to the appointment of school principals. A lot of
research as well as the NDP highlight the crucial role that principals play as managers and as
curriculum leaders within schools. Research by Wills (2015) points to the large impact of a new
principal on school academic performance and shows that a large number of South African
principals are approaching retirement, which means we are now entering a window period during
which many new appointments will need to be made. In light of this, the recently published ‘South
African standard for school principals’ is an important contribution in that it provides, for the first
time, a statement of the competencies required of a school principal.
However, one of the commitments within the NDP and the DBE’s Action Plan has not yet been
implemented, namely competency assessments for school principals to ensure that everyone who
is appointed into a school principal post fulfils at least the minimum requirements for this job. This
has been delayed by negotiations with teacher unions about how it will be implemented. It remains
an important opportunity for improving capacity at the school level through better principal
appointments and more informed support to existing principals.
One of the indicators in the DBE’s Action Plan is the percentage of schools with the required set
of management documents. The 2017 School Monitoring Survey indicates that only 31% of
schools had the full set of required management documents. Whilst this may be a rather
compliance-oriented indicator, what is concerning is that one of the most commonly missing
documents was an academic improvement plan, which may reflect a lack of focus on learning
outcomes as the core business of schools.
The first level of external support and accountability to schools is the education district offices,
and the smaller area offices and circuits. Two indicators of the quality of district-level support to
schools are explicitly targeted in official plans, namely the percentage of schools receiving at least
two visits from district officials in a year, and the percentage of school principals who are satisfied
with the quality of district support.

59
59
According to the School Monitoring Surveys of 2011 and 2017 the percentage of schools receiving
at least two visits a year has been roughly constant at 86% (2011) and 84% (2017). In 2017, 78%
of principals rated the quality of district support as satisfactory. However, key components of
district support may still be lacking. For example, the proportion of Foundation Phase teachers
receiving curriculum-specific support is considerably lower, especially in certain provinces, due
to very high ratios of Subject Advisors to schools. There is also a need to strengthen the capacity
of district officials to effectively use data for their planning, monitoring and evaluation purposes.
The NDP envisages strengthening of the two-way accountability between districts and schools.
Districts need to provide support and services which schools find useful, and schools need to
account to districts for the quality of schooling offered to the community. Moreover, two-way
accountability between schools and parents are also needed. Schools need to report in better ways
to parents on how well children learn, and parents need to demonstrate that they provide support
in the home. These lines of accountability are crucially dependent on having reliable measures of
learning outcomes in schools which everyone can use to gauge progress.
While schools are accountable through various means to districts and provincial authorities, there
is a need for a holistic school accountability framework to bring together the various strands, and
identify critical gaps. Existing accountability elements include the annual school improvement
plan, each school’s annual report, the increasing use of SA-SAMS, and the Whole School
Evaluation (WSE) programme10 run in certain provinces.
A recent internal DBE analysis of expenditure trends suggests that there appear to be fairly
substantial within-quintile and across-district inequalities in expenditure and concludes that in
Eastern Cape these are large. This reflects that some districts are less successful than others in the
filling of posts. This boils down to a matter of district as well as provincial management capacity.
The administration of post provisioning is a provincial function, yet it may require improved
monitoring and guidance from the national department. A Deloitte review conducted in 2013 found
that a lack of clarity around how national policy applies led to undesirable differences across
provinces in the way post-provisioning is applied.
10 Whole-school evaluation is the cornerstone of the quality assurance system in schools. It enables a school and
external supervisors to provide an account of the school’s current performance and to show to what extent it meets
national goals and the needs of the public and communities. This approach provides the opportunity for acknowledging
the achievements of a school and for identifying areas that need attention. Whole-school evaluation implies the need
for all schools to look continuously for ways of improving, and the commitment of Government to provide
development programmes designed to support their efforts

60
60
Another important provincial function is to ensure that schools receive the correct allocation of
non-personnel funding. This is especially important for non-fee paying schools which receive
considerably higher per learner allocations than quintile 4 and 5 schools and are highly dependent
on these allocations in the absence of school fees. Analyses of School Monitoring Survey data
suggests that the percentage of schools actually receiving the allocated amounts may have
decreased slightly from 75% in 2010 to 70% in 2017. Where schools do not receive the full
allocated amount, this probably reflects the overall financial pressures on the basic education
sector, which are exacerbated by weak financial management in certain provincial departments.
The majority of education spending and implementing responsibilities lie with the provincial
education departments. It is not surprising, therefore, that the quality of provincial education
administration matters for schooling outcomes (Gustafsson & Taylor, 2018). A cursory reading of
the Auditor-General of South Africa’s provincial reviews indicates that except for the Western
Cape and Gauteng, most provinces have serious problems of financial mismanagement, which
have adverse effects on service delivery, and that education departments tend to feature strongly
in the reported problems.
There is much that can be done at the national level to support better implementation of policies
and programmes in provinces. This includes better guidance around and monitoring of norms and
standards, outcome targets and indicators. Beyond monitoring, there is a need for more technical
capacity to design, implement and evaluate programmes. The DPME’s recently developed
guidelines for new implementation programmes is a step in the right direction to reduce poorly
designed and hastily implemented programmatic responses. Government departments such as the
DBE are expected to adopt these guidelines thus committing to careful diagnostic analysis, costing
exercises, piloting and evaluation of new programmes.
Perhaps one of the most strategic areas where better monitoring work at the national level is
required is of education expenditure trends. A 2017 DBE internal analysis revealed some fairly
dramatic recent trends in education expenditure, but such analyses need to be conducted more
regularly and more widely understood. A number of findings from this analysis deserve mention.
Over the last few years, there have been substantial declines in educator numbers at the same time
as increases in enrolment numbers. Enrolment increases, which have occurred largely as a result
of an increase in births of around 10% in the years 2003 to 2005, have been concentrated at the
primary level, but are moving up the grades and have begun affecting secondary schools in 2018.
The consequence of these trends is that learner-educator ratios have increased 2012, with schools
serving poorer communities having had the largest increases.
Though the current (non-capital) budgets of the provincial departments have grown slightly in real
terms (using the official consumer price index) since 2013/14, and are expected to continue to

61
61
grow in the next few years, this growth is too slow to keep up with the price inflation of the inputs
used in education, in particular personnel, whose price increases are based mainly on wage
agreements.
In response to these budget pressures some provinces have responded by filling fewer promotion
posts. As a result, the number of people in school management posts declined by 8% between 2012
and 2016. This is bound to have a detrimental effect on school management at schools.
These trends illustrate the importance of sufficient education expenditure and the value of
understanding such trends for policy-making, something which needs to become more widespread.
Figure 22: Learner-educator ratios 2000 - 2016
Source: DBE internal analysis using SNAP survey data 2000 - 2016
Clearly, better monitoring of trends in expenditure, education personnel, and learner enrolments,
partly through improved data systems, is needed. Detailed recommendations are laid out in a 2017
report on data use in the schooling sector conducted as part of National Treasury’s Financial
Management Improvement Programme.11 This report recommends, inter alia, that steps be taken
to increase connectivity in South African schools, to improve the digital competency of school
administrators, and ensure that a new web-based South African School Administration and
Management System (SA-SAMS) follows standard systems development procedures. However,
the report also cautions that human capacity is critical to the sustainable functioning and use of
good data systems. It is also important that the primary users of systems such as SA-SAMS (school
principals and administrators), experience these systems as beneficial to their work rather than
11 This report titled, “Final summary report for the schooling sector data use project”, is not publicly available.

62
62
merely as a burden undertaken for the sake of compliance. A report by the Dell Foundation
suggested that the use of SA-SAMS could be significantly improved to inform planning and
decision-making within schools and district offices, instead of merely being used to submit school
data to PEDs.
Significant growth has been reported in the use of SA-SAMS by schools, as well as better
organised provincial and national warehousing of SA-SAMS data. The Data Driven Districts
(DDD) initiative, involving education departments, developed by the New Leaders Foundation
with support from the Dell Foundation and other stakeholders has provided valuable lessons on
harnessing technology in the sector. The DDD dashboard provides data and information down to
individual learner levels, thus giving School Management Teams as well as district and provincial
officials essential information to give learners the support they need. The 2017 School Monitoring
Survey indicates that outside the Western Cape, usage of SA-SAMS by school principals has been
high – at least 97% in six provinces, with a slightly lower 94% in KwaZulu-Natal and 86% in
Gauteng. The Western Cape has historically used its own provincial system for housing school
information. The fact that 58% of principals using SA-SAMS said that they used it for financial
management indicates that the management functionality of the tool, as opposed to simply using
the data collection functionality has become a reality (Department of Basic Education, 2019).
A number of responses to the need for better capacity are clearly needed, including better
monitoring activity. However, in doing so there may be a risk of overburdening officials and
imposing compliance-oriented accountability systems that end up distracting from core functions.
Examples of these dangers include teachers spending more time uploading assessment records in
the correct format than on tailoring their teaching in response to those assessment results, district
officials responsible for curricular support ending up being consumed by administrative
engagement with schools, or provincial officials responsible for monitoring and evaluation being
primarily driven by pleasing the Auditor-General. The sector would benefit from a shared
understanding of planning, monitoring and reporting processes between the ten education
departments, the DPME (custodian of the NDP) and the Auditor-General (which audits reporting
on performance indicators and targets). These processes can be extremely time-consuming, are
fraught with technical and coordination challenges, and can ultimately distract from the core
functions of education departments. Some of the risks and unintended consequences of these
systems include the narrow pursuit of certain indicators (e.g. Grade 12 pass rates), the contradiction
of ambitious long term targets (for political considerations) but “safe” short term targets (for audit
considerations), or the removal of educationally important objectives from planning processes due
to the risk of adverse audit findings.

63
63
Output 6: Partnerships for educational reform and improved quality
6.1) Problem statement
Education in South Africa is founded on the premise of a ‘social compact’ between the different
spheres and departments of government, higher education institutions, teacher unions, teacher
training institutions, parents and School Governing Body (SGB) organisations, business and civil
society organisations, and local and international agencies, governments and donors. Outcome 1
of government, “Improving the quality of basic education”, can only be realised through
committed partnerships that are well coordinated. The strength of these partnerships has direct
implications for whether the goals of education may be realised and how soon this may happen.
The Medium Term Strategic Framework (MTSF) 2014-2019 recognises the strategic significance
of partnerships, highlighting ‘partnerships for a strong education system’ as one of its six sub-
outcomes. The sub-outputs of this outcome focuses on ensuring support, monitoring and learning
from collaborations and partnerships with the independent and voluntary sector, while also
emphasising on the National Education Collaboration Trust (NECT) delivering against its
approved plan.
The sector plan for Basic Education, Action Plan to 2019: Towards the Realisation of Schooling
(Action Plan 2019) also places an emphasis on partnerships, for example, through better
partnership between the departments of Basic and Higher education (DBE and DHET), Higher
Education Institutions in policy, and teacher training programmes; and places an emphasis on
funding disadvantaged learners and responding to the challenges of poor learning outcomes.
6.2) Achievements and journey since 1994
The private sector’s engagement in the education sector in South Africa has deep historical roots
which are linked to the key role that education plays in the country’s social and political
transformation, and in providing the critical skills required for economic growth. A number of
public-private partnerships have been established over the years to address the schooling system,
whereby corporations and their affiliated foundations have invested significantly in the sector
through interventions to support the system as well as through supplementary parallel activities.
An example of a civil society organisation that demonstrated the corporate sector’s contribution to
education pre-democracy was the Urban Foundation. The Foundation was established in 1976 after
180 business leaders gathered and pooled resources from 80 corporations to provide housing and

64
64
schools for poor communities. This was in response to the student demand that led to the 1976
Soweto Uprising12. The organisation was, however, closed in 1995.
Three local organisations stand out as pivotal partnership mechanisms during, or soon after the
transition to democracy. The first is the Joint Education Trust (JET) established in the early 1990s.
JET was a partnership between trade unions and black political organisations established to support
the democratically established government to coordinate efforts in education and serving as a
centralised mechanism between corporates, trade unions and political organisations. Since 1992
JET has spent over R1 billion on education programmes (Besharati, 2015). The second is the South
African Grant-Makers Association (SAGA), established in 1995 at the transition to democracy
with a budget of R1. 2 million. Unfortunately, it was closed in 2006 due to a lack of funding. The
organisation’s membership consisted of 80 members from corporates, foundations, trusts, private
foreign grant-making organisations, and local and international statutory bodies (Legodi & Leat,
2001). One of the main contributions of SAGA was a set of “guidelines for good grant- making”,
publishing a donor directory and the development of training on philanthropy for corporates. The
third is the National Business Initiative (NBI), established in 1995 by former President Nelson
Mandela to support government. The membership consists of about 100 national and multinational
companies and focuses on housing, local development, schooling and further education and
training.
In addition to domestic support, following the 1994 elections, international donors had largely
shifted their focus away from civil society – preferring to formulate bilateral and multilateral
agreements with the new government. Overseas (official) development assistance (ODA) to South
Africa was seen to be increasing between 1994 and 1997 – peaking at R3.8 billion.. The main
reasons cited for the increase was a focus on strengthening government’s ability to transition at
the start of a democratic South Africa. Between 1995 and 1998, South Africa’s largest multilateral
donor, the European Union, targeted the Reconstruction and Development Plan. Specific areas of
priority included health, education, and good governance. The decline in funding from 1999 has
been attributed to the international community’s growing confidence about South Africa’s ability
to govern and fund its own programmes and policies. However, it is important to note that the
ODA mentioned above supports a range of sectors, and is not only targeted to education.
In light of the various partnership mechanisms, the DBE has consolidated the coordination of
partnerships through the establishment of a Partnerships Directorate at the national level. The
directorate is mandated to close the gap of inequalities in education and supporting the DBE by
sourcing, negotiating and managing funding and sponsorships directed to the department;
12 On June 16 1976 15 000 young people marched against the Apartheid government in opposition to the language
policy as well as other educational inequalities (Marjorie, 1982; Grundlingh and Huigen, 2011). They marched in
opposition to the language policy proposing the use of Afrikaans in additional subjects as well as other educational
inequalities.

65
65
coordinating and monitoring local donor funded education projects and partnership programmes –
both nationally and provincially; and developing and facilitating feasible partnership business
plans and monitoring respective spending. These programmes are situated and implemented in
various branches of the DBE. The Directorate has developed norms, guidelines and protocols to
standardise and formalise partnerships in the sector. For internal use, partnership frameworks and
internal protocols have been developed to assist DBE officials in understanding what constitutes a
partnership and how to initiate and manage a partnership within the DBE. To enhance external
engagements partnership implementation protocols for public institutions and organisations have
been developed.
The DBE has adopted a multidimensional approach to partnerships, including the following non-
mutually exclusive pillars: (i) volunteering and technical capabilities; (ii) monetary support
through purely financial contributions; (iii) focus on priority pillars through monetary and non-
monetary contributions to key DBE programmes, such as infrastructure, teacher development,
curriculum support, early childhood development, school safety, school sport and enrichment
projects, the National School Nutrition Programme as well as Special Ministerial Projects, such as
the National Teaching Awards, Mandela day, the annual announcement of Matric Results and
disaster relief in schools; (iii) research, innovation and support; and (iv) advocacy.
The enabling environment for the partnerships directorate within the department is facilitated
through the NDP, MTSF and Action Plan, as well as the National Economic Development and
Labour Council (NEDLAC) Accord on Basic Education and the establishment of the National
Education Collaboration Trust (NECT). The NEDLAC accord on Basic Education was signed in
2011 by leaders of organised labour (including Cosatu, Fedusa and Nactu), Business Unity South
Africa, Community Constituency, and the Minister of Basic Education on behalf of government.
The accord is aimed at galvanising South Africans to support all schools, especially poor-
performing schools, in the pursuit of quality basic education outcomes.
In the 2013/14 financial year the contribution of domestic partnerships was R42 million mostly
towards the National School Nutrition Programme and the provision of mobile libraries,
benefitting approximately 560 000 learners across the country. In 2016/17 the estimated
contribution of partnerships had more than doubled to approximately R113 million. The figure for
2017/2018 was the highest to date at R277 million. The table below provides a breakdown of
funding received in 2017/18 and how this has been allocated.

66
66
Table 5: DBE Partnerships funding in 2017/18
Areas of focus Number of schools Number of learners Total funded
Literacy interventions 527 304 706 R 64 469 340.00
School enrichment interventions 204 13 424 R 9 547 201.15
Educational support interventions 788 546 597 R 203 101 674.00
Totals 1519 864 727 R277 118 215
Source: DBE Annual Report 1 April 2017 – 31 march 2018
The NECT was established in 2013 and is intended to strengthen partnerships within civil society
and between civil society and government in the basic education sector. The scope of work for the
NECT has been set out in an Education Collaboration Framework (ECF) which was developed in
consultation with government and social partners seeking to influence and support the
implementation of the education reform agenda. The ECF was a response by civil society in the
education field to government’s call for collaboration to accelerate the pace of national
development, in accordance with the NDP. The NECT’s point of departure is that government and
civil society have different but complementary roles to play in relation to education. The provision
of basic education for the general population is the responsibility of the government which is
uniquely equipped to fulfil this overarching mandate. Civil society, with its diversity and
flexibility, is able to support government by innovation and accelerated delivery. Civil society
becomes more relevant and more influential when channelling its efforts in a coordinated way into
the national education system. The NECT, therefore, receives financial support from a range of
funding partners, including government, business and philanthropic trusts and foundations. It
channels its efforts into six themes for collective action i.e. (i) professionalisation of the teaching
service; (ii) supporting courageous leadership; (iii) improving government capacity to deliver; (iv)
involving parents and communities in education; and (v) enhancing support from learners and
promoting their well-being.
The NECT’s footprint has reached five provinces i.e. Limpopo, Mpumalanga, North West,
KwaZulu-Natal and the Eastern Cape through the provision of Structured Learning Programme
toolkits and has reached all nine provinces through the Primary School Reading Improvement
Programme (PSRIP) which focuses on improving the teaching of English as a First Additional
Language (EFAL), specifically reading – reaching close to two-thirds of the national education
system (National Education Collaboration Trust, 2019). Four years since its inception, the NECT
has reached 14 769 schools and trained 600 Subject Advisors across 24 districts (National
Education Collaboration Trust, 2018).
In 2018, the NECT received approximately R260 million which increased from approximately
R117 million received at inception. The table below provides a breakdown of the income and the
respective sources of revenue between 2014 and 2018.

67
67
Table 6: NECT funding amounts and sources, 2014-2018
2014 2015 2016 2017 2018
Income (ZAR) 116 532 852 186 542 790 182 774 681 275 582 398 259 582 398
Sources of
Income
Government &
SETAs
67% 65% 47% 51% 60%
Business 31% 31% 39% 22% 24%
Foundations and
Trusts
2% 4% 9% 6% 3%
Special Projects 5% 21% 12%
Source: NECT Annual Report 2017
Notes: The contributions from Labour and other sources of income are not documented since constitute less than 1%
The significant contribution to the education sector through Corporate Social Investment (CSI)13
needs to be acknowledged. In 2018, the total estimated CSI expenditure was R9.7 billion – a 2.5%
real increase from the R9.1 million estimated spend in 2017 (Trialogue, 2018). Across several
development sectors, education received support from 92% of companies and received 44% of
CSI expenditure in 2018. School-level education i.e. general education and training and further
education and training received 50% of education spend, while tertiary education received 29%
and early childhood development received 18% (Trialogue, 2018). Bursaries, scholarships and
university chairs continues to be the most popular type of education intervention supported by
corporates, receiving 24% of education spend. Additional learner programmes received 19%,
infrastructure, facilities and equipment received 15% while teacher development received 12%.
National Association of Social Change Entities in Education (NASCEE) was established in 2018
as a voluntary member-based collaborative structure of education non-profit organisations
(NPOs), which are working towards maximising the contribution of NPOs towards the NDP goals
relating to education. The main objective of the Association is to build a high quality equitable
education system for all South Africans by forging a strong collaboration between education
NPOs; setting up networks; strengthening the capacity of education NPOs; promoting and raising
awareness of the work of education NPOs; and advocating for quality education by harnessing the
knowledge and information from the sector to influence education policy (National Association of
Social Change Entities in Education, 2019).
At a continental level, a particularly noteworthy development has been the strengthening of
regional and continental partnerships for education. South Africa has been a member of the
Association for the Development of Education in Africa (ADEA) since 2006. ADEA is a policy
13 CSI spend is based on data from the 74 large companies that participated in Trialogue’s primary research survey.

68
68
dialogue forum meant to improve coordination amongst development agencies and the continent.
Similar efforts have been undertaken through collaborations with the Southern African
Development Community (SADC) and the African Union. The specific funding mechanisms and
a pooling of financial resources is not mentioned as a common practice, however, this may be an
important area for further coordination.
Partnerships and funding received from international donors are managed by the International
Relations and Grant Implementation, Monitoring and Reporting Chief Directorate in the DBE.
Internationally, the European Union has continued to provide support to the DBE. One of the main
financing agreements was negotiated and signed in 2010, entitled Primary Education Sector Policy
Support Programme (PrimED SPSP). The agreement was intended to offer sector budget support
in line with the basic education sector plan. The total cost of the programme was €122 680 000
(estimated at R1 216 450 000). The overall objective of the programme was to contribute to
improving learner performance in literacy and numeracy at primary school level. The programme
strengthened fundamental elements of the General Education and Training Programme with a
special focus on expanding access to quality Early Childhood Development (ECD) opportunities,
especially for poor communities; effective implementation of the Curriculum; and attracting and
ensuring appropriately qualified and competent teachers in all learning areas at all levels, with
special focus on scarce skills. The emphasis of the PRIMED SPSP was to support initiatives that
demonstrate innovative approaches and create an enabling environment for development and skills
transfer. The final tranche of funding was disbursed in 2015 and the agreement concluded in 2017.
In addition, the United Nations also provides support to the DBE, largely through a rolling work-
plan with the United Nations Children’s Fund (UNICEF). With the acknowledgement that
significant progress has been made in improving access to education, UNICEF’s support to the
DBE is centred on improving learning outcomes through improving the quality of education,
reducing inefficiencies and inequity in the system and promoting innovation. There are three
components of the programme i.e. Early Childhood development; quality education and adolescent
development.
Furthermore, in terms of international partnerships, the DBE has established bilateral agreements
with several countries, including China for the teaching of Mandarin in South African schools, and
Cuba for the recruitment of Cuban Mathematics and Science specialists, focusing on teacher
training and support material for the DBE. Other partner countries with which the DBE has
bilateral agreements include Venezuela, France, Angola, Sri Lanka, Korea and the United States
of America. The DBE also has a range of multilateral agreements with organisations such as the
World Bank, Japan International Cooperation Agency, and United States Agency for International
Development (USAID).

69
69
6.3) Challenges and how to improve:
The sector has successfully built on the legacy of collaboration and partnerships, with more
organisations involved than before. The funds committed and the increase in these over time
demonstrates a sustained shared responsibility for delivering quality education. The coordinating
mechanisms and funding from local and national partners has also increased considerably.
The improved coordination and standardising processes within the DBE, through the establishment
of the Partnership Directorate, is an important development in the Department. However, there are
internal coordination mechanisms within the department which need to be improved. In particular,
between the Partnerships Directorate which deals with national partners and the International
Relations and Grant Implementation Monitoring and Reporting Chief Directorate – which have
different mandates.
An area that could be enhanced would be greater specification of areas that require funding through
systematic reviews of current and possible programmes with clearer alignment to the basic
education sector plan. There is also generally a gap in evaluating the implementation or impact of
the various funded programmes, reporting generally focuses on inputs. By establishing a culture
of evaluating rigorously, the DBE could use the lessons learnt to inform future programmes and
inform the selection of priorities.
There is also a need for better information sharing to establish funding coalitions in specific areas
and leverage the allocated funds by pooling them together. The same applies to the activities and
efforts of civil society in the sector. The balance between the role of the DBE, funding the DBE
directly through existing mechanisms, such as the Partnerships Directorate, and funding the NECT
should be carefully balanced to achieve maximum impact in the sector without creating
competition. A better account for areas of work and distinction between what the DBE delivers
compared to the NECT is important.
Finally, the establishment of bilateral agreements across different countries and continents
provides an opportunity to learn from other education systems, however, the exact activities and
modus operandi has not been clear. It is also not always clear how best to collaborate across
governments in a way that responds to South Africa’s educational priorities.

70
70
Bibliography
ANC. (1994). A Policy Framework for Education and Training. Discussion Document.
Johannesburg: Education Department African National Congress.
Atmore, E., Van Niekerk, L., & Ashley-Cooper, M. (2012). Challenges facing the early
childhood development sector in South Africa. Johannesburg: National Development
Agency.
Besharati, N. (2015). Private sector investment in South Africa's education sector: nature, extent
and incentives. JET Education Services.
Department of Basic Education. (2007). The Educator Post Allocation Model: Challenges by
province. Pretoria: Department of Basic Education.
Department of Basic Education. (2009). National Early Learning Development Standards for
Children Birth to Four Years (NELDS). Pretoria: Department of Basic Education.
Department of Basic Education. (2009). Report of the Task Team for the Review of the
Implementation of the National Curriculum Statement. Pretoria.
Department of Basic Education. (2009). Teacher supply patterns in the payroll data. Pretoria:
Department of Basic Education.
Department of Basic Education. (2010). National Education Policy Act of 1996. National Policy
for an Equitable Provision of an Enabling School Physical Teaching and Learning
Environment. Gazette No. 33283. Notice 515.
Department of Basic Education. (2010). Report of the Ministerial Committee for LTSM.
Department of Basic Education. (2013). Formative Evaluation of Workbooks and Textbooks
Technical Report. Pretoria: Australian Council of Education.
Department of Basic Education. (2013). Report on the National School Monitoring Survey .
Department of Basic Education. (2013). Technical Report: Developing and Evaluaing the First
Phase of the Grade 12 Mind the Gap Study Guide Series. Pretoria: Department of Basic
Education.
Department of Basic Education. (2014). Report on the Annual National Assessments of 2014,
Grades 1 - 6 & 9.
Department of Basic Education. (2014). The Ministerial Task Team report on the National
Senior Certificate. Pretoria.
Department of Basic Education. (2015). Action Plan to 2019: Towards the Realisation of
Schooling 2030. Pretoria.
Department of Basic Education. (2015). Beyond 2012, average pay has remained more or less
static in real terms. Pretoria: Department of Basic Education .
Department of Basic Education. (2016). Report on progress in the schooling sector against key
learner performance and attainment indicators.
Department of Basic Education. (2016). Revised Five-year Strategic Plan 2015/16-2019/20.
Pretoria: Department of Basic Education.
Department of Basic Education. (2016). The Development of a National Integrated Assessment
Framework. Pretoria.
Department of Basic Education. (2017). Annual Report 2016/17. Pretoria: Department of Basic
Education.
Department of Basic Education. (2017). Annual Report 2016/17.
Department of Basic Education. (2017). Inivtation to comment of the Draft Basic Education
Laws Amendment Bill. Government Gazette No. 41178.

71
71
Department of Basic Education. (2017). National Senior Certificate Examination Report.
Department of Basic Education. (2017). Summary report: Results after year 2 impeact
evaluation: The Easrly Grade Reading Study. Pretoria.
Department of Basic Education. (2018). Annual Report 2017/18. Pretoria : Department of Basic
Education .
Department of Basic Education. (2018). Basic Education Remuneration Issues. Pretoria: Internal
DBE document.
Department of Basic Education. (2018). General Household Survey: Focus on Schooling 2017.
Department of Basic Education. (2018). NEIMS Standard Reports January 2018. Pretoria:
Department of Basic Education.
Department of Basic Education. (2018). Sanitation Intervention and Eradication of Pit Latrines.
Unpublished.
Department of Basic Education. (2018). School Monitoring Survey 2017/18 Technical Report.
Unpublished.
Department of Basic Education. (2019). 2017 School Monitoring Survey: Quantitative Survey
Main Report. Pretoria.
Department of Education. (1995). White paper on Education and Training. Pretoria: Government
Gazette.
Department of Education. (2008). Foundations for Learning Campaign. Laying solid
foundations. Government Gazette No. 30880.
Department of Education. (2008). Foundations for Learning Campaign. Laying Solid
Foundations. Gazette No. 30880. Notice 306.
Department of Education. (2008). Foundations for Learning Campaign. Laying Solid
Foundations. Government Notice No. 306. 14 March 2008 No. 30880.
Department of Education. (2008). South African Schools Act 84 of 1996. Call for comments on
National Minimum Uniform Norms and Standards for School Infrastructure.
Department of Education, Department of Health, Department of Social Development. (2005).
National Integrated Plan for Early Childhood Development in South Africa 2005 - 2010.
Pretoria: Department of Education.
Department of Higher Education and Training. (2017). The Policy on the Minimum
Requirements for Programmes Leading to Qualifications in Higher Education for Early
Childhood Development Educators. Pretoria: Governmnet Gazette.
Department of Planning, Monitoring and Evaluation. (2013). The impact of the introduction of
Grade R on learning outcomes. Pretoria: Full Report for the DBE and DPME.
Department of Planning, Monitoring and Evaluation. (2014). Medium Term Strategic
Framework 2014-2019. Outcome 1: Quality Basic Education.
Department of Social Development. (2015). National Integrated Policy for Early Childhood
Development. Pretoria: Department of Social Development.
DHET. (2017). The Policy on the Minimum Requirements for Programmes Leading to
Qualifications in Higher Education for Early Childhood Development Educators.
Pretoria: Governmnet Gazette.
Gustafsson, M., & Patel, F. (2008). Managing the teacher pay system: What the local and
international data are telling us. Stellenbosch Working Paper Series 26/06.
Gustafsson, M., & Taylor, S. (2018). Treating Schools to a New Administration: Evidence of the
Impact of Better Practices in the System-Level Administration of Schools. Journal of
African Economies, ejy005, https://doi-org.ez.sun.ac.za/10.1093/jae/ejy005.

72
72
Howie, S., Combrinck, C., Roux, K., Tshele, M., Mokoena, G., & Palane, N. M. (2017).
Progress in International Reading Literacy Study 2016: South African Children's
Reading Literacy Achievement. Centre for Evaluation and Assessment.
Legodi, M., & Leat, D. (2001). Case studies of organisations supporting community foundations.
Southern African Grantmaker's Association (SAGA).
Lubis, R. C., & Murphey, R. J. (2002). Assessment in South African schools. In Assessment in
Education Principles, Policy and Practice.
Moloi, Q., & Chetty, M. (2011). The SACMEQ III Project in South Africa: A Study of the
Conditions of Schooling and the Quality of Education.
Muller, J. (2004). Assessments, qualifications and the national qualifications framework in South
African schooling. In L. Chisholm, Changing class: Education and socual change in
post-apartheid South Africa (pp. 221-245). Human Science Research Council.
National Association of Social Change Entities in Education. (2019). Constitution of National
Association of Social Change Entities in Education.
National Education Collaboration Trust. (2018). Annual Report 2017.
National Education Collaboration Trust. (2019). Annual Financial Statement for the year ending
31 December 2018.
National Planning Commission. (2013). National Development Plan 2030: Our Future - Make it
Work. Presidency of South Africa.
NEPI. (1992). Early Childhood Educare: Report of the National Education Policy Investigation.
Cape Town: National Education Coordinating Committee/ Oxford University Press.
NPC. (2013). The National Development Plan 2030: Our Future - Make it work. Pretoria:
National Planning Commission.
Nuga Deliwe, C. (2017). An analysis of measurement of the progress in learning outcomes at a
country level: The case of South Africa. Research Report, University of the
Witwatersrand, School of Education.
Pritchett, L. (2013). The Rebirth of Education (1 ed.). Washington, DC: CGD Books.
Reddy, V., Prinsloo, C., Arends, F., Visser, M., Winnaar, L., Feza, N., . . . Maja, M. (2012).
Highlights from TIMSS 2011 - A South African Perspective. Human Science Research
Council .
South African Human Rights Commission. (2013). Report: Delivery Of Primary Learning
Materials to Schools.
South African Human Rights Council. (2012). Charter for Children's Basic Education Rights.
The Presidency: Republic of South Africa. (2014). Twenty Year Review: South Africa, 1994 -
2014.
Trialogue. (2018). Business in society handbook.
Van Broekhuizen, H., & Spaull, N. (2017). The ‘Martha Effect’: The compounding female
advantage in South African higher education. Stellenbosch Economic Working Papers
14/2017.
Van der Berg, S. (2008). How effective are poor schools? Poverty and educational outcomes in
South Africa. Centre for European, Governance and Economic Development Research
(CEGE) Discussion Papers 69.
Van der Berg, S. (2009). Fiscal incidence of social spending in South Africa, 2006. Stellenbosch
Economic Working Papers (10/9).
73
73
Van der Berg, S., Girdwood, E., Shepherd, D., Van Wyk, C., Kruger, J., Viljoen, J., . . . Ntaka, P.
(2013). The impact of the introduction of Grade R on learning outcomes. University of
Stellenbosch: RESEP.
VVOB. (2017). Putting SDG4 into practice: Professional learning communities in practice.
Brussels.
Whitebook, M., & Ryan, S. (2011). Degrees in Context: Asking the Right Questions about
Preparing Skilled and Effective Teachers and Young Children. NIEER Preschool Policy
Brief, 22.
Wills, G. (2015). Informing principal policy reforms in South Africa through data-based
evidence. South African Journal of Childhood Education, 5(2), 95-122.
World Bank. (2003). World Development Report 2004: Making services work for poor people.
Washington.
World Bank. (2018). World Development Report - Learning to Realise Education's Promise.
World Bank Group. (2019). World Development Indicators. Retrieved from
https://datacatalog.worldbank.org/dataset/world-development-indicators
Zuze, L., Reddy, V., Visser, M., Winnar, L., & Govender, A. (2017). TIMSS 2015 Grade 9
National Report - Understanding Mathematics and Science Achievement amongst Grade
9 Learners in South Africa. Human Science Research Council .