yasuyuki yoshinaga subaru corporation · 0 president & ceo, yasuyuki yoshinaga subaru...
TRANSCRIPT
0https://www.subaru.co.jp/en/ir/
President & CEO, Yasuyuki YoshinagaSUBARU CORPORATION
May 9,2017
Business Results of the FYE 2017
SUBARU ASCENT SUV CONCEPT

1https://www.subaru.co.jp/en/ir/
Business Results of the FYE 2017
FYE 2016 FYE 2017 YoY(c) / (a)
Vs. plan(c) / (b)Results (a) Plan (b) Results (c)
Consolidated sales volume
957,900units
1,067,500units
1,064,500units
+11.1% -0.3%
Net sales(100 million yen) 32,323 33,100 33,260 +2.9% +0.5%
Operating income(100 million yen)
5,656 4,100 4,108 -27.4% +0.2%
OPM 17.5% 12.4% 12.4% -5.1pt 0pt
Ordinary income(100 million yen)
5,770 4,120 3,943 -31.7% -4.3%
Net income attributable to owners of parent(100 million yen)
4,367 2,900 2,824 -35.3% -2.6%
SUBARU exchange rate ¥121/US$ ¥108/US$ ¥108/US$ -¥12/US$ ¥0/US$

2https://www.subaru.co.jp/en/ir/
Business Plan for the FYE 2018
FYE 2017 FYE 2018 YoY
Results (a) Plan (b) (b) – (a) (b) / (a)
Consolidated sales volume
1,064,500units
1,105,500units
+41,000units +3.8%
Net sales(100 million yen) 33,260 34,200 +940 +2.8%
Operating income(100 million yen)
4,108 4,100 -8 -0.2%
OPM 12.4% 12.0% -0.4pt
Ordinary income(100 million yen) 3,943 4,100 +157 +4.0%
Net income attributable to owners of parent(100 million yen)
2,824 2,850 +26 +0.9%
SUBARU exchange rate ¥108/US$ ¥110/US$ +¥2/US$

3https://www.subaru.co.jp/en/ir/
280 358
442 528 583
668 688
800 plus
28
33
36
42 48
53 55
172
163
182
163 145
159 172
150
48
50
45
54 44
44 42
50
39
46
32
36 42
41 39
16
15
15
12 6
5 7
37
38
40
39 45
49 53
19
22
34
38 46
46 50 200
US Canada Japan China
Europe Russia Australia Others
Consolidated Automobile Sales
(unit : 1,000 units)
(Plan)
640724
825911
FYE 2017 Result : 1,064,500 units (YoY +11%, record sales for the 5th consecutive year)
FYE 2018 Plan : 1,105,500 units (YoY +4%)
9581,065 1,106
1,200 plus
Prominence2020
NorthAmerica
Japan
China
Others
(Prominence2020)

4https://www.subaru.co.jp/en/ir/
459 465 511 609 681 693 698 688
1,276 165 171
181 164
207 236 335 381
0
200
400
600
800
1,000
1,200 Japan USJapan
US
624 635 692772
8871,033
929
Global Production Volume
(Plan)
YoY +2% +9% +12% +15% +5% +11% +3%
1,069
※Above figures do not include Toyota 86/FR-S
1,276
Production capacity at maximum operation
(standard operation capacity: 1,132,000 units)
(Plan for production capacity)
Actual Results
End of
(unit : 1,000 units)

5https://www.subaru.co.jp/en/ir/
Shareholder Returns
FYE 2016Result
FYE 2017Plan
FYE 2018Forecast
End of 2nd quarter ¥72 ¥72 ¥72
End of 4th quarter ¥72 ¥72 ¥72
Year total ¥144 ¥144 ¥144
【Dividend Per Share】
Dividend payout ratio 25.7% 39.4% 38.7%
Revised dividend payout ratio for FYE 2018 : 30-50% (originally 20-40%)
Profits are returned to shareholders basically in the form of dividends with business results for each term, investment plans, and the business environment taken into account.
Basic policy is to provide continuous dividend payments which are linked to business performance of the company.
Dividend payments for each fiscal year are determined in view of circumstances predicted based on consolidated dividend payout ratio of 30-50%.

6https://www.subaru.co.jp/en/ir/
Changes in Business Environment
<Changes in Business Environment>
Auto industry entering a new era of technology evolution Rapid growth of SUBARU in recent years Intensifying competition in US auto market
<Future Direction>
Basic strategies remain unchanged:Selection & concentration, differentiation & added-value strategy
Further enhancement of SUBARU brand⇒ Reconsideration of priorities in new business environment
Ex) - Total commitment to quality- Selection of technology/product/market
Electric Shared
Autonomous
Connected
Connected
Autonomous
Electric
Shared

7https://www.subaru.co.jp/en/ir/
Enhancement of Corporate Governance
1. New Structure of Board Directors(*to be proposed at the General Meeting of Shareholders planned to be held in June)
- To strengthen supervision functions by separating management from the execution of operations- To speed up the execution of operations
2. Revision of the executive compensation plan(*to be proposed at the General Meeting of Shareholders planned to be held in June)
- Introduction of Restricted Stock Compensation Plan
3. Enhancement of Corporate Administration Management & Business Monitoring Functions- Establishment of Corporate Administration Division- New Appointment of CQO (Quality), CTO (Technology), CIO (Information)
Director, Chairman Jun Kondo
Representative Director, President & CEO Yasuyuki Yoshinaga
Representative Director, Corporate Executive Vice President Takeshi Tachimori
Director, Corporate Executive Vice President Masahiro Kasai
Director, Corporate Executive Vice President Toshiaki Okada ◎
Director, Corporate Senior Vice President Yoichi Kato ◎
Outside Director Yoshinori Komamura
Outside Director Shigehiro Aoyama
◎: Newly appointed

8https://www.subaru.co.jp/en/ir/
Enhancement of Initiatives for CSR & Environment
“The earth, the sky and nature” are SUBARU’s fields of business
1. Establishment of Dedicated Department: CSR & Environment Department (April 1, 2017)
2. Revision of Environmental Policies (April 1, 2017)
Preservation of the ecosystem of our planet, the earth, the sky and nature, is of utmost importance to ensure the future sustainability of both society and our organization. We align our business strategy to enhance these global goals in all of our operations.
1) We develop and deliver products to meet societal needs and contribute to the environment through advanced technologies
2) Focusing on efforts aimed at coexistence with nature3) Taking on challenges as one through an all-SUBARU approach

9https://www.subaru.co.jp/en/ir/
Forward-looking statements including projections and future strategies mentioned in this presentation are based on currently available information and assumptions and are subject to risks and uncertainties.Actual results may vary materially as a result of various factors including, without limitation, economic conditions, market demand and fluctuations in foreign exchange rates.Investors are asked not to rely solely on the information in this presentation when they make their final investment decisions.

10https://www.subaru.co.jp/en/ir/

0https://www.subaru.co.jp/en/ir/
SUBARU CORPORATIONToshiaki Okada
Corporate Executive Vice President & CFOMay 9, 2017
Consolidated Financial Results for FYE 2017
1https://www.subaru.co.jp/en/ir/
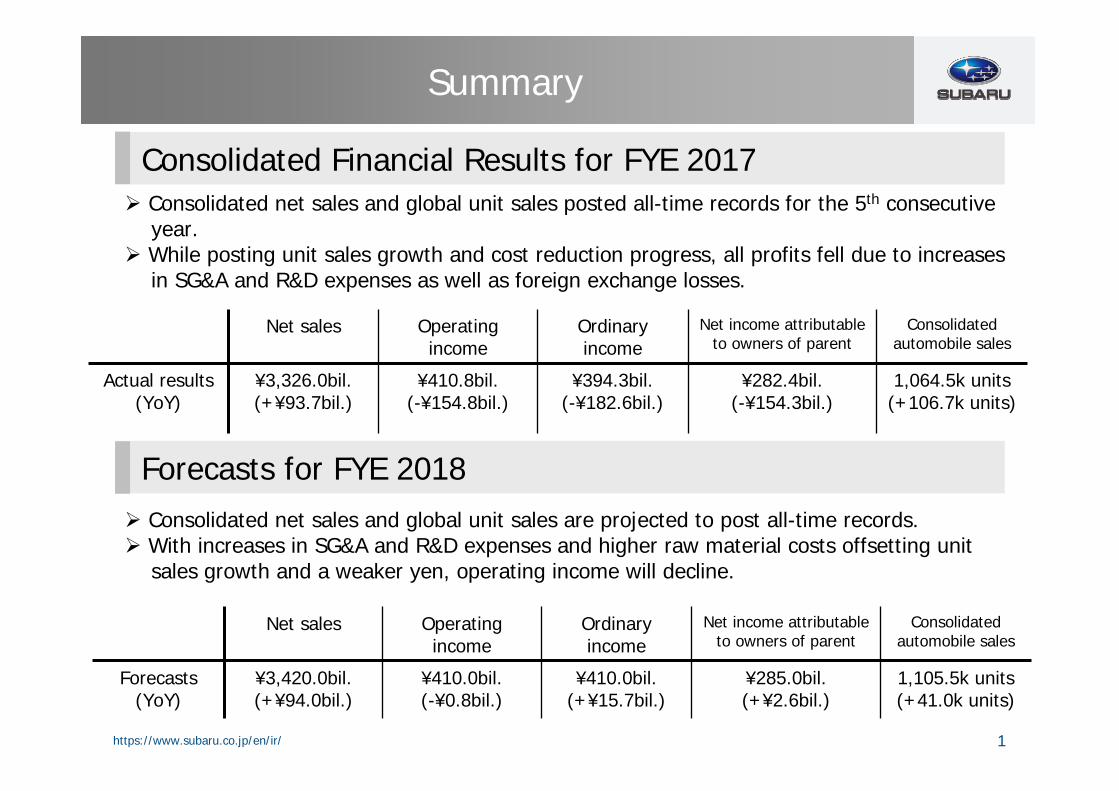
Consolidated Financial Results for FYE 2017
Forecasts for FYE 2018
Consolidated net sales and global unit sales posted all-time records for the 5th consecutive year.
While posting unit sales growth and cost reduction progress, all profits fell due to increases in SG&A and R&D expenses as well as foreign exchange losses.
Consolidated net sales and global unit sales are projected to post all-time records. With increases in SG&A and R&D expenses and higher raw material costs offsetting unit
sales growth and a weaker yen, operating income will decline.
Summary
Net sales Operatingincome
Ordinaryincome
Net income attributableto owners of parent
Consolidated automobile sales
Forecasts(YoY)
¥3,420.0bil.(+¥94.0bil.)
¥410.0bil.(-¥0.8bil.)
¥410.0bil.(+¥15.7bil.)
¥285.0bil.(+¥2.6bil.)
1,105.5k units(+41.0k units)
Net sales Operatingincome
Ordinaryincome
Net income attributableto owners of parent
Consolidated automobile sales
Actual results(YoY)
¥3,326.0bil.(+¥93.7bil.)
¥410.8bil.(-¥154.8bil.)
¥394.3bil.(-¥182.6bil.)
¥282.4bil.(-¥154.3bil.)
1,064.5k units(+106.7k units)

2https://www.subaru.co.jp/en/ir/
Consolidated financial results for FYE 2017Consolidated financial results for FYE 2017Consolidated financial results for FYE 2017
3https://www.subaru.co.jp/en/ir/
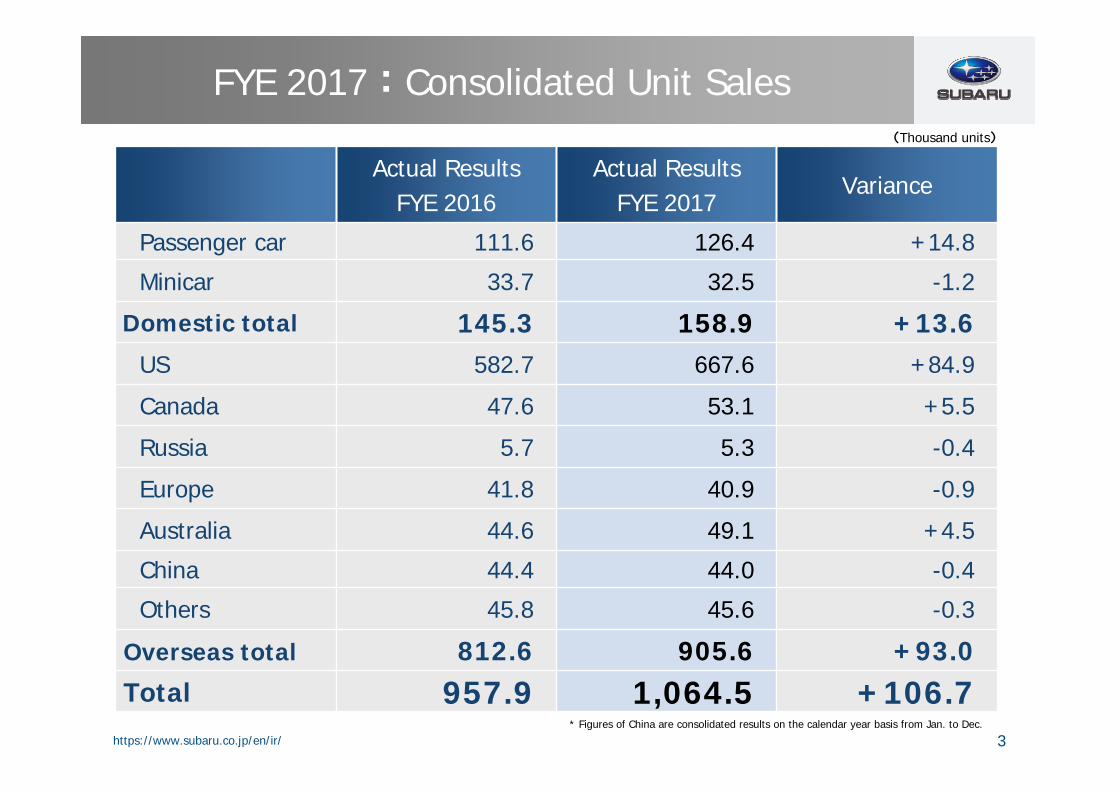
Actual ResultsFYE 2016
Actual ResultsFYE 2017
Variance
Passenger car 111.6 126.4 +14.8
Minicar 33.7 32.5 -1.2
Domestic total 145.3 158.9 +13.6US 582.7 667.6 +84.9
Canada 47.6 53.1 +5.5
Russia 5.7 5.3 -0.4
Europe 41.8 40.9 -0.9
Australia 44.6 49.1 +4.5
China 44.4 44.0 -0.4
Others 45.8 45.6 -0.3
Overseas total 812.6 905.6 +93.0Total 957.9 1,064.5 +106.7
FYE 2017:Consolidated Unit Sales
* Figures of China are consolidated results on the calendar year basis from Jan. to Dec.
(Thousand units)

4https://www.subaru.co.jp/en/ir/
Actual ResultsFYE 2016
Actual ResultsFYE 2017
Variance
Net sales 32,323 33,260 +937Domestic 6,054 6,503 +449
Overseas 26,269 26,756 +488
Operating income 5,656 4,108 -1,548Total non-operating income & expenses
+114 -165 -279
Ordinary income 5,770 3,943 -1,826Total extraordinary income & loss
420 4 -417Income before taxes and minority interests 6,190 3,947 -2,243Net income attributable to owners of parent 4,367 2,824 -1,543
SUBARU exchange rate ¥121/US$ ¥108/US$ -¥12/US$
FYE 2017:Consolidated Income Statements(100 Million Yen)

5https://www.subaru.co.jp/en/ir/
5,656
4,108
Sales volume& mixtureand others+1,377
Loss oncurrencyexchange-1,438
Costreduction+322
SG&Aexpenses
and others-1,691
R&Dexpenses-118
Actual resultsFYE 2016
Operating income
Actual resultsFYE 2017
Operating income
FYE 2017 : Analysis of Variance in Operating Income (Consolidated)
-1,548
US$ : -1,414EURO : -48CA$ : -69CNY : -6Currency exchange adjustment: +73Unrealized gain :+26
SUBARU : +256(material cost +135)SIA : +66(material cost +4)
Domestic: +168(volume increase, mixture improvement)Overseas : +971(volume increase, mixture deterioration)
Others: +239
Fixed cost : -306 (SUBARU-75, SIA -231)SG&A : -656 (SUBARU-48, SOA -549 , others)Warranty claims : -729
(100 Million Yen)
6https://www.subaru.co.jp/en/ir/
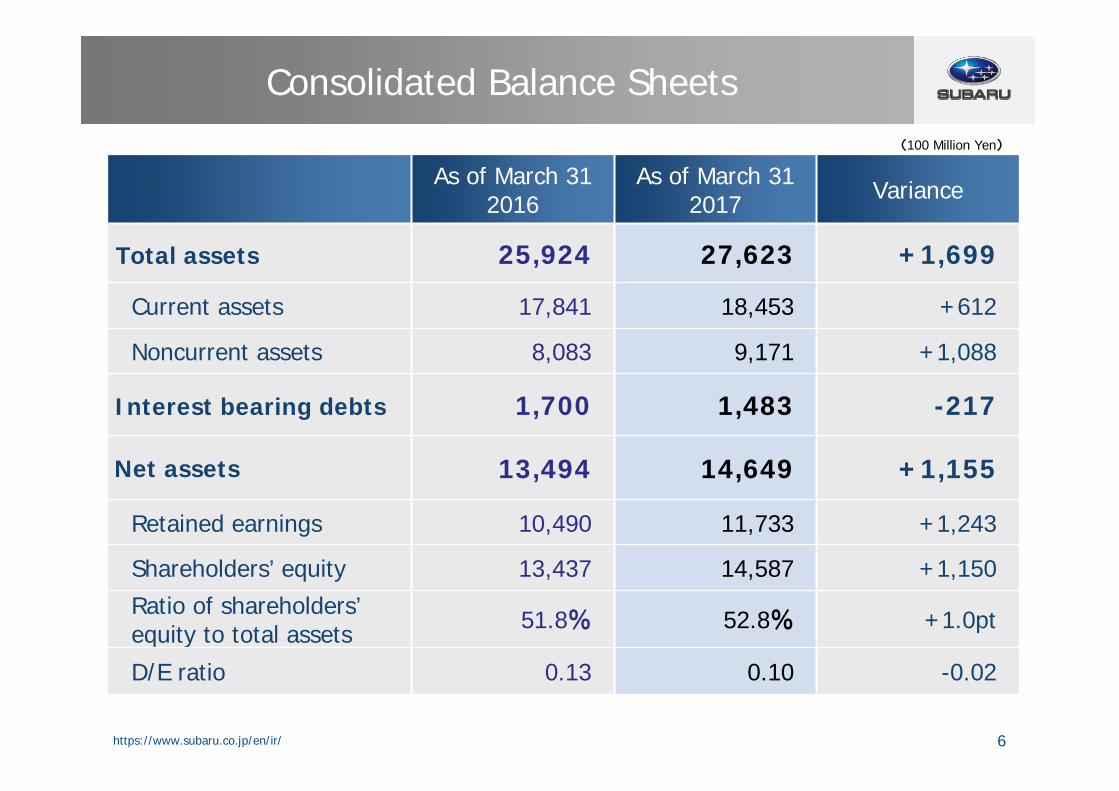
As of March 312016
As of March 312017 Variance
Total assets 25,924 27,623 +1,699
Current assets 17,841 18,453 +612
Noncurrent assets 8,083 9,171 +1,088
Interest bearing debts 1,700 1,483 -217
Net assets 13,494 14,649 +1,155
Retained earnings 10,490 11,733 +1,243
Shareholders’ equity 13,437 14,587 +1,150Ratio of shareholders’equity to total assets 51.8% 52.8% +1.0pt
D/E ratio 0.13 0.10 -0.02
Consolidated Balance Sheets(100 Million Yen)

7https://www.subaru.co.jp/en/ir/
Actual resultsFYE 2016
Actual resultsFYE 2017 Variance
Net cash provided by (used in) operating activities 6,143 3,454 -2,688Net cash provided by (used in)investing activities -2,557 -2,543 +14
Free cash flows 3,586 912 -2,674Net cash provided by (used in) financing activities -1,262 -1,890 -629
Effect of exchange rate change on cash and cash equivalents
-149 -30 +119
Net increase (decrease) in cash and cash equivalents
2,175 -1,008 -3,183
Increase (decrease) in cash and cash equivalents resulting from change of scope of consolidation
-1 - +1
Cash and cash equivalents at end of period 8,295 7,286 -1,008
FYE 2017: Consolidated Statement of Cash Flows
(100 Million Yen)

8https://www.subaru.co.jp/en/ir/
SIA Actual resultsFYE 2016
Actual resultsFYE 2017 Variance
Net sales 5,468 7,525 +2,057
Operating income 209 236 +27
Net income 134 148 +14Subaru production (Thousand units)
236.0 335.2 +99.2
SOA Actual resultsFYE 2016
Actual resultsFYE 2017 Variance
Net sales 15,203 17,947 +2,744
Operating income 770 671 -99
Net income 480 421 -59Retail sales (Thousand units)
581.4 625.0 +43.6
(Million US$)
FYE 2017 : Operating Results of Subsidiaries in U.S.

9https://www.subaru.co.jp/en/ir/
Forecasts for FYE 2018Forecasts for FYE 2018Forecasts for FYE 2018

10https://www.subaru.co.jp/en/ir/
Actual resultsFYE 2017
PlanFYE 2018 Variance
Passenger car 126.4 134.2 +7.8
Minicar 32.5 37.8 +5.3
Domestic total 158.9 172.1 +13.1US 667.6 687.7 +20.1
Canada 53.1 54.6 +1.5
Russia 5.3 6.6 +1.3
Europe 40.9 39.2 -1.7
Australia 49.1 52.6 +3.5
China 44.0 42.3 -1.7
Others 45.6 50.5 +4.9
Overseas total 905.6 933.4 +27.8Total 1,064.5 1,105.5 +41.0
FYE 2018:Consolidated Unit Sales Plan(Thousand units)
<China> FYE2017 :Figures are consolidated on the calendar year basis from Jan. to Dec.FYE2018 :Figures are consolidated on the fiscal year basis from Apr. to Mar.

11https://www.subaru.co.jp/en/ir/
Actual resultsFYE 2017
PlanFYE 2018 Variance
Net sales 33,260 34,200 +940
Domestic 6,503 6,680 +176
Overseas 26,756 27,520 +764
Operating income 4,108 4,100 -8
Ordinary income 3,943 4,100 +157Income before taxes and minority interests 3,947 4,030 +83
Net income attributable to owners of parent 2,824 2,850 +26
SUBARU exchange rate ¥108/US$ ¥110/US$ +¥2/US$
FYE 2018 : Consolidated Operating Plan(100 Million Yen)

12https://www.subaru.co.jp/en/ir/
4,108 4,100
Sales volume& mixtureand others+328
Gain oncurrencyexchange+211
Costreduction
-71
SG&Aexpenses
and others-278
R&Dexpenses-198
Actual resultsFYE 2017
Operating income
PlanFYE 2018
Operating income
FYE 2018 : Analysis of Variance in Operating Income (Consolidated)
-8
Fixed cost : -245 (SUBARU -99, SIA -146)SG&A : -436 (SUBARU -90, SOA -300, others)Warranty claims : +403
Domestic : +104 (volume increase, mixture improvement )Overseas : +131(volume increase, mixture improvement)Others : +93
US$ : +182EURO : +2 , CA$ : +15, CNY : ±0Currency exchange adjustment : -10Unrealized gain: +21
SUBARU : -76(material cost -160)SIA : +5(material cost -34)
(100 Million Yen)

13https://www.subaru.co.jp/en/ir/
SIA Actual resultsFYE 2017
PlanFYE 2018 Variance
Net sales 7,525 8,376 +851
Operating income 236 215 -21
Net income 148 128 -20Subaru production (Thousand units)
335.2 381.1 +45.9
SOA Actual resultsFYE 2017
PlanFYE 2018 Variance
Net sales 17,947 18,485 +538
Operating income 671 538 -133
Net income 421 338 -83Retail sales (Thousand units)
625.0 670.0 +45.0
(Million US$)
FYE 2018 : Operating Plan of Subsidiaries in U.S.

14https://www.subaru.co.jp/en/ir/
Actual ResultsFYE 2016
Actual ResultsFYE 2017
(a)
PlanFYE 2018
(b)
Variance(b) - (a)
Capex 1,357 1,585 1,500 -85
Depreciation 650 770 920 +150
R&D 1,024 1,142 1,340 +198
Interestbearing debt
1,700 1,483 1,000 -483
Capex / Depreciation / R&D / Interest bearing debt
(100 Million Yen)

15https://www.subaru.co.jp/en/ir/
Appendix (1)
・Non-operating income & expenses and extraordinary income & loss・Segment information by Business & Geographic・Overseas net sales・Non-consolidated unit sales・ Consolidated income statements in 4th quarter (3 months) ・ FYE 2017 plan vs. Actual results・ Consolidated income statements in 1st half of FYE 2018
Appendix (1)Appendix (1)
・・NonNon--operating income & expenses and extraordinary income & lossoperating income & expenses and extraordinary income & loss・・Segment information by Business & GeographicSegment information by Business & Geographic・・Overseas net salesOverseas net sales・・NonNon--consolidated unit salesconsolidated unit sales・・ Consolidated income statements in 4th quarter (3 months) Consolidated income statements in 4th quarter (3 months) ・・ FYE 2017 plan vs. Actual resultsFYE 2017 plan vs. Actual results・・ Consolidated income statements in 1st half of FYE 2018Consolidated income statements in 1st half of FYE 2018
16https://www.subaru.co.jp/en/ir/
Actual ResultsFYE 2016
Actual ResultsFYE 2017
Variance
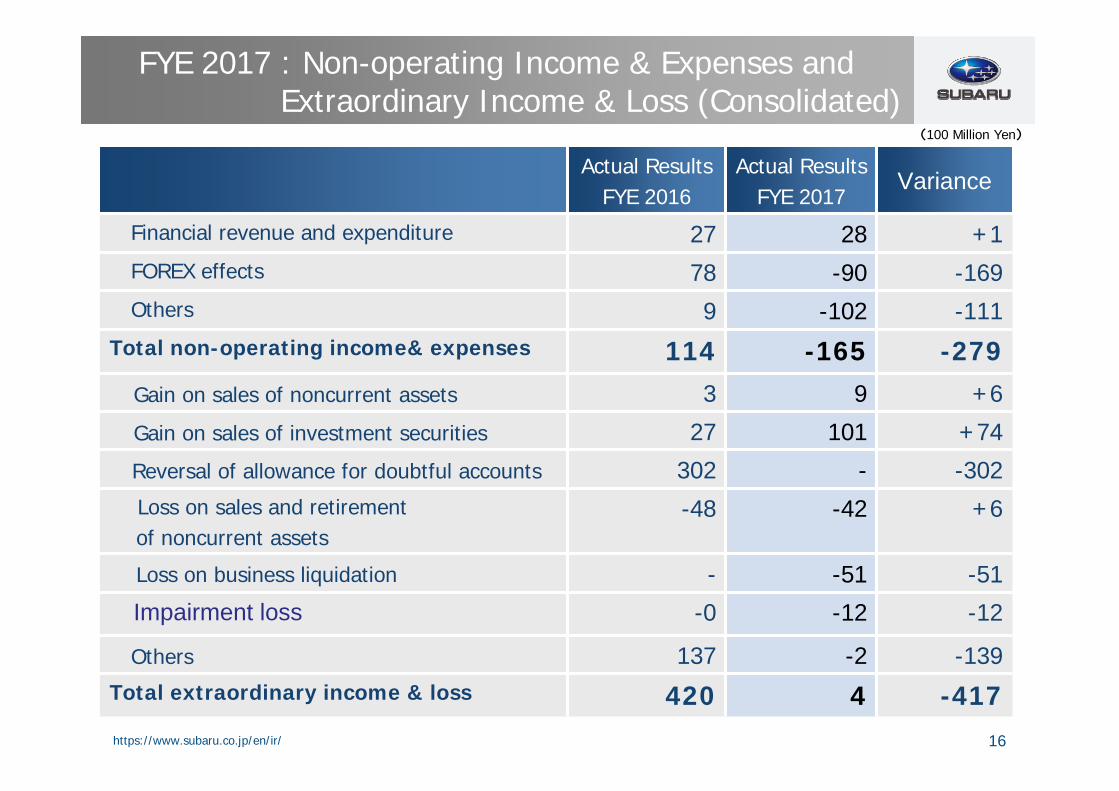
Financial revenue and expenditure 27 28 +1FOREX effects 78 -90 -169Others 9 -102 -111
Total non-operating income& expenses 114 -165 -279Gain on sales of noncurrent assets 3 9 +6
Gain on sales of investment securities 27 101 +74
Reversal of allowance for doubtful accounts 302 - -302Loss on sales and retirement of noncurrent assets
-48 -42 +6
Loss on business liquidation - -51 -51
Impairment loss -0 -12 -12
Others 137 -2 -139Total extraordinary income & loss 420 4 -417
FYE 2017 : Non-operating Income & Expenses and Extraordinary Income & Loss (Consolidated)
(100 Million Yen)
17https://www.subaru.co.jp/en/ir/
Net Sales Operating Income
Actual Results
FYE 2016
Actual Results
FYE 2017Variance
Actual Results
FYE 2016
Actual Results
FYE 2017Variance
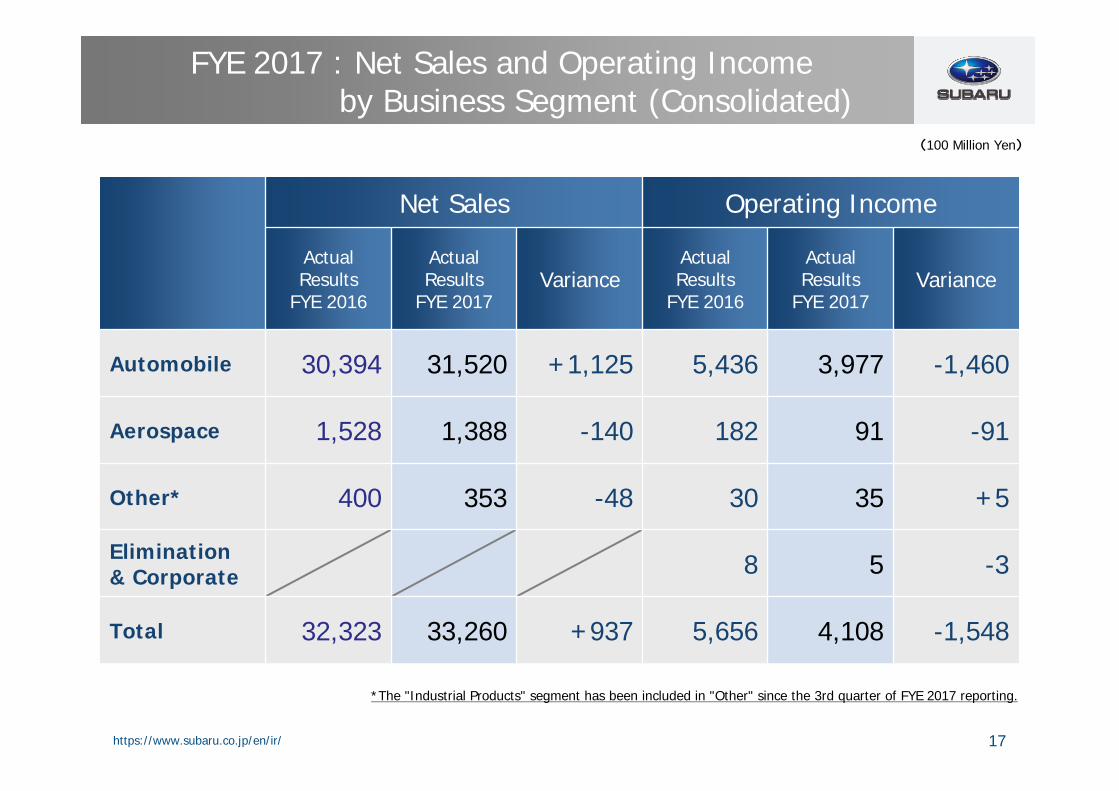
Automobile 30,394 31,520 +1,125 5,436 3,977 -1,460
Aerospace 1,528 1,388 -140 182 91 -91
Other* 400 353 -48 30 35 +5
Elimination & Corporate 8 5 -3
Total 32,323 33,260 +937 5,656 4,108 -1,548
FYE 2017 : Net Sales and Operating Incomeby Business Segment (Consolidated)
(100 Million Yen)
*The "Industrial Products" segment has been included in "Other" since the 3rd quarter of FYE 2017 reporting.
18https://www.subaru.co.jp/en/ir/
Net Sales Operating Income
Actual Results
FYE 2016
Actual Results
FYE 2017Variance
Actual Results
FYE 2016
Actual Results
FYE 2017Variance
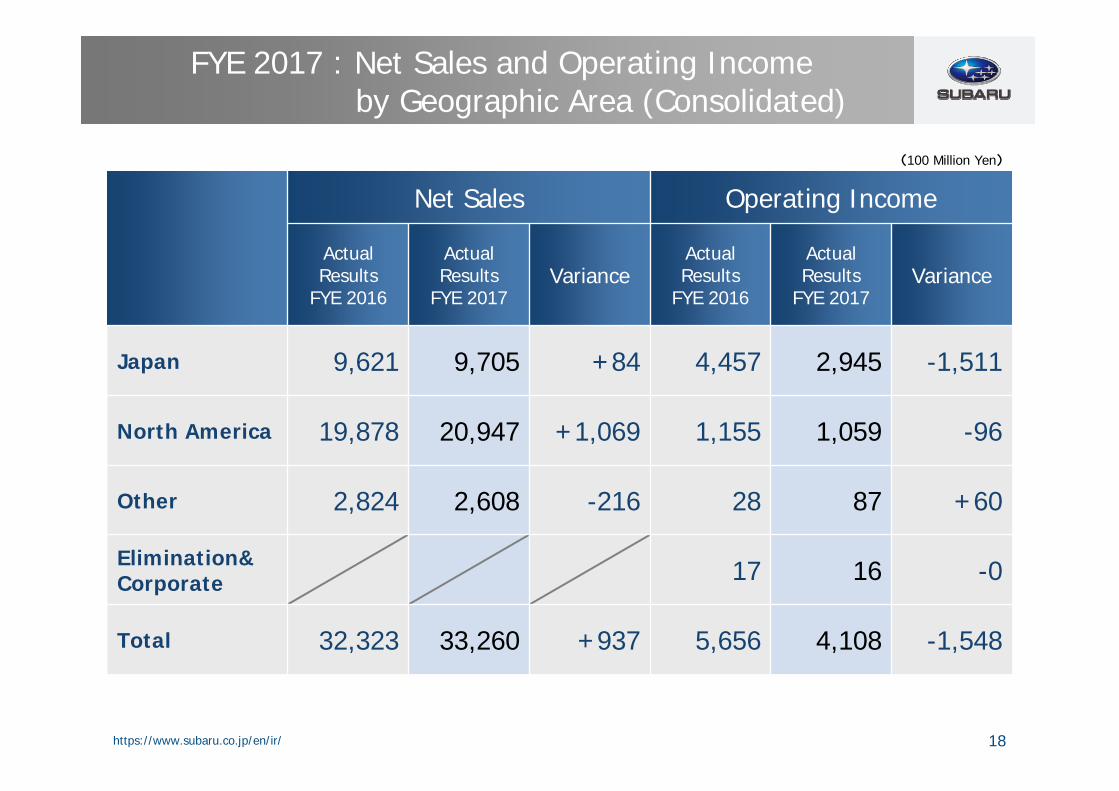
Japan 9,621 9,705 +84 4,457 2,945 -1,511
North America 19,878 20,947 +1,069 1,155 1,059 -96
Other 2,824 2,608 -216 28 87 +60
Elimination& Corporate 17 16 -0
Total 32,323 33,260 +937 5,656 4,108 -1,548
FYE 2017 : Net Sales and Operating Incomeby Geographic Area (Consolidated)
(100 Million Yen)

19https://www.subaru.co.jp/en/ir/
Actual ResultsFYE 2016
Actual ResultsFYE 2017 Variance
North America 21,045 21,923 +878
Europe 1,262 1,126 -136
Asia 2,373 2,113 -260
Other 1,589 1,595 +6
Total 26,269 26,756 +488
FYE 2017 : Overseas Net Sales (Consolidated)
(100 Million Yen)

20https://www.subaru.co.jp/en/ir/
Actual ResultsFYE 2016
Actual ResultsFYE 2017 Variance
Domestic production 714.9 720.5 +5.6
Domestic sales 150.0 163.7 +13.7
Passenger cars 114.4 129.6 +15.2
Minicars 35.6 34.1 -1.5
Number of exported vehicles 576.5 570.7 -5.7
Components for overseas production 242.4 353.8 +111.3
Total 968.9 1,088.2 +119.3
FYE 2017 : Non-consolidated Unit Sales
(Thousand units)
* Domestic production figures include Toyota 86.
21https://www.subaru.co.jp/en/ir/
Actual results4Q FYE 2016
Actual results4Q FYE 2017 Variance
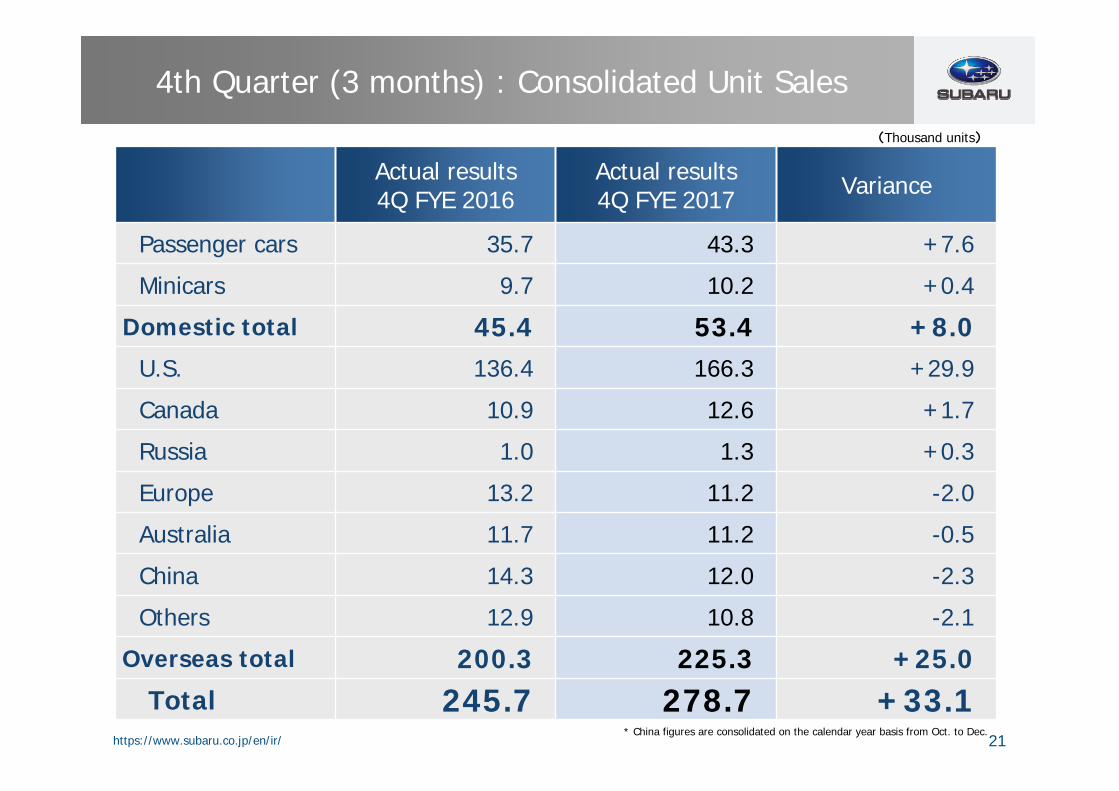
Passenger cars 35.7 43.3 +7.6
Minicars 9.7 10.2 +0.4
Domestic total 45.4 53.4 +8.0U.S. 136.4 166.3 +29.9
Canada 10.9 12.6 +1.7
Russia 1.0 1.3 +0.3
Europe 13.2 11.2 -2.0
Australia 11.7 11.2 -0.5
China 14.3 12.0 -2.3
Others 12.9 10.8 -2.1
Overseas total 200.3 225.3 +25.0Total 245.7 278.7 +33.1
4th Quarter (3 months) : Consolidated Unit Sales
* China figures are consolidated on the calendar year basis from Oct. to Dec.
(Thousand units)

22https://www.subaru.co.jp/en/ir/
Actual results4Q FYE 2016
Actual results4Q FYE 2017 Variance
Net sales 8,136 8,981 +845
Domestic 1,772 2,054 +282
Overseas 6,364 6,927 +562
Operating income 1,298 1,041 -258
Ordinary income 1,430 971 -459Income before taxes and minority interests 1,385 959 -427
Net income attributable to owners of parent 989 748 -240
SUBARU exchange rate ¥118/US$ ¥114/US$ -¥3/US$
4th Quarter (3 months) : Consolidated Income Statements
(100 Million Yen)

23https://www.subaru.co.jp/en/ir/
1,2981,041
Sales volume & mixture and Others+342
Loss on currency exchange-202
Cost reduction+21
SG&A expenses and others
-388 R&Dexpenses
-31
+258
SUBARU: +15 (material cost -13)SIA : +6(material cost -11)
Domestic: +51(volume increase,mixture improvement)
Overseas: +182(volume increase,mixture deterioration)
Others: +110
US$ : -85EURO : -7CA$ : +8CNY : -1Currency exchange adjustment: +55Unrealized gain: -172
Fixed cost : -48 (SUBARU-12, SIA -36)SG&A : -195 (SUBARU-6, SOA -179, others)Warranty claims : -145
4th Quarter (3 months) :Analysis of Variance in Operating Income (Consolidated)
Actual results4Q FYE 2016
Operating income
Actual results4Q FYE 2017
Operating income
(100 Million Yen)

24https://www.subaru.co.jp/en/ir/
PlanFYE 2017
Actual resultsFYE 2017 Variance
Passenger cars 127.5 126.4 -1.1
Minicars 34.0 32.5 -1.4
Domestic total 161.5 158.9 -2.5U.S. 667.4 667.6 +0.2
Canada 52.9 53.1 +0.2
Russia 5.6 5.3 -0.3
Europe 41.1 40.9 -0.2
Australia 49.5 49.1 -0.4
China 44.0 44.0 ±0
Others 45.6 45.6 -0
Overseas total 906.1 905.6 -0.5Total 1,067.5 1,064.5 -3.0
FYE 2017 Plan vs. Actual Results:Consolidated Unit Sales
* China figures are consolidated on the calendar year basis from Jan. to Dec.
(Thousand units)

25https://www.subaru.co.jp/en/ir/
PlanFYE 2017
Actual resultsFYE 2017 Variance
Net sales 33,100 33,260 +160
Domestic 6,511 6,503 -7
Overseas 26,589 26,756 +167
Operating income 4,100 4,108 +8
Ordinary income 4,120 3,943 -177Income before taxes and minority interests 4,120 3,947 -173
Net income attributable to owners of parent 2,900 2,824 -76
SUBARU exchange rate ¥108/US$ ¥108/US$ +¥0/US$
FYE 2017 Plan vs. Actual Results :Consolidated Income Statements
(100 Million Yen)

26https://www.subaru.co.jp/en/ir/
4,1004,108
Sales volume& mixture and Others
-21
Gain on currency exchange
+16
Cost reduction
+3
SG&A expenses and others
+12
+8
SUBARU: -1 (material cost +2)SIA : +4 (material cost +5)
Domestic : -5 (volume increase, mixture deterioration)Overseas : +44(volume increase, mixture deterioration)Others : -59
R&Dexpenses
-2
US$: +19EURO: -1CA$ : +6CNY: +1Currency exchange adjustment: +56Unrealized gain: -65
Fixed cost: +35 (SUBARU -1, SIA +36)SG&A : -8(SUBARU +6, SOA -39, others)Warranty claims : -15
PlanFYE 2017
Operating income
Actual resultsFYE 2017
Operating income
(100 Million Yen)
FYE 2017 Plan vs. Actual Results :Analysis of Variance in Operating Income (consolidated)

27https://www.subaru.co.jp/en/ir/
Actual results1st half FYE 2017
Plan1st half FYE 2018 Variance
Passenger cars 52.5 65.2 +12.7
Minicars 15.6 17.4 +1.8
Domestic total 68.0 82.6 +14.5U.S. 326.9 335.0 +8.0
Canada 28.4 30.1 +1.7
Russia 3.7 3.7 -0.0
Europe 18.4 19.6 +1.1
Australia 22.4 27.3 +4.9
China 21.8 21.9 +0.1
Others 22.3 22.2 -0.1
Overseas total 443.9 459.7 +15.8Total 512.0 542.3 +30.3
<China> FYE2017 :Figures are consolidated on the calendar year basis from Jan. to Jun.FYE2018 :Figures are consolidated on the fiscal year basis from Apr. to Sep.
(Thousand units)
Plan for 1st Half of FYE 2018 :Consolidated Unit Sales

28https://www.subaru.co.jp/en/ir/
Actual results1st half FYE 2017
Plan1st half FYE 2018 Variance
Net sales 15,777 16,890 +1,113
Domestic 2,860 3,286 +426
Overseas 12,916 13,604 +688
Operating income 2,085 2,100 +15
Ordinary income 2,278 2,100 -178Income before taxes and minority interests 2,356 2,070 -286
Net income attributable to owners of parent 1,638 1,450 -188
SUBARU exchange rate ¥107/US$ ¥110/US$ +¥3/US$
Plan for 1st Half of FYE 2018 :Consolidated Income Statements
(100 Million Yen)

29https://www.subaru.co.jp/en/ir/
Gain oncurrency exchange+147
Cost reduction
-49
SG&A expensesand others
-240
R&D expense-147
+15
Domestic : +147(volume increase, mixture improvement)
Overseas : +25 (volume decrease, mixture improvement)Others : +132
Fixed Cost:-127(SUBARU -46, SIA -81)SG&A:-352(SUBARU -72, SOA -242, others)Warranty claims:+239
SUBARU : -50 (material cost -92)SIA : +1(material cost -20)
US$ : +153EURO : ±0, CA$ : +10, CNY : -1Currency exchange adjustment: +107Unrealized gain:-121
1st Half of FYE 2017 Results vs. FYE 2018 Plan:Analysis of Variance in Operating Income (consolidated)
Actual results1st half
FYE 2017Operating income
Sales volume& mixtureand Others+304
Plan1st half
FYE 2018Operating income
(100 Million Yen)

30https://www.subaru.co.jp/en/ir/
Appendix (2)
・Net sales / Operating income・Consolidated unit sales / OPM・Complete cars production / Retail sales units・FCF / Shareholder’s equity to total assets・Interest-bearing debt / D/E ratio
Appendix (2)
・Net sales / Operating income・Consolidated unit sales / OPM・Complete cars production / Retail sales units・FCF / Shareholder’s equity to total assets・Interest-bearing debt / D/E ratio
31https://www.subaru.co.jp/en/ir/
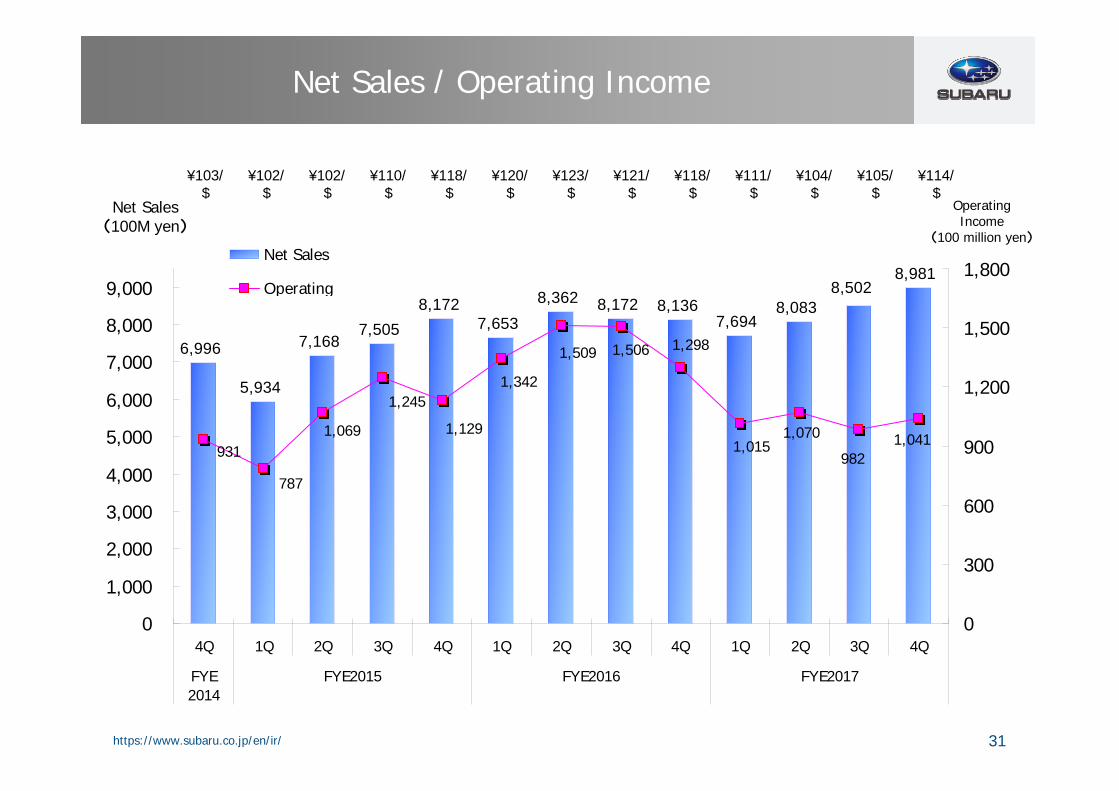
6,996
5,934
7,1687,505
8,1727,653
8,362 8,172 8,1367,694
8,083
8,9818,502
931
787
1,069
1,245
1,129
1,342
1,509 1,506 1,298
1,0151,070
9821,041
0
1,000
2,000
3,000
4,000
5,000
6,000
7,000
8,000
9,000
4Q 1Q 2Q 3Q 4Q 1Q 2Q 3Q 4Q 1Q 2Q 3Q 4Q
FYE2014
FYE2015 FYE2016 FYE2017
0
300
600
900
1,200
1,500
1,800Net Sales
Operating
Net Sales / Operating Income
Net Sales(100M yen)
OperatingIncome
(100 million yen)
¥103/$
¥102/$
¥102/$
¥110/$
¥118/$
¥120/$
¥123/$
¥121/$
¥118/$
¥111/$
¥104/$
¥105/$
¥114/$

32https://www.subaru.co.jp/en/ir/
246
267279
232
194
238 232247
225247 240
245
274
13.3% 13.3%
14.9%
16.6%
13.8%
17.5%18.1% 18.4%
16.0%
13.2% 13.2%
11.6% 11.6%
0
50
100
150
200
250
300
4Q 1Q 2Q 3Q 4Q 1Q 2Q 3Q 4Q 1Q 2Q 3Q 4Q
FYE2014
FYE2015 FYE2016 FYE2017
5%
8%
10%
13%
15%
18%
20%Consolidated unit sales
OPM
Consolidate Unit Sales & Operating Income Margin
Unit sales(1,000 units) OPM

33https://www.subaru.co.jp/en/ir/
231
211 211225
241 237229
242249 245
258
273280
228214
237 234244
233
253 248237 242
265 269
253
0
50
100
150
200
250
300
Jan.-Mar. Apr.-Jun. Jul.-Sep. Oct.-Dec. Jan.-Mar. Apr.-Jun. Jul.-Sep. Oct.-Dec. Jan.-Mar. Apr.-Jun. Jul.-Sep. Oct.-Dec. Jan.-Mar.
2014 2015 2016 2017
Production Retail Sales
Complete Cars Production / Retail Sales Units
(1,000 units)
※ Production figures include Toyota 86
34https://www.subaru.co.jp/en/ir/
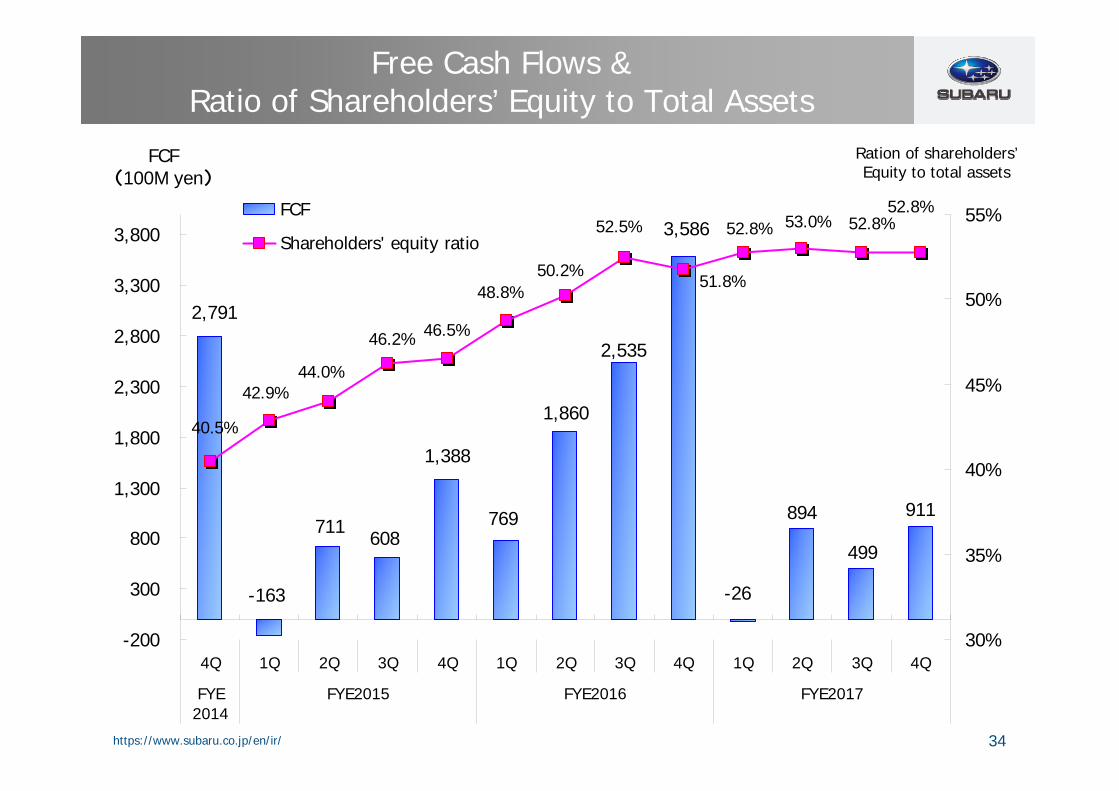
2,791
-163
711608
1,388
769
1,860
2,535
3,586
-26
894
499
911
40.5%
42.9%44.0%
46.2% 46.5%
48.8%50.2%
52.5%
51.8%
52.8% 53.0% 52.8%52.8%
-200
300
800
1,300
1,800
2,300
2,800
3,300
3,800
4Q 1Q 2Q 3Q 4Q 1Q 2Q 3Q 4Q 1Q 2Q 3Q 4Q
FYE2014
FYE2015 FYE2016 FYE2017
30%
35%
40%
45%
50%
55%FCF
Shareholders' equity ratio
FCF(100M yen)
Ration of shareholders’Equity to total assets
Free Cash Flows &Ratio of Shareholders’ Equity to Total Assets

35https://www.subaru.co.jp/en/ir/
2,6972,574
2,322 2,2682,112
2,011 2,0141,865
1,700 1,654 1,6141,455 1,483
0.350.32
0.27 0.24 0.210.18 0.17 0.15
0.13 0.12 0.12 0.10 0.10
0
500
1,000
1,500
2,000
2,500
3,000
4Q 1Q 2Q 3Q 4Q 1Q 2Q 3Q 4Q 1Q 2Q 3Q 4Q
FYE2014
FYE2015 FYE2016 FYE2017
0.0
0.1
0.2
0.3
0.4
0.5
0.6
0.7
0.8
0.9
1.0Interest bearingdebtD/E ratio
Interest Bearing Debt & D/E Ratio
Interest bearing debt
(100M yen) D/E ratio
36https://www.subaru.co.jp/en/ir/
Forward-looking statements including projections and future strategies mentioned in this presentation are based on currently available information and assumptions and are subject to risks and uncertainties.Actual results may vary materially as a result of various factors including, without limitation, economic conditions, market demand and fluctuations in foreign exchange rates.Investors are asked not to rely solely on the information in this presentation when they make their final investment decisions.

37https://www.subaru.co.jp/en/ir/