yang, x., fan, d., ren, a. , zhao, n., shah, s. a
TRANSCRIPT

\
Yang, X., Fan, D., Ren, A. , Zhao, N., Shah, S. A. , Alomainy, A., Ur-Rehman, M. and Abbasi, Q. H. (2020) Diagnosis of the Hypopnea syndrome in the early stage. Neural Computing and Applications, 32, pp. 855-866. (doi:10.1007/s00521-019-04037-8)
There may be differences between this version and the published version. You are advised to consult the publisher’s version if you wish to cite from it.
http://eprints.gla.ac.uk/177710/
Deposited on 14 January 2019
Enlighten – Research publications by members of the University of Glasgow
http://eprints.gla.ac.uk

Diagnosis of the Hypopnea Syndrome in the
Early Stage
Xiaodong Yang, Dou Fan, Aifeng Ren, Nan Zhao, Syed Aziz Shah, Akram Alomainy,
Masood Ur-Rehman, Qammer H. Abbasi
Xiaodong Yang, Dou Fan, Aifeng Ren, Nan Zhao and Syed Aziz Shah are with the School of
Electronic Engineering, Xidian University, Xi’an, Shaanxi, China, 710071.
A. Alomainy is with the School of Electrical Engineering and Computer Science, Queen Mary
University of London, London E1 4NS, U.K.
Masood Ur Rehman is with the School of Computer Science and Electronic Engineering at University
of Essex, Colchester CO4 3SQ, UK.
Qammer H. Abbasi is with the School of Engineering, University of Glasgow, G12 8QQ, UK.
Email: [email protected]
Phone: +86-29-88202830
Abstract — Hypopnea syndrome is a chronic respiratory disease that is characterized by repetitive
episodes of breathing disruptions during sleep. Hypopnea syndrome is a systemic disease that
manifests respiratory problems, however, more than 80% of Hypopnea syndrome patients remain
undiagnosed due to complicated polysomnography. Objective assessment of breathing patterns of
an individual can provide useful insight into the respiratory function unearthing severity of
Hypopnea syndrome. This paper explores a novel approach to detect incognito Hypopnea
syndrome as well as provide a contactless alternative to traditional medical tests. The proposed
method is based on S-Band sensing, peak detection algorithm and sine function fitting for the
observation of breathing patterns and characterization of normal or disruptive breathing patterns
for Hypopnea syndrome detection. The proposed system observes the human subject and changes
in the channel frequency response caused by Hypopnea syndrome utilizing a wireless link between
two monopole antennas, placed 3m apart. Accuracy of the proposed method is established through
comparison with commercial respiratory sensor. The experimental results show that this technique
has the potential to open up new clinical opportunities for contactless and accurate Hypopnea
syndrome monitoring in a patient friendly and flexible environment.
Keywords — Hypopnea syndrome, respiration sensor, early warning, biomedical engineering,
machine learning
I. INTRODUCTION1
Sleep is an essential survival skill and has great significance to human health. Sleep not only affects
the productivity and physical vitality of a person but is also related to many diseases including diabetes,
depression, and even stroke and heart failure [1]. Therefore, sleep function monitoring has a high medical
value.
Hypopnea syndrome is a common illness that occurs when throat muscles intermittently relax and
block the airway during sleep [2]. It is characterized by repetitive episodes of shallow or paused breathing
during sleep and is usually associated with a reduction in blood oxygen saturation. These episodes of
paused breathing typically last 20 to 40 seconds. Signs and symptoms of sleep apnea include excessive
daytime sleepiness, loud snoring, breathing cessation during sleep, abrupt awakening due to respiratory
disorders, such as hypopneas, apneas, and choking. Back in the days, Hypopnea syndrome was
considered as a sleep habit accompanied by snoring, but it is now regarded as a serious clinical disorder.
Several studies indicate that a high percentage of patients suffering from Hypopnea syndrome remain
unidentified, which can greatly affect their routine life and might create severe health complications,
such as reduced work performance. Furthermore, evidence suggest that Hypopnea syndrome is related
to systemic diseases, such as cardiovascular diseases and glucometabolic impairments as well as various
pediatric complications, such as psychological and behavioral disorders, nocturnal enuresis, and growth-
related disorders [3]. Greater association to Hypopnea syndrome not only brings cardiovascular problems
and neurological disorders, it can also cause sudden death in case of severe breathing obstruction [4].
Timely detection of Hypopnea syndrome through observation of respiratory disorder episodes is
therefore of vital importance in personal healthcare.
Polysomnography is a standard method for the diagnosis of Hypopnea syndrome. It is based on a
comprehensive recording of bio-physiological changes occuring during sleep. The test is typically a full
night study performed on a patient in a laboratory environment by medical experts. The PSG monitors
observe heart, lung and brain activity, breathing patterns, arm and leg movements, and blood oxygen
levels in the form of electroencephalogram (EEG), electrocardiogram (ECG), electrooculogram (EOG),
electromyography (EMG), and oxygen saturation (SpO2). Though Hypopnea syndrome can be
objectively assessed and monitored by these signals, the subjects are often uncomfortable by deploying
electrodes and wearing bands on their bodies during this long procedure. Moreover, the data can only be
obtained in institutions or hospitals equipped with dedicated devices [4].
There are many reported attempts that have tried to utilize alternative physiological signals to
overcome the drawbacks of polysomnography [5-7]. One of the examples includes spectral analysis of
snoring sounds to detect Hypopnea syndrome [7]. However, accuracy and feasibility of such methods is
always in question.
With the recent developments, wireless sensing has opened the doors for sleep monitoring systems
leveraging various sensors, such as audio, image, force and temperature [8-18]. Most of these wireless
systems are contact-oriented require wearable sensors worn by the patient to acquire adequate precision
levels in a clinical setting. Use of smartphones’ accelerometer and audio recordings to monitor sleep
disorders is proposed in [8-10]. However, use of such systems in a clinical application is yet not
established. Behar et al. have studied a wearable system composed of an armband sensor, a face-worn
microphone and a wrist-worn oximeter connected to the smartphone for the sleep apnea detection [9].
Force sensors deployed under the mattress top have also been used to detect the heart rate, sleep pattern,

snoring, or respiration rate [11-15]. Martinez et al. have investigated a wireless sensor system to detect
respiratory rate using received signal strength indicator [16]. However, this system requires 15 to 20
sensor nodes to achieve high classification accuracy. Video recordings of sleep patterns through camera-
based optical approach is adopted to detect the breathing pattern via video recordings is discussed in [17]
and [18]. Cost effective-ness of polysomnography technique using split-night sleep monitoring is
considered in [19]. However, availability of the equipment at clinics restricts its wider availability and
flexibility to the patient, as they have to spend the night in a hospital environment. Though wearable
technologies have emerged as a potential solution to monitor the patients unobtrusively, outside clinical
settings, they limits patients comfort due to requirement of a number of body-worn sensors.
In this paper, we investigate a non-invasive system based on S-band sensing to monitor the sleep apnea.
The novelty of this work lies in the development of an accurate and efficient monitoring technique that
provides continuous, contactless and patient-friendly solution. Usability and accuracy of the proposed
system is established through a comparative study with standard commercial respiratory sensors.
II. SYSTEM DESIGN
The proposed method primarily uses sensing technique that works at S-band. Details of the system
architecture are discussed in this section.
A. Basic System Architecture
The proposed sensing system makes use of a wireless link between two antennas positioned at two
sides of the human subject, as illustrated in Figure 1. The two antennas are placed around the chest and
are visually in a straight line, enabling them to establish a Line-of-sight (LOS) link. The distance between
the two antennas is kept at 3m to replicate a typical patient monitoring system in a wireless environment.
This sensing platform is an in-house system and consists of a spectrum analyzer (E8600), vector
network analyzer (Agilent E8363B), antennas, software-defined radio, RF generator, and desktop
workstation equipped with network adaptor. This system can work at a number of frequencies depending
on the operating band of the antennas. For our work, we have selected the S-band frequencies of 2.4GHz-
2.48GHz due to their wide usage in healthcare applications and added benefits discussed in the
proceeding section.
The system employs monopole antennas at the transmitting and receiving ends. This selection of the
antennas is based on a two-fold approach; making the system universal by using widely available
standard type of antennas and decreasing the antenna’s effect on the sensitivity of the system. Along with
the antenna, the emitter includes RF generator, coaxial cable and connector.

Figure 1–Experiment setup for detecting sleep apnea.
The propagation mechanism of RF signals between the transmitter and receiver is complex and can
take both Line-of-sight (LOS) and Non-line-of-sight (NLOS) paths, as shown in Figure 2. The LOS path
refers to the signals propagating in a direct path with no blockade by the human subject. The walls of the
room are covered with RF absorbing material to get rid of these scattered components. It not only
simplifies the overall system model but also improves the accuracy through better detection of minute
chest movements due to breathing and accompanying spatial changes in the channel response.
Figure 2– Radio propagation modes for sleep apnea detection.
B. Wireless Channel Information at S-Band
The proposed system observes the wireless channel between the transmitter and receiver and note
down any sudden variations as a result of change in breathing pattern to detect the sleep apnea episodes.
A group of 30 OFDM subcarriers carrying the channel information is used and can be exported to the
user. Each of the exported data packets contains both the amplitude and phase information for a particular
subcarrier:
( ) | ( ) | nj H
n nH f H f e
. (1)
Where, ( )nH f represents the wireless channel information for nth subcarrier at the central frequency,
人员 1
Microwave Sensing Platform
LOS
NLOS
NLOS
NLOS

fn, | ( ) |nH f is the amplitude information, and nH describes the phase response.
The rationale behind using the S-band sensing is based on the argument that the wireless channel
information retrieved using S-Band sensing technique is a superior metric as compared to other
techniques, such as received signal strength indicator as it presents a fine-grained information of the
wireless channel and is more efficient for small-scale multipath fading [20]. The core idea of using
wireless channel information is to monitor the breathing pattern of the human subject and identify sleep
apnea episodes by keeping track of any minute changes in the channel response. S-band sensing is
sensitive enough to record these small changes but the received signal strength indicator only provides
the received power levels and fails to note down the effects induced by small chest movements caused
by breathing irregularities. Moreover, reflections and scattering of the radio frequency (RF) signal caused
by the chest movements affect different subcarriers differently. S-band sensing technique enables
examination of each of the subcarriers while the conventional received signal strength indicator only
presents average power that can potentially overlook these small changes.
From each wireless channel information (WCI) packet, a 30 1 matrix in the form of channel
frequency response (CFR) can be extracted. Each row of the WCI matrix describes one subcarrier. If
CFRm represents the channel frequency response of mth packet received, then:
CFRm=⟦h1(m),h2(m),h3(m),…,h
30(m)⟧, (2)
where hi(m) denotes the CFR of the subcarrier i, at time m. To examine the time history of CFRm, total
number of CFRm recorded at various time intervals are combined and expressed as:
CFR=⟦CFR1,CFR2,CFR3,… ,CFRk,⟧. (3)
Here, CFR is a 30 k matrix, where k describes the total number of packets received using network
adapter and represents the change in the wireless channel over the observed time duration.
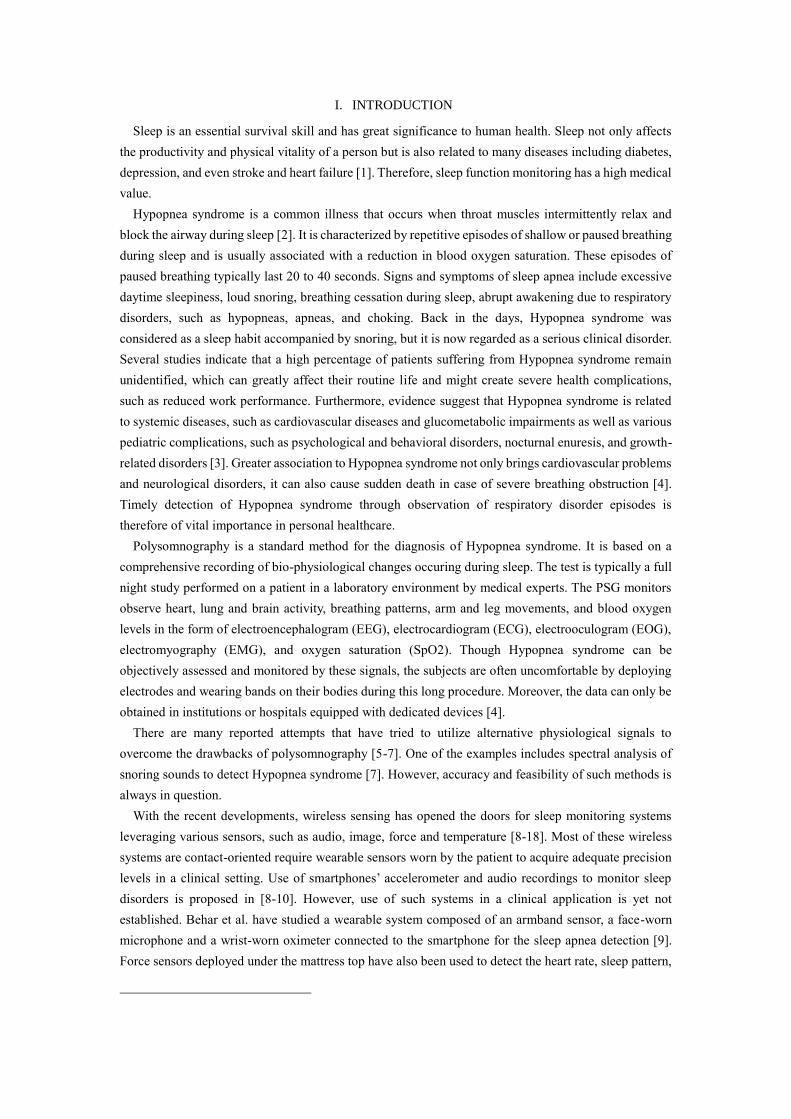
C. Experimental Workflow
The usability of the proposed system is established through performance comparison with a standard
respiratory sensor. Thus, the experimental workflow has two main components:
1. Normal breath detection using both the S-band sensing technique and an invasive breathing sensor.
2. Hypopnea syndrome detection through wireless channel information and an invasive breathing
sensor.
The respiratory sensor also helps to identify the specific frequency that should be chosen, which is a
key step in sleep apnea detection.
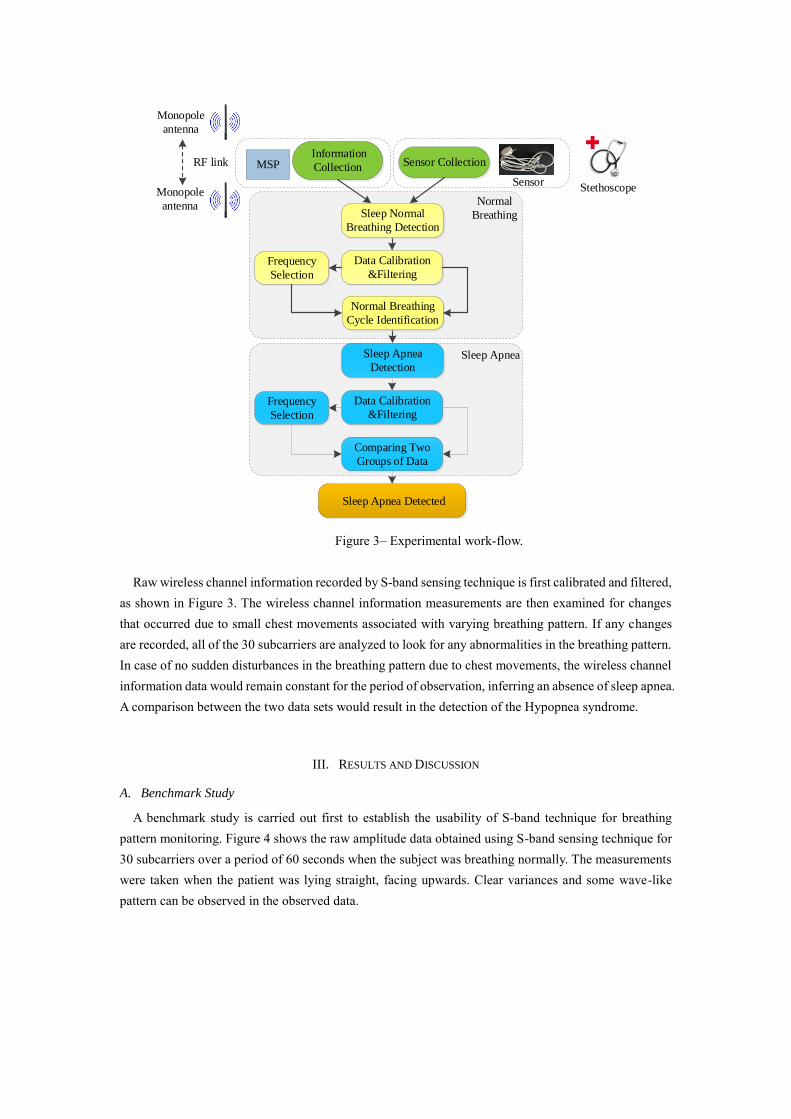
Figure 3– Experimental work-flow.
Raw wireless channel information recorded by S-band sensing technique is first calibrated and filtered,
as shown in Figure 3. The wireless channel information measurements are then examined for changes
that occurred due to small chest movements associated with varying breathing pattern. If any changes
are recorded, all of the 30 subcarriers are analyzed to look for any abnormalities in the breathing pattern.
In case of no sudden disturbances in the breathing pattern due to chest movements, the wireless channel
information data would remain constant for the period of observation, inferring an absence of sleep apnea.
A comparison between the two data sets would result in the detection of the Hypopnea syndrome.
III. RESULTS AND DISCUSSION
A. Benchmark Study
A benchmark study is carried out first to establish the usability of S-band technique for breathing
pattern monitoring. Figure 4 shows the raw amplitude data obtained using S-band sensing technique for
30 subcarriers over a period of 60 seconds when the subject was breathing normally. The measurements
were taken when the patient was lying straight, facing upwards. Clear variances and some wave-like
pattern can be observed in the observed data.
Normal
Breathing
Sleep Apnea
Sensor Collection
Sensor
Information
Collection
Frequency
Selection
Sleep Apnea Detected
Sleep Apnea
Detection
Data Calibration
&Filtering
Comparing Two
Groups of Data
Sleep Apnea
Frequency
Selection
Normal Breathing
Cycle Identification
Data Calibration
&Filtering
Sleep Normal
Breathing Detection
Normal
Breathing
Monopole
antenna
Monopole
antenna
RF link MSP
Stethoscope
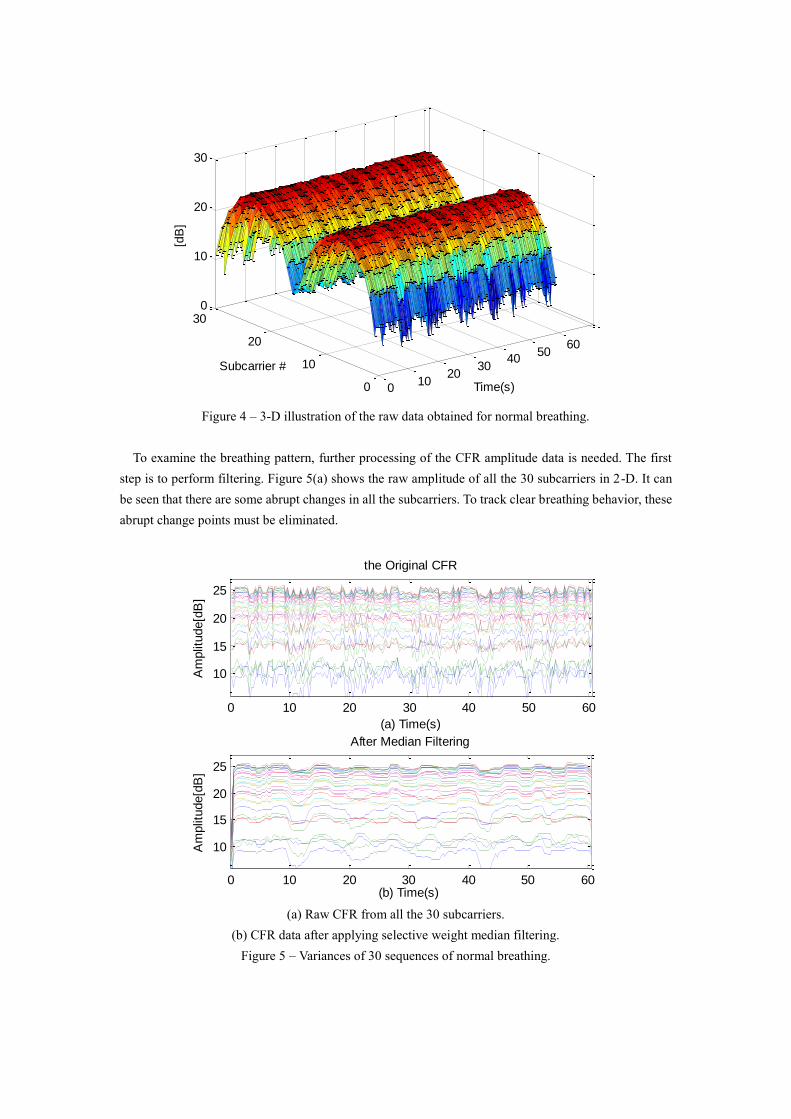
Figure 4 – 3-D illustration of the raw data obtained for normal breathing.
To examine the breathing pattern, further processing of the CFR amplitude data is needed. The first
step is to perform filtering. Figure 5(a) shows the raw amplitude of all the 30 subcarriers in 2-D. It can
be seen that there are some abrupt changes in all the subcarriers. To track clear breathing behavior, these
abrupt change points must be eliminated.
(a) Raw CFR from all the 30 subcarriers.
(b) CFR data after applying selective weight median filtering.
Figure 5 – Variances of 30 sequences of normal breathing.
010
2030
4050
60
0
10
20
300
10
20
30
Time(s)
Subcarrier #
[dB
]
0 10 20 30 40 50 60
10
15
20
25
the Original CFR
(a) Time(s)
Am
plit
ude[d
B]
0 10 20 30 40 50 60
10
15
20
25
After Median Filtering
(b) Time(s)
Am
plit
ude[d
B]

The selective weight median filter is used to remove the abrupt change points. The choice of this filter
is based on the fact that it is a highly effective elimination method for the impulse noise [21], appearing
in Figure 5(a). The conventional filters like Chebyshev or Butterworth, are not appropriate to remove
such high-frequency noise as they blur the rising and falling edges of the signal which are critical for
identifying the sleep apnea episodes in this study. Figure 5(b) shows a much cleaner CFR data for the 30
subcarriers after using the selective weight median filtering.
We will now discuss the process of characterizing normal and abnormal breathing.
From Figure 5(b), we can see that most of the 30 subcarriers have conspicuous periodic oscillatory
patterns correlated with breathing, whereas the rest are messy. The channel giving most clear information
of breathing pattern with most obvious wave-like pattern after the filtering process is considered as the
most ‘suitable’ for the detection of the Hypopnea syndrome. Based on this, we selected the time history
of the 26th subcarrier as shown in Figure 6.
Figure 6 – Time history of the 26th subcarrier and corresponding filtered data for 60 seconds duration.
The data for the chosen individual subcarrier is analyzed for a sample of 60 seconds. Figure 6(a) shows
the normal breathing of a person lying in a straight position. Signs of breathing are clearly evident due
to fluctuations in amplitude information. Figure 6(b) shows the CFR values after applying the median
filter.
0 10 20 30 40 50 6022
23
24
25the Original CFR
(a) Time(s)
[dB
]
Subcarrier # 26
0 10 20 30 40 50 6022
23
24
25After Median Filtering
(b) Time(s)
[dB
]
Figure 7–Normal breathing obtained using breathing sensor
Figure 7 presents a comparison of the filtered breathing pattern obtained using S-band sensing
technique with that recorded using a breathing sensor. The filtered breathing patterns shown in Figures
6(b) and 7(b) indicate that over the period of 60 seconds, a total number of 10 breathing cycles were
obtained. This comparison also helps to select the specific frequency for detection. It establishes the
ability of S-band sensing to successfully record a clear breathing pattern.
To analyze the accuracy of S-band sensing technique, the Sine function fitting algorithm is used to
compare the results of the two detecting methods in Fig. 8. The S-band sensing technique has observed
10 complete breathing cycles. Value of ω is 4.989e-05 for S-band technique, which is equal to b1.
0 10 20 30 40 50 600
100
200
(a) Time(s)
the Original Data
0 10 20 30 40 50 600
100
200
(b) Time(s)
After Median Filtering
0 20 40 60 80 100 120 140 160 180 200
-0.5
0
0.5
xx
Sig
nal F
ilter
General model Sin1:
f(x) = a1*sin(b1*x+c1)
Coefficients (with 95% confidence bounds:)
a1 = 24.07 (-268.9, 317.1)
b1 = 4.989e-05 (-0.01589, 0.01599)
c1 = 1.762 (-61.01, 64.54)
Goodness of fit:
SSE: 31.72
R-square: 0.001354
Adjusted R-square: -0.008784
RMSE: 0.4013
(a)

(a) Normal breathing obtained using S-band sensing technique.
(b) Normal breathing obtained using breathing sensor.
Figure 8–Sine function fitting for normal breathing.
Sine function fitting results for the respiratory sensor in Figure 8(b) also have 10 complete breathing
cycles with ω = 5.032e-05, which is equal to b1. Comparing the two observations, regardless of intuitive
or calculated results, the observations of detecting normal breathing have close agreement. This show
that S-band sensing technique and the designed measurement system has a good ability to detect
breathing patterns.
B. Sleep Apnea Detection
Acquisition of the data is in-line with the benchmark study for this part of the experiment. Raw
wireless channel information is obtained with the human subject lying straight. The subject first breathes
normally, then stops breathing for a while to mimic sleep apnea episode and then starts breathing
normally again. Figure 9 illustrates the raw data for this experiment in 3-D.
0 500 1000 1500 2000 2500 3000
-20
-10
0
10
20
30
x
y
Breath sensor
General model Sin1:
f(x) = a1*sin(b1*x+c1)
Coefficients (with 95% confidence bounds:)
a1 = 105.3 (104.5, 106.2)
b1 = 5.032e-05 (-0.01589, 0.01599)
c1 = 1.446 (1.304, 1.589)
Goodness of fit:
SSE: 6.856e+05
R-square: 0.000257
Adjusted R-square: -0.0004101
RMSE: 15.12
(b)

Figure 9–Raw data recorded for Hypopnea syndrome.
Figure 10 shows the breathing pattern observations taken through the respiratory sensor for 120
seconds duration. The results indicate that the subject is breathing normally from 0 to 52 seconds. A
constant level in amplitude for the next 26 seconds (from 52nd second to 78th second) reflects that the
subject is experiencing a sleep apnea episode. A normal breathing pattern can be observed from the 78th
second onward as the apnea episode is over.
Figure 10–Sleep apnea detection using breathing sensor.
S-band sensing results are then analyzed for the sleep apnea measurements. Response for all of the 30
subcarriers is analyzed as shown in Figure 9. Figure 11(a) shows the raw variances of amplitude
information for subcarrier # 30 over a period of 120 seconds. The fluctuation of wireless channel
information data from 0 dB to 8 dB indicates the breathing pattern but a sleep apnea episode is not present
as clearly as shown in Figure 10. To reduce the impulse noise, the median filter is applied obtaining a
0
50
100
150
200
0
10
20
300
5
10
15
20
25
30
Packet #Subcarrier #
Am
plit
ude(d
B)
0 10 20 30 40 50 60 70 80 90 100 110 1200
100
200
(a) Time(s)
the Original Data
0 10 20 30 40 50 60 70 80 90 100 110 1200
100
200
(b) Time(s)
After Median Filtering
(b)

clear sleep apnea episode from 52nd second to 78th second. This close agreement between the output of
the respiratory sensor and S-band sensing further establishes the working of the proposed method as an
efficient alternative.
Figure 11 – Variances of amplitude for sleep apnea episode at subcarrier 30.
As shown in Figure 10, the breathing waveform can be approximated as a periodic sinusoidal wave.
Hence, the number of the peaks of these sinusoidal waves determines their periodicity and their peak
locations ascertain sleep apnea. Thus, we choose peak detection to monitor occurrence of the sleep apnea.
Standard peak detection algorithm is that the maximum is labeled as a peak for every set of three points.
For sleep apnea detection, we introduced used two changes. First is to set a threshold on the minimum
distance between two consecutive peaks. Since the maximal breathing frequency in an adult human is 18
breaths/min, we set a conservative threshold of 3.3 seconds. Second is to set a threshold on the minimum
amplitude at which a peak is detected.
0 1 20 30 40 50 60 70 80 90 100 110 1200
2
4
6
8the Original CFR
(a) Time(s)
[dB
]
0 10 20 30 40 50 60 70 80 90 100 110 1200
2
4
6
8After Median Filtering
(b) Time(s)
[dB
]
Subcarrier # 30
0 10 20 30 40 50 60 70 80 90 100 110 120 0
1
2
3
4
5
6
7
8
(a) Time(s)
[dB
]
Sleep Apnea

(a)Breathing pattern obtained using S-band sensing technique.
(b)Breathing pattern obtained using breathing sensor.
Figure 12 – Sleep apnea detection using peak detection algorithm.
Figure 12 shows that peak detection algorithm identifies correct peaks and the pause times. There are
14 peaks and one apnea in breathing pattern obtained using the S-band sensing technique. Also, the pause
times are more than 10 seconds. The results agree excellently with that obtained using the respiratory
sensor.
IV. CONCLUSION
A novel contactless monitoring system for breathing pattern observation and sleep apnea detection is
presented in this paper. The proposed technique is based on S-band sensing system in an indoor
environment and makes use of wireless channel information to observe breathing patterns and identify
small changes in the channel response due to the chest movements caused by breathing abnormalities.
The proposed system utilizes the median filtering to eliminate impulse noise in the observed data. A
detailed measurement campaign is carried out to obtain the breathing pattern of a normal breathing
human subject using S-band sensing technique and a standard respiratory sensor simultaneously to
compare and establish the working of the proposed technique in benchmark study. Sine function fitting
algorithm is used to analyze the detected results. A close agreement between the two results has
established the accuracy of the proposed method. The proposed technique is then used to detect
Hypopnea syndrome successfully. Similar peaks and pause times using peak detection algorithm
observed for the S-band sensing and respiratory sensor for sleep apnea has further established the ability
and accuracy of the proposed technique for Hypopnea syndrome detection. The experimental have shown
that the proposed S-band sensing is an efficient alternative to traditional Hypopnea syndrome detection
methods with added features of contactless, and patient friendly system exhibiting sufficiently high
precision with good potential of early-warning Hypopnea syndrome detection for both clinical and home
settings.
V. CONFLICT OF INTEREST
The authors declared that they have no conflicts of interest to this work.
0 10 20 30 40 50 60 0 0 90 100 110 1200
20
40
60
80
100
120
140
160
180
200
(b) Time(s)
Sleep Apnea

REFERENCES
[1]. Hoque, Enamul, R. F. Dickerson, and J. A. Stankovic. “Monitoring body positions and movements
during sleep using WISPs.” Wireless Health 2010, Wh 2010, San Diego, Ca, Usa, October DBLP,
2010:44-53.
[2]. Epstein, L. J., et al. “Clinical guideline for the evaluation, management and long-term care of
obstructive sleep apnea in adults.” Journal of Clinical Sleep Medicine Jcsm Official Publication of
the American Academy of Sleep Medicine 5.3(2009):263.
[3]. Erdenebayar, U, et al. “Obstructive Sleep Apnea Screening Using a Piezo-Electric Sensor. Journal
of Korean Medical Science32.6(2017):893-899.
[4]. Lee, Jong Ha, H. J. Park, and Y. N. Kim. “Monitoring obstructive sleep apnea with
electrocardiography and 3-axis acceleration sensor.” (2015):1-6.
[5]. Erman, M. K., et al. “Validation of the ApneaLink for the screening of sleep apnea: a novel and
simple single-channel recording device.”Journal of Clinical Sleep Medicine Jcsm Official
Publication of the American Academy of Sleep Medicine 3.4(2007):387-92.
[6]. Lévy, P, et al. “Accuracy of oximetry for detection of respiratory disturbances in Hypopnea
syndrome.” Chest 109.2(1996):395.
[7]. Karunajeewa, A. S., U. R. Abeyratne, and C. Hukins. “Multi-feature snore sound analysis in
obstructive sleep apnea-Hypopnea syndrome.”Physiological Measurement 32.1(2011):83-97.
[8]. J. Behar et al., “A review of current sleep screening applications for smartphones.”Physiological
Meas., vol. 34, no. 7, pp. R29–R46, Jun. 2013.
[9]. J. Behar et al., “SleepAp: An automated obstructive sleep apnoea screening application for
smartphones.”IEEE J. Biomed. Health Informat., vol. 19, no. 1, pp. 325–331, Jan. 2015.
[10]. N. Oliver and F. Flores-Mangas, “Healthgear: Automatic sleep apnea detection and monitoring with
a mobile phone.”J. Commun., vol. 2, no. 2, pp. 1–9, Mar. 2007.
[11]. L. Jiang et al., “Automatic sleep monitoring system for home healthcare.” In Proc. IEEE-EMBS Int.
Conf. Biomed. Health Informat., Jan. 2012, pp. 894–897.
[12]. D. C. Mack et al., “Development and preliminary validation of heart rate and breathing rate
detection using a passive, ballistocardiography-based sleep monitoring system.” IEEE Trans. Inf.
Technol. Biomed., vol. 13, no. 1, pp. 111–120, Jan. 2009.
[13]. K. Malakuti and A. Albu, “Towards an intelligent bed sensor: Nonintrusive monitoring of sleep
irregularities with computer vision techniques.”in Proc. Int. Conf. Pattern Recog., Aug. 2010, pp.
4004–4007.
[14]. J. Paalasmaaet al., “Unobtrusive online monitoring of sleep at home.” In Proc. Annu. Int. Conf.
IEEE Eng. Med. Biol. Soc., Aug. 2012, pp. 3784–3788.
[15]. C. Palmeroet al., “Automatic sleep system recommendation by multimodal RBG-depth-pressure
anthropometric analysis.” Int. J. Comput. Vis.,vol. 2016, pp. 1–16, Jun. 2016.
[16]. M. Martinez et al., “Breath rate monitoring during sleep using near-IR imagery and PCA.” in Proc.
Int. Conf. Pattern Recog., Nov. 2012, pp. 3472–3475.
[17]. Wang, Ching Wei, et al. “Unconstrained Video Monitoring of Breathing Behavior and
Application to Diagnosis of Sleep Apnea.” IEEE Trans Biomed Eng 61.2(2014):396-404.
[18]. M. Martinez et al., “Breath rate monitoring during sleep using near-IR imagery and PCA.” in Proc.
Int. Conf. Pattern Recog., Nov. 2012, pp. 3472–3475.

[19]. P. A. Deutsch, M. S. Simmons, J M. Wallace, “Cost-effectiveness of Split-night Polysomnography
and Home Studies in the Evaluation of Obstructive Hypopnea syndrome.” Journal of Clinical Sleep
Medicine AASM, vol. 2, pp. 145-153, 2006.
[20]. Z. Yang, Z. Zhou, and Y. Liu, “From RSSI to CSI: Indoor localization via channel response.”ACM
Comput.Surv., vol. 46, no. 2, Nov. 2013, Article no. 25.
[21]. Sudheesh, K. V., and L. Basavaraj. “Selective weights based median filtering approach for impulse
noise removal of brain MRI images.” Electrical, Electronics, Communication, Computer and
Optimization Techniques (ICEECCOT), 016 International Conference on. IEEE, 2016.