xonerations in 2013 the national registry of exonerations · includes a description of 12 “group...
TRANSCRIPT

Page 1 of 40
EXONERATIONS IN 2013
The National Registry of Exonerations
February 4, 2014
2013 was a record-breaking year for exonerations in the United States.
The National Registry of Exonerations has recorded 87 exonerations that occurred in 2013. The
next highest total was in 2009, with 83 known exonerations, and the difference is bound to grow
as we learn about additional exonerations that occurred in 2013.1
The ten states with the most exonerations in 2013 were, in order: Texas, Illinois, New York,
Washington, California, Michigan, Missouri, Connecticut, Georgia, and Virginia. See Table 1.
Table 1: Exonerations in 2013 by State
Texas – 13 Michigan – 5 Massachusetts – 3 Arkansas – 1 New Jersey – 1
Illinois – 9 Missouri – 5 Maryland – 2 Arizona – 1 Pennsylvania – 1
New York – 8 Connecticut – 4 North Carolina – 2 Florida – 1 Tennessee – 1
Washington – 7 Georgia – 4 Wisconsin – 2 Indiana – 1 Utah – 1
California – 6 Virginia – 4 Wyoming – 2 Kansas – 1 Vermont – 1
Federal (NY) – 1
All told, the Registry now lists 1,304 exonerations, from 1989 to February 3, 2014.
The 87 known exonerations in 2013 reflect several long term trends in exonerations in America:
The number of DNA exonerations continued to decline slowly, as it has for most of the
past decade, while the number of non-DNA exonerations rose sharply.
1 For example, 15 of the 79 exonerations listed for 2012 were not identified until 2013. So far, only 2 exonerations
that occurred in 2013 have been posted since the beginning of 2014.

Page 2 of 40
o The number of exonerations in which DNA played any role has dipped from 23 in
2005, to 20 in 2012, to 18 in 2013.2
o In the same period the number of non-DNA exonerations rose from 34 in 2005, to
59 in 2012, to 69 in 2013. These two trends are displayed in Figure 1.
o The net result is that DNA exonerations, which have always been a minority of
known exonerations in the United States, were about a fifth of the total in 2013.
Figure 1: Exonerations, 2005- 2013
DNA and Non-DNA
(N=1,300)3
Twenty-seven of the 87 known exonerations that occurred in 2013 – almost a third of the
total – were in cases in which no crime in fact occurred. This is a record number that is
likely to grow as we learn about more 2013 exonerations. Almost half of these no-crime
exonerations were for non-violent crimes, primarily drug convictions.
2 These numbers refer to cases listed by the National Registry of Exonerations in which DNA evidence played any
role in the process of obtaining exoneration. The Innocence Project maintains a shorter list of exonerations in which
DNA evidence was central to establishing innocence; for 2013, the Innocence Project lists 10 DNA exonerations.
See http://www.innocenceproject.org/know/Search-Profiles.php. 3 As of February 2, 2014.

Page 3 of 40
Fifteen of the 87 known exonerations in 2013 – 17% – occurred in cases in which the
defendants were convicted after pleading guilty, also a record number. Such cases used to
be far less common. The long-term rate has doubled since 2008, and the actual number
continues to climb.
The great majority of exonerations in every year we have studied were homicide and
sexual assault cases. In 2013, we had 40 murder exonerations – including one
exoneration of a prisoner who had been sentenced to death – and 18 exonerations that
involved rape or other sexual assault.
But the proportion of exonerations that do not involve rape or murder has grown over
time, from 18% from 1989 through 1998 to 24% from 2009 through 2013. In 2013, 29
exonerations, 33% of the total, did not involve either of these extreme crimes of violence
– a record number of exonerations in such cases, and a comparatively high proportion of
all exonerations.
Thirty-three known exonerations in 2013 – 38% of the total – were obtained at the
initiative or with the cooperation of law enforcement. This is the second highest annual
total of exonerations with law enforcement cooperation, down slightly from 2012 (39
cases, 49% of all exonerations in that year4) but consistent with a pattern we described a
year ago: police and prosecutors appear to be taking increasingly active roles in
reinvestigating possible false convictions, and to be more responsive to claims of
innocence from convicted defendants.
These trends are related. One common theme is the type of evidence that’s available to prove the
defendant’s innocence. If there’s DNA from the actual criminal that does not match the
defendant, proof of innocence is straightforward; otherwise it’s much harder. It’s harder yet
when there’s no way at all to identify the person who actually did it because the defendant was
convicted of a crime that didn’t occur: a homicide that was really an accident, a sexual assault
that never happened or a non-existent drug crime for which he was framed.
A second common theme is resources and attention. Exoneration stories often note with approval
that the defendant “always protested his innocence.” On the other hand, innocent defendants who
plead guilty have a much harder time getting attention and help from anybody – friends and
relatives, the media, innocence projects, prosecutors, police, courts. One reason is that those who
plead guilty get lesser sentences, and scarce resources are allocated first to those who might be
executed or spend all or most of their lives in prison. That’s one reason why the great majority of
4 In our 2012 Update, we reported that 54% of the exonerations in 2012 involved law enforcement cooperation.
Since then, the number of such cases has increased and the proportion has decreased slightly as we have learned of
additional exonerations that occurred in 2012. See:
http://www.law.umich.edu/special/exoneration/Documents/NRE2012UPDATE4_1_13_FINAL.pdf.
Page 4 of 40
known exonerations are for murder and rape, the most serious common crimes of violence with
the harshest sentences.
The pattern of exonerations in 2013 suggests that we are increasingly willing to consider and act
on the types of innocence claims that are often ignored: those without biological evidence or
with no actual perpetrator; cases with comparatively light sentences; judgments based on guilty
pleas by defendants who accepted plea bargains to avoid the risk of extreme punishment after
trial. The recent increase in the number of exonerations initiated by law enforcement directly
shows that police and prosecutors have become more attentive and concerned about the danger
of false conviction.
Exonerations are excursions into the past. Those who were exonerated in 2013 were convicted,
on average, more than 12 years earlier; some more than 30 years earlier. There is no way to tell
from these cases whether we are getting better at avoiding wrongful convictions in the first place.
It does seem, however, that we are working harder to identify the mistakes we made years ago
and that we are catching more of them. If we are also learning from those tragic errors that have
come to light, that would be a big step in the right direction.

Page 5 of 40
KNOWN EXONERATIONS IN THE UNITED STATES AS OF
JANUARY 1, 2014
1. Background
The National Registry of Exonerations was launched in May 2012, as a joint project of the
University of Michigan Law School and the Center on Wrongful Convictions at Northwestern
University School of Law. At that time the Registry listed 891 cases.
Twenty months later the Registry now includes 1,304 exonerations, an increase of 413 or 46%.
The Registry changes constantly. We add exonerations virtually every week. We have removed a
few cases after learning that they do not in fact meet our criteria. And we constantly update
summaries of cases that are already listed, add missing data and correct errors, based on our own
research and on information from others.
We also prepare periodic reports on the Registry. Given the nature of our work, each such report
is a snapshot of the state of the data on a particular date. For current information on a case and
for the most recent cases, patterns and summaries, please consult the Registry website.
The first and most comprehensive report was released when the Registry was launched in May
2012, Exonerations in the United States, 1989-2012 (the Exoneration Report). It describes the
873 exonerations that we had identified and coded by the end of February 2012. That report also
includes a description of 12 “group exonerations” – sets of cases in which corrupt police officers
systematically framed innocent defendants for non-existent crimes, mostly possession of illegal
drugs or guns. Those group exonerations included at least 1,100 additional exonerated criminal
defendants who are not listed in the Registry itself.
In April 2013 we released a 2012 Update that describes the status of the Registry as of the end of
2012. This report fills the same function for the year 2013. We plan to continue to issue annual
reports in years to come.

Page 6 of 40
2. Basic Patterns as of the Start of 2014
A. Cases Added in 2013
We added 234 exonerations to the Registry in 2013, and removed three cases which we
determined did not qualify as exonerations by our criteria.
With these additions the Registry listed 1,281 exonerations on December 31, 2013.
The 234 exonerations we added in 2013 are divided into two unequal groups:
New exonerations. Over a third of the exonerations we added (85/234) took place in
2013.
o These 85 cases represent the highest number of known exonerations ever
recorded for one calendar year, with 2009 coming in as the next closest year at
83. We have continued to add cases since the end of 2013, bringing our total
for 2013 to 87 with no change to our 2009 total.
Old exonerations. About two thirds of the cases we added (149/234) – occurred in
earlier years but were not previously identified.
o We added 15 exonerations that occurred in 2012, an increase of 23% over the
64 exonerations we previously knew about in 2012. The remaining 134 were
spread out reasonably evenly from 1989 to 2011, a 14% increase in known
exonerations for that entire period.
This rapid increase confirms our claim in the Exoneration Report that the exonerations
we now know about are only a fraction of all exonerations that have occurred.
B. What’s Changed and What Hasn’t
The new exonerations that occurred in 2013 are generally similar to the
exonerations discussed in our previous report.
o A significant plurality are homicide cases (46%, 39/85) – including one
exoneration of a defendant who had been sentenced to death – and sexual
assault cases (21%, 18/85); 21% involved DNA (18/85); 9% of the exonerees
were women (8/85); 53% were black (45/85).
General trends:
o The proportion of exonerations in cases in which the defendant pled guilty
continues to increase as we identify additional cases, from 8% in the
Exoneration Report in May 2012, to 9% at the end of 2012, to nearly 11% at
the end of 2013.

Page 7 of 40
o The proportion of rape and murder exonerations is dropping. Most known
exonerations still involve homicide or sexual assault or both, but that
proportion is down from 83% of known exonerations on March 1, 2012; to
80% at the end of 2012; to 78% at the end of 2013. (It was 96% in the best
available study in 2004.5)
o The overall proportion of DNA cases continues to decline, from 35% of
known exonerations in our first Report, to 33% in the 2012 Update, to 28% at
the end of 2013.
o The number of known exonerations in cases where no crime has occurred also
increased, from 15% in our initial Report, to 19% in the 2012 Update, to 22%
in this Report.
Several of these trends reflect sharp changes among the old exonerations we
have added, which account for the noticeable shifts we see in a short period of time:
o 34% of the old exonerations we added did not include sexual assault or
homicide, compared to 17% in the Exoneration Report and 20% in the 2012
Update.
o In 42% of the old cases added, no crime occurred, compared to 15% of known
exonerations in the Exoneration Report and 19% in the 2012 Update.
o Only four of the old exonerations we added to the list involved DNA – 3%.
These trends are related. The exonerations they concern – those without DNA, where
no victim was killed or raped, or no crime actually occurred – appear to be less
publicized and less well-known than the archetypal exoneration we have all seen and
read about repeatedly: a defendant is sentenced to death or life imprisonment after a
trial for a rape-murder, and is exonerated decades later by DNA.
Our work over the past year suggests that there are many of these less dramatic
exonerations that have escaped notice. We expect to find more of them in the years to
come.
There has been a recent increase in exonerations in cases in which the defendant
pled guilty.
There have been 60 guilty-plea exonerations in the last 5 years – an average of 12 a
year (and more per year than in any previous year), up from an average of 4 a year
from 1989 through 2008. Through 2008, guilty-plea cases made up 8% of known
exonerations; since 2009 they are 16%.
5 Samuel R. Gross et al., Exonerations in the United States, 1989 Through 2003, 95 J. CRIM. L. & CRIMINOLOGY
523 at 529 Table 1 (2005).

Page 8 of 40
This may reflect greater willingness by authorities to reconsider the guilt of innocent
defendants who accepted plea bargains rather than risk higher penalties at trial.
Death penalty exonerations continue at a high rate. Eight percent of known
exonerations occurred in cases in which the defendants were sentenced to death
(105/1281). However, since death sentences are a tiny sliver of felony convictions –
less than 1/100 of 1% – this reflects a uniquely high rate of exoneration.
Death row exonerations have averaged about 3 a year for the past decade, down from
about 6 per year for the decade before that. This decrease is not surprising. The
average time from conviction to exoneration is about 10 years in death penalty cases,
and the total number of death sentences in the United States – which averaged over
280 a year from 1988 through 1999 – has dropped rapidly since 2000 to 80 per year
or fewer in the past three years.6 The number of death row exonerations will continue
to drop if the death penalty continues to lose favor in the United States and death
sentences become increasingly rare.
6 See http://www.deathpenaltyinfo.org/death-sentences-united-states-1977-2008.

Page 9 of 40
3. Exonerations in the Registry as of January 1, 2014
A. Who's Been Exonerated, and by What Process
Of the 1,281 individual exonerations from January 1989 through December 2013:
92% were men (1184/1281) and 8% were women (97/1281).7
By race:
o 47% were black (598/1281),
o 40% were white (513/1281),
o 11% were Hispanic (147/1281), and
o 2% were Native American or Asian (23/1281).
11% pled guilty (136/1281) and the rest were convicted at trial, 81% by juries
(1040/1281) and 7% by judges (91/1281). In 1% (14/1281), we don’t know whether
the trial conviction was by a jury or judge.
28% were cleared at least in part with the help of DNA evidence (363/1281).
72% were cleared without DNA evidence (918/1281).
Almost all had been in prison for years; half for at least 8 years; more than 75% for at
least 3 years.
As a group, the defendants had spent nearly 12,500 years in prison for crimes for
which they should not have been convicted – an average of 10 years each.8
As a procedural matter, these exonerations occurred in several ways; in some cases, in more than
one way:
Pardons: In 106 cases, governors (or in some states, other government officers or
bodies) issued pardons based on evidence of the defendants’ innocence, including 42
cases of defendants whose charges had previously been dismissed, and three who had
been acquitted on retrial by a jury or a judge.9
Dismissals: In 975 cases, criminal charges were dismissed by courts, generally on motion
by the prosecution, after new evidence of innocence emerged (not counting those in
which the defendant was later pardoned or received a certificate of innocence).
7 Because of this lopsided distribution, we generally refer to exonerated defendants using male pronouns.
8 This is a conservative estimate of the direct consequences of these wrongful convictions. We have not counted
time spent in custody before conviction. Nor have we included time spent on probation or parole, or time on bail or
other forms of supervised release pending trial, retrial, or dismissal, even though all of these conditions involve
restrictions on liberty – some mild, some onerous. 9 Under the Texas Wrongful Imprisonment Act (the “Tim Cole Act”), for example, an exonerated defendant may
need a pardon even after a dismissal or an acquittal in order to be eligible for compensation for wrongful
incarceration. See TEX. CIV. PRAC. & REM. CODE ANN. § 103.001 (2011).

Page 10 of 40
Acquittals: In 169 cases, the defendants were acquitted on retrial on the basis of newly
presented evidence that they were not guilty of the crimes for which they were originally
convicted, mostly by juries (156 cases), occasionally by judges (13 cases).
Certificates of Innocence: In a small but growing number of cases – 29 to date – courts
have issued “certificates of innocence,” “declarations of wrongful imprisonment,” or
similar judgments of innocence.10
(In two case, the defendants had already received
executive pardons.)
Posthumous Exonerations: Twelve defendants received posthumous exonerations; three
of them also received judicial declarations of innocence, and one of those three received
an executive pardon as well.
Overall, 29% of known exonerations in the United States since 1989 included cooperation by
police or prosecutors or both. As we have mentioned, the number and proportion of such cases
appear to be increasing over time.11
B. Exonerations by Crime
As before, the great majority of known exonerations at the end of 2013 are homicide cases (47%)
and sexual assault cases (31%). But the proportion of exonerations in cases that do not involve
homicide, rape or child sex abuse continues to climb, from 4% in the first comprehensive
national report on exonerations in 2005,12
to 17% in the Exoneration Report, to 20% in the 2012
Update, to 22% in this Report.
10
See, e.g., 735 ILL. COMP. STAT. 5/2-702 (2012) (detailing Illinois’s procedure for filing a petition for a certificate
of innocence). 11
See supra n. 3 and related text. The numbers of exonerations by year and official cooperation are tabulated below:
Exonerations With Prosecutor or Police Cooperation (PPC) Over Time
‘89 ‘90 ‘91 ‘92 ‘93 ‘94 ‘95 ‘96 ‘97 ‘98 ‘99 ‘00 ‘01 ‘02 ‘03 ‘04 ‘05 ‘06 ‘07 ‘08 ‘09 ‘10 ‘11 ‘12 '13 TOTAL
PPC Cases 7 5 8 10 9 4 10 9 6 7 8 20 20 22 16 14 17 17 18 23 20 18 14 39 32 373
All Cases 20 21 32 27 26 24 29 43 41 32 46 68 74 56 71 53 56 58 62 62 83 68 65 79 85 1,281
% PPC 35% 24% 25% 37% 35% 17% 34% 21% 15% 22% 17% 29% 27% 39% 23% 26% 30% 29% 29% 37% 24% 26% 22% 49% 38% 29%
12 Samuel R. Gross et al., Exonerations in the United States, 1989 Through 2003, 95 J. CRIM. L. & CRIMINOLOGY
523 at 529 Table 1 (2005).

Page 11 of 40
Table 2: Exonerations by Crime, 1989 – 2013
CRIME
Homicide
Murder
Death sentences
Other murder convictions
Manslaughter
47% (597)
45% (579)
8% (105)
37% (474)
1% (18)
Sexual Assault
Sexual assault on an adult
Child sex abuse
31% (398)
19% (244)
12% (154)
Other Crimes of Violence
Robbery
Assault
Attempted murder
Arson
Kidnapping
Child Abuse
Supporting Terrorism
Miscellaneous
13% (169)
6% (77)
3% (38)
2% (26)
0.8% (10)
0.5% (6)
0.3% (4)
0.2% (2)
0.5% (6)
Non-Violent Crimes
Drug crimes
Tax/Fraud/Bribery & Corruption
Gun Possession
Solicitation/Conspiracy
Theft/Stolen Property
Sex Offender Registration
Destruction of Property
Miscellaneous
9% (117)
4% (51)
2% (20)
0.6% (8)
0.5% (7)
0.5% (6)
0.3% (4)
0.2% (2)
1% (19)
TOTAL 100% (1281)
Page 12 of 40
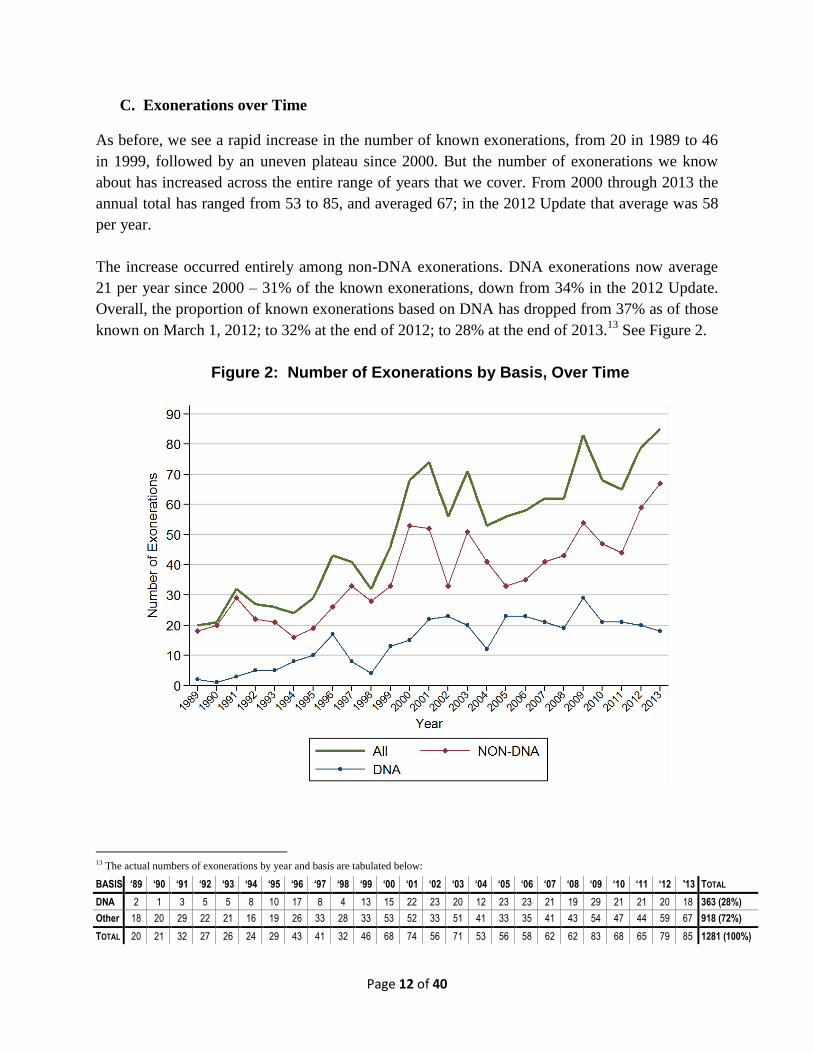
C. Exonerations over Time
As before, we see a rapid increase in the number of known exonerations, from 20 in 1989 to 46
in 1999, followed by an uneven plateau since 2000. But the number of exonerations we know
about has increased across the entire range of years that we cover. From 2000 through 2013 the
annual total has ranged from 53 to 85, and averaged 67; in the 2012 Update that average was 58
per year.
The increase occurred entirely among non-DNA exonerations. DNA exonerations now average
21 per year since 2000 – 31% of the known exonerations, down from 34% in the 2012 Update.
Overall, the proportion of known exonerations based on DNA has dropped from 37% as of those
known on March 1, 2012; to 32% at the end of 2012; to 28% at the end of 2013.13
See Figure 2.
Figure 2: Number of Exonerations by Basis, Over Time
13 The actual numbers of exonerations by year and basis are tabulated below:
BASIS ‘89 ‘90 ‘91 ‘92 ‘93 ‘94 ‘95 ‘96 ‘97 ‘98 ‘99 ‘00 ‘01 ‘02 ‘03 ‘04 ‘05 ‘06 ‘07 ‘08 ‘09 ‘10 ‘11 ‘12 '13 TOTAL
DNA 2 1 3 5 5 8 10 17 8 4 13 15 22 23 20 12 23 23 21 19 29 21 21 20 18 363 (28%)
Other 18 20 29 22 21 16 19 26 33 28 33 53 52 33 51 41 33 35 41 43 54 47 44 59 67 918 (72%)
TOTAL 20 21 32 27 26 24 29 43 41 32 46 68 74 56 71 53 56 58 62 62 83 68 65 79 85 1281 (100%)
Page 13 of 40
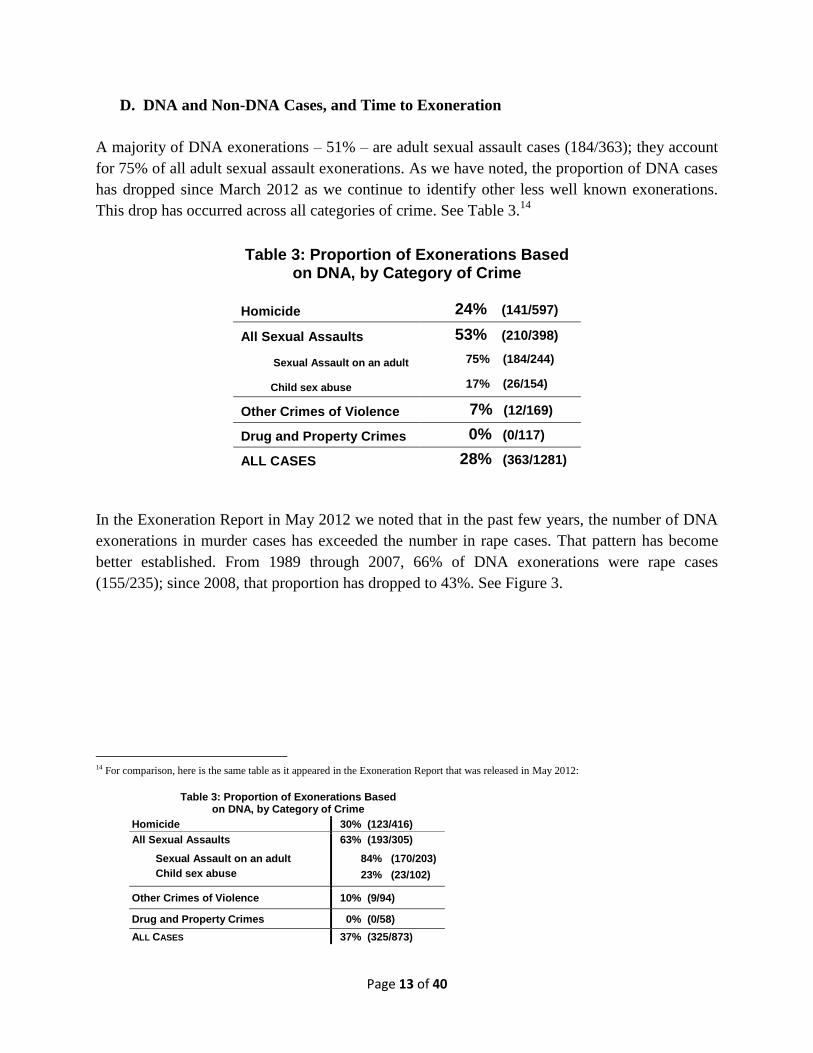
D. DNA and Non-DNA Cases, and Time to Exoneration
A majority of DNA exonerations – 51% – are adult sexual assault cases (184/363); they account
for 75% of all adult sexual assault exonerations. As we have noted, the proportion of DNA cases
has dropped since March 2012 as we continue to identify other less well known exonerations.
This drop has occurred across all categories of crime. See Table 3.14
Table 3: Proportion of Exonerations Based on DNA, by Category of Crime
Homicide 24% (141/597)
All Sexual Assaults 53% (210/398)
Sexual Assault on an adult 75% (184/244)
Child sex abuse 17% (26/154)
Other Crimes of Violence 7% (12/169)
Drug and Property Crimes 0% (0/117)
ALL CASES 28% (363/1281)
In the Exoneration Report in May 2012 we noted that in the past few years, the number of DNA
exonerations in murder cases has exceeded the number in rape cases. That pattern has become
better established. From 1989 through 2007, 66% of DNA exonerations were rape cases
(155/235); since 2008, that proportion has dropped to 43%. See Figure 3.
14 For comparison, here is the same table as it appeared in the Exoneration Report that was released in May 2012:
Table 3: Proportion of Exonerations Based on DNA, by Category of Crime
Homicide 30% (123/416)
All Sexual Assaults
Sexual Assault on an adult
Child sex abuse
63% (193/305)
84% (170/203)
23% (23/102)
Other Crimes of Violence 10% (9/94)
Drug and Property Crimes 0% (0/58)
ALL CASES 37% (325/873)

Page 14 of 40
Figure 3: DNA Exonerations by Crime, Over Time
Despite this shift, rape remains a factor in more than two thirds of DNA exonerations. In 49% of
the DNA homicide exonerations in our data (69/141), the defendant was also convicted of a
sexual assault, and in another 20% of DNA murder exonerations, there was a rape for which the
defendant was not convicted, usually because it was not charged (28/141). In other words, DNA
exonerations are increasingly about rape-murder rather than rape alone.
The main underlying reason for this shift is probably the aging pool of potential DNA
exonerations. The average time to a DNA exoneration has increased from 6 years in 1993 to 19
years in 2013. See Figure 4. This should be no surprise. Nowadays, 25 years after the first DNA
exonerations, if there is probative DNA in a major felony prosecution it is generally tested before
trial. This has become increasingly true over the past 20 years. As a result, DNA exonerations
are increasingly dominated by defendants who were convicted 20 to 30 years ago or longer.
Innocent murder defendants are much more likely to be in prison 25 to 30 years after conviction
than innocent rape defendants, and they and their supporters are more likely to continue to press
for their release.
DNA has been used in a handful of robbery and attempted murder exonerations. Recently, a lot
of attention has focused on the potential of DNA as an investigative tool for property crimes,
from burglary to auto theft. While DNA may be gaining a foothold in pretrial investigations of
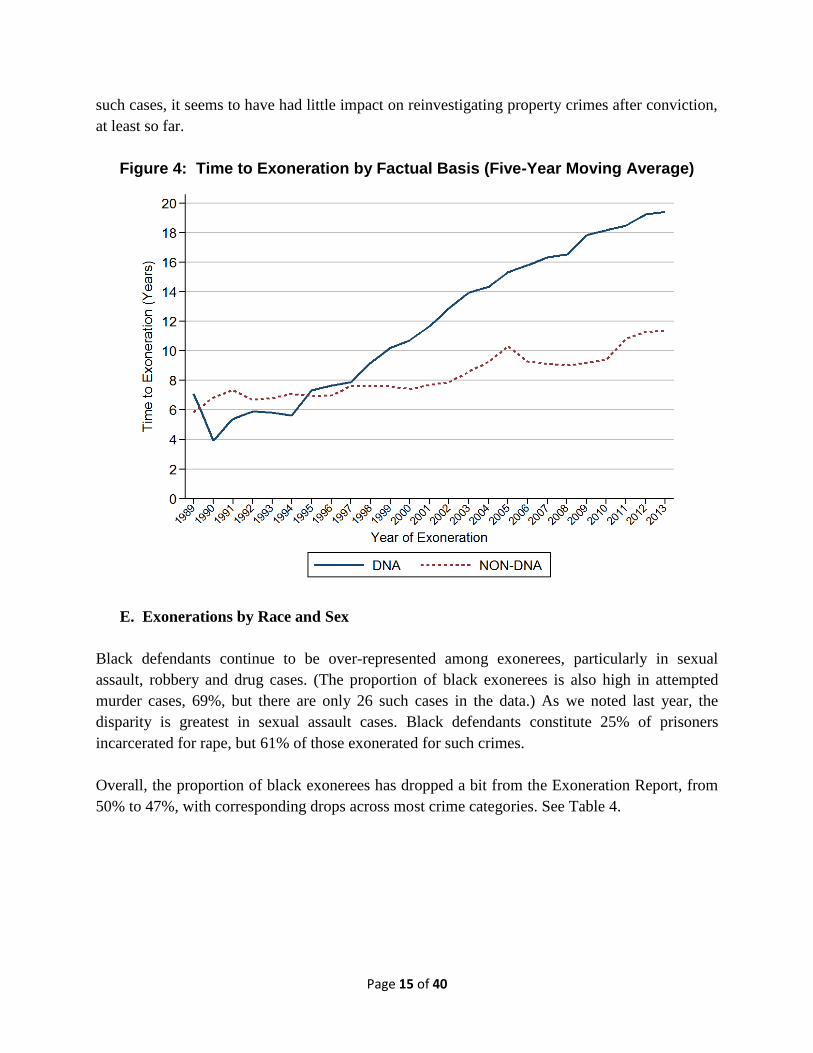
Page 15 of 40
such cases, it seems to have had little impact on reinvestigating property crimes after conviction,
at least so far.
Figure 4: Time to Exoneration by Factual Basis (Five-Year Moving Average)
E. Exonerations by Race and Sex
Black defendants continue to be over-represented among exonerees, particularly in sexual
assault, robbery and drug cases. (The proportion of black exonerees is also high in attempted
murder cases, 69%, but there are only 26 such cases in the data.) As we noted last year, the
disparity is greatest in sexual assault cases. Black defendants constitute 25% of prisoners
incarcerated for rape, but 61% of those exonerated for such crimes.
Overall, the proportion of black exonerees has dropped a bit from the Exoneration Report, from
50% to 47%, with corresponding drops across most crime categories. See Table 4.

Page 16 of 40
Table 4. Exonerations by Race Of Defendant and Type of Crime
White Black Hispanic Other TOTAL
Homicide (597)
39% 46% 13% 1% 100%
Sexual Assault (244)
33% 61% 5% 0% 100%
Child Sex Abuse (154)
63% 25% 9% 3% 100%
Attempted Murder (26)
15% 69% 12% 4% 100%
Robbery (77)
23% 58% 17% 1% 100%
Other Violent Crimes (66)
44% 38% 9% 9% 100%
Drug Crime (51)
24% 55% 22% 0% 100%
Other Non-Violent Crimes (66)
59% 27% 12% 2% 100%
ALL CRIMES (1,281) 40% 47% 11% 2% 100%
Fewer than 8% of known exonerations involved female defendants (97/1281). The crimes for
which female exonerees were convicted were generally similar to those for male exonerees, with
a conspicuous exception. Nearly a third of both genders were convicted of sexual assaults, but
the men were overwhelmingly convicted of raping adult victims, and the women were all
convicted of child sex abuse. See Table 5.
In general, women are heavily concentrated among exonerations in which the victims were
children and in cases in which no crime was committed (as opposed to the great majority of
cases, in which there was a crime but someone else did it). Overall, 64% of the female exonerees
(62/97) were convicted of crimes that never occurred – mostly child sex abuse – but only 19% of
the men were convicted in no-crime cases (224/1184), and 47% of female exonerees were
convicted of violent crimes against children (46/97), compared to 25% (297/1184) of male
exonerees.

Page 17 of 40
F. Causes of False Convictions
For all exonerations, the most common causal factors that we have identified are: perjury or false
accusation (56%); official misconduct (46%); and mistaken eyewitness identification (38%). See
Table 6.
Table 6: Exonerations by Crime and Contributing Factors (N=1,281)
Mistaken Witness Identification
Perjury or False Accusation
False Confession
False or Misleading Forensic Evidence
Official Misconduct
Homicide (597)
26% 65% 20% 23% 58%
Sexual Assault (244)
75% 32% 7% 34% 19%
Child Sex Abuse (154)
18% 81% 7% 24% 47%
Robbery (77)
82% 21% 1% 5% 27%
Other Violent Crimes (92)
47% 48% 8% 13% 43%
Non-Violent Crimes (117)
9% 54% 2% 6% 56%
ALL CASES (1,281)
38% 56% 12% 22% 46%
The proportions in Table 6 are generally similar to those in the Exoneration Report in May 2012,
except that the percentage of cases with mistaken witness identifications has decreased (from 43
Table 5: Exonerations by Gender and Crime
CRIME MALE (1,184)
FEMALE (97)
Homicide 47% 46%
Sexual Assault 21% -
Child Sex Abuse 11% 26%
Child Abuse - 3%
Other Crimes of Violence 13% 7%
Non-Violent Crimes 8% 18%
TOTAL 100% 100%

Page 18 of 40
to 38), and the percentages of cases with perjury or false accusations and with official
misconduct have increased (from 51 to 56 and from 42 to 46, respectively.)
We noted in the Exoneration Report that the proportion of exonerations with mistaken
eyewitness identifications is lower than previous reports, primarily because we have done a more
careful job than before in separating eyewitness errors and eyewitness lies. That remains true.
The other main finding of the Exoneration Report in this regard was that, as best we can tell,
false conviction is not one pathology with a single set of contributing risk factors but a set of
several different problems with different causal structures depending on the crime. That too
remains true:
For homicide exonerations, the leading cause of false conviction is perjury or false
accusations, mostly deliberate misidentifications. Homicide cases also include a high rate
of official misconduct, and 75% of all false confessions in the database.
The great majority of sexual assault and robbery exonerations include mistaken
eyewitness identifications, mostly by the victims. Many sexual assault cases also include
bad forensic evidence.
Child sex abuse exonerations, by contrast, primarily involve false testimony by victims
who fabricated crimes that never occurred at all.
The small number of drug crime exonerations we have found have a high rate of
deliberate misidentifications in the context of crimes that did occur.
F. Exonerations by Jurisdiction
The 1,281 exonerations we knew about at the end of 2013 came from 46 states, the District of
Columbia, the Commonwealth of Puerto Rico, at least 23 federal districts, and the military. In
May 2012 we reported that the top ten states in numbers of exonerations were, in descending
order: Illinois, New York, Texas, California, Michigan, Louisiana, Florida, Ohio, Massachusetts
and Pennsylvania. Two reports later, these same ten states lead the count but their order has
changed. See Table 7.

Page 19 of 40
Table 7: Exonerations by State, Top Ten
Exoneration Report 2012 Update 2013 Report
January 1989–February 2011 January 1989–December 2012 January 1989–December 2013
(N = 873) (N =1,050) (N =1,281)
1. Illinois 101 1. California 119 1. New York 152
2. New York 88 2. Texas 114 2. California 136
3. Texas 84 3. Illinois 112 3. Texas 133
4. California 79 4. New York 104 4. Illinois 124
[Federal 39] [Federal 52] [Federal 62]
5. Michigan 35 5. Michigan 40 5. Michigan 45
6. Louisiana 34 6. Florida 38 6. Florida 45
7. Florida 32 7. Louisiana 38 7. Pennsylvania 41
8. Ohio 28 8. Pennsylvania 32 8. Louisiana 40
9. Massachusetts 27 9. Massachusetts 31 9. Ohio 38
10. Pennsylvania 27 10. Ohio 31 10. Massachusetts 36
The top four states have not changed, but their order has been rearranged twice. From the first
report to the second, California added 40 cases – 50% of its total – and went from fourth place to
first. From the second report to the third, New York added 48 cases, and also moved from fourth
place to first. These rapid changes do not reflect bumper crops of recent exonerations in
California and New York. Only 5 of the 40 California exonerations added from March through
December 2012 occurred in that time span, and only 8 of the 48 exonerations added in New York
in 2013 occurred in that year.
The main reason for the rapid increases in the number exonerations in California and later in
New York is the nature of the searches we have been conducting. In 2012, we concentrated our
search for past exonerations on California because it is the most populous state in the union and
had a comparatively low per capita exoneration rate, so we thought we might find many cases we
had missed. In 2013, we devoted more attention to New York. As we move on to other smaller
states, we expect to continue to find exonerations from years past that we do not yet know about.
The numbers of exonerations in Table 7 are driven in part by population. The top four states –
California, Texas, New York and Illinois – are, in that order, the 1st, 2nd, 3rd and 5th most
populous; and the our sixth ranked state in number of exonerations, Florida, is 4th in population.
Table 8 displays rates exonerations per capita for the ten states with the largest numbers of
exonerations; Table 9 lists the ten states with the highest per capita rates.
15 Three of the states in
15 The rates of exonerations per capita reported in Tables 8 through 11 are standardized. The raw number is divided
by the national average (0.408 per 100,000). Thus the standardized rate per capita for the nation as a whole is 1.000,
Page 20 of 40
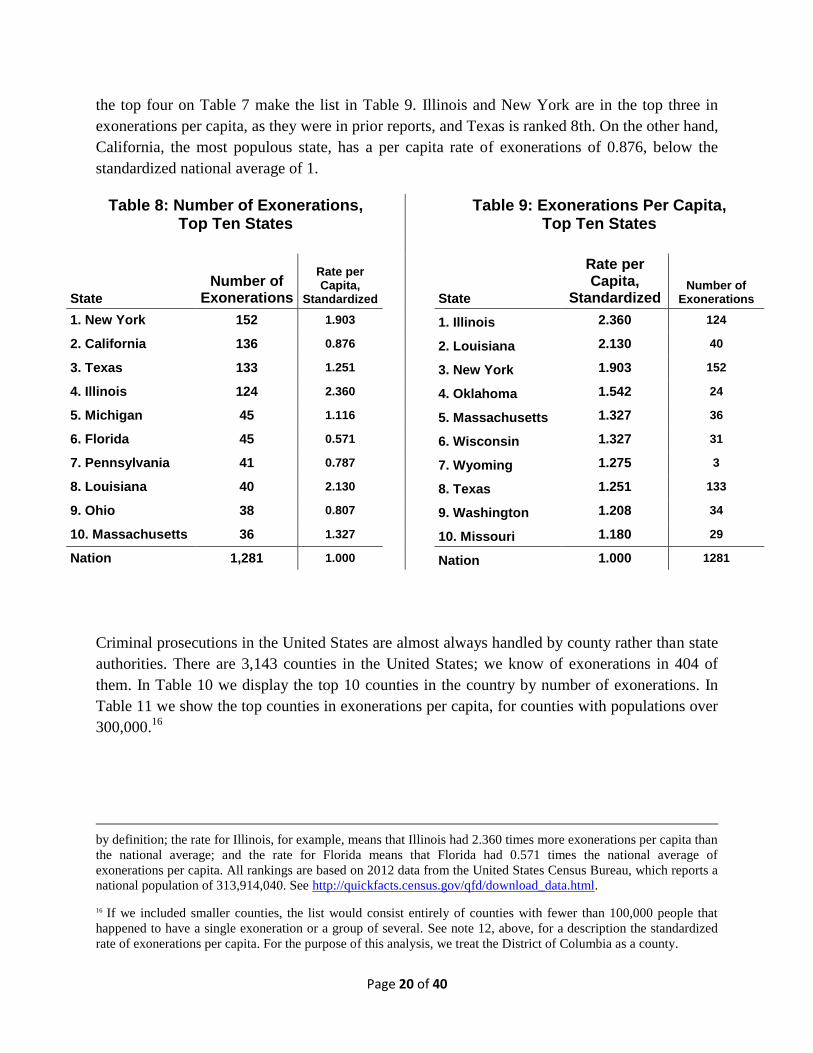
the top four on Table 7 make the list in Table 9. Illinois and New York are in the top three in
exonerations per capita, as they were in prior reports, and Texas is ranked 8th. On the other hand,
California, the most populous state, has a per capita rate of exonerations of 0.876, below the
standardized national average of 1.
Table 8: Number of Exonerations, Top Ten States
Table 9: Exonerations Per Capita, Top Ten States
State
Number of Exonerations
Rate per Capita,
Standardized
State
Rate per Capita,
Standardized Number of
Exonerations
1. New York 152 1.903
1. Illinois 2.360 124
2. California 136 0.876
2. Louisiana 2.130 40
3. Texas 133 1.251
3. New York 1.903 152
4. Illinois 124 2.360
4. Oklahoma 1.542 24
5. Michigan 45 1.116
5. Massachusetts 1.327 36
6. Florida 45 0.571
6. Wisconsin 1.327 31
7. Pennsylvania 41 0.787
7. Wyoming 1.275 3
8. Louisiana 40 2.130
8. Texas 1.251 133
9. Ohio 38 0.807
9. Washington 1.208 34
10. Massachusetts 36 1.327
10. Missouri 1.180 29
Nation 1,281 1.000
Nation 1.000 1281
Criminal prosecutions in the United States are almost always handled by county rather than state
authorities. There are 3,143 counties in the United States; we know of exonerations in 404 of
them. In Table 10 we display the top 10 counties in the country by number of exonerations. In
Table 11 we show the top counties in exonerations per capita, for counties with populations over
300,000.16
by definition; the rate for Illinois, for example, means that Illinois had 2.360 times more exonerations per capita than
the national average; and the rate for Florida means that Florida had 0.571 times the national average of
exonerations per capita. All rankings are based on 2012 data from the United States Census Bureau, which reports a
national population of 313,914,040. See http://quickfacts.census.gov/qfd/download_data.html. 16 If we included smaller counties, the list would consist entirely of counties with fewer than 100,000 people that
happened to have a single exoneration or a group of several. See note 12, above, for a description the standardized
rate of exonerations per capita. For the purpose of this analysis, we treat the District of Columbia as a county.

Page 21 of 40
Table 10: Number of Exonerations Top Ten Counties
Table 11: Exonerations Per Capita, Top Ten Counties with Population over 300,000
County Number of
Exonerations
Rate per Capita,
Standardized
County
Rate per Capita,
Standardized Number of
Exonerations
1. Cook IL (Chicago) 95 4.450
1. New Orleans LA 9.955 15
2. Los Angeles CA 50 1.230
2. Suffolk MA (Boston) 6.913 21
3. Dallas TX 49 4.893
3. Kern CA 6.583 23
4. Bronx NY 29 5.046
4. Jefferson LA 5.651 10
5. Kings NY (Brooklyn) 29 2.770
5. Bronx NY 5.046 29
6. New York, NY (Manhattan)
26 3.935
6. Dallas TX 4.893 49
7. Kern CA 23 6.583
7. Cook IL (Chicago) 4.450 95
8. Harris TX (Houston) 22 1.267
8. New York NY (Manhattan)
3.935 26
9. Suffolk MA (Boston) 21 6.913
9. Montgomery TX 3.537 7
10. Wayne MI (Detroit) 21 2.871
10. Clark WA 3.355 6
Nation 1,281 1.000
Nation 1.000 1281
Several large and medium sized counties have exoneration rates 5 to 10 times the national
average: New Orleans; Boston; Kern County, California; Jefferson County, Louisiana; and
Bronx County, New York. Three very large counties – Cook County, Illinois, Los Angeles and
Dallas – have more exonerations each than all but a few states. On the other hand, there are no
known exonerations at all in nearly 90% of all counties in the United States, including some with
large populations. Table 10 lists the 8 counties with more than 900,000 people but no known
exonerations, or just one.

Page 22 of 40
Table 12: Counties with More than 900,000 People and No More than One Exoneration
County Population Number of
Exonerations
Riverside CA 2,268,783 1
San Bernardino CA 2,081,313 0
Hennepin MN 1,184,576 1
Fairfax VA 1,118,602 1
Honolulu HI 976,372 0
Wake NC 952,151 1
Pinellas FL 921,319 1
Bergen NJ 918,888 0
We believe these numbers reflect our ignorance of exonerations that have occurred. For example,
in southern California, Orange County and San Diego County, with just over 3 million people
apiece, have 9 and 14 known exonerations respectively – while two adjoining counties, San
Bernardino and Riverside, have over 4.3 million people and just one known exoneration
between them. It’s possible that almost no exonerations have occurred in San Bernardino and
Riverside, but we think it’s far more likely that there have been at least several that we have not
yet learned about.
This pattern is changing. The Exoneration Report, based on data from March 2012, listed 16
large counties with no more than one exoneration. In the 2012 Update, we were down to 10.
Now, in the 2013 Update, we are down to 8. Overall, the number of counties with known
exonerations has increased by 20%, from 337 at the end of 2012 to 404 at the end of 2013. We
expect that pattern to continue as we continue to learn about more cases from years past.
A complete list of the number of exonerations by state and county is available with this report
(see p. 35). It is also possible sort exonerations by county on the Summary View page of our
website in order to obtain the names of exonerees in each county.

Page 23 of 40
ILLUSTRATIVE EXAMPLES OF EXONERATIONS ADDED IN 2013
The following 8 cases, all added to the Registry in 2013, exemplify trends in the cases we see:
A variety of crimes are represented here, not just rape and murder.
Just one of the eight cases is a DNA exoneration.
Seven of the eight cases were defendants who were exonerated in 2013.
Four of the cases listed—one arson, two assaults, and one murder—were cases where no
crime actually occurred. Two of these cases were accidents while the other two involved
lies from “victims” about the occurrence of a crime.
One of the cases involves a female exoneree.
In one case, the defendant pled guilty to the crime he was exonerated of.
Joseph Awe
State: WI
Crime: Arson
Exonerated: 2013
Key Factors: No Crime (accident)
(Photo courtesy of
Wisconsin State Journal)
In May 2010, Joseph Awe began serving a three year sentence for a 2006 arson. He was
exonerated in 2013, two months before he was due to be released, when new forensic evidence
proved the fire was accidental.
A fire erupted in J.J.’s Pub in Harrisville, Wisconsin, in the early morning hours of September
11, 2006. No one was hurt in the blaze, though the entire bar and the unoccupied apartment
above it were a complete loss.
The next day, before police and firefighters had even determined the cause of the fire, they listed

Page 24 of 40
the owner of the bar, 36-year-old Joseph Awe, as the primary suspect. The Mt. Morris Mutual
Insurance Company, which provided coverage on the building and stood to pay $200,000 if the
fire was an accident, began its own investigation of the fire.
After receiving a tip from an informant that Awe had mentioned “many times” that he wanted to
burn the building down, Awe was charged with arson. The informant, who had six traffic charges
and two felony drug charges pending, testified against Awe at a preliminary hearing after the
prosecution dismissed the charges pending against him.
Awe went on trial in December 2007. The informant did not testify due to his lengthy criminal
record, but arson experts testified for the prosecution. The experts were hired by the insurance
company, but the prosecution did not disclose this to the defense. The experts testified that the
fire was intentionally set by someone who punched a hole in the back of the bar and set the
building ablaze and claimed that there was no other possible cause of the fire.
Awe testified in his own defense and explained that the building had extensive electrical
problems. As an example, Awe testified that when circuit breakers switched off due to a short
circuit, they had to be turned back on with a pool cue to avoid getting a shock. Awe’s defense
attorney called a fire expert who testified the fire was electrical, but he had previously only
investigated four fires.
On December 20, 2007, a jury convicted Awe and he was sentenced to three years in prison and
nine years supervision. The insurance company sued Awe in an attempt to recover the $76,000 it
spent in its investigation of the fire. Awe remained free while he appealed his conviction, but
began serving his sentence in May 2010 when his last appeal was denied.
In May 2011, the Wisconsin State Journal published a series of articles questioning the neutrality
of the experts hired by the insurance company and presenting the opinions of independent fire
experts who said the fire was electrical. As a result, Awe filed a motion for a new trial, which
was granted in March 2013. The prosecution dismissed the charge in April.
Awe was released two months before his three year sentence would have expired. He has filed a
lawsuit against the Mt. Morris Mutual Insurance Company, which is still pending.
Page 25 of 40
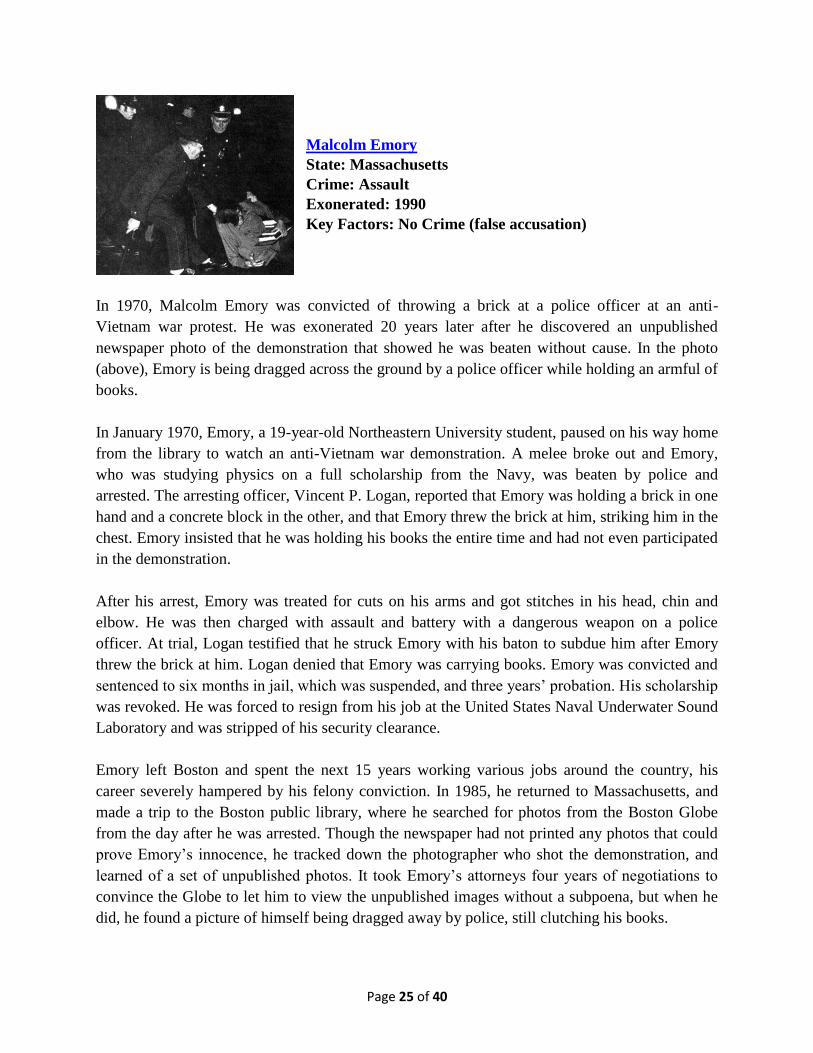
Malcolm Emory
State: Massachusetts
Crime: Assault
Exonerated: 1990
Key Factors: No Crime (false accusation)
In 1970, Malcolm Emory was convicted of throwing a brick at a police officer at an anti-
Vietnam war protest. He was exonerated 20 years later after he discovered an unpublished
newspaper photo of the demonstration that showed he was beaten without cause. In the photo
(above), Emory is being dragged across the ground by a police officer while holding an armful of
books.
In January 1970, Emory, a 19-year-old Northeastern University student, paused on his way home
from the library to watch an anti-Vietnam war demonstration. A melee broke out and Emory,
who was studying physics on a full scholarship from the Navy, was beaten by police and
arrested. The arresting officer, Vincent P. Logan, reported that Emory was holding a brick in one
hand and a concrete block in the other, and that Emory threw the brick at him, striking him in the
chest. Emory insisted that he was holding his books the entire time and had not even participated
in the demonstration.
After his arrest, Emory was treated for cuts on his arms and got stitches in his head, chin and
elbow. He was then charged with assault and battery with a dangerous weapon on a police
officer. At trial, Logan testified that he struck Emory with his baton to subdue him after Emory
threw the brick at him. Logan denied that Emory was carrying books. Emory was convicted and
sentenced to six months in jail, which was suspended, and three years’ probation. His scholarship
was revoked. He was forced to resign from his job at the United States Naval Underwater Sound
Laboratory and was stripped of his security clearance.
Emory left Boston and spent the next 15 years working various jobs around the country, his
career severely hampered by his felony conviction. In 1985, he returned to Massachusetts, and
made a trip to the Boston public library, where he searched for photos from the Boston Globe
from the day after he was arrested. Though the newspaper had not printed any photos that could
prove Emory’s innocence, he tracked down the photographer who shot the demonstration, and
learned of a set of unpublished photos. It took Emory’s attorneys four years of negotiations to
convince the Globe to let him to view the unpublished images without a subpoena, but when he
did, he found a picture of himself being dragged away by police, still clutching his books.

Page 26 of 40
Armed with this definitive evidence of his innocence, Emory was granted a new trial, and in
April 1990 the charges against him were dismissed. The following day, Northeastern University
granted Emory a full scholarship to complete his studies. In 1991, he graduated with a bachelor’s
degree in physics.
In 1992, Officer Logan pled guilty to accepting bribes to overlook liquor law violations and was
sentenced to 90 days in jail.
Emory filed a state malicious prosecution lawsuit against Logan and on April 8, 1994, a jury
awarded him $250,000 in damages.
Emory’s story is especially noteworthy because the Registry learned of the case from another
exoneree, Donald Glassman, who is now a student at Brooklyn Law School.
Denis Field
State: Federal (Southern District of New York)
Crime: Tax Fraud, Conspiracy
Exonerated: 2013
Key Factors: Non-violent crime, federal prosecution
In 2011, Denis Field, the former CEO of BDO Seidman, was convicted of tax fraud and
conspiracy for participating in the creation and marketing of illegal tax shelters when he was the
manager of the tax shelter group at BDO. Field was exonerated two years later at a second trial
when evidence was presented that he acted in good faith and followed his lawyers’ advice.
Between 1994 and 2004, according to the indictment, a group of seven financial executives and
lawyers conspired to defraud the federal government by creating tax shelters that appeared to
generate profits, but in actuality generated fraudulent tax losses and deductions. According to the
government, the conspiracy defrauded the government out of billions of dollars.
Two members of the conspiracy pled guilty and testified against Field and the other four co-
defendants at trial. In the spring of 2011, after a 12 week trial, Field and three others were
convicted while the fifth co-defendant was acquitted.
After the trial, but before sentences were imposed, the trial judge awarded Field and two of his
co-defendants a new trial because a member of the jury lied about the fact that she was a
suspended attorney and an alcoholic during the jury selection process. The fourth defendant’s

Page 27 of 40
conviction remained intact because his attorneys knew about the lies at the trial, but failed to say
anything to the court.
Field went on trial again in the fall of 2013 with one of his co-defendants. The other co-
defendant pled guilty prior to the second trial.
The key evidence presented against Field was a report written by BDO’s outside attorneys. The
report provided advice about best practices related to the tax shelters and included a section
entitled “Possible IRS Reactions.” That section, which pointed out that the IRS would likely look
unfavorably on the tax shelters, was deleted at the request of Field and BDO’s in-house attorney,
which the prosecution argued showed that Field was trying to defraud the IRS.
Prior to the second criminal trial, Field’s attorneys discovered that an in-house attorney from
BDO and an outside attorney from the firm which authored the report were deposed in a civil
trial. In his deposition, the in-house attorney testified that he gave advice to the tax-shelter group
and agreed with the edits that Field made to the report. The outside law firm’s attorney testified
that he was comfortable with Field’s edits and that the IRS section was beyond the scope of the
work his firm had been hired to complete.
At the second criminal trial, the defense used these depositions to argue that Field followed his
lawyers’ advice and that he acted in good faith when he suggested the section be deleted from
the report.
On October 31, 2013, after 8 weeks of trial, the jury acquitted Field (who was free on bond) of
all charges. The remaining co-defendant was convicted.
Nicole Harris
State: IL
Crime: Murder
Exonerated: 2013
Key Factors: No Crime (accident), False Confession
Nicole Harris was wrongfully convicted of killing her four-year-old son Jaquari in 2005 after he
was found asphyxiated by an elastic band that had come loose from a fitted bed sheet. She was
exonerated 8 years later when evidence was presented that police coerced her into confessing and
that the boy’s brother saw him wrap the band around his neck while he was playing
“Spiderman.”

Page 28 of 40
On May 14, 2005, Harris and her boyfriend left their two sons, Jaquari, age four and Diante, age
five, home alone while they went across the street to launder some clothing. When they returned
home partway through the process, they found the boys outside the apartment, scolded them, and
ordered them to bed. Harris’ boyfriend stayed in the apartment and took a nap, while Harris
finished the laundry. When Harris’ boyfriend woke up, he discovered Jaquari with the elastic
band wrapped 10 times around his neck. Despite efforts to resuscitate him, the boy died.
Police questioned Harris over a period of 27 hours, during which Harris said she was threatened,
pushed, called names, and denied food, water, and use of the bathroom. Eventually, she gave a
videotaped confession saying she strangled the boy with the elastic band because he would not
stop crying after she disciplined him for leaving the apartment. She was charged with first degree
murder and went on trial in October 2005.
Diante told investigators that his brother liked to pretend he was Spiderman by wrapping the
sheet’s elastic band around his neck and jumping off the bed. But the jury never heard this story
because the trial judge found that Diante, then six years old, was incompetent to testify. On
October 26, 2005, the jury convicted Harris and she was sentenced to 30 years in prison.
After her appeals failed, Harris filed a motion for a new trial arguing that the judge applied the
wrong standard when he decided that Diante was incompetent to testify. Harris also argued that
her trial attorney was constitutionally ineffective for failing to call an investigator who would
have testified that Diante saw his brother wrap the band around his neck and accidentally
asphyxiate himself.
The motion was denied, as was a federal habeas corpus petition based on the same arguments. In
2012, the Seventh Circuit U.S. Court of Appeals agreed with Harris, vacated her conviction, and
ordered a new trial. The state appealed the ruling to the U.S. Supreme Court, and Harris was
released on bond in February 2013 while the appeal was decided. On June 3, 2013, the Supreme
Court refused to hear the appeal and on June 17, 2013, the prosecution dismissed the charge.
In January 2014, Cook County Circuit Court Chief Judge Paul P. Biebel, Jr. awarded Harris a
certificate of innocence, which qualifies her for compensation under the Illinois Court of Claims
Act. Harris, who has an undergraduate degree in psychology, is currently applying to graduate
schools and working to rebuild her relationship with Diante.

Page 29 of 40
Andrew Johnson
State: WY
Crime: Rape, Burglary
Exonerated: 2013
Key Factors: DNA Exoneration
(Photo courtesy of Rocky
Mountain Innocence Project)
In 1989, Andrew Johnson was wrongly convicted of rape and burglary in Cheyenne, Wyoming.
He was exonerated in 2013 after DNA testing showed that the semen recovered in the rape kit
excluded Johnson and belonged to the victim’s then-fiancé. Johnson was the first person
exonerated by DNA evidence in Wyoming.
On the night of the crime, a neighbor called 911 when she heard glass breaking in the house next
door. When police arrived at the victim’s house, they found her hiding in the bathroom. The
glass window in the front door was broken and an identification card for 39-year-old Andrew
Johnson was in the living room. The victim identified Johnson as her attacker and claimed that
they had been drinking together earlier in the evening before she left him at a bar and returned
home alone. She reported that she went to sleep and awoke to the sound of Johnson breaking in
to the house.
Johnson admitted drinking with the victim, but denied assaulting her or going to her home after
she left him at the bar, though he did explain that he had been at the victim’s house earlier in the
evening and had left his identification card there after using it to crush up some marijuana they
had smoked.
At his trial, a crime lab analyst testified that blood tests on semen recovered from the victim
showed that Johnson was among five percent of the population that could have left the biological
evidence. At the time of the trial in September 1989, DNA testing was in its infancy and the
biological material recovered in the rape kit was not DNA tested. Johnson was convicted and
sentenced to life in prison.
In 2008, Wyoming enacted a statute providing prisoners with the right to petition courts for DNA
testing in selected cases. The Rocky Mountain Innocence Center, which had worked to get the
statute drafted and passed, filed a petition on Johnson’s behalf in 2012 and it was granted.

Page 30 of 40
The Innocence Center also discovered that the victim’s fiancé had been abusive to her in the
past, and that Johnson’s trial attorney had never attempted to determine if the fiancé was out of
town at the time of the attack, as the victim had claimed at trial.
In 2013, the DNA tests excluded Johnson as the perpetrator. Further tests showed that the DNA
profile matched the victim’s then-fiancé, though she claimed they had not had sex for three
weeks prior to the attack.
Armed with the DNA test results, Johnson’s attorneys filed a motion for a new trial, which was
granted in April 2013. Johnson was released on bond pending a new trial, and in July 2013, the
Laramie County District Attorney’s office dismissed the charges.
David Ranta
State: New York
Crime: Murder, Robbery, Violent
Exonerated: 2013
Key Factors: Official Misconduct, Prosecutor Cooperation (Conviction
Integrity Unit)
In 1991, David Ranta was wrongly convicted of the murder of Chaskel Werzberger, an esteemed
rabbi in Brooklyn, New York. Ranta was exonerated 22 years later after a re-investigation by the
Kings County Conviction Integrity Unit uncovered evidence that police pressured and bribed
witnesses to testify against Ranta.
Rabbi Werzberger was shot and killed on the morning of February 8, 1990, during a botched
robbery. The shooter attempted to rob a jewelry courier when he left his apartment that morning
carrying a 50-pound suitcase full of jewelry. When the courier got into his car, he saw a man
approaching with a handkerchief over his face and a pistol drawn. The courier backed his car
into the man, knocking him down, and sped away. The robber then walked over to Rabbi
Werzberger, who was warming up his car nearby. He shot the rabbi, yanked him out of the car
and drove away.
The rabbi’s murder shocked the city and a $10,000 reward was offered for information. Many
witnesses came forward, and more than a hundred names were offered as potential suspects,
including Thomas Joseph Astin (who died in a car crash while being pursued by police two
months after the rabbi’s murder).

Page 31 of 40
In June, with the murder still unsolved, Detective Louis Scarcella began interviewing two
convicted felons, Dmitry Drikman and Alan Bloom, who were facing further criminal charges.
The detective said that Bloom admitted that he attempted to rob the courier with 35-year-old
David Ranta, an unemployed house painter with previous arrests for theft, robbery and drug
possession. Drikman and his girlfriend then implicated Ranta as well.
Ranta was arrested in August and placed in a police lineup. The courier, who described the
gunman as tall and clean-shaven, with blonde hair – a description that did not match Ranta – did
not identify anyone in the lineup. Over the course of two days, several witnesses failed to
identify Ranta, but several others did choose him.
At Ranta’s 1991 trial, prosecution witnesses included Bloom and Ranta’s ex-girlfriend. The
courier testified that Ranta was not the gunman. Ranta was convicted and sentenced to 37 years
in prison.
In 1996, Thomas Joseph Astin’s wife signed an affidavit saying that before he was killed in a car
crash, her husband admitted that he killed Werzberger. Despite this affidavit, Ranta’s motion for
a new trial was denied.
In 2011, the Kings County Conviction Integrity Unit, created by then-District Attorney Charles
Hynes, began to re-investigate cases of possible wrongful conviction, including Ranta’s case.
Investigators learned that one of the witnesses who identified Ranta in the lineup had been told
by a detective to pick “the guy with the big nose,” so he picked Ranta. During the weeks when
police were interrogating Bloom and Drikman, both were allowed to leave jail, smoke crack
cocaine and have sex with prostitutes in return for implicating Ranta. Drikman and his girlfriend
recanted their statements implicating Bloom and Ranta. Bloom had since died.
On March 21, 2013, based on this new evidence of innocence, Ranta’s conviction was vacated
and he was released.
In response to mounting questions about the legitimacy of Detective Scarcella’s tactics, the
Kings County Conviction Integrity Unit undertook a review of over 50 murder cases he
investigated.
In May 2013, Ranta filed a $150 million civil rights lawsuit against the State of New York for
his wrongful imprisonment, which is still pending.

Page 32 of 40
Adam Tatum
State: Tennessee
Crime: Assault, Drug Possession
Exonerated: 2013
Key Factors: No Crime (false accusation), Guilty Plea
In 2012, Adam Tatum was wrongfully convicted of assault on a police officer and possession of
marijuana. He was exonerated in 2013 after a security video showed police brutally beating
Tatum without cause.
In June 2012, police arrived at a re-entry housing facility for convicted felons in Chattanooga,
Tennessee, supposedly in response to a call about a confrontation between two residents, Adam
Tatum and Adam McGhee.
When Officers Sean Emmer and Adam Cooley approached Tatum and McGhee, both men turned
to walk away. The officers then attacked Tatum, who was in the facility completing a sentence
for a 2002 federal robbery charge.
Emmer grabbed Tatum and, with Cooley’s help, threw him to the floor. Both officers beat Tatum
viciously with their metal batons. Tatum’s left leg was fractured in two places and one of the
broken bones pierced his skin, sending blood spurting onto the floor. His left leg was fractured in
six places. More officers arrived, and one leaned over Tatum and punched him in the face and
head repeatedly. Tatum was handcuffed and forced to walk from the facility down the sidewalk,
where he collapsed after about 100 feet. While waiting for an ambulance, Emmer kicked Tatum
in the legs and chest, knocking him backward to the ground.
Inside, officers attempted to clean up the blood and later said they picked up a knife from the
floor—although the knife was never inventoried or mentioned in any written report.
When Tatum arrived at the hospital, there was so much blood on his body that medical personnel
at first believed he had been shot. Surgery was required to fix his legs.
Tatum was charged with assault on both officers, assaulting McGhee and possession of
marijuana.
After the prosecution showed the defense a photograph that they contended showed Tatum with
a pocket knife in his hand, Tatum pled guilty to assaulting the officers and possession of
marijuana, and was sentenced to nearly 2 years in prison.

Page 33 of 40
Four months after he pled guilty, a security video of the incident was revealed publicly for the
first time. The video provided evidence of the severity of the beating and also showed that before
police arrived, there was no sign of a confrontation between Tatum and McGhee.
The prosecution had not disclosed the existence of the video to Tatum’s attorney.
On March 11, 2013, Tatum was allowed to withdraw his guilty plea to the police assault and
marijuana charges. He pled guilty to assaulting McGhee and the other charges were dismissed by
the prosecution. He was sentenced to six months in jail and got credit for time served.
Cooley and Emmer, the police officers who first arrived on the scene and began beating Tatum,
were fired. Tatum filed a multi-million dollar civil rights suit against Cooley, Emmer and the
Chattanooga Police Department. The lawsuit was settled for $125,000 in December 2013. Tatum
said he will walk with a permanent limp.
The video of the beating can be viewed at:
http://www.timesfreepress.com/videos/2013/feb/27/6464/.
WARNING: This video is extremely violent and disturbing.
Daniel Taylor
State: Illinois
Crime: Murder, Robbery, Home Invasion
Exonerated: 2013
Key Factors: False Confession, Official Misconduct, Prosecutor
Cooperation
In 1995, 17-year-old Daniel Taylor was convicted of murder, robbery, and home invasion,
despite police records showing that he was in police lockup at the time of the crime. He was
exonerated in 2013 based on evidence of innocence uncovered by Chicago Tribune reporters
Steve Mills and Maurice Possley (now the Registry’s Senior Researcher).
In November 1992, Jeffrey Lassiter, a drug dealer, and Sharon Haugabook, a prostitute, were
fatally shot in Lassiter’s apartment on the North Side of Chicago, Illinois. Taylor was arrested
after being implicated by two teenage drug dealers, one of whom had an IQ of 70. After hours of
police interrogation, Taylor confessed to participating in the crime with several others who had
also been implicated by the drug dealers. The other defendants also confessed. After being
released, Taylor quickly retracted his confession, insisting that at the time of the crime he had
been miles away in police lockup after being picked up for fighting in a park.

Page 34 of 40
Though police records showed that Taylor was in custody and not released until an hour after the
murders took place, police claimed that the records were incorrect. Two police officers filed a
belated report stating that Taylor was seen near the scene of the crime shortly after the murders.
In August 1995, based mainly on the testimony of these officers and his confession, Taylor was
convicted and sentenced to life in prison without parole. Four other defendants were also
convicted.
In December 2001, the Chicago Tribune published a series of articles describing a history of
false and coerced confessions obtained by Chicago police. The series included a wealth of newly
discovered evidence of Taylor’s innocence. One of the two police officers who reported seeing
Taylor near the crime scene had been accused by a judge of lying under oath just months before
the murders. A record from the youth center where Taylor lived showed he returned to the
facility at 3 a.m. – not 10 p.m. as police had claimed. And two witnesses who had implicated
Taylor recanted their statements against him.
In response, the Cook County State’s Attorney’s Office said it conducted a re-investigation of
the case, but concluded that Taylor was guilty.
For years, Taylor filed appeals but was unable to obtain a hearing. Finally, in response to a
motion for new trial filed by Northwestern University’s Center on Wrongful Convictions that
disclosed how prosecutors had hidden evidence of Taylor’s innocence, prosecutors agreed to
vacate his conviction and dismissed the charges. In June 2013, Taylor was released after more
than 20 years in prison.
In light of their decision to release Taylor, prosecutors agreed to re-examine the case of another
co-defendant, Deon Patrick. In January 2014, the charges against Patrick were dismissed and he
was released. Two other co-defendants, who served their full sentences and have been released
from prison, Lewis Gardiner and Paul Phillips, filed petitions in January 2014 to vacate their
convictions.
In January 2014, Cook County Circuit Court Chief Judge Paul P. Biebel, Jr. awarded Taylor and
Patrick certificates of innocence, which qualifies them for compensation under the Illinois Court
of Claims Act.

Page 35 of 40
Exonerations by State and County 1989–2013
In order to obtain the names of the exonerees in each county, sort exonerations by county on the
Summary View page of our website.
Alabama (18)
Baldwin (1)
Choctaw (1)
Coffee (1)
Jefferson (7)
Marshall (1)
Monroe (1)
Montgomery (3)
Morgan (2)
Tuscaloosa (1)
Alaska (2)
Anchorage (1)
Petersburg (1)
Arizona (13)
Coconino (1)
Maricopa (5)
Pima (6)
Yavapai (1)
Arkansas (4)
Clark (2)
Pulaski (1)
Sebastian (1)
California (136)
Alameda (3)
Butte (1)
Contra Costa (4)
Fresno (2)
Humboldt (1)
Kern (23)
Lake (1)
Los Angeles (50)
Marin (1)
Merced (1)
Monterey (2)
Orange (9)
Riverside (1)
Sacramento (2)
San Diego (12)
San Francisco (4)
San Joaquin (1)
San Mateo (2)
Santa Barbara (1)
Santa Clara (10)
Siskiyou (2)
Solano (3)
Colorado (3)
Denver (1)
Larimer (1)
Mesa (1)
Connecticut (15)
Fairfield (4)
Hartford (4)
Middlesex (1)
New Haven (6)
District of Columbia (10)
Florida (45)
Bradford (1)
Brevard (2)
Broward (10)

Page 36 of 40
DeSoto (1)
Duval (1)
Hillsborough (5)
Manatee (3)
Martin (2)
Miami-Dade (5)
Monroe (1)
Orange (2)
Palm Beach (4)
Pasco (3)
Pinellas (1)
Polk (4)
Georgia (24)
Carroll (1)
Chatham (3)
Clayton (2)
Cobb (1)
Columbia (1)
DeKalb (3)
Fulton (4)
Gwinnett (1)
Hart (1)
Houston (1)
Meriwether (1)
Muscogee (1)
Rabun (1)
Rockdale (1)
Tift (1)
Whitfield (1)
Hawaii (1)
Maui (1)
Idaho (2)
Canyon (1)
Kootenai (1)
Illinois (124)
Champaign (2)
Cook (95)
DuPage (4)
Edgar (2)
Iroquois (2)
Jackson (1)
Kane (3)
Lake (5)
Lawrence (1)
Madison (1)
McHenry (1)
McLean (2)
St. Clair (4)
Will (1)
Indiana (16)
Allen (1)
Decatur (1)
Elkhart (2)
Floyd (1)
Hancock (1)
Henry (2)
Knox (1)
Lake (2)
Madison (1)
Marion (2)
St. Joseph (1)
Vigo (1)
Iowa (8)
Cerro Gordo (1)
Clinton (1)
Marshall (1)
Pottawattamie (4)
Woodbury (1)
Kansas (4)
Douglas (1)
Riley (1)
Sedgwick (1)
Shawnee (1)
Kentucky (9)
Bullitt (1)
Butler (1)
Jefferson (4)
Kenton (1)
Whitley (2)
Louisiana (40)
Caddo (1)
Calcasieu (1)

Page 37 of 40
East Baton Rouge (1)
Iberia (1)
Jackson (1)
Jefferson (10)
Orleans (15)
Plaquemines (1)
Sabine (1)
St. Tammany (3)
Terrebonne (2)
Union (2)
Washington (1)
Maryland (18)
Anne Arundel (1)
Baltimore (3)
Baltimore City (7)
Calvert (1)
Charles (1)
Howard (1)
Montgomery (2)
Prince George's (1)
Wicomico (1)
Massachusetts (36)
Berkshire (1)
Bristol (1)
Hampden (5)
Middlesex (6)
Plymouth (1)
Suffolk (21)
Worcester (1)
Michigan (45)
Branch (2)
Dickinson (1)
Hillsdale (1)
Ingham (1)
Ionia (1)
Jackson (1)
Kent (1)
Macomb (6)
Newaygo (1)
Oakland (3)
Otsego (4)
St. Clair (2)
Wayne (21)
Minnesota (6)
Douglas (1)
Hennepin (1)
Ramsey (3)
St. Louis (1)
Mississippi (14)
Bolivar (1)
Forrest (3)
Hinds (4)
Lowndes (1)
Noxubee (2)
Oktibbeha (1)
Panola (1)
Sunflower (1)
Missouri (29)
Boone (1)
Cass (1)
Christian (2)
Clay (2)
Cole (4)
Greene (2)
Jackson (3)
Jasper (1)
Jefferson (1)
Osage (1)
Randolph (1)
Scott (1)
St. Louis (4)
St. Louis City (4)
Vernon (1)
Montana (4)
Gallatin (1)
Richland (1)
Silver Bow (1)
Yellowstone (1)
Nebraska (8)
Douglas (1)
Gage (6)
Lancaster (1)
Nevada (4)
Churchill (2)
Clark (2)

Page 38 of 40
New Hampshire (1)
Rockingham (1)
New Jersey (16)
Atlantic (1)
Burlington (1)
Essex (5)
Gloucester (1)
Hudson (1)
Middlesex (1)
Monmouth (1)
Ocean (1)
Passaic (2)
Somerset (1)
Union (1)
New Mexico (2)
Bernalillo (1)
Grant (1)
New York (152)
Bronx (29)
Cayuga (2)
Clinton (1)
Dutchess (1)
Erie (8)
Jefferson (2)
Kings (29)
Madison (1)
Monroe (7)
Nassau (3)
New York (26)
Niagara (1)
Oneida (2)
Onondaga (3)
Ontario (2)
Orange (1)
Queens (17)
Richmond (1)
Rockland (1)
St. Lawrence (1)
Suffolk (8)
Tompkins (1)
Westchester (5)
North Carolina (27)
Alamance (1)
Bertie (1)
Brunswick (1)
Buncombe (2)
Catawba (2)
Chowan (2)
Duplin (2)
Durham (1)
Forsyth (3)
Guilford (1)
Lee (1)
Madison (1)
Mecklenburg (2)
Onslow (2)
Union (1)
Wake (1)
Wayne (2)
Wilson (1)
Ohio (38)
Athens (1)
Cuyahoga (10)
Franklin (8)
Hamilton (4)
Hocking (1)
Licking (1)
Lucas (2)
Montgomery (2)
Pike (1)
Portage (2)
Sandusky (1)
Summit (3)
Tuscarawas (1)
Vinton (1)
Oklahoma (24)
Bryan (2)
Cleveland (3)
Custer (1)
Kingfisher (1)
Muskogee (1)
Oklahoma (6)
Osage (1)
Pontotoc (3)
Tulsa (6)

Page 39 of 40
Oregon (7)
Clackamas (1)
Lane (2)
Multnomah (2)
Polk (1)
Yamhill (1)
Pennsylvania (41)
Adams (1)
Allegheny (7)
Bedford (1)
Berks (2)
Bucks (1)
Cambria (1)
Centre (1)
Chester (1)
Cumberland (1)
Dauphin (5)
Delaware (3)
Erie (2)
Fayette (1)
Lancaster (1)
Lawrence (2)
Lehigh (1)
Montgomery (1)
Philadelphia (9)
Puerto Rico (3)
Humacao (1)
Mayaguez (1)
San Juan (1)
Rhode Island (4)
Kent (2)
Providence (2)
South Carolina (4)
Dillon (1)
Lancaster (1)
Lexington (1)
Orangeburg (1)
Tennessee (10)
Hamilton (1)
Jefferson (1)
Maury (1)
McMinn (1)
Shelby (3)
Sumner (2)
Union (1)
Texas (133)
Angelina (2)
Atascosa (1)
Bexar (2)
Brown (1)
Burleson (1)
Cameron (1)
Collin (2)
Dallas (49)
El Paso (4)
Ellis (2)
Hale (1)
Harris (22)
Hopkins (1)
Hutchinson (1)
Jefferson (3)
Lamb (2)
Lubbock (2)
McLennan (4)
Montgomery (7)
Navarro (1)
Nueces (2)
Pecos (1)
Rains (2)
San Jacinto (2)
Shelby (1)
Smith (1)
Tarrant (4)
Travis (8)
Upshur (1)
Uvalde (1)
Williamson (1)
Utah (7)
Beaver (1)
Cache (1)
Juab (2)
Salt Lake (2)
Weber (1)

Page 40 of 40
Vermont (1)
Windham (1)
Virginia (35)
Arlington (3)
Augusta (1)
Chesapeake City (1)
Culpeper (3)
Fairfax (1)
Greensville (1)
Hampton City (3)
Hanover (1)
James City (1)
Loudoun (3)
Nelson (1)
Newport News City (2)
Norfolk City (5)
Powhatan (1)
Prince William (1)
Richmond City (5)
Virginia Beach City (2)
Washington (34)
Benton (1)
Chelan (11)
Clark (6)
Cowlitz (1)
Grant (1)
King (4)
Pierce (4)
Spokane (5)
Yakima (1)
West Virginia (8)
Cabell (1)
Kanawha (5)
Pocahontas (1)
Wood (1)
Wisconsin (31)
Brown (1)
Buffalo (1)
Dane (4)
Dodge (1)
Douglas (1)
Eau Claire (1)
Jefferson (1)
Kewaunee (1)
Langlade (1)
Manitowoc (2)
Marquette (1)
Milwaukee (10)
Racine (1)
Rock (2)
Washington (1)
Winnebago (1)