x-ray fluorescence - nautical archaeology...
TRANSCRIPT
CHAPTER
4
X-RAY FLUORESCENCE
LUC MOE S
University Ghem, Laboratory of Analytical Chemistry, Ghent, Belgium
ALEX VON BOHLEN
Illstillit fiir Speklrochemie und Angew{lm/te Speklroskopie, ISA S, Dortmund, Germany
PETER VANDENABEELE
Universi ty Ghent, ulboratory of Analy tical Chemislry, Ghem, Belgimll
4.1. INTRODUCfIO
X-ray fluorescence (XRF) analysis allows the concentrations of most elements of the periodic table to be determined. The method has many advantages that make it very suited for the analysis of artifacts. It allows solid materials to be analyzed directly without necessitating dissolution or any other time-consuming or destructive sample preparation. Small objects can be brought to the XRF instrument and in many cases analyzed as such. The method is consumption free and, apart from occasional radiation damage, will leave the artifact unaltered and suited for analysis with other methods. Mobile XRF instruments allow larger objects to be studied on site. Obviously, it is also possible to sample the artifacts if such is ethically acceptable. A further advantage of the method is its capability to determine major, minor, and trace element concentrations. Finally, XRF is a well-established method, the possibilities and limitations of which are known and well understood. The operation costs are low and the analysis times are short.
Accurate quantitative analysis of unprepared artifacts may be difficult because XRF (except total reflection XRF, TXRF) suffers from matrix effects for which it is not easy to correct. Also, the concentrations measured with
~odern Analytical Methods in Art and Archaeology, Edited by Enrico Cilibcno and Giuseppe I poto. Chemical Analysis Series, Vol. 155 SBN 0-47 1-2936 I -X c 2000 John Wiley & Sons, Inc.
55

56 x -RA Y FLUORESCENCE
P ..... 2%
Varnishes 2%
Ceramics 20%
Glass ,,%
Figure 4.1. Relative importance ( 1995- 1998) o f different XRF application fields in archaeology and art history.
XRF mainly reflect the composition of the outer layers of the material. For weathered objects this composition may considerably deviate from that of the unaltered material below the patina. These limitations are obviously alleviated when samples are taken from the artifact and sample preparation methods aiming at accurate quantification are applied. TXRF, under optimal circumstances, is free from matrix effects and quantification can be simple.
A literature search for the period 1995 to 1998 revealed that XRF analysis is still widely used to identify and characterize a variety of archaeological and art historical materials. Figure 4.1 depicts the different application fields and their respective importance (period 1996 to 1998). Metallic objects (including coins) and potsherds make more than 50% of the applications, but stone material and bones and ivory have been studied as well. Also painted surfaces and glass were found to have been the subject of XRF analysis.
In this chapter the XRF techniques used will be discussed, and the application field will be reviewed via a limited number of typical applications. Rather than emphasizing the analytical details, the archaeometric potential of the method will be illustrated.
4.2. NATURE OF X-RAYS AND X-RAY FLUORESCENCE
X-rays are part of the electromagnetic spectrum (cr. Fig. 4.2) and were discovered and described by W. C. Rontgen in 1895 (Bertin 1975; Broil 1996). Only a part of their spectral range between 0.1 and 100 keY or according to

4.2. NATURE OF X-RAYS AND X-RAY FLUORESCENCE
Frequency 1-I. ..... IIiI,jjW .. [s'l Energy leV]
Figure 4.2. Electromagnetic spectrum.
57
the relationship E = he/}., between 10 and 0.01 nm is used in X-ray spectral analysis for material sciences. The X-rays are generated by bombardment of a target by means of charged particles, electrons, or ions leading to X-ray emission or by high-energy radiation leading to X-ray fluorescence. The observed X-ray spectra are composed of a continuum with wide spectral range superimposed by well-defined X-ray lines.
When applying sufficient kinetic energy, both, radiation and panicles are able to penetrate into the atoms and to remove electrons from their inner shells. After the ejection of electrons, the atoms are in an energetically unstable configuration, and electrons from outer shells fill up the vacancies. The energy difference between the shells involved in the transition process of electrons is emitted- in the case of inner electrons shells- as X-ray photons. The selection rules of quantum theory dictate which electron transitions are allowed. The nomenclature of emitted X-rays is based on conventional rules, as illustrated in Figure 4.3. For instance, in KPI, the capital K refers to the K shell (Bohr's atom model) from which initially an electron was expelled. Greek letters and digits are used to further denote the X-rays in a conventional and nonsystematic way; thereby reference is made to the orbitals from which an electron leaves to fill up the originally created vacancy and to the relative intensities of the X-rays. The wavelength of the emitted X-rays depends on the atomic number Z of the excited atoms. For a given type of X-ray (e.g., K, or Kpl) the dependence of its wavelength on Z is described by Moseley's law:
where }. is the wavelength and k, and k2 are constants. Each element emits X-rays with specific wavelengths that characterize the element. This char-
58 X-RAY FLUORESCENCE
..............................................
K--~~--L----------------J
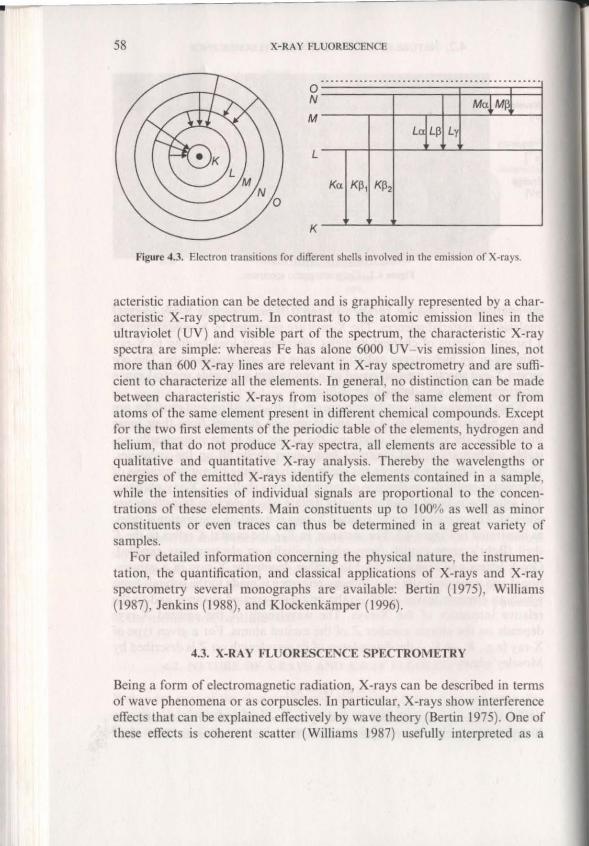
Figure 4.3. Electron transitions for different shells involved in the emission of X-rays.
acteristic radiation can be detected and is graphically represented by a characteristic X-ray spectrum. in contrast to the atomic emission lines in the ultraviolet (UV) and visible part of the spectrum, the characteristic X-ray spectra are simple: whereas Fe has alone 6000 UV - vis emission lines, not more than 600 X-ray lines are relevant in X-ray spectrometry and are sufficient to characterize all the elements. In general, no distinction can be made between characteristic X-rays from isotopes of the same element or from atoms of the same clement present in different chemical compounds. Except for the two first elemeots of the perindic table of the elements, hydrogen and helium, that do not produce X-ray spectra, all elements are accessible to a qualitative and quantitative X-ray analysis. Thereby the wavelengths or energies of the emitted X-rays identify the elements contained in a sample, while the intensities of individual signals are proportional to the concentrations of these elements. Main constituents up to 100% as well as minor constituents or even traces can thus be detemlined in a great variety of samples.
For detailed information concerning the physical nature, the instrumentation, the quantification, and classical applications of X-rays and X-ray spectrometry several monographs are available: Bertin (1975), Williams (1987), Jenkins (1988), and KIockenkiimper (1996).
4.3. X-RAY FLUORESCENCE SPECfROMETRY
Being a form of electromagnetic radiation, X-rays can be described in terms of wave phenomena or as corpuscles. In particular, X-rays show interference effects that can be explained effectively by wave theory (Bertin 1975). One of these effects is coherent scatter (Williams 1987) usefully interpreted as a

4.3. X-RAY FLUORESCENCE SPECTROMETRY 59
Secondary X-rays from the sample To the detector
Figure 4.4. Diffraction of X-rays by a crystal according to Br'dgg: ). = wavelength , 0 = Bragg angle of diffraction, d = interplanar spacing of diffracting planes.
wave phenomenon by Bragg, who considers it as a reflection on a stack or crystal planes (cr. Fig. 4.4). When a collimated X-ray beam or wavelength ). is directed at an angle 0 onto a crystal with crystal planes or spacing d, a reinrorced scatter orthe radiation can be observed ( Williams 1987) under the angle or reflection on condition that Bragg's law
11,1 = 2d . sin (J
is rulfilled ror an integer number 11.
4.3.1. Wavelength-Dispersive X-Ray Fluorescence Spectrometry
This so-called Bragg reflection is rully used in wavelength-dispersive X-ray flu orescence spectrometry (WDXRF ) to select the characteristic X-rays or interest originating rrom a sample, by selecting the corresponding angle O. A schematic representation or a WDXRF spectrometer is shown in Figure 4.5.
In WDXRF samples are irradiated by the primary X-rays or an X-ray Sourcc. The induced secondary X-ray radiation consists or different wavelengths originating rrom the different elements or the sample and reflecting its elemental composition. The secondary (or fluorescence) radiation originating rrom the sample is guided through a collimator that allows only rays with parallel propagation to pass. The X-rays reach a Bragg reflector, that is, a crystal, and arc reflected according to Bragg's law. Scanning the angle 0 by rotating the crystal and simultaneous displacement or the detector with a

60
Primary X-rays
X-ray tube
Sample
X-RAY FLUORESCENCE
Bragg reflector
Figure 4.5. Schematic representation of a wa\-'elength dispersive X-my ftuorcscence spectrometer (WDXRF).
high mechanical accuracy (better than 0.001 °) make it possible to sequentially detect X-rays of different wavelength. The radiation selected by the Bragg reflector will pass a second collimator before reaching tbe detector. By the aid of a computer, the signals are recorded and composed to a spectrum or when only some elements are of interest, the intensity of the X-rays of the corresponding wavelengths are reported.
Several excitation sources are used in X-ray spectrometry. The most common are X-ray tubes producing a broad beam spanning a large solid angle. These are built as end- or side-window tubes that are operated at high voltages up to 100 kV; the current (milliampere) is adjusted to a maximum load of 2 or 3 kW. Also fine-focus tubes (power 0.6 to 3 kW) or tubes with rotating anodes (power up to 18 kW) are used in WDXRF spectrometers.
Since it is impossible to select all wavelengths using a single Bragg reflector crystal, most X-ray spectrometers are equipped with several crystals that can be used according to the needs of the experiment. Tbe cboice will depend, for instance, on the elements to be detected, the required spectral resolution, or the stability of the crystal. A list of crystals regularly used in WDXRF and tbeir specificalions is given in Table 4.1. Detailed information can be found in the literature (Bertin 1975).
In WDXRF two detectors with different characteristics are normally used. These are arranged in a tandem geometry and are switched on depending on the wavelength of the radiation to be recorded. The first detector of this arrangement is a gas flow proportional counter for tbe registration of long-wave (low-energy) radiation. The second is a scintillation counter for the detection of the hard X-rays baving higher energies. Specifications and working methods are described in detail elsewhere (Bertin 1975; Heinrich

4.3. X-RAY FLUORESCENCE SPECTROMETRY 61
Table 4.1. Bragg Reflectors Regularly Used in WDXRF'
Crystal
Lithium fluoride, LiF (220) Lithium fluoride, LiF (200) Germanium, Ge (III ) Pentaerytrol PET (002) Thailium acid phtalate, TlAP (1010) Lead stearate decanoate, PbSD M uhilayer, W IC
2d (A)
2,848 4,208 6,532 8,742 25,75 100 120
- The crystallographic orienta tion is given in brackets.
Lightest element detectable (Z) at max 0= 70°
Using K Lines
V (23) K (19) S (16) Si (14) 0 (8) B (5) B (5)
Using L Lines
Pr (57) In (49) Zr (40) Rb (37) V (23) Ca (20)
1981; Klockenkamper 1980). The energy resolution of these types of detectors is poor and therefore a preselection by means of diffraction (Bragg reflector) is necessary.
4.3.2. E nergy-Dispersive X-Ray Fluorescence Spectrometry
The development of semiconductor materials had consequences in X-ray spectrometry. Indeed the energy resolution of lithium-drifted silicon ISi(Li)] detectors is sufficiently high to aUow X-ray spectrometry without previous dispers ion with a Bragg reflector. X-ray photons entering the Sit Li) crystal interact primarily by photoelectric absorption, producing electron- hole pairs. The number of pairs produced is proportional to the energy of the photon, thus making X-ray spectrometry possible. The produced charge is swept from the semiconductor diode by the applied voltage and produces an electric pulse. The signals produced by the X-ray photons are very weak and have to be amplified by a low-noise amplifier transistor (field effect transistor, FET ) ( Heinrich 1981). For optimal operation of the system and to freeze the lithium drifting process, effective cooling with liquid nitrogen is indispensable. By processing the signals with a fast multichannel analyzer (MCA), energy-dispersive X-ray fluorescence spectrometry (EDXRF) will produce X-ray spectra with a spectral resolution sufficient for most applications. Tbough its spectral resolution is poor in comparison to WDXRF, EDXRF has the advantage of being simpler and cheaper and to allow truly Simultaneous observation of all X-rays.
As in WDXRF, in EDXRF different X-ray tubes are applied as primary X-ray Source. Additionally X-ray emitting radioisotope sources such as cadmium-I09 ( ' 09 Cd), americium-241 [241 Am), and others are used instead
62 X-RA Y FLUORESCENCE
of X-ray tubes. Radioisotope sources, among others, are used in compact portable spectrometers that are applied in field work for fast screening of the elemental composition of a material.
Recently, synchrotrons (Haller and Knochel 1996) have been used as extremely intense X-ray sources that make XRF analysis with a superior sensitivity possible (synchrotron radiation XRF, SRXRF). The high initial intensity available at the source moreover allows microbeams to be used, offering excellent spatial resolution (p-SRXRF) and good sensitivity.
4.3.3. Samples and Sample Preparation
In general , no restrictions exist concerning the samples or their preparation for either WD- or EDXRF. Conducting or isolating solids, powdered materials, and liquids can be subjected to X-ray fluorescence analysis. One of the most prominent properties of XRF analysis is that the samples can be recovered completely after the analysis. Unfortunately, some samples show alterations caused by the irradiation with X-rays and a change in color or a change in mechanical properties caused by radio lysis is occasionally observed. Some minerals, glasses, plastics, and organic materials are affected more seriously than others. The sample chambers of the spectrometers in general contain the end of the X-ray tube, parts of the spectrometer and of the crystal changer (WDXRF ), detectors or parts of these, collimators, and the sample stage. Usually the sample chamber is evacuated down to a pressure of the order of 10 Pa. Nevertheless, XRF instruments can be operated at normal atmospheric conditions or filled with helium depending on the sample and/ or the analytical tasks. Especially in the latter cases, the size of the sample chamber can be sufficiently large to accommodate small archaeological objects (jewels, statuettes, etc.). The sample chamber among others is designed to prevent X-rays from escaping the instrument and thus is important for safe operation. evertheless, open-beam instruments have been used, especially for in silll analysis of large artifacts (e.g. , paintings). Safety in this case will depend on keeping an appropriate distance during operation and on the use of protection shields.
4.3.4. Quantification
Unfortunately, WD- and EDXRF operated in conventional modes are affected by matrix effects that cannot be neglected. These are caused by absorption of X-rays in the sample and by fluorescence enhancements when the radiation is crossing the sample. Also effects related to the surface texture, to lhe inhomogeneity of the sample, and to the particle size have been observed. All these effects lead to curved instead of straight calibration lines

z
4.3. X-RAY FLUORESCENCE SPECfROME"fRY 63
and have to be taken into account if quantitative evaluation of data and accurate determination of the elemental composition of a sample are the goals. Many calibration and correction procedures are being applied in XRF analysis (Bertin 1975):
I. Srandard Addition and Dilution Methods. The purc sample itself is measured as well as at least one sample to which a known amount of the clements to be determined (analytes) is added. Sample preparation is necessary to make the two specimens as similar in density, surface condition, and the like as possible. In this method, tbe sample actually provides its own standard(s) in its own matrix.
2. Thin-Film Methods. The specimens (samples and standards) are made so thin that absorption/enhancement effects become irrelevant.
3. Matrix Dilution Methods. The matrix of all specimens is diluted with a suited material so that the effect of the matrix is determined by the material used for the dilution.
4. Comparison Standard Methods. The X-ray intensities fwm the samples are compared with those of standards, having the same form as the sample(s) and as nearly as possible the same matrix and analyte concentration.
5. IlIIemal Srandardi=tlfion. The comparison standard method is improved by quantitative addition to all specimens of an internal standard element. The calibration function involves the intensity ratios of the analyle and internal standard lines.
6. Standardization lVith Scollered X-rays. The intensity of the primary X-rays scattered by the specimen is used to correct for absorption/ enhancement effects.
7. Experimental Correction. Various other experimental techniques have been deseribed to minimize or compensate matrix effects.
8. Mathematical Correction. Absorption/enhancement effects are corrected for mathematically by use of experimentally derived parameters.
The most prominent methods are the fundamental parameter approaches based on standard or on programs for the standardless analysis (Lachance and Claisse 1995). Monte Carlo calculations (Vince et al. 1995a, 1995b) and chemometric techniques (Adams and Allen 1998; Luo et al. 1998) are applicable as well. It is beyond the seope of this book to go into further detail on the different calibration methods. Suffice it to say that the development of POwerful hardware and software in combination witb new mathematical and computational techniques improved XRF in the last decades from a semiquantitative to a fully quantitative method.

64
X-ray tube
X-RA Y FLUORESCENCE
First reflector Primary X-rays
Si(Li) -Detector
Fluorescence radiation
Sample carrier with sample
Totally reflected X-rays
Figure 4.6. Schematic representation of a total reflection X-roy fluorescence spectrometer (TXRF).
4.3.5. Total ReHection X-Ray Fluorescence Spectrometry
Total reHection X-ray Huorescence spectrometry (TXRF) is a newly developed method that differs from conventional energy dispersive X-ray fluorescence (EDXRF) by the excitation geometry (Klockenkamper and von Bohlen 1992; Prange and Schwenke 1992; Klockenkamper et al. 1992; Klockenkiimper 1996). In TXRF a Hat, sheetlike primary X-ray beam is filtered and collimated when passing a first reflector (see Fig. 4.6). Then it is directed at a small glancing angle < 0.1 0 to a very nat and smooth surface of a sample carrier. The incident beam is totally reHected at the sample carrier's surface. It therefore hardly interacts with the carrier but effectively excites the elements of the sample. The Huorescence radiation emitted by the sample is recorded by a Si(Li) detector positioned directly above it. Usually TXRF instruments operate at normal pressure in the sample chamber. Absorption of X-rays by the gas in the chamber is minimized since the sample detector distance is very small.
The special excitation arrangement leads to a substantial decrease of the spectral background originating from the sample carrier. If applying only small amounts of sample (microgram or microliter size), a very effective excitation to Huorescence of the sample and an effective collection of the secondary radiation is observed. The detectable amount of a great number of elements is in the order of a picogram (10- 12 g). Moreover, if a critical sample mass (upper limit), depending on the matrix of the sample, is not exceeded, no matrix effects occur and multielement analysis with a simple

4.3. X-RAY FLUORESCENCE SPECfROMETRY 65
and reliable quantification becomes possible (Klockenkamper and von Bohlen 1988).
In TXRF spectra the intensities [of the X-rays are recorded. If the abovementioned conditions concerning the sample are fulfilled, no interelement effects are observed and the recorded intensities are proportional to the mass fractions of the corresponding elements. The intensities have only to be divided by their respective relative sensitivities S. The sensitivities are constants of proportionality that have to be determined only once by analyzing the residue after drying of aqueous standard solutions. By the absence of matrix effects these sensitivity factors can be applied to all kinds of samples.
If the sample mass is too low to be determined accurately, only relative mass fractions (In,) of the detected elements can be calculated by the following equation (von Bohlen et al. 1994; Klockenkiimper 1996):
Thus, relative mass fractions with respect to the sum of the masses of all detected elements (k) can be calculated. However, a full quantification becomes possible if the sample mass is known and the method of internal standardization is applied. For this purpose, a known quantity (l1Ii) of only one standard element, which is not contained in the sample, is added to the sample. After recording the spectrum, the absolute masses of the detected elements (III, ) are calculated from the following equation (von Bohlen et al. 1994; Klockenkamper 1996):
[,IS, nJ;c = . I S. x mint
lint tnt
and when relating tbe masses 111, to the total sample mass, mass fractions (e.g., in micrograms per gram) can be obtained. As mentioned above, the TXRF sample chamber is normaUy filled with air, so that the characteristic X-ray radiation of elements with atomic number" 13 is absorbed and these elements are not detectable.
TXRF instrumentation is, compared to other modem techniques, relatively simple. An excitation unit containing a high-voltage generator and an X-ray tube with housing, a total reflection module, and a detection unit composed of a Si( Li) detector and a multichannel analyzer are needed. The Operating and maintenance costs arc low.
TXRF proved to be a versatile tool for chemical analyses, especially for extreme trace and microanalyses and for direct analyses of solid samples as

r 66 X-RA Y FLUORESCENCE
was reviewed by several authors ( Reus and Prange 1993; Klockenkiimpcr et al. 1992; Prange and Schwenke 1992; Klockenkamper 1996; Moens et al. 1994).
4.4. APPLICATIO 'S
The examples cited here are far from a complete overview and should only show the versatility and the variety of applications of X-ray fluorescence analysis.
4.4.1. Analysis of Ancient Coins
Metal analysis is one of the most promioent applications of XRF in Hrchaeometry. In particular, the analysis of ancient coins proved to be very useful. In general, coins were produced from well-controlled alloys by a known mint and often were provided with a date of issue. Many references concerning the technology, the typology, and the chronology can be found in historical documents and in modern studies. Coins are, except for the rough surface, ideal objects for XRF analysis. They can be investigated without any sample preparation and nearly all elements of interest present as major or minor constituents, as well as some traces can be detected in coins of all forms and sizes. Further advantages are their favorable physical properties allowing nondestructive multielement analysis in a reasonable time. Only layers of patina, bleaching, or plating have to be considered when discussing the results of elemental analyses. Indeed , the observed fluorescence radiation originates from the top layer of the sample, resulting in a "depth of informatioo" of I to some 100 J.1m, depending on the applied technique, the alloy, and the elements in question . Therefore XRF results do not necessarily represent the composition of the bulk of the coin material.
Until now, the elemental composition of hundreds or even thousands of ancieot coins, predominantly of Roman origin, has been determined by XRF analysis. Very different approaches have been used for this purpose, and it is notable that XR F techniques often have been used io combination with other methods.
Condamin and Picon (1964) were the first to examine corrosion effects on dinarii and concluded that the surface silver content will be markedly higher than the silver content of the alloy within the coin. The notable discrepancy between the silver contents in Roman coins induced several approaches going hand in haod with the development of techniques to study problems of bleaching, plating, corrosion, and wear off by circulation. Walker (1976, 1977, 1978) presented an extended work related to the metrology of Roma n
4.4. APPLICATIONS 67
silver coinage. Several other works dealing with the examination of Roman coins (e.g., Carter 1978; Butcher et al. 1997) and related analytical problems (e.g., Lutz and Pemicka 1996) have been published. Some of these are presented below.
In his approach, Klockenkiimper (1978) uses WDXRF and a scanning electron microscope with energy dispersive X-ray detection (SEM-EDX) for the characterization of more than 200 coins. The combination of the two techniques with different penetration depth of the primary X-rays and of electrons, respectively, into the material provided insight into the silver enrichment at the surface of dinarij relative to the silver content in deeper layers. The results showed the decay of values in the Roman Empire: Less silver was used for coinage alloys, but the surface of the coins was enriched starting from about the year A.D. 200. Similar results are reported for Roman coins (dinarii , quintarii , etc.) found in Switzerland, Augusta Raurica, and analyzed by Zwicky-Sobczyk and Stern (1997). They combined the results of EDXRF analysis using silver-K and silver-L lines and of density measurements to characterize more than 600 coins. The intensity ratio of silver X-ray lines in modern silver alloys is, theoretically, a clue to the presence of plating, but with most ancient silver coins this ratio is influenced by the surface morphology and by corrosion. However, the silver-K intensities of massive and of uncorroded plated silver coins are clearly different.
Though most work has been done on Roman coins, other coins of very different regions and ages were analyzed using XRF as well. Ancient dirhams (silver coins) from the Abbasid period 158- 218 Hirji (A.D. 775 to 833) of the Great Islamic Empire were analyzed by AI-Kofahi et al. (1997). The dirhams were found to have silver (about 41 to 84%) as a major constituent and minor quantities of 10/0 or more of silicon, copper, mercury, gold, and lead, of O. I to 1% of aluminium, phosphorus, iron, and tungsten and less than 0.1% of titanium, nickel , and zinc. The results of the analyses show that the dirhams coined in the capital of the state, Madillat Essalam, are of good quality, having a silver concentration of at least 80%, whereas those fabricated in locations far from the capital have significantly lower silver concentrations (41 to 54%).
Genuine and counterfeit German Reichsgoldlllllll:en dated 1872 to 1914 made of gold were studied by Klockenkiimper et al. (1990). A gold content of about 90% and a silver content of about 0.4% were found to be reliable criteria of genuineness. Counterfeits frequently show more gold and often more or less silver. Additionally, several counterfeits have a gold enrichment at the surface.
Early Russian platinum roubles, of the beginning of the eighteenth century, Showing gold inclusions and lower fineness than reported by the mint were examined by Auer et al. (1998). In earlier times platinum ores contain-

68 X-RA Y FLUORESCENCE
128.B
97.28 PI PI
L~' La'
76.88
u 58.88 .. PI <II
43.28 J!l L~213 c: 311 ••
" PI Pt 0 19.28 PI u La2 .>< Ljl4 18.88
Au Pt Au PI I, Pt I, 4._ I, Pt Au L~ L~ La La'
Cu K~
1.21!11 .-B.1!'lII B.l. 8.118 B.128 8.138 8.148
Wavelength, nm
Figure 4.7. WDXRF spectrum ora platinum rouble of the year 1838 showing gold and iridium lines next 10 those of platinum; analyzing crystal L1F (220); rhodium X-ray lube 100 kV, 30 rnA.
ing ca. 64% platinwn found at the Ural could be refined only by a complex chemical procedure. The refined platinum was minted in a powder metallurgical process to coins of 2, 3, or 6 roubles. These should have 96 to 99% of platinum and up to 0.5% of ruthenium, 0.25% of palladium, 1.2% of iridium, and traces of chromium, iron, and copper. The analysis of 2 rouble coins revealed the presence of additional elements like manganese, zinc, silver, and gold. An XRF spectrum of a platinum rouble with gold inclusions is shown in Figure 4.7. The detection of manganese, iron, nickel, copper, zinc, palladium, silver, iridium, and gold suggests a mixing of refined platinum and original platinum ores for the coinage.
The transfer of gold and silver originating from the ew World starting about the year 1500 and the propagation in the Old World and later mixing with European, Russian, and Ottoman gold used in coinage was studied by Guerra (1995, 1998). Typical element traces, for example, arsenic in copper, indiwn in silver, rhodium, palladium, and platinum in gold, present in coinage metals of different provenance were analyzed by a combined procedure including methods of neutron activation, laser ablation mass spectromerty, proton-induced X-ray fluorescence, and XRF.
4.4.2. Pottery and Porcelain
Among the most important archaeological finds are ceramic materials, and it should not come as a surprise that numerous XRF studies deal with pottery or porcelain. Small samples are usually taken and either analyzed as such
b
4.4. APPLICATIONS 69
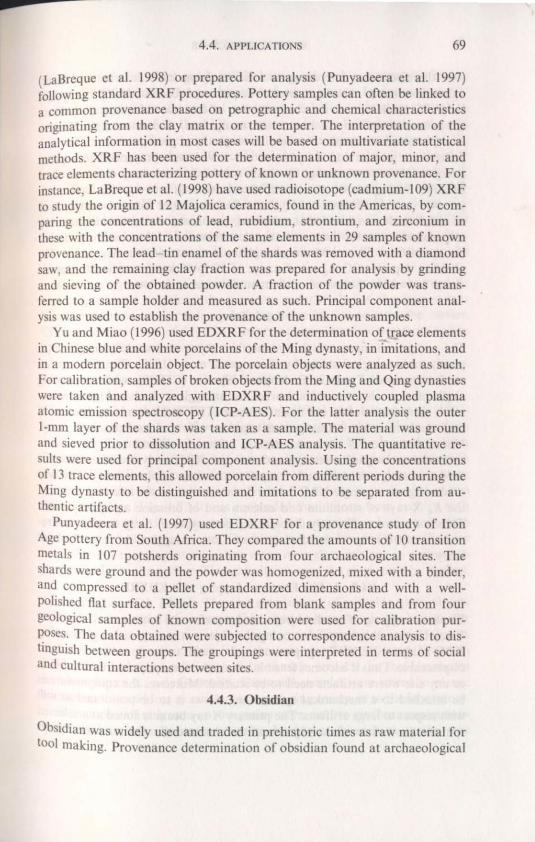
(LaBreque et al. 1998) or prepared for analysis (Punyadeera et al. 1997) following standard XRF procedures. Pottery samples c.1n often be linked to a common provenance based on petrographic and chemical characteristics originating from the clay matrix or the temper. The interpretation of the analytical information in most cases will be based on multivariate statistical methods. XRF has been used for the determination of major, minor, and trace elements characterizing pottery of known or unknown provenance. For instance, LaBreque et al. (1998) have used radioisotope (cadmium-109) XRF to study the origin of 12 Majolica ceramics, found in the Americas, by comparing the concentrations of lead, rubidium, strontium, and zirconium in these with the concentrations of the same elements in 29 samples of known provenance. The lead tin enamel of the shards was removed with a diamond saw, and the remaining clay fraction was prepared for analysis by grinding and sieving of the obtained powder. A fraction of the powder was transferred to a sample holder and measured as such. Principal component analysis was used to establish the provenance of the unknown samples.
Yu and Miao (1996) used EDXRF forthe determination of trace elements in Chinese blue and white porcelains of the Ming dynasty, in imitations, and in a modem porcelain object. The porcelain objects were analyzed as such. For calibration, samples of broken objects from the Ming and Qing dynasties were taken and analyzed with EDXRF and inductively coupled plasma atomic emission spectroscopy (ICP-AES). For the latter analysis the outer I-mm layer of the shards was taken as a sample. The material was ground and sieved prior to dissolution and ICP-AES analysis. The quantitative results were used for principal component analysis. Using the concentrations of 13 trace elements, this allowed porcelain from different periods during the Ming dynasty to be distinguished and imitations to be separated from autbentic artifacts.
Punyadeera et al. (1997) used EDXRF for a provenance study of Lron Age pottery from South Africa. They compared the amounts of 10 transition metals in 107 potsherds originating from four archaeological sites. The shards were ground and the powder was homogenized, mixed with a binder, and compressed to a pellet of standardized dimensions and with a wellpolished flat surface. Pellets prepared from blank samples and from four geological samples of known composition were used for calibration purposes. The data obtained were subjected to correspondence analysis to distInguish between groups. The groupings were interpreted in terms of social and cultural interactions between sites.
4.4-3. Obsidian
ObSidian was widely used and traded in prehistoric times as raw material for tool making. Provenance determination of obsidian found at archaeological

70 X-RAY FLUORESCENCE
sites therefore is an interesting tool for studying trade patterns and intcrcultural contacts. Among others, Vazquez and Escola (1995) have used WDXRF to detennine the concentration of five trace elements (rubidium, zirconium, strontium, titanium, and manganese) and one major element (iron) in obsidian samples from archaeological and geological sites. Obsidian flakes were ground and the powder was sieved and compressed to a pellet using cellulose as a backing. Synthetic standards, mimicking obsidian, were made by mixing known amounts of the elements of interest with basic components (mainly silicon dioxide) that reflect the major element composition of obsidian. It was found that rubidium, zirconium, and strontium are very reliable indicators for the provenance determination of the obsidian found at the site of Casa Chavez Monticulos (450 B.C. to A.D. 650) in Argentina. The obsidian deposit of Ona, at a distance of 80 to 90 km from the site, turned out to have been the source of the material used at the site.
4.4.4. Ivory
The analysis of mammoth ivory was the subject of a study (though not a purely archaeological study) by Shimoyama et al. (1998). The Convention on [nternational Trade in Endangered Species (C ITES), while protecting elephants has also created a market for smugglers. Archaeological mammoth ivory is obviously not meant in the CITES, but it has been discovered that elephant ivory is transported together with and as mammoth ivory. Visual distinction of these materials is extremely difficult and therefore a method was designed whereby nondestructive XRF analysis of the dentine is used to distinguish mammoth ivory from modern elephant ivory. Use was made of glancing angle XRF for the determination of the intensity ratios of the K. X-rays of strontitun and calcium and of bromine and phosphorus. These ratios are sufficiently different for both types of ivory to allow mammoth ivory clearly to be distinguished from smuggled African elephant ivory.
4.4.5. In Situ Element Mapping with EDXRF
Element mapping of small objects can be performed with a small diameter X-ray beam and by stepwise moving the object, at each position performing XRF analysis. EDXRF equipment can be made to be portable or at least displaceable. Thus it becomes feasible to transfer the equipment to a museum or any site where artifacts need to be studied. Moreover the equipment can be attached to a mechanical system that allows it to be positioned at will with Te pect to large artifacts. The primary X-ray beam is aimed at a selected spot on the surface of the object and the characteristic fluorescence X-rays

?
4.4. APPLICATIONS 71
are measured. Schreiner et a!. (1992) have used such a system for in silll mapping of elements in large objects such as paintings. In one such application, they performed element mapping of Indian miniature paintings (seventeenth century) in the Millionenzimmer at the Schonbrunn palace in Vienna (Austria). The spatial resolution of the mapping was I mm and the measuring time per spot was 30 sec. This led to a long total analysis time (up to hours), but it was possible to identify most of the pigments used: red lead, vermilion, white lead, a green copper pigment, azurite, and ochre. In addition silver and gold were found to be present in metallic form. Some pigments could not be identified and were assumed to exclusively consist of light elements that escape XR F analysis under the conditions used (e.g., ultramarine or organic pigments). The mapping allowed origina l sections to be distinguished from later additions.
III silll analysis of paintings is hampered by the fact that the observed Xrays originate not only from the pigments under study but also from superficial contamination, varnish, underlying paint layers, or even the carrier. Critical interpretation of this mixed information is therefore necessary and in most cases sufficient to come to relevant conclusions.
4.4.6. Glass
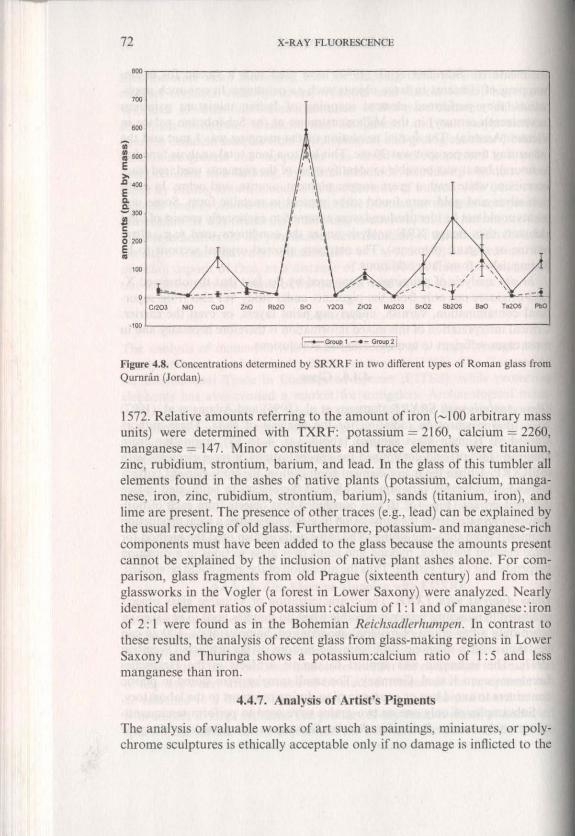
Glass Analysis .. il" SRXRF. Janssens et a!. (1996) and Adams et a!. (1997) have used synchrotron radiation for the analysis of glass. These authors studied 90 Roman glass samples (about A.D. 4 to 68) originating from Qumran (Jordan) and detemlined tbe concentrations of trace elements with II·SRXRF. Unlike the major element composition, the trace element pattern showed considerable variation and allowed the objects to be divided in two different groups (Fig. 4.8). It was concluded that objects from each of both groups originated from the same batch of glass, suggesting a local production Or import from the same source. The same authors also used the method for trace element mapping, making line scans over glass sections in a direction perpendicular to the surface. Thus the alteration of the glass could be studied.
Glass Analysis II'il" TXRF. The characterization of valuable glass objects exhibited in museums becomes possible when no samples need to be taken or When only a few grains of material are required. Samples of ca. 100 ~g can be taken witb a diamond drill from the bottom of the artifacts (Wegstein 1997). The technique was applied to sample artifacts in the Hessisches Landesmuseum Kassel , Germany. The small samples were stored in plastic containers to avoid loss or contamination during transport to the laboratory.
Subsamples of only one or two grains were used to perforol semiquantitatIve analyses of a Bohemian Reic!Jsadlerhllmpell dated back to the year
72 X-RAY FLUORESCENCE
~r------------------------------------------------'
,.,
.. : .. E
'" " ", E
! 300 1I C , 0 200 E • ,.,
Cr2Ql NiO CuO ZIIO Rb20 SrO YlOl Zr02 M0203 Sn02 Sb205 a.o TII205 PbO
.,.,L-__________________________ --'
Figure 4.8. Concentrations detcmlined by SRXRF in two differenl types of Roman glass from Qurnnin (Jordan).
1572. Relative amounts referring to the amount of iron (-100 arbitrary mass units) were determined with TXRF: potassium = 2160, calcium = 2260, manganese = 147. Minor constituents and trace elements were titanium, zinc, rubidium, strontium, barium, and lead. [n the glass of this tumbler all elements found in the ashes of native plants (potassium, calcium, manganese, iron, zinc, rubidium, strontium, barium), sands (titanium, iron), and lime are present. The presence of other traces (e.g., lead) can be explained by the usual recycling of old glass. Furthermore, potassium- and manganese-rich components must have been added to the glass because the amounts present cannot be explained by the inclusion of native plant ashes alone. For comparison, glass fragments from old Prague (sixteenth century) and from the glassworks in the Vogler (a forest in Lower Saxony) were analyzed. Nearly identical element ratios of potassium: calcium of I : I and of manganese: iron of 2: I were found as in the Bohemian Reichsadle,humpell. In contrast to these results, the analysis of recent glass from glass-making regions in Lower Saxony and Thuringa shows a potassium:calcium ratio of I: 5 and less manganese than iron.
4.4.7. Analysis of Artist's Pigments
The analysis of valuable works of art such as paintings, miniatures, or polychrome sculptures is ethically acceptable only if no damage is inflicted to the
4.4. APPLICATIONS 73
artefact (as in direct XRF without sampling) or if the damage is negligible. For TXR F only microsamples (less than I Ilg) are required, and a gentle microsampling method was developed, consisting of rubbing a dry cotton wool bud (Q-tip) over the painted surface. This will remove a minute amount of material, without causing any visible damage. A fraction of the material can next be transferred to the TXRF sample carrier.
TXRF was extensively used for identification and fingerprinting purposes. Apart from being practically nondestructive, the method proved to be advantageous because samples can easily be taken by restorers or art historians, the response time is short (analysis time of a few minutes), and the costs are very low. However, sampling is possible only when the pigment layer is not covered by varnish. For most old paintings, therefore, samples can only be taken during restoration. Also, the sampling only concerns the surface of the object, and the analysis consequently does not reveal any information on deeper paint layers.
TXR F proved to be an excellent method to identify artists' pigments via the detection of key elements, a principle also applied in the in silll XRF pigment analysis outlined before. Especially ancient pigments are predominantly of mineral origin and can indeed be characterized by the presence of one to three typical elements (Klockenkiimper et al. 1993; Moens et al. 1995). In addition, TXRF allows the mixing ralios of different pigments, used to produce a paint of a particular hue, to be determined. Finally, it is also possible to determine minor and trace element concentrations that reflect the characteristics of the minerals used, of the refinement process, and of the actual paint-making recipe used in tbe artist's workshop. This concentration pattern is often a unique result of various parameters and therefore can be used, with the necessary precautions, to tell different workshops apart.
Apart from this, pigment identification and characterization can provide data for various other investigations: general art historical or archaeological studies on the materials used, conservation and restoration, deteclion of forgeries, and relative dating. The latter two aims are within reach because some pigments are known to have appeared (dating POSI quem) on artists' pallets and/or to have disappeared (dating anle quem) at a certain time.
Apart from the detection of anachronistic pigments, the detection of pigments that were not found in any of an artist's authentic works can also reveal falsification. For instance, in 1994 a privately owned painling claimed to be painted by Modigliani was offered to the organizers of a comprehenSive exhibition on the work of this master. The pallet of Modigliani has been studied by Delburgo et al. (1981 ), who analyzed 15 authentic oil paintings With in Silll XRF. It was reported that in those paintings Modigliani only u.sed cadmium and chrome yellow, ochre, vermilion, chromium green , Prus· sian blue, wbite lead, zinc white, and organic pigments. In the painting dis-

74 X-RA Y FLUORESCENCE
cussed here, cerulean blue and emerald green where detected via TXRF analysis of microsamples, which could indicate falsification (Devos 1996). Further radiographic research revealed anomalies in the painting technique as well , and the painting was rejected by the exhibition.
4.4.8. Analysis of Ink
Medieval manuscripts are often illuminated with miniatures and decorative motives (Van Hooydonk et al. 1998, Vandenabeele et aI. , 1999). The pigments used have been studied among others with TXRF. Also writing ink, in most cases gall ink, was found to yield interesting information on the writer. Gall ink was made by adding iron sulfate to gall extract. A complex between iron and gallic acid is formed that , only after the writing, turns into a black ink by oxidation of the iron (Wunderlich 1994). In the scriptorium new ink had to be made quite regularly, and it is likely that the impurity pattern was slightly different for each new batch and quite different for different scriptoria. This allowed constructing a chronology of undated lellers and notes by Galileo based on impurity patterns determined with proton-induced X-ray emission ( PIXE) and comparison of these patterns with those of inks on dated bills and diaries (Giuntini et al. 1995). Recently, ink analysis was used to study a series of manuscripts from the collection of Raphael de Mercatellis (1437 to IS08), native son of Philip the Good, Duke of Burgundy (Derolez 1979). One of the manuscripts ( Decretum Gratiani) consists of three volumes from which microsamples where taken from the ink on several pages. The relative concentrations of a number of elements, as deternlined by TXRF are shown in Figure 4.9. All samples show a similar pattern, except one, a sample from a colophon, mentioning the acquisition date (ISOS ). The
100 90
Q) 80
> 70 ~ 60 ~ 50 C 40 1l ~ 30 Q) a. 20
10 0
K Ca Mn Fe Ni Cu Zn Sr Hg Pb [---""* '""!"" ....--CoOophon I
Figure 4.9. Impurity pattern of gnU inks on different pages of n Medieval manuscript.

b
4.4. APPLICATIONS 75
analysis suggests tbat the colophon was not written at the same time or the same place as the manuscript.
4.4.9. Violin Varnishes
Historical violin varnishes are mixtures of natural products in which the main components are organic substances such as drying oils, essential oils, resins, waxes, organic colorants, spirit, and others. Beside these major components some inorganic substances were added to control the properties of the varnish. It is indeed possible to influence thc color, the hue, the transparency, the hardness, and also to reduce drastically the drying time of oilbased varnishes. A great variety of old fOrIllulas describing how to produce and how to process varnishes for violinmakers are known, but unfortunately those of early Italian masters were lost. Especially these varnishes, applied by prominent violinmakers and families of violinmakers remain unattainable. The particular beauty of these varnishes and their capability to preserve the wood and thus the sound quality of the instruments can thet:efore not be reproduced.
Small flakes of varnishes were collected from stringed instruments that were under restoration. The flakes were removed carefully from the precleaned surface of the varnishes by the aid of a scalpel and deposited in small paper bags for transport and storage. Fractions of such samples with masses below 20 fig were analyzed directly by TXRF without any additional preparation except the deposition on Plexiglas carriers by means of wooden toothpicks (von Bohlen 1999; von Bohlen and Meyer 1996). The multielement analyses were perforIlled in a counting time of 100 to 300 sec. More than 20 elements (silicon, phosphorus, sulfur, chlorine, potassium, calcium, titanium, chromium, manganese, iron, cobalt, nickel , copper, zinc, arsenic, bromine, rubidium, strontium, barium, lead, potassium, calcium) were detected simultaneously and relative detection limits of the order of 10 pgfflg for elements with atomic number Z ~ 24 were estimated. In Figure 4.10 a TXRF spectrum of an Andrea Guarneri varnish of a violin of ca. 1660 is Shown. Elements such as iron, arsenic, and lead could be related to pigments added to the varnishes, whereas manganese, cobalt, and lead are related to siccatives accelerating the drying process of the oil-based varnishes. Occasionally elements are detected (e.g., silver or tin) that seem to have been Introduced accidentally.
Unfortunately, the masses of the analyzed flakes were too low to be weighed accurately, and, consequently, it was impossible to calculate the mass fractions of the detected elements in relation to the total sample mass. However, a possibility for quantification is given when relative mass fraclions of the detected clements are calculated with respect to the sum of all

76 X-RAY FLUORESCENCE
A Guarne ri, Violin ca . 1660 1500
~ K
'" Fe
8 1000 - Ar Pb J!l
" 500 " 8 0
0 2 4 6 8 10 12 14 16
Photon Energy, keV
Figure 4. 10. TXRF spectrum of an Andrea Guarneri varnish obtained from a violin of about 1660. A sample with a mass of less than 20 ~g was used for the analysis. Excitation: molybdenum X-ray tube, SO kV, 38 rnA and spectrum acquisition lime of 100 sec.
detected elements (see before). After nonnalization of the data, a generation and visualization of multielement patterns was performed by a graphical representation of TXRF results using star plots (cf. Fig. 4.11). This combination makes an easy classification of element pattern in violin varnishes possible. It can be used to characterize unknown historical varnishes, to distinguish retouches made on historical stringed instruments using modern varnishes, and for general classification of the elemental distribution in varnishes.
4.5. CONCLUSION
XRF-based methods, versatile and various as they are, will continue to be of great use to archaeometric research. For qualitative analysis the nondestructive character and the speed of analysis allow the element composition of an artifact to be known instantly and without damaging the object. This infonnation is orten sufficient to determine the nature of the material used for making the object. Quantification may require expert knowledge, but numerous examples show that accuracy and precision are within reach. The useful infonnation present in the vast amount of data, generated by the simultaneous multielement analysis, orten is extracted from the data set with the aid of statistical analysis.
In recent years the means have been created to perform microanalysis and spatially resolved analysis with good resolution. Microsamples, as required for TXRF, can be taken from most artifacts without inflicting any visible damage and can easily be analyzed quantitatively. Microbeams, as generated

REFERENCES 77
A. Guarneri, 1670 A. Guarneri, 1690
s s
Co Co
L. Mausslell, 1750 E. Fran~ais, 1950
s s
Zn H-f--'f-
Co Co
Figure 4.11. Radial plots for the characterization of elemental patlern of varnishes of twO dif· ferent celli made by A. Guarneri, of a varnisb of a cello made by L. Maussie ll , and of a modem violin varnish made by E. Franc;:ais. Relative concentrations were obtained by TXRF analysis of small varnish Oakes.
by special X-ray source setups and synchrotrons, allow element mapping at submilimeter scale. It is expected that new applications of these new possibilities will continue to be developed, making XRF an even more attractive analytical tool than it is today.
REFERENCES
Adams, M. J. , and J. R. Allen (1998), J. Anal. A 10111. Speclrolll. 13, 119.
Adams, P., A. Adriaens, A. Aerts, I. De Raedt, K. Janssens, and O. Schalm ( 1997), J. Allal. Atom. Spec/rom. 12,257.

78 X-RA Y FLUORESCENCE
AI-Kofahi , M. M., K. F. AI-Tarawneh, and J. M. Shobaki (1997), X-Ray Spectrom. 26, 10.
Auer, E., Th. Rehren, A. von Bohlen, D. Kirchner, and R. KJockenkamper (1998), Metal/a 5, 71.
Bertin, E. P. (1975), Principles and Practice of X-Ray Spectrometry. 2nd ed. , Plenum. New York.
Broil, N. (1996), J. Phys. IV 6,583.
Butcher, K., M. Ponting, and G. Chandler (1997), AJN Second Series 9, 17.
Carter, G. F. (1978), Numismatic Chronicle J9, 67. Condamin, J., and M. Picon (1964), Archaeometry 7, 98. Delbourgo, S. , and L. Faillant-Dumas (198 1), L'Etude au laboratoire de Recherche
des musees de France, in Amadeo Modiglini, 1884- 1920, MusCe d'Art Moderne de la Ville de Paris, Paris.
Derolcz, A. (1979), The Library of Raphael de A1ercafellis, Story Scientia, Ghent. Devos, W. (1996), Ph.D . thesis, Laboratory of Analytical Chemistry, Universi ty of
Ghent.
Guerra, M. F. (1995), Appl. Radial. Isol. 46, 583.
Guerra, M. F. (1998), X-Ray Spectrom. 27, 73.
Giuntini L. , F. Lucarelli , P. A. Mando, W. Hooper, and P. H. Barker (1995), Nile/. Ills/rUIIl. Methods Phys. Res. B 95, 389.
Haller, M., and A. Knochel (1996), J. Trace Microprobe Tech. 14, 461 .
Heinrich, K. F. J. (1981), Electron Beam X-Ray Microanalysis, Van Nostrand Reinhold, New York .
Janssens, K., A. Aerts, L. Vincze, F. Adams, C. Yang, R. Utui , K. Malqvist, K. W. Jones, M. Radtke, S. Garbe, F. Lechtenberg, A. Knochel , and H. Wouten; (1996). Nile/. IlIsrrllln. Methods Phys. Res. 8 109/110, 690.
Jenkins, R. (1988), X-Ray Fluorescence Spectrometry, Wiley-Interscience, London.
Klockenkamper, R. (1978), Fresenills Z. Anal. Chem. 290, 212.
Klockenkamper, R. (1980), in VI/malls Ellcyklopadie der tecllllischell Chemie, Verlag Chemie GmbH, Weinheim, p. 501.
Klockenkamper, R. (1996), Total Reflection X-Ray Fluorescence Analysis, John Wiley & Sons, New York.
Klockenkiimper, R., and A. von Bohlen (1988), Spectrochim. Acta 844, 461.
Klockenkiimper, R., and A. von Bohlen (1992), J. Allal. AIOIll. Spectrom. 7, 273.
Klockenkamper, R., M. Becker, and H. Ouo (1990), Spectrochim. Acta 845, 1043.
Klockcnkiimper, R., J. Knoth, A. Prange, and H. Schwenke (1992), Allal. Chem. 64, 1115A.
Klockenkamper, R., A. von Bohlen, L. Moens, and W . Devos ( 1993), Spec/roc"im. Acta 8 48, 239.
LaBrecque, J. J., J. E. Vaz, J. M. Cruxent, and P. A. Rosales (1998), Specrrochim. Acta 853, 95.

REFERENCES 79
Lachance, G. R., and F. Claisse (1995), in Quantitative X·ray Fluorescence Analy sis: Theory and Applicalioll , G. R. Lachance and F. Claisse, Eds., Wiley, New York.
LulZ, J ., and E. Pemicka (1996), ArchaeomeirY 38, 313.
Luo. L. , A. Ji , G . Ma, and C Guo (1998), X-Ray Spectrom. 27, 17.
Moens, L. , W. Devos, R . Klockenkiimper, and A. von Bohlen (1994), TRAC Trend Anal. Chem. 13, 198.
Moens, L. , W. Devos, R . Klockenkiimper, and A. von Bohlen (1995), 1. Trace Microprobe Tech. 13(2), 119.
Prange, A., and H. Schwenke (1992), Adv. X-Ray Allal. 35, 899.
Puyandeera, C , A . E. Pillay, L. Jacobson, and G . Whitelaw {I 997), X-Ray SpeClrolll. 26,249.
Reus, U., and A. Prange (1993), Spectrosc. Eur. 5, 25.
Schreiner, M., M. Mantler, F. Weber, R . Ebner, and F. Mairinger (1992), Adv. XRay Anal. 35, 11 57.
Shimoyama, M., T. Nakanishi, Y. l-iamagana, T. NinomiY3, and Y. Ozaki (1998), J. Trace Microprobe Tech. 16, 175.
Vandenabeele, p" B. Wehling, L. Moens, 8. Dckeyzer, B. Cardon, A. "Von Bohlen, and R. Klockenkiimper (1999), The Analyst 194, 169.
Van Hooydonk, G ., M. De Reu, L. Moens, J . Van Aelst, and L. Milis (1998), Eur. J. Illorg. Cite",. 5, 639.
Vazquez, C, and P. Escola (I995), 1. Radioallal. Nucl. Chelll. LeI/. 200, 373.
Vince, L. , K. Janssens, F. Adams, M. L. Rivers, and K. W. Jones (1995a), Speclroehim. Aela B 50, 127.
Vince, L. , K. Janssens, F. Adams, M. L. Rivers, and K. W. Jones (1995b), Spec-"oeM",. Acta B 50, 1481.
von Bohlen, A. (1999), 1. Trace Microprobe Tech. 17, 177.
von Bohlen, A., and F. Meyer (1996), Restallro 7, 472.
von Bohlen, A., P. Rechm.nn, J . L. Tourmann, and R. Klockenkiimper (1994), J. Trace Elem. Electro/y tes Health Dis. 8, 37.
Walker, R. D. (1976), Brit. Arc/weal. Rep. Suppl. Ser. 5, I.
Walker, R . D. (1977), Brit. Archaeol. Rep. Slippl. Ser. 22, I.
Walke r, R . D. (1978), Brit. Archaeol. Rep. Slippl. Ser. 40, I. Wegstein, M., H. Urban, P. Rostam-Khani, A. Wittershagen, and B. O. Kolbesen
(1997). Spectrocitim. Acta B 52, 1057.
Will iams, K. L. (1987), An Introduction 10 X-Ray Spectrometry. Allen & Unwin, London.
Wunderlich, C H. (1994), Restauro 6, 414.
Yu, K. N., and J . M. Miao (1996), X-Ray Spectrom. 25, 281.
ZWicky-Sobczyk, C. N ., and W. B. Stem (1997), Archaeometry 39, 392.