wyoming oil and gas economic contribution study
TRANSCRIPT

August 2008
Wyoming Oil and Gas Economic Contribution Study
Prepared for the Wyoming Heritage Foundation
Casper, Wyoming 82601

Table of Contents
Executive Summary ....................................................................................................................................... i
1. Introduction.......................................................................................................................................... 1 2. Objective and Design of the Project.................................................................................................... 2 3. Brief Overview of Oil and Gas Industry and Activities in Wyoming..................................................... 2 4. Regional Economic Modeling.............................................................................................................. 8
4.1 Types of Economic Impacts or Economic Contribution...............................................................8 4.2 Customizing the IMPLAN Model..................................................................................................9
5. Primary Data Collection and Storage Approach ............................................................................... 13 5.1 Operator Data Collection ...........................................................................................................14 5.2 Service Company Data Collection.............................................................................................15 5.3 Data Storage and Querying Approach ......................................................................................18
6. Secondary Data Collection................................................................................................................ 19 7. Extrapolation Methods and Estimating the Direct Oil and Gas Impacts ........................................... 20
7.1 Drilling, Completion, and Recompletion Activities .....................................................................20 7.2 Extraction Operations ................................................................................................................23 7.3 Private Mineral Royalties and Payments...................................................................................24 7.4 Extraction Taxes ........................................................................................................................25
8. Economic Contribution ...................................................................................................................... 26 8.1 Analyzing Direct Impacts through IMPLAN Model Sectors .......................................................27 8.2 Drilling, Completion, Recompletion Activities ............................................................................27 8.3 Extraction Operations ................................................................................................................30 8.4 Private Mineral Royalties and Payments...................................................................................31 8.5 Extraction Taxes ........................................................................................................................32 8.6 Total Economic Contribution of All Oil and Gas Activities .........................................................33
9. Relative Importance of Wyoming’s Oil and Gas Activities ................................................................ 38 9.1 Relative Importance of Oil and Gas Industries in the State of Wyoming ..................................38 9.2 Oil and Gas Industry Compared to the Travel Industry in Wyoming .........................................40 9.3 Wyoming and Colorado Oil and Gas Activities..........................................................................42
10. Fiscal Analysis: Estimate of Sales Taxes.......................................................................................... 46 11. Conclusion......................................................................................................................................... 53 Appendix A: Acronyms................................................................................................................................ 54 Appendix B: Glossary.................................................................................................................................. 55 Appendix C: IMPLAN Sector 19, 27, and 28 Study Area Data ................................................................... 57

Appendix D: Wyoming Oil and Gas Operators Data Collection Documents .............................................. 67 Appendix E: Vendor and Service Company Allocations ............................................................................. 73 Appendix F: References............................................................................................................................. 76

Table of Exhibits
Exhibit ES-1. Total Economic Contribution for Oil and Gas Activities in Wyoming (2007$)* .......................iii Exhibit ES-2. 2007 Oil and Gas Activity as a Fraction of the State’s Economy (2007$) ............................. v Exhibit ES-3. Drilling, Completion, and Facility Expenditures for Wyoming, by Basin (2007$).................. vi Exhibit ES-4. Private Mineral Royalties and Lease Payments in Wyoming (2007$) ...................................vii Exhibit 3.1. Distribution of Producing Wells in Wyoming, 2007 ...................................................................4 Exhibit 3.2. Wells Drilled in Wyoming in 2007...............................................................................................5 Exhibit 3.3. Wyoming Drilling and Production Statistics, by Basin, 2007 .....................................................6 Exhibit 3.4. Production by Basin in Wyoming, 2007 .....................................................................................7 Exhibit 5.1. Example Well Drilling & Completion Cost Categories..............................................................15 Exhibit 5.2. Example Drilling Company Location Allocation .......................................................................16 Exhibit 6.1. Secondary Source Data Used to Modify Model Parameters ...................................................19 Exhibit 7.1. IMPLAN Sectors for Direct Capital Investments for Drilling, Completion, and Recompletion Activities ......................................................................................................................................................20 Exhibit 7.2. 2007 Well Recompletions, Workovers, and Reactivations by Basin ......................................22 Exhibit 7.3. Extraction Volumes, Prices, and Revenues............................................................................23 Exhibit 7.4. Direct Impact -- Extraction Operations....................................................................................24 Exhibit 7.5. Extraction Taxes Paid by Wyoming Oil and Gas Industry (2007$)..........................................26 Exhibit 8.1. Drilling, Completion, Facility, and Recompletion Investments for Wyoming (2007$) ..............28 Exhibit 8.2. Drilling, Completion, and Facility Investments for Wyoming (2007$) .....................................29 Exhibit 8.3. Drilling, Completion, Facility and Recompletion Economic Contribution for Wyoming (2007$)....................................................................................................................................................................30 Exhibit 8.4. 2007 Extraction Economic Contribution for Wyoming (2007$) ................................................30 Exhibit 8.5. Wyoming Private Mineral Royalties and Lease Payments (2007$)........................................31 Exhibit 8.6. Economic Contribution of Private Mineral Royalties and Lease Payments for Wyoming (2007$) ........................................................................................................................................................32 Exhibit 8.7. Economic Contribution of Extraction Taxes in Wyoming (2007$)............................................32 Exhibit 8.8. State and Local Tax Receipts with a Unit Price Change (2007$)............................................32 Exhibit 8.9. State and Local Tax Receipts with a Unit Price Change (2007$)............................................33 Exhibit 8.10. Total Economic Contribution for Oil and Gas Activities in Wyoming (2007$)........................34 Exhibit 8.11. 2007 Employment Impacts by Industry Associated with All Oil and Gas Activities ...............35 Exhibit 8.12. 2007 Oil and Gas Industry Employment in Wyoming ............................................................36 Exhibit 8.13. Labor Earnings Impacts by Industry Associated with All Oil and Gas Activities (2007$) ......37 Exhibit 9.1. Oil and Gas Industry Activity as a Fraction of the State’s Economy (2007$) .........................39
Exhibit 9.2. Economic Comparison of Oil and Gas and Travel Activities in Wyoming (2007$) ..................41 Exhibit 9.3. Total Economic Contribution for Oil and Gas Activities in Colorado in 2005 (2007$) .............42 Exhibit 9.4. Comparison of Wyoming and Colorado Economic Indicators (2007$) ....................................43 Exhibit 9.5. Oil and Gas Employment by Activity in Colorado and Wyoming .............................................44 Exhibit 9.6. Colorado and Wyoming Employment and Labor Earnings Multipliers.....................................45 Exhibit 9.7. Comparison of Colorado and Wyoming’s Fiscal Contributions (2007$) ..................................45 Exhibit 10.1. 2007 Total Annual Sales and Use Taxes...............................................................................47 Exhibit 10.2. 2007 Sales and Use Tax Estimates for Sectors 2111 and 2131 ..........................................48 Exhibit 10.3. Percentage of Sales and Use Taxes by Basin......................................................................49 Exhibit 10.4. Estimated Average Sales and Use Tax Rates for Basins within Wyoming ...........................50 Exhibit 10.5. Sales Tax Estimates by Basin for Wyoming Oil and Gas Activities......................................51 Exhibit E.1. Drilling Contract Expenditure Location Allocations..................................................................73 Exhibit E.2. Earthwork and Construction Expenditure Location Allocation................................................73 Exhibit E.3. Stimulation and Cementing Expenditure Location Allocation..................................................74 Exhibit E.4. General Labor-Based Service Expenditure Location Allocation.............................................74 Exhibit E.5. Casing and Tubing Expenditure Location Allocation...............................................................74 Exhibit E.6. General Materials and Equipment Expenditure Location Allocation .......................................75

Acknowledgments
Primary contributors to this report include the following:
Holly Wise Bender, PhD
Sheri Donnelly
Jessica Dick
Booz Allen Hamilton 5299 DTC Blvd Greenwood Village, CO 80111-3362 (303) 221-3726
Lisa McDonald, PhD
The Louis Berger Group 12596 West Bayaud Ave Lakewood, CO 80229
(303) 985-6613
David ‘Tex’ Taylor, PhD
University of Wyoming Department of Agricultural and Applied Economics 2254 1000 East University Ave Laramie, WY 82071-3354 (307) 766-5682
The authors of this report would like to gratefully acknowledge the Wyoming oil and gas industry. The industry provided considerable information needed for the accuracy of the modeling effort, without which there would be no credible model or study.
We would also like to acknowledge the Review Team, brought together by Wyoming Heritage Foundation, to provide comments on the Draft Report.
Lori Becker, Wyoming Chamber of Commerce Executives
Dave Bell, Tegeler and Associates
Randy Bolles, Devon Energy
Mike Ceballos, Qwest Wyoming
Joe Coyne, Wyoming Economic Development Association
Mark Doelger, Barlow and Hahn
Brent Hathaway, University of Wyoming
Bruce Hinchey, Petroleum Association of Wyoming

Rob Hurless, Governor’s Office
Dallen Juelfs, First Interstate Bank
Mike Matthews, Wells Fargo Bank
Buck McVeigh, Wyoming Economic Analysis Division
Jim Nielson, Nielson and Associates
Mark Northam, University of Wyoming
Dave Raynolds, Table Mountain Ranch
Bill Schilling, Wyoming Business Alliance and Wyoming Heritage Foundation
Randy Teeuwen, EnCana Oil and Gas
We would also like to acknowledge Don Likwartz, Wyoming Oil and Gas Conservation Commission Supervisor, and Brian Jeffries, Executive Director of the Wyoming Pipeline Authority, for their review of the Draft Report.

Wyoming Heritage Foundation Oil and Gas Economic Contribution Study
Executive Summary This project, commissioned by the Wyoming Heritage Foundation, was designed to evaluate the economic contribution of the oil and gas industry to the state of Wyoming in terms of employment, income, gross revenues, and taxes. Booz Allen used a regional economic modeling approach to evaluate the economic contribution of the industry. The approach included an extensive effort to gather site specific information needed to complete the analysis, such as capital investments, expenditures to drill and complete a well, production costs, private royalty and lease payments, and service company costs. Secondary source data were also obtained, including number of wells drilled and completed for each basin, oil and gas prices, oil and gas production, sector employment, and much more. The primary and secondary data were then used in combination with a common regional economic model, IMPLAN, to estimate economic contributions. Additionally, a fiscal model was developed to estimate sales and use taxes associated with oil and gas activities in Wyoming. Appendices A and B provide a list of acronyms and glossary for definitions of technical terms, respectively.
The oil and gas industry is generally comprised of two primary activities, development and extraction. Development activities consist of drilling, completing, and recompleting wells, which are typically completed in a few of months. Recompletion activities involve restimulating or reactiviting the wells after they have been producing for a period of time. Extraction or production is the act of removing the oil or gas from the mineral formations, and it occurs continually over a longer period of time. Taxes and royalties are paid to the state on the value of the production. Royalties are also paid to the owners of the minerals from which the production occurs: state government, Federal government, or private households and businesses. All of these taxes and royalties are reported through various state sources except the ones paid to private households and businesses.
Therefore, this report is focused on four oil and gas activities to estimate the economic contribution of oil and gas industry in Wyoming.1 These are:
1. Drilling, completing and recompleting wells
2. Extraction operations
3. Mineral royalty payments to households and business for access to private minerals
4. Extraction taxes paid to the state and counties of Wyoming.
Other capital investments, pipeline investments, and refinery impacts are not captured in this analysis.
The analysis indicates that there was an estimated $15.5 billion in total economic output2 (i.e., both direct and downstream economic impacts) as a result of drilling, completion, recompletion, and extraction activities in 2007, 77 percent of which is attributable to extraction activities (See Exhibit E-1). Including private mineral royalty and lease payments and extraction tax payments, total economic output for all oil and gas-related activities within Wyoming is approximately $18.6 billion. Oil and gas activities within the state employ over 73,000 people in direct and downstream jobs. These are model-derived estimates of the total direct (industry), indirect (industry support), and induced (employee-household support)
1 When these activities are aggregated, taxes and royalty payments were removed from the extraction value to avoid double counting these impacts as described in 7.2. 2 Economic output is also known as economic activity, gross revenues, or gross sales.
ii

Wyoming Heritage Foundation Oil and Gas Economic Contribution Study
employment generated as a result of direct employment associated with oil and gas activities. Direct jobs associated with drilling, support industries, extraction, wholesale trade, and construction were estimated to be 20,090 (see Exhibit 9.5), of which 17,982 are associated specifically with the oil and gas industry. There is considerable government employment associated with oil and gas activities: 25,149 government employees.
The estimated employment multiplier is 3.65, as shown in Exhibit ES-1 For example, for all the direct jobs (20,090 jobs) generated as a result of oil and gas activities, there are 3.65 times as many total direct and downstream jobs (73,229 jobs). Exhibit 9.5 summarizes these direct and downstream jobs within the various sectors within the economy. Similarly, the earnings multipliers indicate that every dollar of direct oil and gas employee salary earnings results in an additional $1.57 in indirect and induced salary earnings.
Exhibit ES-1. Total Economic Contribution for Oil and Gas Activities in Wyoming (2007$)* Type of Impact
Drilling, Completion,
and Recompletion
Extraction
Private Mineral
Royalty & Lease
Payments1
Extraction
Taxes2
Total Economic
Contribution
Total Economic Output $3,513,052,106 $11,963,561,646 $231,827,774 $2,908,623,519 $18,617,065,044
Total Employment
26,701
11,765
1,447
33,316
73,229
Total Labor Earnings $1,458,093,669 $736,813,207 $42,461,473 $1,677,264,966 $3,914,633,314
Earnings per Worker $54,608 $62,628 $29,344 $50,344
$53,457
Employment Multiplier
1.67 2.86 NA NA
3.65
Earnings Multiplier
1.32
1.75 NA NA
2.57
* These figures encompass direct, indirect, and induced economic impacts. 1 These payments to households and companies are treated as all secondary induced impacts; that is, these payments are considered income of which a portion is spent in the economy. 2 These tax payments to state and local governments are treated as all secondary indirect impacts; that is, these payments are considered downstream beneficiaries of oil and gas activities.
Oil and gas activities contribute to the economic well-being of many other industries within the state of Wyoming as well. From all of the oil and gas activities in the state (including extraction taxes and mineral royalty payments), approximately 25 percent of the employment is specific to the mining industry (which encompasses the oil and gas industries), while approximately 34 percent is in public administration or government (for example, Federal, state, and local government, public elementary, high school and higher education). Due in part to the considerable extraction taxes paid to the state in Wyoming, oil and gas-related activities account for 38 percent of government employment in the state. Other important sectors that benefit from downstream employment generated by oil and gas activities are retail trade (6.7%), healthcare and social services (5.2%), and accommodations and food service (4.8%). These are the major industries benefited by oil and gas activities within the state in terms of employment.
iii
Wyoming Heritage Foundation Oil and Gas Economic Contribution Study
Exhibit ES-2 summarizes some of the estimates of the economic indicators for oil and gas activities (and generated downstream economic activity) in Wyoming and compares these indicators to state totals. This study indicates that oil and gas activities within Wyoming account for an estimated 32 percent of the state’s total economic output or gross revenues, 20 percent of employment, 25 percent of total earnings, and 43 percent of Gross State Product.3 In general, the oil and gas activities, including private mineral royalty payments and extraction taxes and the associated downstream activity, generate estimated average earnings of approximately $53,000, or 28 percent higher than the state average.
3 Gross State Product measures the value-added of all goods and services in the state. Value-Added is defined as economic output (or gross sales or revenues) less intermediate inputs, which are goods and services purchased in the production process (or input or operational expenses). GSP is the state counterpart of Gross Domestic Product for the nation (Downey, 2006).
iv

Wyoming Heritage Foundation Oil and Gas Economic Contribution Study
Exhibit ES-2. 2007 Oil and Gas Activity as a Fraction of the State’s Economy (2007$)
Indicator
All Oil and Gas Activities in Wyoming
All Economic Activity in Wyoming
Percent of Oil and Gas to State
Source
Total Economic Output $18,617,065,044 $58,831,050,621 31.6% IMPLAN 2006
Total Employment 73,229 369,5653 19.8% IMPLAN 2006
Total Labor Earnings $3,914,633,314 $15,487,363,835 25.3% IMPLAN 2006
Average Earnings $53,457 $41,907 127.6% IMPLAN 2006
Gross State Product
(i.e., Value Added)
$13,329,075,050 $31,205,616,410 42.7% IMPLAN 2006
Severance Tax $666,397,115 $882,383,479 75.5% WY Department of Revenue Annual Report
2007
Mineral Ad Valorem Levies $712,637,118 $913,011,683 78.1% WY Department of Revenue Annual Report
2007
Assessed Valuation (Taxable Value)1
$11,303,378,284 $21,491,267,438 52.6% WY Department of Revenue Annual Report
2007
Federal Mineral Royalties (WY Disbursements, 50%)2
$515,500,646 $931,394,926 55.3% Minerals Management Service, 2007
State Mineral Royalties $90,031,996 $138,201,502 65.1% Wyoming Office of State Lands and Investments
2007
Sales and Use Taxes $50,344,215 $906,973,329 5.5%
Wyoming Depart of Revenue Annual Report
2007 1 The assessed valuation, severance taxes, and ad valorem taxes are based on 2006 production. Severance and ad valorem taxes are paid to the state in 2007. 2 This estimate is from the Minerals Management Service (MMS), and it includes Federal Mineral Royalties from carbon dioxide, coalbed methane, condensate, gas plant products, oil, processed and unprocessed gas, and royalties associated with rents, bonuses, and other revenues. Fifty percent of royalties return to Wyoming and 50 percent are paid to the federal treasury (U.S. Minerals Management Services, http://www.mrm.mms.gov/Stats/pdfdocs/formulas.pdf). Native American royalties are not included in this estimate and therefore the receipts paid to reservations are not captured in this analysis. 3 This employment figure is from IMPLAN, whose estimates are derived from U.S. Bureau of Economic Analysis. This includes full-time, part-time, self employed, small business owners, and farm employment. The Wyoming Department of Employment figures are lower than those reported here (May, 2007 labor force estimate is 285,553), as they do not include farm employment, self-employed and small business owners (Wyoming Department of Employment Labor Trends, Volume 45, No. 7, July, 2008). The Bureau of Economic Statistics estimates that Wyoming had 85,987 self-employed (proprietor) jobs in 2006.
v

Wyoming Heritage Foundation Oil and Gas Economic Contribution Study
Oil and gas activities significantly contribute to state and local governments through royalties and tax payments. Extraction tax receipts paid to state and local governments were gathered from secondary sources for severance, ad valorem, federal and state royalty, and extraction sales and use taxes for 2007, as described in Section 7.4. In 2007, approximately $2.0 billion was paid to state and local governments in all extraction tax payments by the oil and gas industry. Oil and gas ad valorem and severance tax receipts account for 78 percent and 76 percent, respectively, of all these associated state tax payments within Wyoming. Federal and state oil and gas royalties (paid to the state of Wyoming) account for 55 percent and 65 percent of all mineral royalties paid to the state in 2007, respectively.
Drilling, completion, and recompletion investments were estimated by basin and depth of the well drilled from primary data provided by the industry in Wyoming and secondary data obtained from the Wyoming Oil and Gas Conservation Commission (WYOGCC) database. The large and broad set of primary data collected from operators and service companies (described in Section 5) indicated that expenditures per well varied considerably by basin (see Exhibit ES-3). Average capital investments were lowest in Powder River Basin, at approximately $402,000 per well, while investments in the Pinedale Anticline and Jonah fields were almost $3.9 million per well. Across the state, capital investments average $1.5 million per well, of which 45 percent remain within Wyoming, contributing to the state’s economy.
Exhibit ES-3. Drilling, Completion, Facility, and Recompletion Investments for Wyoming, by Basin (2007$)
Greater Green River and Overthrust
(less Pinedale and Jonah)
Pinedale and Jonah Fields* Bighorn Wind River Powder River
Laramie, Denver-
Cheyenne, Hanna Total
Total Investments $1,496,975,056 $2,607,664,488 $72,654,549 $277,504,668 $876,527,426 $30,734,060 $5,362,060,246
Investments that Remain within WY $696,820,537 $1,188,365,632 $35,800,476 $116,540,850 $361,806,402 $15,592,479 $2,414,926,375
State Purchase Coefficient 47% 46% 49% 42% 41% 51% 45%
Number of Wells Drilled & Completed 654
662 Drilled
449 Completed 79 102 2,180 20 3,697
Total Investments per Well $2,288,953 $3,939,070 $919,678 $2,720,634 $402,077 $1,536,703 $1,450,381
WY Investments per Well $1,065,475 $1,795,114 $453,171 $1,142,557 $165,966 $779,624 $653,212
* Pinedale Anticline and Jonah field expenditures were extrapolated separately for drilling and completion.
Exhibit ES-4 summarizes the royalty and lease payments made to homeowners and interest owners by the industry for access to private minerals and surface lands. Our analysis suggests that approximately 26 percent of these payments were made to Wyoming residents and businesses. From the regional
vi
Wyoming Heritage Foundation Oil and Gas Economic Contribution Study
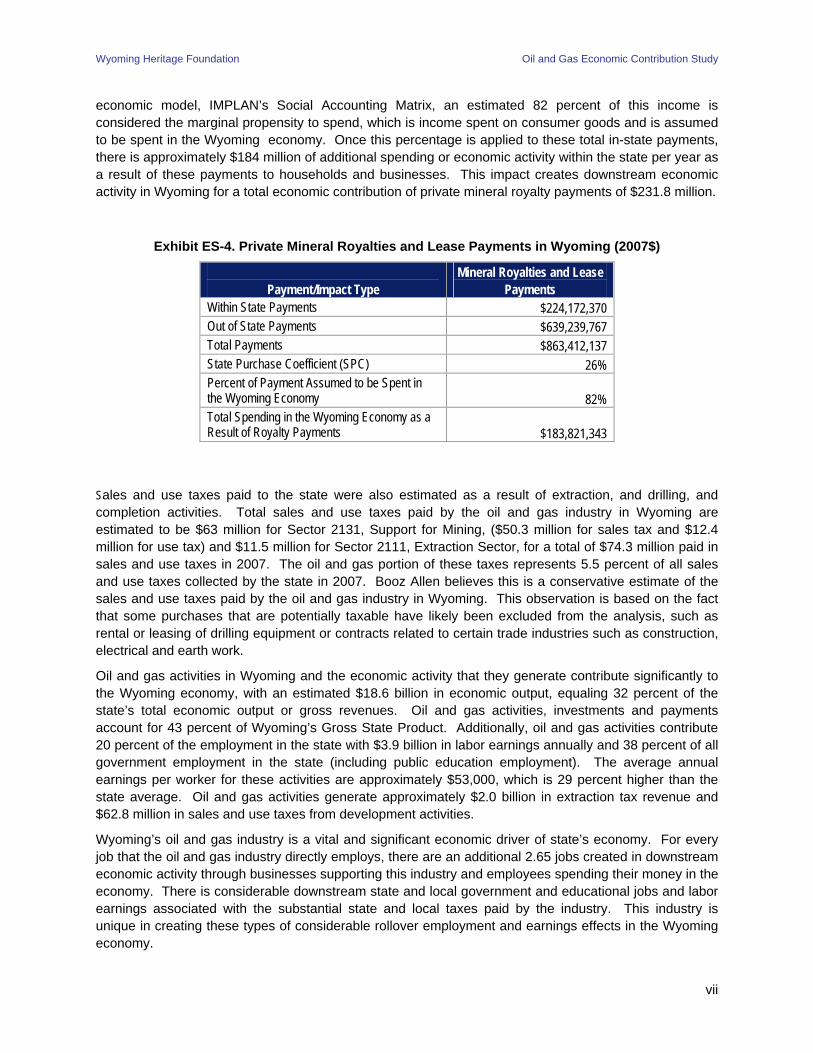
economic model, IMPLAN’s Social Accounting Matrix, an estimated 82 percent of this income is considered the marginal propensity to spend, which is income spent on consumer goods and is assumed to be spent in the Wyoming economy. Once this percentage is applied to these total in-state payments, there is approximately $184 million of additional spending or economic activity within the state per year as a result of these payments to households and businesses. This impact creates downstream economic activity in Wyoming for a total economic contribution of private mineral royalty payments of $231.8 million.
Exhibit ES-4. Private Mineral Royalties and Lease Payments in Wyoming (2007$)
Payment/Impact Type Mineral Royalties and Lease
Payments Within State Payments $224,172,370 Out of State Payments $639,239,767 Total Payments $863,412,137 State Purchase Coefficient (SPC) 26% Percent of Payment Assumed to be Spent in the Wyoming Economy 82% Total Spending in the Wyoming Economy as a Result of Royalty Payments $183,821,343
Sales and use taxes paid to the state were also estimated as a result of extraction, and drilling, and completion activities. Total sales and use taxes paid by the oil and gas industry in Wyoming are estimated to be $63 million for Sector 2131, Support for Mining, ($50.3 million for sales tax and $12.4 million for use tax) and $11.5 million for Sector 2111, Extraction Sector, for a total of $74.3 million paid in sales and use taxes in 2007. The oil and gas portion of these taxes represents 5.5 percent of all sales and use taxes collected by the state in 2007. Booz Allen believes this is a conservative estimate of the sales and use taxes paid by the oil and gas industry in Wyoming. This observation is based on the fact that some purchases that are potentially taxable have likely been excluded from the analysis, such as rental or leasing of drilling equipment or contracts related to certain trade industries such as construction, electrical and earth work.
Oil and gas activities in Wyoming and the economic activity that they generate contribute significantly to the Wyoming economy, with an estimated $18.6 billion in economic output, equaling 32 percent of the state’s total economic output or gross revenues. Oil and gas activities, investments and payments account for 43 percent of Wyoming’s Gross State Product. Additionally, oil and gas activities contribute 20 percent of the employment in the state with $3.9 billion in labor earnings annually and 38 percent of all government employment in the state (including public education employment). The average annual earnings per worker for these activities are approximately $53,000, which is 29 percent higher than the state average. Oil and gas activities generate approximately $2.0 billion in extraction tax revenue and $62.8 million in sales and use taxes from development activities.
Wyoming’s oil and gas industry is a vital and significant economic driver of state’s economy. For every job that the oil and gas industry directly employs, there are an additional 2.65 jobs created in downstream economic activity through businesses supporting this industry and employees spending their money in the economy. There is considerable downstream state and local government and educational jobs and labor earnings associated with the substantial state and local taxes paid by the industry. This industry is unique in creating these types of considerable rollover employment and earnings effects in the Wyoming economy.
vii
Wyoming Heritage Foundation Oil and Gas Economic Contribution Study
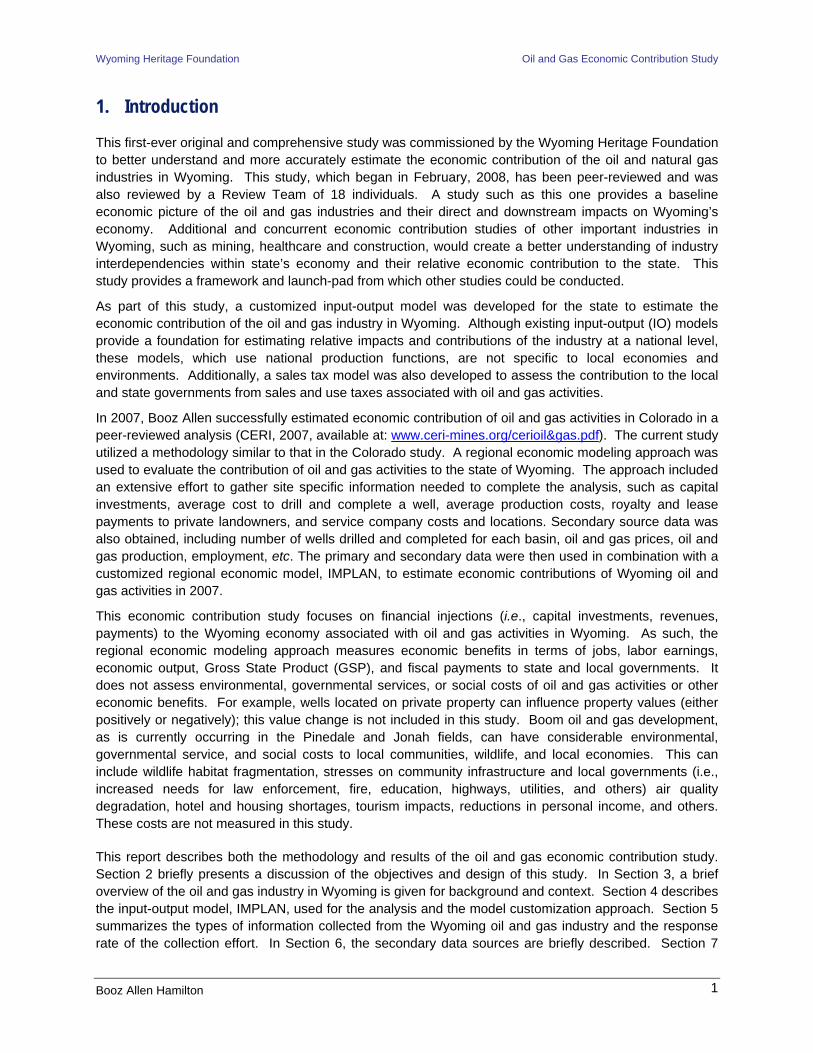
1. Introduction
This first-ever original and comprehensive study was commissioned by the Wyoming Heritage Foundation to better understand and more accurately estimate the economic contribution of the oil and natural gas industries in Wyoming. This study, which began in February, 2008, has been peer-reviewed and was also reviewed by a Review Team of 18 individuals. A study such as this one provides a baseline economic picture of the oil and gas industries and their direct and downstream impacts on Wyoming’s economy. Additional and concurrent economic contribution studies of other important industries in Wyoming, such as mining, healthcare and construction, would create a better understanding of industry interdependencies within state’s economy and their relative economic contribution to the state. This study provides a framework and launch-pad from which other studies could be conducted.
As part of this study, a customized input-output model was developed for the state to estimate the economic contribution of the oil and gas industry in Wyoming. Although existing input-output (IO) models provide a foundation for estimating relative impacts and contributions of the industry at a national level, these models, which use national production functions, are not specific to local economies and environments. Additionally, a sales tax model was also developed to assess the contribution to the local and state governments from sales and use taxes associated with oil and gas activities.
In 2007, Booz Allen successfully estimated economic contribution of oil and gas activities in Colorado in a peer-reviewed analysis (CERI, 2007, available at: www.ceri-mines.org/cerioil&gas.pdf). The current study utilized a methodology similar to that in the Colorado study. A regional economic modeling approach was used to evaluate the contribution of oil and gas activities to the state of Wyoming. The approach included an extensive effort to gather site specific information needed to complete the analysis, such as capital investments, average cost to drill and complete a well, average production costs, royalty and lease payments to private landowners, and service company costs and locations. Secondary source data was also obtained, including number of wells drilled and completed for each basin, oil and gas prices, oil and gas production, employment, etc. The primary and secondary data were then used in combination with a customized regional economic model, IMPLAN, to estimate economic contributions of Wyoming oil and gas activities in 2007.
This economic contribution study focuses on financial injections (i.e., capital investments, revenues, payments) to the Wyoming economy associated with oil and gas activities in Wyoming. As such, the regional economic modeling approach measures economic benefits in terms of jobs, labor earnings, economic output, Gross State Product (GSP), and fiscal payments to state and local governments. It does not assess environmental, governmental services, or social costs of oil and gas activities or other economic benefits. For example, wells located on private property can influence property values (either positively or negatively); this value change is not included in this study. Boom oil and gas development, as is currently occurring in the Pinedale and Jonah fields, can have considerable environmental, governmental service, and social costs to local communities, wildlife, and local economies. This can include wildlife habitat fragmentation, stresses on community infrastructure and local governments (i.e., increased needs for law enforcement, fire, education, highways, utilities, and others) air quality degradation, hotel and housing shortages, tourism impacts, reductions in personal income, and others. These costs are not measured in this study.
This report describes both the methodology and results of the oil and gas economic contribution study. Section 2 briefly presents a discussion of the objectives and design of this study. In Section 3, a brief overview of the oil and gas industry in Wyoming is given for background and context. Section 4 describes the input-output model, IMPLAN, used for the analysis and the model customization approach. Section 5 summarizes the types of information collected from the Wyoming oil and gas industry and the response rate of the collection effort. In Section 6, the secondary data sources are briefly described. Section 7
Booz Allen Hamilton 1

Wyoming Heritage Foundation Oil and Gas Economic Contribution Study
explains the methods to extrapolate the capital investments and mineral royalty payments to the state. Section 8 reports the economic contribution results, and Section 9 summarizes the relative importance of the industry. Section 10 describes the sales and use taxes analysis and results. Section 11 concludes the report.
2. Objective and Design of the Project
This project sought to estimate the total economic contribution of oil and gas activities on the state of Wyoming for the calendar year 2007. Economic contribution was defined as the direct, indirect, and induced impacts in terms of: 1) economic output (i.e., gross revenues or sales); 2) Gross State Product; 3) labor earnings; and 4) employment. These terms are defined in Section 4.1 and Appendix B.
The oil and gas industry is generally comprised of two primary activities, development and extraction. Development activities consist of drilling, completing, and recompleting wells, which are typically completed in a few of months. Recompletion activities involve restimulating or reactiviting the wells after they have been producing for a period of time. Extraction or production is the act of removing the oil or gas from the mineral formations, and it occurs continually over a longer period of time. Taxes and royalties are paid to the state on the value of the production. Royalties are also paid to the owners of the minerals from which the production occurs: state government, Federal government, or private households and businesses. All of these taxes and royalties are reported through various state sources except the ones paid to private households and businesses.
Therefore, the following oil and gas activities were analyzed to assess their economic contribution:
• Drilling, completing, and recompleting wells
• Extraction operations
• Mineral royalties and lease payments for access to private minerals
• Extraction tax payments to state and local governments.
Other capital investments, pipeline investments, and refinery impacts are not captured in this analysis.
The project design comprised four major analytic tasks:
1. Customize a regional economic impact model (IMPLAN) with local industry data, and specify the model for operations in the state of Wyoming
2. Collect information from the Wyoming industry on capital investments, production costs, and private mineral royalty payments
3. Utilize the newly specified model and the primary data to estimate 2007 economic contribution of the industry in the state
4. Develop a Fiscal Model to determine the oil and gas contribution to state and local government entities from sales and use taxes.
3. Brief Overview of Oil and Gas Industry and Activities in Wyoming
In 2007, Wyoming ranked 7th nationally in terms of crude oil production. Wyoming ranked 3th nationally for gross natural gas production and 2nd in terms of natural gas marketed production in 2006 (Energy Information Agency, Accessed 8/15/2008). The year 2007 marked the highest level of production of
Booz Allen Hamilton 2

Wyoming Heritage Foundation Oil and Gas Economic Contribution Study
natural gas (in units) in the state, with a total of 2.253 trillion cubic feet produced, on average 6.2 billion cubic feet a day (Wyoming Oil and Gas Conservation Commission (WYOGCC), May 2008). Crude oil production peaked in 1970 and has fallen until 2005. Since then it has increased, and the state produced 54 million barrels of oil in 2007 (WYOGCC).
In 2007, there were approximately 37,350 producing wells, distributed as illustrated in Exhibit 3.1. Twenty of twenty-three counties in the state produce oil and gas. Of the twenty counties in Wyoming producing crude oil and natural gas, Campbell County produced the most crude oil and Sublette County produced the most natural gas (WYOGCC). According to WYOGCC, there were 8,122 combined oil, gas and Coalbed Methane Natural Gas (CBM) Applications for Permits-to-Drill (APD) approved in 2007. In 2007, the most active county in terms of APDs was Campbell (Powder River Basin), followed by Sublette (where Pinedale Anticline and Jonah fields are located), and Sweetwater (Greater Green River Basin).
There are seven primary oil and gas basins within Wyoming: Bighorn (BHB), Denver-Cheyenne, Greater Green River (GGR), Laramie, Overthrust Belt, Powder River (PRB), and Wind River Basin (WRB). For the analysis, Pinedale Anticline and Jonah fields were removed from the Greater Green River Basin as this area has unique conditions, production, and investments.
Further description of a number of these basins is provided below:
Bighorn Basin – The Bighorn Basin is located in a remote section of Northern Wyoming, between the Yellowstone Uplands and the Bighorn Mountains. The large majority of the Bighorn Basin is public lands owned by the Bureau of Land Management (BLM), which has recently increased its oil and gas leasing in the area. With the increase in gas prices, this area has seen an increase in exploratory drilling. The area also has a wealth of wildlife.
Greater Green River Basin – The Greater Green River Basin encompasses the Bridger, Great Divide, Kindt, Washakie, Green River, and Hobak Basins. It is primarily located in the Southwestern part of Wyoming, and it extends into parts of Utah and Colorado. The basin has large amounts of oil shale and natural gas reserves. In addition to having a long history of oil and gas exploration and production, it has also experienced an increase in well drilling and oil exploration in recent years.
Powder River Basin – The Powder River Basin is in the North-central and North-eastern part of Wyoming and also extends into Montana. The Powder River Basin is most known for its coal deposits—it is the single largest source of coal mined in the United States. A substantial amount of the state’s coalbed methane is produced in this basin, 98 percent.
Wind River Basin – The Wind River Basin is located in central Wyoming. It has hydrocarbon source rocks, reservoir rocks, and hydrocarbon traps. Wind River Basin is thought to contain a significant amount of undiscovered oil, gas, and CBM resources.
Booz Allen Hamilton 3

Wyoming Heritage Foundation Oil and Gas Economic Contribution Study
Exhibit 3.1. Distribution of Producing Wells in Wyoming, 2007
Source: WYOGCC, May, 2008. Circles or dots are shown larger than would be depicted on a map; they are not are not drawn to scale.
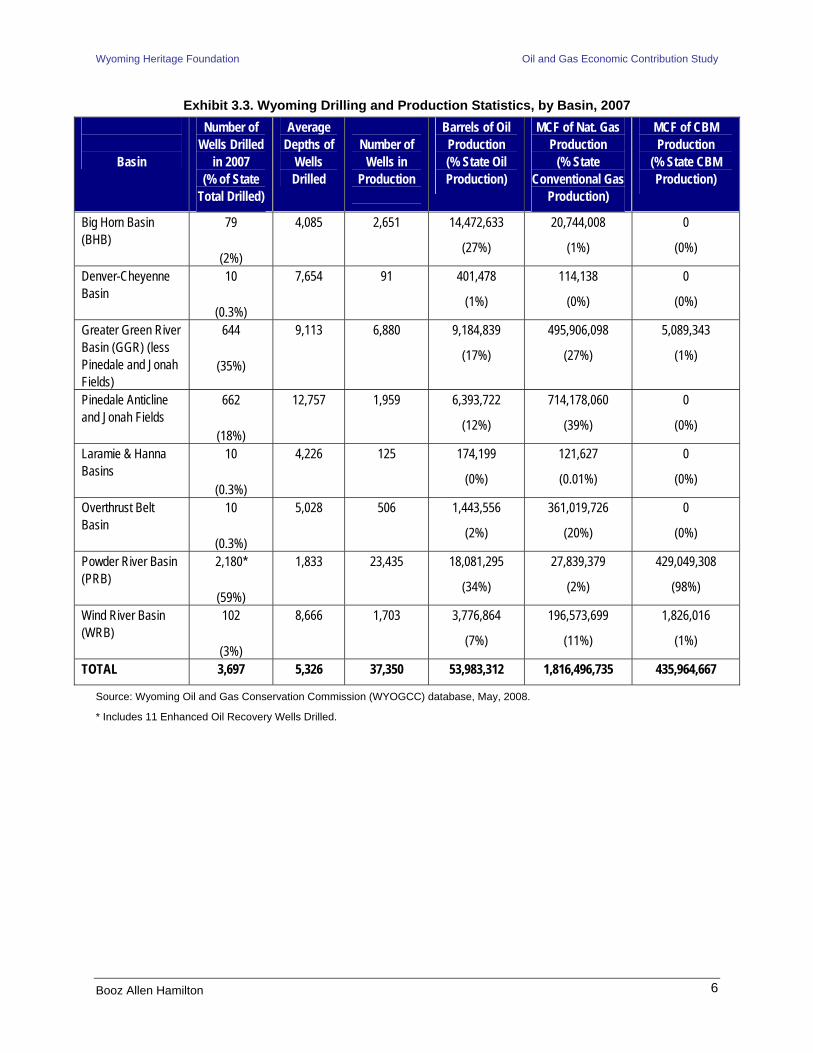
Oil and gas development across Wyoming in 2007 is depicted in Exhibit 3.2. Across the state, the Powder River Basin had the highest number of wells drilled in Wyoming (59%), followed by Greater Green River (35%), and Pinedale and Jonah fields (18%). Exhibit 3.3 summarizes both the development and production statistics by basin in Wyoming in 2007. However, the average depths of the wells drilled in Powder River are the shallowest in the state, contributing to the lesser amount of investment per well in this Basin compared to other basins. Deeper wells in Pinedale and Jonah fields and the Greater Green River Basin require significantly more investments on average.
The Powder River Basin has the highest amount of oil production (34%) and coalbed methane production (98%) in the state. Bighorn Basin is the second largest producer of oil in Wyoming, with 27% of oil production. Pinedale and Jonah fields have the highest amount of conventional gas production (39%) followed by gas production in Greater Green River Basin (27%). The magnitudes of these production differences among basins are illustrated in Exhibit 3.4.
Booz Allen Hamilton 4

Wyoming Heritage Foundation Oil and Gas Economic Contribution Study
Exhibit 3.2. Wells Drilled in Wyoming in 2007
Source: WYOGCC, May, 2008. Circles or dots are shown larger than would be depicted on a map; they are not are not drawn to scale.
Booz Allen Hamilton 5
Wyoming Heritage Foundation Oil and Gas Economic Contribution Study
Exhibit 3.3. Wyoming Drilling and Production Statistics, by Basin, 2007
Basin
Number of Wells Drilled
in 2007 (% of State
Total Drilled)
Average Depths of
Wells Drilled
Number of
Wells in Production
Barrels of Oil Production (% State Oil Production)
MCF of Nat. Gas Production
(% State Conventional Gas
Production)
MCF of CBM Production
(% State CBM Production)
Big Horn Basin (BHB)
79
(2%)
4,085 2,651 14,472,633
(27%)
20,744,008
(1%)
0
(0%)
Denver-Cheyenne Basin
10
(0.3%)
7,654 91 401,478
(1%)
114,138
(0%)
0
(0%)
Greater Green River Basin (GGR) (less Pinedale and Jonah Fields)
644
(35%)
9,113 6,880 9,184,839
(17%)
495,906,098
(27%)
5,089,343
(1%)
Pinedale Anticline and Jonah Fields
662
(18%)
12,757 1,959 6,393,722
(12%)
714,178,060
(39%)
0
(0%)
Laramie & Hanna Basins
10
(0.3%)
4,226 125 174,199
(0%)
121,627
(0.01%)
0
(0%)
Overthrust Belt Basin
10
(0.3%)
5,028 506 1,443,556
(2%)
361,019,726
(20%)
0
(0%)
Powder River Basin (PRB)
2,180*
(59%)
1,833 23,435 18,081,295
(34%)
27,839,379
(2%)
429,049,308
(98%)
Wind River Basin (WRB)
102
(3%)
8,666 1,703 3,776,864
(7%)
196,573,699
(11%)
1,826,016
(1%)
TOTAL 3,697 5,326 37,350 53,983,312 1,816,496,735 435,964,667
Source: Wyoming Oil and Gas Conservation Commission (WYOGCC) database, May, 2008.
* Includes 11 Enhanced Oil Recovery Wells Drilled.
Booz Allen Hamilton 6

Wyoming Heritage Foundation Oil and Gas Economic Contribution Study
Exhibit 3.4. Production by Basin in Wyoming, 2007
-
100,000
200,000
300,000
400,000
500,000
600,000
700,000
800,000
MM
CFE
BHB DenverCheyenne
Pinedale/Jonah GGR Hanna/Laramie Overthrust PRB WRB
Oil (MMcfe)
Gas (MMcf)
CBM (MMcf)
Booz Allen Hamilton 7

Wyoming Heritage Foundation Oil and Gas Economic Contribution Study
4. Regional Economic Modeling
Booz Allen utilized a regional economic modeling approach to evaluate the economic contribution of the oil and gas industry to the state of Wyoming. This approach included an extensive data collection effort to identify site-specific information needed to complete the economic contribution analysis. Data collected included capital investments, average costs to drill and complete a well, average production costs, royalty and lease payments to private mineral owners, and service company expenditure allocations. Secondary data was also obtained and included: the number of wells drilled and completed, recompleted, or reactivated for each basin; oil and gas prices; oil and gas production; employment levels; etc. The primary and secondary data was then used in combination with a common regional economic model to estimate economic contributions as described below.
Input-output (IO) modeling is a systematic method used to describe production and consumption sectors within a particular economy through a series of linkages among industries, households, and government.4 Booz Allen utilized the IMPLAN® economic impact model data and software system as the basic regional economic model (IO) for this analysis. IMPLAN provides certain advantages over other IO modeling systems in that study area data can be upgraded using local data and conditions to more accurately represent the industry economic profiles, providing more accurate multipliers. In addition, IMPLAN gives the user full access to the model for added flexibility, allowing numerous manipulations to be made at any time during the analysis.
For this analysis, Booz Allen initially populated IMPLAN Software Version 2.0 with 2006 data sets and structural matrices from the Minnesota IMPLAN Group (MIG). The data set included state-level Wyoming production functions for 509 industrial sectors. This off-the-shelf model was customized with both secondary and primary data specific to the oil and gas industry in the state. The following sections describe the approaches that were used to modify the parameters of the model.
4.1 Types of Economic Impacts or Economic Contribution Changes to purchases of goods and services for final consumption (final demand change) drive IO models. Each industry that produces goods and services generates demands for other goods and services. When oil and gas firms purchase supplies or services, such as construction services, drilling contracts, or well stimulation services, their suppliers must make purchases from their own suppliers and pay wages to their own employees. These secondary suppliers similarly make purchases and pay wages, generating additional economic activity. Multipliers describe these iterations (IMPLAN Manual, 2003).
Impacts or effects can be described through the following definitions.
• Direct effects are the changes in the industries to which a final demand change is made. In this case, we have direct impacts from extraction, support activities for oil and gas activities, drilling industries, wholesale trade, and construction.
• Indirect effects are the changes in inter-industry purchases as they respond to the new demands of the directly affected industries. A direct change increases economic activity for businesses that support the direct industries (i.e., geological services, trucking, power
4 See Miller and Blair (1985) for a more detailed explanation of input-output analysis.
Booz Allen Hamilton 8

Wyoming Heritage Foundation Oil and Gas Economic Contribution Study
generation, hotels and lodging, etc.), businesses supporting these suppliers, and so on up the supply chain.
• Induced effects are the increases in household income expenditures generated by the direct and indirect effects (e.g., food and beverage stores, motor vehicle dealers, healthcare, etc.).
A type SAM (Social Accounting Matrix) multiplier, as modeled by IMPLAN, is the estimated sum of the direct, indirect and induced effects, divided by the direct effect. It shows the total amount of economic activity per unit of direct economic stimulus. Multipliers close to 1.0 indicate very little additional activity beyond the direct expenditures, whereas larger multipliers indicate more indirect and induced economic activity.
In IMPLAN, SAM multipliers include all households by default, but other institutions can also be included. Institutions include households, federal government, state and local government, capital, and trade. Since the current study is a state analysis, multipliers for “state and local non-education” and “state and local education” institutions were included in the multipliers that were generated by IMPLAN. Public Education Institutions include purchases for elementary, high school, and higher education. Non-Education Institutions are for purchases for all other government activities, like state government operations, police protection and sanitation. Private education purchases are not counted here.
Since not all expenditures by the oil and gas industry and its employees will necessarily remain in Wyoming, the full volume of indirect and induced impacts will not be realized within Wyoming. These economic leakages can have considerable implications for the modeling results. To address this issue, Booz Allen collected information and created a model to estimate the fraction of these impacts that leak outside of the state for capital investments and private mineral royalty payments.
For drilling and completion activities, the oil and gas industry is purchasing from a number of industries to drill, complete and recomplete wells – these are the direct effects considered by this analysis. For the extraction industry, Booz Allen assumes that most of the oil and gas being produced is exported outside the state of Wyoming for processing; this allows the modeling of total industry sales or revenues as the direct effect.5 Royalty payments are assumed to be all induced impact as these are payments to households, which spend a proportion of those payments in the economy. Extraction tax payments are paid by industry to state and local governments; these impacts are considered to be all indirect economic contribution.
4.2 Customizing the IMPLAN Model One of the first steps in customizing the IMPLAN model involved the modification of the industry specific data and value-added components reported in the Wyoming model. Three industrial sectors within the IMPLAN framework were modified:
• Oil and Gas Extraction
• Drilling Oil and Gas Wells
• Support Activities for Oil and Gas Operations.
For these three sectors, adjustments were made to the model parameters for the following economic measures, based upon detailed primary and secondary data obtained during the study:
• Total Industry Output
5 In reality, a small portion of the product is sent to Wyoming’s four refineries.
Booz Allen Hamilton 9

Wyoming Heritage Foundation Oil and Gas Economic Contribution Study
• Earnings
• Employment
• Value Added.
The resulting study area parameters used in the model are provided in Appendix C. Since the IMPLAN data sets used had 2006 as a base year, these figures are converted to 2006 dollars. An important part of modifying the Value Added components for the extraction industry involves specifying the costs of production. Section 4.2.4 describes how this parameter was determined.
The following sections describe how the updated model parameters were derived.
4.2.1 Oil and Gas Extraction (IMPLAN Sector 19) Total Industry Output - The extraction sector’s total industry output was based on 2007 WYOGCC data on oil and gas production quantities in Wyoming. These production volumes were determined to be:
• Oil – 54,051,671 barrels
• Conventional Gas – 1,817,181,173 mcf
• CBM – 436,306,044 mcf
These quantities were converted to dollar amounts using the 2007 preliminary prices from the Wyoming Department of Revenue. The index prices for calendar year 2007 were $58.88 per barrel (Bbl) for oil and $4.65 per thousand cubic feet (Mcf) for gas (WY Department of Revenue). These prices were converted to 2006 dollars to be consistent with the IMPLAN model resulting in $56.31 per barrel of oil and $4.45 per mcf for gas. The gas price is a composite price of both conventional and coalbed methane gas. In actuality, CBM gas sells at about $1/mcf less than conventional gas. This is due to CBM’s low BTU content, which requires that approximately six percent of the volume be used for compressor fuel to move the low pressure CBM to the interstate pipelines.
The deflators used for the conversion were sector specific estimates obtained from the IMPLAN database. The deflated prices were then multiplied by the production volumes to estimate total industry output for extraction in Wyoming. Total industry output in 2006 dollars was determined to be:
• Oil -- $3,043,813,207
• Conventional Gas -- $8,081,505,125
• CBM -- $1,940,373,136
• Total -- $13,065,691,468
For natural gas, production data is assumed to include the total volume of all gas produced in Wyoming, including methane, carbon dioxide, natural gas liquids, and all other related products. For oil production, data is assumed to include the total volume of all oil produced in Wyoming including stripper, tertiary, other oil, and lease condensate (Consensus Revenue Estimating Group, Wyoming State Government Revenue Forecast: Fiscal Year 2008-Fiscal Year 2012, January 2008, Table 3).
Once the Value Added Components were modified (as described below) to zero out the Indirect Business Taxes and remove Private Mineral Royalty Payments, Total Industry Output was reduced to $10.3 million in 2006 dollars. For the extraction industry, most of the oil and gas being produced is exported outside the state of Wyoming for processing. Since there are a few refineries in the state, this is a simplifying assumption. For consistency with this model requirement, the Extraction Sector Regional Purchase
Booz Allen Hamilton 10

Wyoming Heritage Foundation Oil and Gas Economic Contribution Study
Coefficient (RPC) within the model was zeroed out. This allows the modeling of total industry sales or revenues as the direct effect.
Employment – Based on employment data from the Bureau of Labor Statistics, extraction employment was estimated to be 4,115.
Earnings – Information on the number of extraction jobs and the earnings associated with these jobs were obtained from the BLS website for Wyoming. This employment data was multiplied by the benefits-adjusted average earnings per job from BLS to estimate total earnings for the extraction sector, $402,070,349. Total earnings were then allocated between employee compensation and proprietor income based on the ratio between the two as reported in the IMPLAN model. With employment and total earnings, average earnings per job can be estimated for the extraction sector in Wyoming. Average earnings per job was adjusted to include benefits based on the 2006 national ratio of wage and salary accruals for compensation of employees for the oil and gas extraction. This ratio was obtained from the August 2007 Survey of Current Business. Average earnings were estimated to be $97,708 in 2006 dollars.
Total Value Added - Total Value Added for the extraction sector is the residual of total industry output minus the cost of production (excluding labor and indirect business taxes). The cost of production was determined to be $1.10 per mcfe. There is considerable variation in the costs of production depending on a number of factors, including the depth of the well, type of reserves, and produced fluid characteristics related to the lifecycle of a well. Generally, there are three types of costs associated with production as it is defined in the extraction sector: lifting costs; in-basin gathering, processing and treatment; and in-basin transportation costs. For the purposes of this modeling effort, these costs should exclude labor, finding and development, administrative, overhead, profit, and taxes. Many of these costs have already been accounted for as separate components in the model. These production costs are used to allocate a certain proportion of value added to final demand. Further description of the approach to estimate the cost of production is provided in 4.2.4.
The following section and section 4.2.4 describe this production cost data collection and estimation process in more detail. Other property income and indirect business taxes are the residual of total value added minus employee compensation and proprietor income. Labor earnings for the extraction sector were taken from the Bureau of Labor Statistics (BLS) for the extraction sector in Wyoming, as described above (North American Industry Classification System [NAICS] code 211). Labor earnings were allocated between the employee compensation and proprietor income based on the ratio from IMPLAN. Since the extraction taxes were being run through the model as impacts, the Indirect Business Taxes within the Value Added Components were zeroed out, so as to not double count these economic contributions. Once this model adjustment was made, this reduced the total value added and total industry output as these tax payments reduce revenues to the extraction sector.
4.2.2 Drilling Oil and Gas Wells (IMPLAN Sector 27) Employment and Earnings - Component estimates of value added for the drilling sector was based on 2006 data from BLM for the drilling sector (NAICS code 213111) in Wyoming. Information on the number of drilling jobs and the earnings associated with these jobs in 2006 was obtained from the BLS website for Wyoming. BLS estimates of drilling sector employment were adjusted to include self-employed individuals based on the ratio of total employment to wage and salary employment from the Bureau of Economic Analysis for mining support services in Wyoming in 2005. As such, drilling employment in Wyoming was estimated to be 4,047. BLS estimates of labor earnings were adjusted to include benefits based on the 2006 national ratio of wage and salary accruals to compensation of employees for the mining support activities, which was obtained from the August 2007 Survey of Current Business. The adjusted BLS estimates of employment and labor earnings were then used to estimate total earnings for
Booz Allen Hamilton 11

Wyoming Heritage Foundation Oil and Gas Economic Contribution Study
the drilling sector. Total earnings were then allocated between employee compensation and proprietor income based on the ratio between the two in the standard IMPLAN model for Wyoming.
Total Industry Output and Value Added – Total industry output was based on output per employee estimates from the 2002 Economic Census for drilling oil and gas wells in Wyoming. This ratio ($208,876 per employee in 2006 dollars) was multiplied by the adjusted employment estimates to estimate total industry output of $845 million in 2006 dollars. Total value added for drilling was estimated based on the ratio of total value added to total industry output from IMPLAN. It is estimated to be approximately $508 million. Other property income and indirect business taxes were then estimated as the residual of total value added minus employee compensation and proprietor income. This residual amount was allocated between the two components based on the ratio from IMPLAN.
4.2.3 Support Activities for Oil and Gas Operations (IMPLAN Sector 28) Employment and Earnings - Component estimates of value added for the support sector were based on 2006 data for the support sector in Wyoming (NAICS code 213111) that was obtained from the BLM website for BLS. BLS estimates of support sector employment were adjusted to include self-employed individuals based on the ratio of total employment to wage and salary employment from the Bureau of Economic Analysis for mining support services in Wyoming in 2005. Employment for the oil and gas support sector was estimated to be 9,959. BLS estimates of labor earnings was adjusted to include benefits based on the 2006 national ratio of wage and salary accruals to compensation of employees for the mining support activities, which was obtained from the August 2007 Survey of Current Business. The adjusted BLS estimates of employment and labor earnings were then used to estimate total earnings for the support sector. The total was then allocated between employee compensation and proprietor income based on the ratio between the two in IMPLAN.
Total Industry Output and Value Added – Total industry output was based on output per employee estimates from the 2002 Economic Census for oil and gas support services in Wyoming. This ratio ($138,583 per employee in 2006 dollars) was multiplied by the adjusted employment to estimate total industry output to be approximately $1.4 billion. Total value added components are based on the ratio from IMPLAN of total value added to total industry output. Other property income and indirect business taxes are estimated as the residual of total value added minus employee compensation and proprietor income. This residual amount was allocated between the two components based on the ratio from IMPLAN.
4.2.4 Production Cost Approach and Estimate Data was collected from industry in Wyoming on production costs for each basin of operation and by type of product produced, where possible. A total of 18 companies, out of 19 that provided data, were able to provide this information with the components that were required. As stated in Section 4.2.1, the production cost needed to comprise certain cost components and exclude others. The model required costs specific to the extraction sector, including lifting costs and in-basin gathering, compression treatment costs, and in-basin transportation costs. However, company labor, overhead, taxes, profits, major workovers or capital investments, and finding and development costs should not be included in the estimates as they are captured elsewhere in the model. The final production cost for the state was used to modify the Value Added components in the Extraction Sector, as described in Section 4.2.1.
Once these industry costs by basin were collected, they were all converted to a cost per mcfe if they were not provided in that format. Cost per barrel or Barrel of Oil Equivalent (BOE) were converted to mcfe by applying a factor of six. The operator costs were weighted by the percentage of the operator’s production by product to the total sample production accounted for by basin. This weighted cost was then applied to all production to determine a production cost per basin. The basin costs were weighted by basin
Booz Allen Hamilton 12

Wyoming Heritage Foundation Oil and Gas Economic Contribution Study
production volumes to estimate the production cost for all operations in the state. In general, the costs were less in Pinedale and Jonah fields and the Wind River Basin and higher in Bighorn and Powder River Basins. Overall, the average cost was estimated to be $1.10 per mcfe.
4.2.5 Trade Flows Data Version 2.0 of IMPLAN utilizes Regional Purchase Coefficients (RPCs) to represent the proportion of intermediate demands and final demands for a specific commodity that will be satisfied by local production. They are derived from a calculation encompassing production, consumption, total imports, foreign imports, and domestic imports. RPCs represent the proportion of the total supply of a good or service used to fulfill the demands of a region that is supplied by the region to itself. RPCs can be critical to the accuracy of the model.
The new version of IMPLAN not yet released incorporates a new approach to measuring RPCs: the IMPLAN National Trade Flows Model. This new approach utilizes a doubly-constrained gravity model using IMPLAN’s county-level estimates of commodity demand and supply. In general terms, the import and export flows between regions are thought to be proportional to the “mass,” “attractiveness,” or “size” of an economy and inversely proportional to the “distance” or cost of moving goods and services between them. There are three main databases used in the Trade Flows Model: the Oak Ridge National Laboratory county-to-county distances by mode of transportation, the Commodity Flows Survey ton-miles data by commodity, and the IMPLAN commodity supply and demand by county. As such, the Trade Flows RPCs have been shown to reveal much more accurate economic movement between counties and regions than the RPCs embedded in IMPLAN Version 2.
Although the new version of IMPLAN was not available, Booz Allen has obtained the new Trade Flows Microsoft Access Databases from MIG, created with new Trade Flows RPCs, and has imported them into the Wyoming model developed for this analysis. This was done by aggregating all Wyoming counties for each Wyoming-produced commodity (i.e., sector) that was shipped within Wyoming, providing a percentage of total consumption that is satisfied by Wyoming demand for the commodity. The RPC is the amount shipped within Wyoming as a percentage of total commodity demand, which is obtained from the Commodity Summary report in IMPLAN.
After the state study area value added components were adjusted, the gravity-fed Trade Flow RPCs were inputted and the multipliers were recalculated.
5. Primary Data Collection and Storage Approach
Booz Allen identified a representative sample of oil and gas industry representatives to interview. According to WYOGCC, in 2007, the top ten operators in Wyoming produced 57, 82, and 86 percent of the oil, conventional gas, and CBM gas in the state. Data collection focused on the largest operators to collect a significant amount of data and information without interviewing an exhaustive number of industry contacts.
The data collection effort also included service companies or vendors. Service companies are a major source of the oil and gas development activity across the state. Both operators and service companies were contacted initially with a phone call, and then with an email which described the project in more detail. Once the correct point of contact was located within the company, Booz Allen ensured that they received a “Data Request Document,” (see Appendix D) understood the requirements, and could provide the information within the time frame required. Often there were three (and sometimes more) points of contact within each company (e.g., drilling and completion, production, and mineral royalties). Generally, standard reporting forms such as Authority for Expenditure (AFE) for drilling and completion were
Booz Allen Hamilton 13

Wyoming Heritage Foundation Oil and Gas Economic Contribution Study
requested from the operator for an average well within the various basins of operation. Once information was received from the operators, interviews were scheduled to clarify and obtain additional information needed for the study.
Since the actual costs of the various services for drilling, completion, and production can be obtained from operators, interviews with service companies were focused on the breakdown of the revenue received from the operator (the operator’s cost) by labor, materials and equipment, overhead and administration costs. For each of these areas, Booz Allen gathered the percentage of revenues that remained within the state and identified those expenditures that moved out of the state.
5.1 Operator Data Collection 5.1.1 Approach This section describes the types of information collected on operator expenditures for exploration, development, and production of oil, natural gas, and CBM. As indicated previously, it was determined that most operators contracted much of their well drilling, completion, and recompletion work to service companies. Therefore, interview efforts were undertaken to collect data from service company representatives, which are further described in Section 5.2 and Appendix D.
Operator expenditures were separated into three categories:
• Drilling, completion, and recompletion expenditures
• Production cost
• Mineral and override royalty payments, lease and bonus payments, and surface land damages for access for private minerals.
Information was also obtained on the names and location of vendors utilized, the expenditures that were incurred within the company (versus contracted), the locations of field, district, and headquarter offices, and materials versus equipment expenses.
To simplify the data collection effort and the impact on each company, Booz Allen requested an example Authority For Expenditure (AFE) document for drilling and completing a well for each basin where exploration and development occurs. These forms were requested for a typical well in each basin of operation for 2007. Booz Allen also requested additional information, which was usually conveyed verbally in follow-up interviews, on clarifying the types of expenditures. Further, additional information was requested on the largest expenses, the names of service companies utilized and their locations, and other pertinent information. All operators were able to provide us drilling and completion information; the majority of operators were able to furnish recompletion information as well.
Recompletions occur throughout Wyoming to improve well production, before choosing the costly alternative of drilling a new well. Therefore, the corresponding cost categories for recompletion operations are similar to those for well completion and incurred to revitalize production in an aging well. Booz Allen collected operator’s information on the number of wells recompleted in 2007 or other information relevant to expenditures spent in 2007 on recompletion, restimulation, or reactivation activities.
The drilling, completion, and recompletion costs were grouped into categories that were both consistent across operators and mapped to the relevant sectors in IMPLAN. A sample of the cost categories are shown below in Exhibit 5.1.
Booz Allen Hamilton 14

Wyoming Heritage Foundation Oil and Gas Economic Contribution Study
Exhibit 5.1. Example Well Drilling & Completion Cost Categories Drilling Completion and Recompletion
Main Drill Contract Stimulation and Cementing (main contract) Earthwork Earthwork Services (e.g., insurance, permitting) Tube & Pressure inspectors Supervision (labor) Water & Transport Well Logging Complete Workover Equipment (Rig & Unit) Casing & Tubing (surface and production) Tanks & Equipment; Flowlines Downhole Equipment Roustabout Labor (Supervision, Administration) Overhead
In this way, Booz Allen was able to group Drilling, Completion, and Recompletion expenditures into four IMPLAN sectors: Drilling, Support Activities for Oil and Gas Industries, Construction, and Wholesale Trade.
Information was also requested from operators on production cost and royalty payments to private mineral owners. This included information on private mineral royalties, override royalties, payments for leases and bonuses, and surface land damages all for access to private minerals. Specific information requested on these expenditures and investments are shown in Appendix D.
5.1.2 Response Rates Booz Allen staff contacted 27 oil and gas operating companies and over 120 operator personnel with operations located in Wyoming. Of these 27 companies, Booz Allen collected information from 19, a response rate of 70 percent. The remaining 8 companies either did not responded to our calls, were not interested in participating in the study, or did not have the time to collect the information within our time frame. From the companies who have provided information, these 19 operators accounted for 63%, 70%, and 71% of the oil, conventional gas, and CBM production in the state, respectively, in 2007. This response rate seems reasonable considering the fairly onerous request for information.
5.2 Service Company Data Collection 5.2.1 Approach During interviews with Booz Allen staff for this project, operators provided information on the total expenditures incurred for services rendered as well as the names of the particular vendors and service companies regularly utilized in 2007. Booz Allen interviewed some of the larger service companies to obtain an understanding of what and where these operator expenditures and vendor revenue were allocated. Since the expenditures by operators are revenues for the service companies, the interviews with service companies targeted both the allocation of expenses among labor, materials, and administrative, and where the revenues were allocated (within Wyoming and out of Wyoming). For example, many of the materials for completing a well come from out of the state; understanding what percentage of those materials come from local sources and what percent are paid to downstream materials suppliers outside of Wyoming can have important implications for the model results.
The service company information collection was focused on two general issues: whether the service was primarily labor- or materials-based; and the location of the company, labor pool or source of material
Booz Allen Hamilton 15

Wyoming Heritage Foundation Oil and Gas Economic Contribution Study
(e.g., within or out-of-state). Once these service company allocations were determined, they were averaged to estimate the “within state” and “out-of-state” percentages for the related contracted vendor expenditures.
Vendors were targeted that provided services and materials that account for the highest percentage of total costs incurred by operators. Examples of these services are:
• Main drilling contract
• Well completion stimulation and cementing
• Well head equipment, tubing and casing
• Facilities expenditures.
The interviews with service companies were focused on the following categories and their related portion of total costs:
• Labor
• Materials, supplies, and equipment
• Overhead and administrative costs
• Margin.
For each of the above categories, information was obtained on the percentage of allocations that were incurred within and outside Wyoming. This process allowed us to obtain a general breakdown of the operator’s expenditure (and corresponding service company allocation) within the state and out-of-state.
The following example demonstrates how the service company allocations were estimated. This example will also explain how the information is utilized from service company interviews and applied to operator expenditures for the related services in the database. Exhibit 5.2 illustrates an example summary of data from a service company collected during an interview. This is an example drilling company with a local and regional office in Wyoming and corporate headquarters in Texas. This company provides a turnkey, main drilling contract service to the oil and gas operators in a given basin of operation. The percent of total allocation is applied to the in-state and out-of-state location breakdown and aggregated to determine the total percentage of the company’s revenues that stay within Wyoming (67%) and those that move outside the state (33%).
Exhibit 5.2. Example Drilling Company Location Allocation X Drilling Company – Main Drill Contract
Local and Regional Office in WY / Corporate HQ in TX Location Breakdown
(Percent of revenue amount for each category)
Category
Percent of Total Allocation
(of total revenue received) In-State Out-of-State
Labor 31.0 94 6 Materials/Supplies 42.0 70 30 Overhead/Admin 2.5 100 0 Margin 24.5 25 75
Total Cost Breakdown (Percent of total revenue received) 67.1 % 32.9%
Booz Allen Hamilton 16

Wyoming Heritage Foundation Oil and Gas Economic Contribution Study
Booz Allen received the labor, materials, and overhead/administrative categories and their corresponding allocations during interviews with service companies. Through interviews with service companies, profit was assumed to move to the location of the corporate headquarters, although some service companies do report that a small percentage did stay at the regional office. This was consistent with idea that partners and managers may receive a share of profits and the company could pay out bonuses to employees.
After collecting data from service company interviews, the next step was to determine the allocation profile for other companies in the basin providing similar services. Three location profiles were applied for each service company allocation:
• Small In-state Field Office; Regional & Corporate Headquarters out of Wyoming
• Large In-state Field Offices (may or may not include regional office); Corporate Headquarters out of Wyoming
• Field, Regional Offices, and Corporate Headquarters in Wyoming.
Information obtained in the interviews from similar companies was used to extrapolate for companies providing similar services and with similar office locations. For services on which data was not collected, such as smaller expense items (e.g., legal, surveying, etc.) secondary information was collected on whether the company was typically either more labor-based or more material-based and on the location of the offices. Then, data from similar service company allocations and locations for those with activities in multiple basins were interviewed to ascertain the differences in expenditure profiles among the basins. If there were significant differences, the service company location allocations were adjusted as needed, and additional company interviews were undertaken to accurately reflect both economic leakages and investments that remain within Wyoming and contribute to the local economy.
5.2.2 Company Selection and Response Rates Since a majority of the drilling and completion activities in Wyoming for 2007 were focused in two basins, the interviews focused on the Greater Green River Basin, Pinedale and Jonah fields, and Powder River Basin. Over 90 percent of 2007 drilling and completion activities in the state took place in one of these three areas. It was determined that most of the same companies providing services in these areas were also providing services in the other Wyoming basins, so their location allocations were applied as appropriate to other basins.
Five drilling companies provided information for the study; these companies had operations in one of the three areas, Powder River, and Green River, or the Pinedale and Jonah fields. Booz Allen also contacted an additional five drilling companies, but did not receive any data from them. When an operator reported using a drilling company from which we did not receive information, the company was researched via the internet or from information from the operator in terms of where the drilling company’s offices were located, and the appropriate office location and corresponding service company location allocation was applied.
Four major stimulation and cementing service companies were contacted, and information was received from two companies. One of the companies only participated in an “informal” interview to discuss general operations and expenditure patterns and locations regarding their Wyoming businesses. Although this interview did not provide specific numbers, it did validate the numbers captured from one major company for the stimulation and cementing expenditure allocations.
Booz Allen Hamilton 17

Wyoming Heritage Foundation Oil and Gas Economic Contribution Study
We contacted six distributors of casing, tubing, flowlines, and well head equipment, and received information from two companies, both of whom provided products to operators in the three main development areas. A fluid servicing company who provides product and services throughout Wyoming also provided data for the study. Three earthwork and construction companies were also contacted, two of which provided information regarding general allocations in their businesses.
5.3 Data Storage and Querying Approach Booz Allen developed a Microsoft Access database to incorporate both the operator and service company (vendor) data, which also provided the percentages for in-state and out-of state expenditures. This standard reporting process allowed the team to incorporate and maintain data integrity and easily perform data queries to aggregate and manipulate the data to map to the IMPLAN sectors. The database has expenditure categories that mirror those in AFE forms, as most operators provided these general types of categories. The database was developed with two electronic forms by which primary data was entered: an “Operator Well Information” form; and a “Cost” form.
The Operator Well Information form was used to enter general well capital investment information for an operator in a particular basin (or multiple basins). Generally this information was gathered directly from operating companies, but occasionally secondary sources (primarily WYOGCC database) were used to fill in the gaps that were not known by the operator (i.e., number of wells drilled, average depths of wells drilled).
The second “Cost” form provided an interface to enter and house the development expenditures. These cost categories were broken down for drilling, completion, facility, and recompletion expenditures. Each of these major categories was then further disaggregated. For example, completion comprised of a number of categories, including: casing/tubing, equipment, roustabouts, stimulation and cementing, other services, fuel, etc. The expenditures for the operators were then entered into the relevant expenditure category. If the service was contracted to a vendor, then the corresponding service company location allocation was applied to the contracted cost. If the expenditure was incurred in-house for the operator, then the operator provided a percentage breakdown (or general idea) of where the expenditure was paid. In this way, both operator and service company information was entered into the Microsoft Access database.
Queries were developed within the database that aggregate the operators’ expenditures by IMPLAN sector, displaying both within state and out-of-state expenditures. For example, the activity of drilling was broken into four categories for estimating the economic contribution in the IMPLAN model:
• Drilling Sector (#27) – includes all expenditures related directly to drilling a well (e.g., drill rig rental, mobilization, and anything related directly to the actual drilling of the well
• Construction Sector (#39) – includes all necessary expenditures to prep and reclaim a well site location (e.g., earthwork, road and pit construction, re-vegetation)
• Support Activities for the Oil and Gas Industry (Sector #28), which includes Engineering & Geology, Open Hole Logging, Drilling Water, Chemicals, etc.
• Wholesale Trade Sector (#390) – includes equipment and goods that are purchased through a wholesale distributor. An example from our study is surface casing.
Completion and recompletion activities were all assigned to either Support Activities for the Oil and Gas Industry (Sector #28) or to Wholesale Trade (#390) for the IMPLAN model.
Booz Allen Hamilton 18
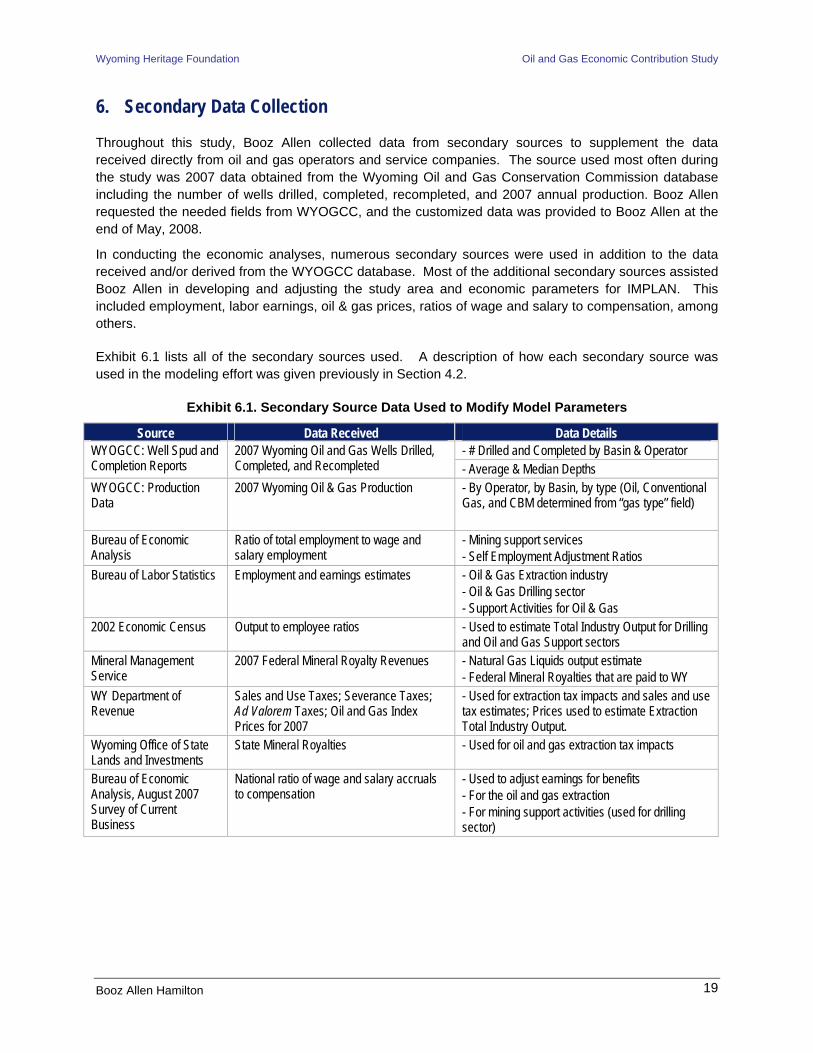
Wyoming Heritage Foundation Oil and Gas Economic Contribution Study
6. Secondary Data Collection
Throughout this study, Booz Allen collected data from secondary sources to supplement the data received directly from oil and gas operators and service companies. The source used most often during the study was 2007 data obtained from the Wyoming Oil and Gas Conservation Commission database including the number of wells drilled, completed, recompleted, and 2007 annual production. Booz Allen requested the needed fields from WYOGCC, and the customized data was provided to Booz Allen at the end of May, 2008.
In conducting the economic analyses, numerous secondary sources were used in addition to the data received and/or derived from the WYOGCC database. Most of the additional secondary sources assisted Booz Allen in developing and adjusting the study area and economic parameters for IMPLAN. This included employment, labor earnings, oil & gas prices, ratios of wage and salary to compensation, among others.
Exhibit 6.1 lists all of the secondary sources used. A description of how each secondary source was used in the modeling effort was given previously in Section 4.2.
Exhibit 6.1. Secondary Source Data Used to Modify Model Parameters
Source Data Received Data Details - # Drilled and Completed by Basin & Operator WYOGCC: Well Spud and
Completion Reports 2007 Wyoming Oil and Gas Wells Drilled, Completed, and Recompleted - Average & Median Depths
WYOGCC: Production Data
2007 Wyoming Oil & Gas Production - By Operator, by Basin, by type (Oil, Conventional Gas, and CBM determined from “gas type” field)
Bureau of Economic Analysis
Ratio of total employment to wage and salary employment
- Mining support services - Self Employment Adjustment Ratios
Bureau of Labor Statistics Employment and earnings estimates - Oil & Gas Extraction industry - Oil & Gas Drilling sector - Support Activities for Oil & Gas
2002 Economic Census Output to employee ratios - Used to estimate Total Industry Output for Drilling and Oil and Gas Support sectors
Mineral Management Service
2007 Federal Mineral Royalty Revenues - Natural Gas Liquids output estimate - Federal Mineral Royalties that are paid to WY
WY Department of Revenue
Sales and Use Taxes; Severance Taxes; Ad Valorem Taxes; Oil and Gas Index Prices for 2007
- Used for extraction tax impacts and sales and use tax estimates; Prices used to estimate Extraction Total Industry Output.
Wyoming Office of State Lands and Investments
State Mineral Royalties - Used for oil and gas extraction tax impacts
Bureau of Economic Analysis, August 2007 Survey of Current Business
National ratio of wage and salary accruals to compensation
- Used to adjust earnings for benefits - For the oil and gas extraction - For mining support activities (used for drilling sector)
Booz Allen Hamilton 19

Wyoming Heritage Foundation Oil and Gas Economic Contribution Study
7. Extrapolation Methods and Estimating the Direct Oil and Gas Impacts
This section describes the four oil and gas activities on which this study focuses to estimate the economic contribution of oil and gas activities in Wyoming. These are:
1. Drilling, completing and recompleting activities
2. Extraction operations
3. Mineral royalty payments to households and business for access to private minerals
4. Extraction taxes paid to the state and counties of Wyoming.
Other capital investments, pipeline investments, and refinery impacts have not been included in this analysis.
This section will summarize the data collected and explain the approach to utilize both the primary data from industry and the secondary data from WYOGCC to estimate state oil and gas economic contributions.
7.1 Drilling, Completion, and Recompletion Activities The economic contribution of drilling, completion, and recompletion activities was estimated using the modified IMPLAN model for Wyoming. These expenditures were inclusive of facility and surface equipment investments captured on a per well basis, where possible. Drilling and completion capital investments support many industries across Wyoming. These operator expenditures or capital investments become revenue or sales for the recipient industries providing these services (e.g., drilling, stimulating and cementing, construction, etc.). The analysis commenced with the categorization of the database housing the primary data -- drilling, completion, and recompletion capital investments -- into appropriate IMPLAN sectors, as summarized in Exhibit 7.1.
Exhibit 7.1. IMPLAN Sectors for Direct Capital Investments for Drilling, Completion, and Recompletion Activities
Type of Expenditure Title of Sector IMPLAN Sector Number Drilling Sector 26 Construction 39 Support Industries for Oil and Gas Activities 27
Drilling
Wholesale Trade 390 Support Industries for Oil and Gas Activities 27 Completion Wholesale Trade 390 Support Industries for Oil and Gas Activities 27 Recompletion Wholesale Trade 390
7.1.1 Drilling and Completion Investments Total drilling, completion, and facility investments per basin were aggregated into the relevant IMPLAN category with queries from the database. Information was entered on where the costs were incurred by both operators and service companies, which allowed an estimate from each operator of the in-state and
Booz Allen Hamilton 20

Wyoming Heritage Foundation Oil and Gas Economic Contribution Study
out-of-state costs for each IMPLAN sector category. Information obtained from service companies and vendors allowed appropriate percentages of state expenditures to be estimated and applied for each type of service or material needed for drilling, completion, and wholesale trade investments (see Section 5.2 and Appendix E for more details). This resulted in a total estimated expenditure for each itemized cost that remained within Wyoming, It also identified investments that moved out of Wyoming and do not contribute to the Wyoming economy.
After the primary data was mapped and aggregated to the various IMPLAN sectors, the expenditures needed to be estimated for the remaining drilled and completed wells in the state that were not captured by the data collection process. This extrapolation process was based on development by basin and the depth of the well drilled.
The total numbers of wells drilled as well as the depth of the various wells were obtained from the WYOGCC database (see Exhibit 3.3). After comparing the drilling (spud) and completion reports for the state and assessing the operator data, it was determined that there were few differences between the number of spuds and completions except in the Pinedale and Jonah fields. Total number of wells spudded in the state was 3,697, and total number of completions was 3,462, a difference of 235. The Pinedale and Jonah fields had 662 spuds and 449 completions, which accounts for 213 of the 235 difference.6 Therefore, it was decided that all basins would be extrapolated for drilling and completion together except the Pinedale and Jonah fields, which would require both a drilling and a completion extrapolation.
A few of the basins were combined for extrapolation purposes due to limited data collection in these areas. There were 10 wells drilled in the Overthrust basin, in which the field also reported to the Greater Green River basin. The depths appeared to be about the same as those reported by a company drilling in the western portion of the Greater Green River and so these 10 wells were included with those in the Greater Green River Basin extrapolation. In the Hanna and Denver-Cheyenne Basins, there were 16 wells drilled of which we did not obtain any information from the data collection process. These wells were determined to have similar depth distributions to those in the Laramie Basin and so these three basins were extrapolated together. There was considerable operator data from all the other basins in Wyoming: Bighorn, Wind River, Greater Green River, Powder River, and Pinedale and Jonah Fields.
The extrapolation process was implemented by mapping operator information about drilling and completing at various depths to the well depth distribution of the basin in total as reported by WYOGCC database. For example, in the Greater Green River Basin, 11 operators provided information on average costs for 12 wells drilled and completed from depths ranging from 1,500 to 13,000 feet. From assessing the operator cost/depths and the well depths of all wells drilled in the basin, it was determined that the operators costs should be mapped to the following depths: less than 3,000 feet, between 3,000 and 9,000 feet, between 9,000 and 12,000 feet, and more than 12,000 feet. Within each of these depth distributions, operator costs were weighted depending on how many wells they drilled to more accurately represent the total basin drilling and completion costs. In this way, the individual operator costs were mapped to:
1) The number of wells drilled for each operator as a percent of drilled wells reported; and
2) The total basin drilled depths.
6 In the Pinedale and Jonah fields, a number of wells were spudded and then suspended after setting the surface conductor pipe; several had to suspend completion operations because of various wildlife stipulations (Personal Communications with Don Likwartz, August 1, 2008).
Booz Allen Hamilton 21

Wyoming Heritage Foundation Oil and Gas Economic Contribution Study
This was done for each the drilling, support, and wholesale trade sectors. Earthwork and site construction expenditures for drilling were extrapolated based only on the number of wells drilled by the operator as a percent of the reported total wells drilled and were not based on depths of wells drilled.
7.1.2 Recompletion Investments Booz Allen used both primary and secondary source information to determine capital investments for recompleted or restimulated wells across Wyoming. Operating companies provided data on the number of recompleted or reactivated wells in all basins of operation and the average cost of these investments per basin.
Booz Allen also collected secondary source information from WYOGCC on all recompletions and workovers across Wyoming in 2007. This WYOGCC data was accessed by selecting “recompletion” in the "type of completion" field. This recompletion field was only added to WYOGCC data collection website last year so it may be the case that some operators are not using this new selection approach to report their recompletion activity. Booz Allen therefore used not only the recompletion field, but also restimulations, workovers, and other reactivations as provided by the WYOGCC’s database. These included the following categories:
• Types of completion, which include "recompletion", "conversion", and "convert to production"
• "Reactivation" type of completion with a spud (drill) date prior to 2006
• "New Well" type of completion, with a spud (drill) date of prior to 2006
• "Work Over" type of completion, but with a spud (drill) date of prior to 2006.
The primary and secondary data was compared. If there were more or fewer recompletions reported by operators than what were reported in the WYOGCC database, the number was adjusted based on the difference between the figures. This adjustment process was only required in Bighorn and Wind River Basins. It was determined that there were 304 recompletion, workovers, and reactivations across Wyoming in 2007. Exhibit 7.2 summarizes the recompletions by basin in Wyoming in 2007.
The average costs then needed to be extrapolated to the remaining recompletions across Wyoming. This was based on the reported number of recompletions by an operator in a basin as a percentage of the total basin recompletion sample, and then multiplied by the total number of recompletions that occurred within the basin. The total amount was then allocated between support sector expenditures (75%) and equipment and materials (25%). The within state percentages were adjusted based on the service companies that the operators were using for completion activities.
Exhibit 7.2. 2007 Well Recompletions, Workovers, and Reactivations by Basin Basin Number
Greater Green River and Overthrust 24 Pinedale and Jonah Fields 3 Wind River 13 Bighorn 104 Powder River 160 Laramie, Hanna, and Denver-Cheyenne NA Total 304
Source: WYOGCC
Booz Allen Hamilton 22

Wyoming Heritage Foundation Oil and Gas Economic Contribution Study
There were 304 recompletions across the state with an average cost of $174,616, 47 percent of which remains within Wyoming. Most of the recompletion activity occurred in Bighorn and Powder River Basin (264 recompletions).
7.2 Extraction Operations The economic contribution of oil and gas extraction (also called production) in Wyoming was analyzed directly through one of the IMPLAN sectors (Sector 19) because it is a self-contained sector which includes all economic activity associated with oil and gas extraction. This differs from the approach used for drilling, completion, and recompletion since these activities involve a number of different sectors in the IMPLAN model, as described in the previous section. The oil and gas industry also differs in that extraction represents annual operating expenses and revenues while drilling, completion, and recompletion are more of a one-time capital investment.
The economic contribution of production was based on total industry revenues or sales for the oil and gas extraction sector, which was derived from WYOGCC data on 2007 quantities of oil and gas production in Wyoming and Wyoming indexed 2007 oil and gas prices (see Exhibit 7.3). The contribution of the extraction sector was assumed to be set at 100 percent local, as all of the production is occurring in Wyoming. An estimate of the production costs is used to allocate total industry sales between the value-added component and intermediate payments for the extraction sector within the IMPLAN model as discussed in Section 4.2.4.
Exhibit 7.3. Extraction Volumes, Prices, and Revenues Product 2007
Production (mcfe)1
(A)
Price3
(2007$) Price4
(2006$)
(B)
Oil and Gas Production Revenues
(2006$)
(A x B)
Oil 324,310,0262 $9.81 $9.39 $3,043,813,207
Gas 1,817,181,173 $4.65 $4.45 $8,081,505,125
CBM 436,306,044 $4.65 $4.45 $1,940,373,136
Total 2,577,797,243 $13,065,691,468
1Source: WYOGCC; 2Oil production was 54,051,671 barrels, which was multiplied by 6 to estimate the 324,310,026 mcfe of oil; 3 Source: WY Department of Revenue; 4 Deflated with IMPLAN’s WY inflation rates for the extraction sector for 2007/2006 of 1.046.
Total industry output (i.e., oil and gas extraction revenues) for the extraction industry was reduced since model modifications to the Indirect Business Taxes within the Value Added components were zeroed out. This was required as extraction taxes were collected and run exogenously through the model. Additionally, private mineral royalty payments were also removed from the extraction revenues since they are paid with the extraction revenues; without removing these payments, they would be double counted. Exhibit 7.4 shows the reductions and the resulting extraction revenue direct impact.
Booz Allen Hamilton 23

Wyoming Heritage Foundation Oil and Gas Economic Contribution Study
Exhibit 7.4. Direct Impact -- Extraction Operations* Extraction
Revenues
(A)
Private Mineral Royalty
Payments
(B)
Extraction Taxes
(C)
Direct Impact for Extraction
(A-B-C)
2007 Dollars $13,661,277,948 $863,412,137 $1,996,024,906 $10,801,840,905
2006 Dollars $13,065,691,468 $825,770,227 $1,909,004,830 $10,330,916,411
*See Section 7.3 and Exhibit 7.5 for methodology to estimate private mineral royalty payments and extraction taxes.
IMPLAN’s inflation factor of 1.045584 was utilized.
7.3 Private Mineral Royalties and Payments As part of the data collection effort, operators across Wyoming were asked about their expenditures and payments to gain access to both minerals and surface lands from households and companies. Information was obtained on a number of expenditures, including:
• Royalties to private mineral owners
• Override royalties (e.g., finder’s fees)
• Payments for leases and bonuses
• Payments for surface land damages.
Additionally, information was collected from operators about the location of the these recipients of mineral and override royalties, surface land damages and lease and bonus payments as well as the percentage of wells or percentage of operator production that comprised private mineral ownership (i.e., fee lands).
For both private mineral and override royalties, operators were asked about the percentage of operating wells or production in the basin receiving these private royalties, and the average royalty rate typically applied to the value of production. Average 2007 prices were utilized from the WY Department of Revenue database to determine the value of production. Company and basin-wide production was also determined from the WYOGCC database. For the purposes of the extrapolation, barrels of oil were converted into mcfe by multiplying by a factor of six. For each operator, a royalty value per mcfe was determined for privately-owned mineral production, weighted by the operator production, and multiplied by total basin production to determine a total payment for mineral and override royalties. Operators also provided general information about the locations of the recipients of these payments. These percentages (both within and out of state) were weighted by operator production by basin and applied to the mineral and override royalties to obtain in-state and out-of-state payments by basin. These basin figures were aggregated to determine the state totals.
Total lease payments and bonuses for private mineral production were collected from operators, weighted by the operator production as a portion of the sample’s production, and applied to total basin production. All basins were aggregated to estimate all payments for the state. The within state percentages from the override and mineral royalty payments for the state were applied to the lease and bonus payments.
Information was also collected on surface land damages, including the percentage of wells drilled in 2007 where this payment applied, an average payment per well drilled, and the location of the recipients of these payments. These payments were calculated for the number of wells drilled, weighted based on number of wells drilled by operator, and applied to the total number of wells drilled in the basin.
Booz Allen Hamilton 24

Wyoming Heritage Foundation Oil and Gas Economic Contribution Study
Operators also provided information on on-going damage payments to surface owners for producing wells. This information was also extrapolated based on the basin, number of producing wells as a percentage of the total sample, the percentage of wells this applies to, and then was applied to total producing wells in the basin. All basins were aggregated to estimate total surface land damage payments for wells drilled and annual damage payments for producing wells for the state.
Once the in-basin totals were calculated for surface land damages, royalties and overrides, and lease payments and bonuses, they were aggregated to yield total within state payments to Wyoming households and companies for access to private minerals. To ascertain how much of this payment was spent within the state, it was necessary to determine the disposable income or amount spent (versus being saved or paid to the government) for each basin and for the state overall.
IMPLAN provides an Aggregate Social Accounting Matrix (SAM) report that identifies a matrix delineating the relationships among industries in total, commodities, value added components, households, federal and state institutions, capital, and foreign and domestic trade. The percentage of household expenditures spent on commodities, foreign, and domestic trade provides an estimate of the marginal propensity to spend. This percentage (82%) was applied to the Wyoming mineral and override royalties, damage and lease payments to provide an estimate of spending in the Wyoming economy.
The private mineral royalties are paid to both households and businesses. To simplify this approach, Booz Allen assumed that all of these payments were made to households. Therefore, we needed to determine the correct household sector to which these payments apply. IMPLAN estimates that the average income per household in Wyoming in 2006 was approximately $100,283. Since this estimate was fairly close to two household sectors ($75,000 to $100,000 and $100,000 to $150,000) and it seemed relatively high, the $75,000 to $100,000 household sector was determined to be a more reasonable household income range to utilize. Therefore, this sector was imported into IMPLAN and the marginal propensity to spend (i.e., 82%) was determined from the IMPLAN model.
7.4 Extraction Taxes Extraction taxes are also an important contributor to Wyoming’s state and local governments and its economy. These production taxes contribute to Wyoming’s economy as the governments spend this money in the state’s economy. Wyoming’s Department of Revenue collects severance, ad valorem, and sales taxes; these 2007 receipts are based on 2006 production levels.
Minerals Management Service collects royalties from production on Federal minerals. Half of all federal mineral royalties return to the state of Wyoming (U.S. Minerals Management Service, http://www.mrm.mms.gov/Stats/pdfdocs/formulas.pdf). Total oil and gas Federal royalties were over $1 billion in 2007, of which half were returned to the state of Wyoming. Royalties paid to Wyoming for production from state minerals were obtained from the Wyoming Office of State Lands and Investments (Personal Communication, Billie Hunter 6/18/2008); state royalties from oil and gas products in 2007 are approximately $90 million. Sales and use taxes paid by the Extraction Sector (Sector 2111) are collected by the Wyoming Department of Revenue and are estimated to be $11 million.
Exhibit 7.5 summarizes 2007 estimates of ad valorem, severance, and sales taxes, as well as state and federal mineral royalty payments to the state and counties of Wyoming. These extraction taxes were run through the State and Local Government Sector within the Wyoming IMPLAN model to determine the total economic contribution of these taxes to the state of Wyoming.
Booz Allen Hamilton 25

Wyoming Heritage Foundation Oil and Gas Economic Contribution Study
Exhibit 7.5. Extraction Taxes Paid by Wyoming Oil and Gas Industry (2007$) Type of Tax Tax Receipts Source
Severance Taxes $666,397,115 WY Department of Revenue Annual Report, 2007
Ad Valorem Taxes $712,637,118 WY Department of Revenue Annual Report, 2007
Federal Royalties $515,500,6462 Minerals Management Service
State Royalties $90,031,996 Wyoming Department of State Lands and
Investments
Sales Tax1 $11,458,031 WY Department of Revenue
Total $1,996,024,906 1This sales tax figures is only for the extraction industry, and not for development activities, as only extraction or production-based taxes are run through the Extraction Sector in the IMPLAN model to determine economic output, employment and labor earnings impacts. Sales and use taxes are also collected from the Support Sectors (i.e., Drilling and Support); see Section 10 for the Sales and Use Tax Analysis and Results. 2 This estimate is from the Minerals Management Service (MMS), and it includes Federal Mineral Royalties from carbon dioxide, coalbed methane, condensate, gas plant products, oil, processed and unprocessed gas, and royalties associated with rents, bonuses, and other revenues. Fifty percent of royalties return to Wyoming and 50 percent are paid to the federal treasury (U.S. Minerals Management Services, http://www.mrm.mms.gov/Stats/pdfdocs/formulas.pdf). Native American royalties are not included in this estimate, and therefore the receipts paid to reservations are not captured in this analysis.
8. Economic Contribution
Through the approach outlined in the previous section, the direct economic impacts for drilling, completion, and recompletion, private mineral royalty and lease payments, oil and gas extraction, and extraction taxes were calculated and run through the modified IMPLAN model. Other capital investments, such as for pipelines or other major infrastructure, or refining sector impacts were not included in this analysis.7 The new Trade Flows RPCs are utilized in the indirect and induced impacts that occur from this initial investment or monetary injection into the state economy. The results therefore yield direct, indirect, and induced economic contribution of these activities.
This section will initially describe how the direct economic contribution is run through the IMPLAN models. This is followed by the direct economic contribution estimates, and the results of the economic contribution analysis from IMPLAN.
7 Although pipeline investment was not included, flowline costs per well were included. This includes the costs of purchasing and installing flowlines from the well head to the pipeline. Other facility and surface production equipment was also included in these estimates. Pipeline investment for five projects by the Overthrust Pipeline Company, Overland Pass Pipeline, Fort Union Gas Gathering Company, and the Wyoming Interstate Company were estimated to be $540 million in 2007 (Personal Communication with Brian Jeffries, Executive Director of Wyoming Pipeline Authority, 8/10/2008).
Booz Allen Hamilton 26

Wyoming Heritage Foundation Oil and Gas Economic Contribution Study
8.1 Analyzing Direct Impacts through IMPLAN Model Sectors The extrapolated 2007 Wyoming capital investments were deflated to 2006 dollars using IMPLAN deflators to be consistent with the IMPLAN software, and then were run as direct impacts through the state model. The results of the IMPLAN model were then reinflated to 2007 dollars utilizing the same industry inflators for IMPLAN.
The activities of oil and gas drilling and completion require a considerable amount of material and equipment purchases from wholesale trade industries in Wyoming. As indicated in the service company section, in general, these industries acquire considerable equipment and materials from outside of Wyoming. These ‘retail’ sectors are treated differently in IMPLAN and typically have to be ‘margined’ to determine the warehouse mark-up of the merchandise. Through the assessment of the vendors supplying this equipment and materials in the service company database, Booz Allen has utilized primary data to estimate appropriate margins for these wholesale trade industries. In this way, the margins as a percentage of total expenditures have been determined through the database process, and it has not been necessary to utilize IMPLAN’s margins.
For the mineral royalties and lease payments, it was necessary to import the correct institutional sector. Although these payments are made to both businesses and households, it was assumed that the payments were all made to households. This likely provides are more conservative estimate of the downstream impacts to the state. As described in Section 7.3, it was determined that the appropriate household income sector was $75,000 to $100,000. Therefore, this household sector was imported into IMPLAN to run the analysis. These direct impacts were deflated to 2006 dollars to be consistent with the IMPLAN model; the IMPLAN results were then reinflated with IMPLAN inflation factors to report the impacts in 2007 dollars. Extraction taxes were run through the State and Local Government Institution sector in IMPLAN, sector 12001.
The economic contribution of production is based on total industry sales for the oil and gas extraction sector, less the Extraction Taxes and Private Mineral Royalty Payments. To be consistent with the IMPLAN model, the 2007 oil and gas prices were converted to 2006 dollars. An estimate of the production costs ($1.10/Mcfe) was used to allocate total industry sales between the value-added component and intermediate payments for the extraction sector. The derivation and explanation of this production cost was previously explained in Section 4.2.4. For the extraction industry, most of the oil and gas being produced is exported outside the state of Wyoming for processing; this allows the modeling of total industry sales or revenues as the direct effect. Therefore, the RPC for the extraction sector within Wyoming was set to zero.
8.2 Drilling, Completion, Recompletion Activities All basin extrapolated expenditures were aggregated across the relevant drilling, completion, and recompletion IMPLAN sectors to determine overall in-state capital investment for drilling, completion, facilities expenditures, and recompletion. Exhibit 8.1 summarizes these development investments. Overall, 45 percent of these expenditures remained within the state, while over half of these investments move outside the state. This was primarily due to a large amount of materials and equipment that come from out-of-state, including cement, casing, tubing and other materials. States where these materials were purchased include California, Oklahoma, and Texas. Overall, operators paid approximately $5.4 billion in 2007 in capital investments for drilling, completing, facility requirements, and recompletion investments. On average, it cost $1.45 million to drill and complete a well in Wyoming in 2007. However, across the basin, these costs varied significantly (see Exhibit 8.1).
Booz Allen Hamilton 27

Wyoming Heritage Foundation Oil and Gas Economic Contribution Study
Exhibit 8.1. Drilling, Completion, Facility, and Recompletion Investments for Wyoming (2007$)
Type of Investment
Drilling, Completion, and Facilities Costs
(Per Well) 3697 Wells D&C
Recompletions (Per Recompletion)
304 Recompletions
Total Drilling, Completion, and
Recompletion Investments
Investments that Stay within the State $653,212 $81,713 $2,439,767,029
Investments that Move Outside the State $797,169 $90,903 $2,974,768,404
Total Investments $1,450,381 $172,616 $5,414,535,433
Percent that Stays within the State (State Purchase Coefficient) 45% 47% 45%
Exhibit 8.2 summarizes the drilling and completion expenditures by basin in Wyoming (these do not include recompletion investments). Although there were three times the number of wells drilled in Powder River Basin than in Greater Green River or in Pinedale and Jonah fields, the total investments were almost two to three times higher in Greater Green River and Pinedale and Jonah area due to the investments needed per well. In Powder River, there were generally three different types of wells being drilled, 95 percent of which were CBM wells. The CBM wells are shallower, generally less than 3,000 feet, and on average, cost $319,000 per well. The remaining 5 percent of the wells are either oil wells or Enhanced Oil Recovery wells which are typically much deeper and more costly to drill. However, overall, the Powder River Basin comprises wells that cost on average $400,000 to drill and complete. In comparison, the Greater Green River and Pinedale and Jonah fields are requiring significantly more investment per well drilled and completed, $2.3 million and $3.9 million, respectively.
Booz Allen Hamilton 28

Wyoming Heritage Foundation Oil and Gas Economic Contribution Study
Exhibit 8.2. Drilling, Completion, and Facility Investments for Wyoming (2007$)
Greater Green River and Overthrust
(less Pinedale and Jonah)
Pinedale and Jonah Fields* Bighorn Wind River Powder River
Laramie, Denver-
Cheyenne, Hanna Total
Total Investments $1,496,975,056 $2,607,664,488 $72,654,549 $277,504,668 $876,527,426 $30,734,060 $5,362,060,246
Investments that Remain within WY $696,820,537 $1,188,365,632 $35,800,476 $116,540,850 $361,806,402 $15,592,479 $2,414,926,375
State Purchase Coefficient (SPC) 47% 46% 49% 42% 41% 51% 45%
Number of Wells Drilled & Completed 654
662 Drilled
449 Completed 79 102 2,180 20 3,697
Total Investments per Well $2,288,953 $3,939,070 $919,678 $2,720,634 $402,077 $1,536,703 $1,450,381
WY Investments per Well $1,065,475 $1,795,114 $453,171 $1,142,557 $165,966 $779,624 $653,212
* Pinedale Anticline and Jonah field expenditures were extrapolated separately for drilling and completion.
The State Purchase Coefficients (SPC) in each of the basins ranged from 41 percent to 51 percent, with the state average for all basins being 45 percent (i.e., 45 percent of these development expenditures remain within Wyoming). As mentioned previously, the out-of-state wholesale trade purchases primarily lower the SPC. There were both Wyoming and non-Wyoming drilling companies; expenditures that reduced the SPC for some of the drilling companies included non-local labor pools, capital improvements, major rig maintenance, and non-Wyoming companies to where administration, overhead and profit costs are generally allocated.
There were some notable SPC differences among the basins. Greater Green River Basin and Pinedale and Jonah fields had SPCs that were very close to the state SPC, while Wind River and Powder River Basins were lower with 42 percent and 41 percent respectively. Greater Green River and Pinedale and Jonah’s percentages represent the average state numbers since 76 percent of the state’s drilling and completion expenditures were in these two basins. In the Wind River Basin, the SPC was slightly lower due to the use of non-Wyoming-based drilling companies.
The wholesale trade expenses brought the SPC for the Powder River Basin lower than the state average. This was due to the fact that the Powder River wells cost much less to drill, although the amount of wholesale trade investments (casing, tubing, equipment) increases proportionally to overall costs, which decreased the SPC numbers in this basin compared to other basins.
Bighorn Basin’s SPC for development investments was higher than the state average, which was due in part to the more extensive use of rental equipment in this area. Rental equipment typically provides more local economic value as there is more overhead and other expenditures (i.e., trucking, fuel, storage yard/facilities, etc.) compared to wholesale trade purchases. The relatively higher SPC for Laramie,
Booz Allen Hamilton 29

Wyoming Heritage Foundation Oil and Gas Economic Contribution Study
Denver-Cheyenne, and Hanna Basins can be attributed to a very small sample size of operators that provided data and its influence on the 20 wells drilled and completed.
The within-state capital investments were run through the IMPLAN model as direct effects ($2.4 billion). According to this analysis, the capital investments in Wyoming support almost 27,000 jobs in Wyoming., 16,000 of which are in the drilling, oil and gas support industries, wholesale trade or construction. This development activity has an employment multiplier of 1.67, indicating that for each job created in drilling, support activities, wholesale trade, and construction, there is an additional 0.67 jobs created in downstream or supporting businesses. Exhibit 8.3 summarizes the economic contribution of these capital investments for the state. A total of $3.5 billion in sales or revenues was generated from this investment activity in 2007, supporting approximately 26,700 jobs and $1.5 billion in labor earnings.
Exhibit 8.3. Drilling, Completion, Facility and Recompletion Economic Contribution for Wyoming (2007$)
Type of Impact Revenue Employment Labor Earnings Earnings per Worker
Direct $2,439,767,029 15,975 $1,104,682,651 $69,151
Indirect $269,838,803 1,735 $69,005,578 $39,773
Induced $803,446,273 8,991 $284,405,440 $31,632
Total $3,513,052,106 26,701 $1,458,093,669 $54,608
Multiplier 1.44 1.67 1.32
8.3 Extraction Operations In Wyoming, total industry revenues were used to estimate the direct economic contribution of the extraction industry. As described in Section 7.2, the direct impact was determined to be $10.8 million in 2007 dollars and $10.3 million in 2006 dollars. This direct impact was run through the extraction sector in IMPLAN to estimate the total economic contribution of extraction in Wyoming, which is summarized in Exhibit 8.4.
Exhibit 8.4. 2007 Extraction Economic Contribution for Wyoming (2007$) Type of Impact Revenue Employment Labor Earnings Earnings per
Worker Direct $10,801,840,905 4,115 $420,397,957 $102,162
Indirect $772,763,456 3,667 $192,952,907 $52,619
Induced $388,957,284 3,983 $123,462,343 $30,997
Total $11,963,561,646 11,765 $736,813,207 $62,628
Multiplier 1.11 2.86 1.75
A total of $10.8 billion in total industry revenues was generated by oil and gas extraction operations and indirect and induced economic activity in Wyoming in 2007. This industry has a high employment
Booz Allen Hamilton 30

Wyoming Heritage Foundation Oil and Gas Economic Contribution Study
multiplier of 2.86. With each extraction industry job created, there are an additional 1.86 jobs created in supporting industries and through increased household spending. Extraction industry employment was 4,115 in 2007, but it supported an additional 7,650 jobs in the state. Average earnings for the extraction industry ($102,162) are significantly higher than those of other downstream industries (indirect jobs -- $52,619 and induced jobs -- $30,997).
As indicated in Section 7.2, direct extraction impacts are determined by the average indexed price of oil and gas in Wyoming multiplied by the volume of production, less Extraction Taxes and Private Mineral Royalty Payments. As such they are highly sensitive to the price of oil and gas. In 2007, gas prices were lower than they have been in the past few years due to pipeline constraints (Personal communication, Don Likwartz, WOGCC Supervisor, 7/2/08). For example, in 2006 the gas price was $5.85 per mcf, while in 2007 the price of gas was estimated to be $4.65 per mcf and the price of oil was $58.88 per barrel. The first three months of 2008 indicate that prices may be considerably higher than those in 2007 (Personal communication, Don Likwartz, WYOGCC supervisor, 7/2/08) as more pipeline capacity comes on line. Prices for the first three months averaged $7.38 per mcf for gas and $85.08 per barrel for oil.
Static Input-Output models such as IMPLAN can not assess the impacts of price changes on employment and earnings estimates. Price changes would primarily affect tax revenue receipts and profits to companies. With higher prices, the extraction industry would likely employ more people in a number of areas including: exploratory and geological engineering, seismic services, land departments, and other areas. However, these jobs and earnings increases would occur over time as operating companies invest additional funds and therefore cannot be estimated in a static model. (See Section 8.5 for a assessment of 2008 price changes on tax receipts).
8.4 Private Mineral Royalties and Payments Overall, there is a considerable amount of income paid to homeowners and interest owners to access private minerals and surface lands (see Exhibit 8.5). This is in the form of private mineral royalties, surface land damages, lease payments and bonuses, and override royalties. Twenty-six percent of these payments stay within Wyoming, in general. Overall, the marginal propensity to spend for the state is estimated to be 82 percent (IMPLAN, 2006), indicating that 82 percent of these payments are spent on consumer items. Therefore, total payments estimated to be spent in the Wyoming economy are $183.8 million.
Exhibit 8.5. Wyoming Private Mineral Royalties and Lease Payments (2007$)
Type of Impact Total Mineral Royalties and
Lease Payments Within State Payments $224,172,370 Out of State Payments $639,239,767 Total Payments $863,412,137 State Purchase Coefficient (SPC) 26% Percent of Payment Assumed to be Spent in the Wyoming Economy $183,821,343
As a result of private mineral royalty payments, households were estimated to spend $183.8 million in the Wyoming economy, which generated $45.3 million in additional economic activity for a total of $231.8 million in economic activity as summarized in Exhibit 8.6. Labor earnings were approximately $42 million in total, while earnings per worker on average were $29,300 per year. Overall these private mineral and
Booz Allen Hamilton 31

Wyoming Heritage Foundation Oil and Gas Economic Contribution Study
lease payments support 1,450 people in the state. These impacts are all considered to be induced economic contribution.
Exhibit 8.6. Economic Contribution of Private Mineral Royalties and Lease Payments for Wyoming (2007$)
Economic Activity
Employment
Labor Earnings
Earnings Per Worker Per Year
Total Economic Impact $231,827,774 1,447 $42,461,473 $29,344
8.5 Extraction Taxes Extraction taxes receipts were collected from a number of secondary sources (see Exhibit 7.5) for a total of $2.0 billion paid to state and local governments in 2007. The extraction taxes create additional economic revenue for the state as a result of payrolls, spending, etc. which includes the direct impact of almost $2.0 billion in extraction tax payments and $913 million in indirect and induced impacts of these payments rolling over in the economy, benefiting households and indirect industries. Total employment from extraction taxes in 2007 was approximately 33,300 and labor earnings from these impacts are estimated to be $1.7 billion. Exhibit 8.7 summarizes this induced economic contribution.
Exhibit 8.7. Economic Contribution of Extraction Taxes in Wyoming (2007$)
Economic Activity
Employment
Labor Earnings
Earnings Per Worker Per Year
Total Economic Impact $2,908,623,519 33,316 $1,677,264,966 $50,344
Oil and gas prices can have considerable repercussions on the fiscal receipts paid to state and local governments by the oil and gas industry. The Consensus Revenue Estimate Group (CREG) Forecast and Legislative Services Office predicted the change in revenue to the state with a unit change in price of both oil and gas. The revenue sources include severance taxes, federal mineral royalties, and the school foundation portion of ad valorem taxes. Exhibit 8.8 shows the tax receipt increases or decreases associated with a unit price change for oil and gas.
Exhibit 8.8. State and Local Tax Receipts with a Unit Price Change (2007$)
Type of Product
Price Change State and Local
Tax Receipt Increase or Decrease
Oil $1.00 per barrel $6 million
Gas $0.10 per mcf $25 million
Source: CREG Forecast and Legislative Services Office, January 2008.
According to the first three-month oil and gas prices for 2008 discussed in Section 8.3, this could equate to some significant revenue increases to the state associated with extraction tax receipts paid by the oil
Booz Allen Hamilton 32

Wyoming Heritage Foundation Oil and Gas Economic Contribution Study
and gas industry. Exhibit 8.9 shows the estimated increases in state and local government revenues associated with these price increases. These oil and gas price changes from 2007 to 2008 would yield an estimated additional $831 million in extraction taxes paid by the oil and gas industry in Wyoming.
Exhibit 8.9. State and Local Tax Receipts with a Unit Price Change (2007$)
Type of Product State and Local
Tax Receipts with Unit Price
Change1
2007 Price
2008 Price2
Price Change
2007-2008
State and Local Government
Revenue Increase
Oil $6 million
with Increase of $1/Bbl
$58.88 $85.08 $26.20 $156 million
Gas $25 million
with Increase of $0.10/mcf
$4.65 $7.38 $2.73 $675 million
Total $831 million 1CREG Forecast and Legislative Services Office, January 2008. 2 Estimate of 2008 prices from first three months of 2008, CREG.
8.6 Total Economic Contribution of All Oil and Gas Activities Aggregating over all of the economic impacts from drilling, completion, and recompletion capital investments, extraction revenues, private mineral royalties and lease payments, and extraction taxes, there is estimated to be considerable economic contribution from these combined activities. To avoid double counting these impacts, private mineral royalty payments ($863 million) and extraction taxes were removed from the extraction revenues, since these payments to households, industries and state and local government would be embedded in these extraction revenues. This allows an aggregation across economic impacts to determine total economic contribution of the industry to the state. Since private mineral royalty payments were not endogenous to the model it was not necessary to zero out the indirect business taxes for this sector. The overall economic contribution of oil and gas and the associated downstream activities in Wyoming in 2007 has been estimated and is summarized in Exhibit 8.10. This Exhibit summarizes total economic contribution, encompassing direct, indirect and induced impacts of all oil and gas activities within the state.
Overall, over 73,000 people are estimated to be employed either directly or through indirect and induced downstream activities associated with the oil and gas industry. Direct industries include extraction, drilling, support industries for oil and gas, wholesale trade, and construction. Indirect industries are additional businesses that support these direct oil and gas industries. Induced impacts are those associated with direct and indirect employees spending their money in economy. The majority of the employment impacts is associated with drilling and completion (36%) and tax payments to state and local governments (45%). As described in the following section, oil and gas extraction taxes are vital source of revenue for state and local governments, significantly contributing to government employment, labor earnings and economic activity.
Extraction operations account for the most amount of economic activity, but in terms of employment, are not as important as extraction taxes and drilling and completion activities. Total indirect and induced
Booz Allen Hamilton 33

Wyoming Heritage Foundation Oil and Gas Economic Contribution Study
impacts include the tax payments to state and local governments and the royalty and lease payments to private households and companies, creating higher multipliers due to this considerable downstream economic activity. The employment multiplier is noteworthy, estimated at 3.65, where with each job directly created by the oil and gas industry, there are an additional 2.65 jobs generated. Direct employment is 20,090, which creates an additional 53,139 jobs (see Exhibit 8.11), for a total of 73,229 jobs. Similarly, the earnings multiplier is estimated to be 2.57, which indicates that with each dollar of labor income paid to oil and gas workers, an additional $1.57 in labor earnings is generated in the state’s economy.
Exhibit 8.10. Total Economic Contribution for Oil and Gas Activities in Wyoming (2007$) Type of Impact
Drilling, Completion, and
Recompletion
Extraction
Mineral Royalty &
Lease Payments1
Extraction
Taxes2
Total Economic
Contribution
Total Economic Output $3,513,052,106 $11,963,561,646 $231,827,774 $2,908,623,519 $18,617,065,044
Employment3 26,701 11,765 1,447 33,316 73,229
Labor Earnings $1,458,093,669 $736,813,207 $42,461,473 $1,677,264,966 $3,914,633,314
Earnings per Worker $54,608 $62,628 $29,344 $50,344 $53,457
Employment Multiplier
1.67 2.86 NA NA
3.65
Earnings Multiplier
1.32
1.75 NA NA
2.57
* These figures encompass direct, indirect, and induced economic impacts. 1 These payments to households and companies are treated as all secondary induced impacts; that is, these payments are considered income of which a portion is spent in the economy. 2 These tax payments to state and local governments are treated as all secondary indirect impacts; that is, these payments are considered downstream beneficiaries of oil and gas activities.
Oil and gas activities contribute to the economic well-being of many other industries within the state of Wyoming. Exhibit 8.11 and Exhibit 8.13 summarize the industries that benefit through employment and labor earnings from all the oil and gas activities within the state in 2007. Only 27 percent of the employment is estimated to be direct employment associated with oil and gas, wholesale trade, and construction jobs, and the remaining 73 percent is estimated to be indirect and induced employment.
Our estimates suggest that almost 34 percent or 25,149 of the employment associated with these activities is government employment, including federal, state and local government jobs. According to the Wyoming IMPLAN model (estimates derived from U.S. Bureau of Economic Analysis), total state government employment in 2006 was 66,204 (See Appendix C, Sectors 495-506). Oil and gas activities therefore comprise approximately 38 percent of government employment in the state.
Approximately 25 percent of the employment is specific to the mining sector, which encompasses oil and gas industries, followed by 7 percent in retail trade, 5 percent in health care and social services, and 5 percent in accommodations and food services. Of the 18,001 mining sector jobs, all but 20 jobs or
Booz Allen Hamilton 34

Wyoming Heritage Foundation Oil and Gas Economic Contribution Study
17,982 are specific to oil and gas industry. These oil and gas industry jobs are summarized in Exhibit 8.12.
Exhibit 8.11. 2007 Employment Impacts by Industry Associated with All Oil and Gas Activities
IMPLAN Sector
Direct Employment
Downstream Employment (i.e.,
Induced and Indirect) Total
Employment
Percent of Total Oil and Gas
Employment Public Administration/Government 0 25,149 25,149 34.3%
Mining (includes Oil and Gas) 17,146 855 18,001 24.6%
Retail Trade 0 4,893 4,893 6.7%
Health Care & Social Assistance 0 3,801 3,801 5.2%
Accommodations & Food Service 0 3,548 3,548 4.8%
Other Services (except public administration) 1,768 887 2,654 3.6%
Wholesale Trade 0 2,748 2,748 3.8%
Professional & Technical Services 0 2,086 2,086 2.8%
Administrative & Waste Services 0 1,582 1,582 2.2%
Construction 1177 543 1,720 2.3%
Transportation & Warehousing 0 1,430 1,430 2.0%
Finance & Insurance 0 1,388 1,388 1.9%
Real Estate & Rental & Leasing 0 1,218 1,218 1.7%
Arts, Entertainment, & Recreation 0 828 828 1.1%
Information 0 528 528 0.7%
Manufacturing 0 409 409 0.6%
Private Educational Services 0 375 375 0.5%
Utilities 0 377 377 0.5%
Management of Companies & Enterprises 0 313 313 0.4%
Agriculture/Forestry/Fishing/Hunting 0 181 181 0.2%
Totals 20,090 53,139 73,229 100.0%
Booz Allen Hamilton 35
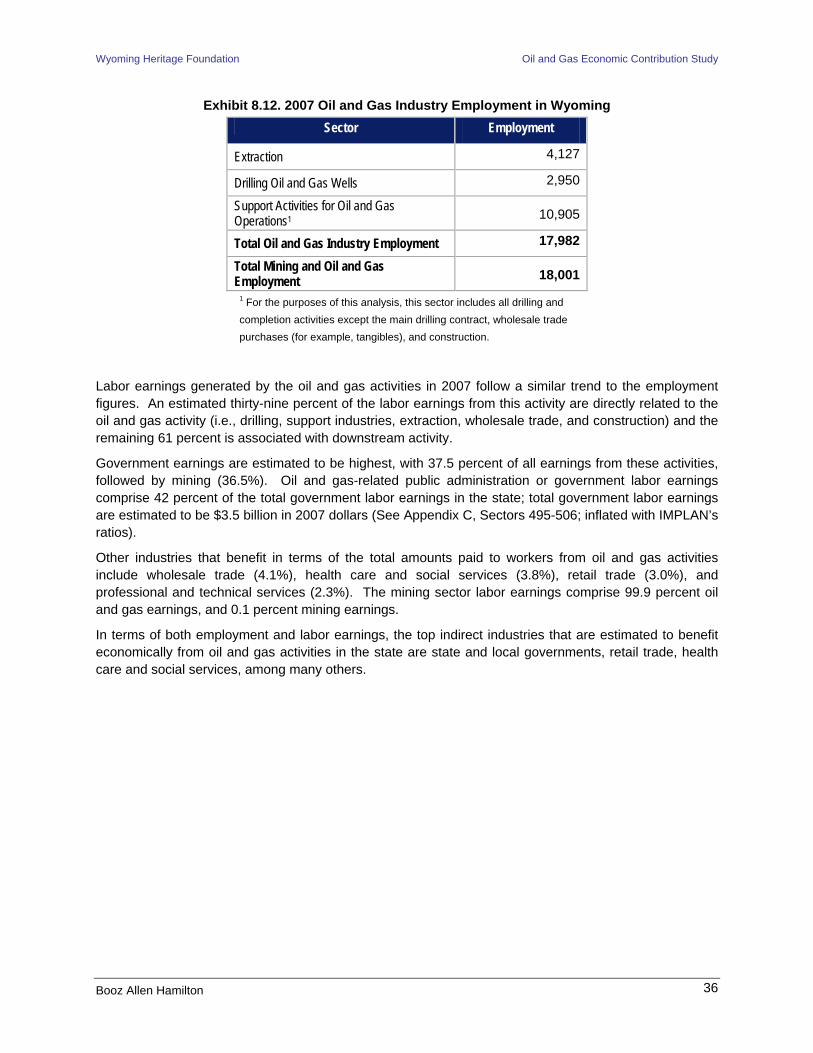
Wyoming Heritage Foundation Oil and Gas Economic Contribution Study
Exhibit 8.12. 2007 Oil and Gas Industry Employment in Wyoming Sector Employment
Extraction 4,127
Drilling Oil and Gas Wells 2,950
Support Activities for Oil and Gas Operations1 10,905
Total Oil and Gas Industry Employment 17,982
Total Mining and Oil and Gas Employment 18,001
1 For the purposes of this analysis, this sector includes all drilling and completion activities except the main drilling contract, wholesale trade purchases (for example, tangibles), and construction.
Labor earnings generated by the oil and gas activities in 2007 follow a similar trend to the employment figures. An estimated thirty-nine percent of the labor earnings from this activity are directly related to the oil and gas activity (i.e., drilling, support industries, extraction, wholesale trade, and construction) and the remaining 61 percent is associated with downstream activity.
Government earnings are estimated to be highest, with 37.5 percent of all earnings from these activities, followed by mining (36.5%). Oil and gas-related public administration or government labor earnings comprise 42 percent of the total government labor earnings in the state; total government labor earnings are estimated to be $3.5 billion in 2007 dollars (See Appendix C, Sectors 495-506; inflated with IMPLAN’s ratios).
Other industries that benefit in terms of the total amounts paid to workers from oil and gas activities include wholesale trade (4.1%), health care and social services (3.8%), retail trade (3.0%), and professional and technical services (2.3%). The mining sector labor earnings comprise 99.9 percent oil and gas earnings, and 0.1 percent mining earnings.
In terms of both employment and labor earnings, the top indirect industries that are estimated to benefit economically from oil and gas activities in the state are state and local governments, retail trade, health care and social services, among many others.
Booz Allen Hamilton 36

Wyoming Heritage Foundation Oil and Gas Economic Contribution Study
Exhibit 8.13. Labor Earnings Impacts by Industry Associated with All Oil and Gas Activities (2007$)
IMPLAN Sector
Direct Labor Earnings
Downstream Labor Earnings (i.e., induced and
indirect) Total
Labor Earnings
Percent of Total Oil and Gas Labor
Earnings Public Administration/Government $0 $1,469,170,391 $1,469,170,391 37.5%
Mining (includes Oil and Gas) $1,367,226,287 $62,294,535 $1,429,520,822 36.5%
Wholesale Trade $106,668,471 $53,508,809 $160,177,280 4.1%
Health Care & Social Assistance $0 $147,534,019 $147,534,019 3.8%
Retail Trade $0 $119,347,080 $119,347,080 3.0%
Professional & Technical Services $0 $89,428,251 $89,428,251 2.3%
Construction $55,745,280 $25,388,703 $81,133,983 2.1%
Finance & Insurance $0 $51,523,086 $51,523,086 1.3%
Real Estate & Rental & Leasing $0 $39,489,572 $39,489,572 1.0%
Transportation & Warehousing $0 $58,529,555 $58,529,555 1.5%
Other Services (except public administration) $0 $44,629,435 $44,629,430 1.1%
Accommodations & Food Service $0 $56,627,522 $56,627,522 1.4%
Administrative & Waste Services $0 $33,091,985 $33,091,985 0.8%
Utilities $0 $35,921,343 $35,921,343 0.9%
Management of Companies & Enterprises $0 $27,300,570 $27,300,570 0.7%
Information $0 $21,375,380 $21,375,380 0.5%
Arts, Entertainment, & Recreation $0 $19,824,371 $19,824,371 0.5%
Private Educational Services $0 $6,892,840 $6,892,840 0.2%
Manufacturing $0 $20,087,307 $20,087,307 0.5%
Agriculture/Forestry/Fishing/Hunting $0 $3,028,528 $3,028,528 0.1%
Totals $1,529,640,037 $2,384,993,282 $3,914,633,314 100.0%
Booz Allen Hamilton 37
Wyoming Heritage Foundation Oil and Gas Economic Contribution Study
9. Relative Importance of Wyoming’s Oil and Gas Activities
Wyoming’s oil and gas activities are vitally important to the state of Wyoming. This section will compare the Wyoming oil and gas economic indictors with those of the state, the Wyoming travel industry, and oil and gas activities in Colorado in 2005.
9.1 Relative Importance of Oil and Gas Industries in the State of Wyoming Exhibit 9.1 summarizes some of our model’s estimates of the economic indicators for the oil and gas industry in Wyoming and compares these indicators to state totals. Oil and gas activities within the state account for an estimated 32 percent of the state’s total economic output (or total sales or revenues), 20 percent of employment, 38 percent of government employment, and over 25 percent of total earnings. Estimated oil and gas value added represents almost 43 percent of gross state product (GSP)8 in Wyoming.
In general, oil and gas activities, including private mineral royalty payments and extraction taxes and the associated downstream activity, generate estimated average earnings that are considerably higher than the state average, $53,000 or 28 percent higher than the state average. However, considering only those industry sectors directly impacted by drilling, completion, and extraction activities, the average earnings are estimated to be $75,912 annually, in 2007 dollars. Although not all the jobs and income are directly associated with the oil and gas industry, without these activities in the state, these downstream jobs and associated earnings would not exist.
8 Gross State Product measures the value-added of all goods and services in the state. Value-Added is defined as economic output (or gross sales or revenues) less intermediate inputs, which are goods and services purchased in the production process (or input or operational expenses). GSP is the state counterpart of Gross Domestic Product for the nation (Downey, 2006).
Booz Allen Hamilton 38

Wyoming Heritage Foundation Oil and Gas Economic Contribution Study
Exhibit 9.1. Oil and Gas Industry Activity as a Fraction of the State’s Economy (2007$)
Indicator All Oil and Gas Activities in Wyoming
All Economic Activity in Wyoming
Percent of Oil and Gas
to State
Source
Total Economic Output $18,617,065,044 $58,831,050,621 31.6% IMPLAN 2006
Total Employment 73,229 369,5653 19.8% IMPLAN 2006
Total Labor Earnings $3,914,633,314 $15,487,363,835 25.3% IMPLAN 2006
Average Earnings $53,457 $41,907 127.6% IMPLAN 2006 Gross State Product (i.e., Value Added) $13,329,075,050 $31,205,616,410 42.7% IMPLAN 2006
Severance Tax $666,397,115 $882,383,479 75.5%
WY Department of Revenue Annual Report
2007 Mineral Ad Valorem Levies (i.e., Property Taxes)
$712,637,118 $913,011,683 78.1% WY Department of
Revenue Annual Report 2007
Assessed Valuation (Taxable Value)1 $11,303,378,284 $21,491,267,438 52.6%
WY Department of Revenue Annual Report
2007 Federal Mineral Royalties (WY Disbursements, 50%)2
$515,500,646 $931,394,926 55.3% Minerals Management Service, 2007
State Mineral Royalties $90,031,996 $138,201,502 65.1%
Wyoming Office of State Lands and
Investments 2007 Sales and Use Taxes
$50,344,215 $906,973,329 5.5% Wyoming Depart of
Revenue Annual Report 2007
1 The assessed valuation, severance taxes, and ad valorem taxes are based on 2006 production. Severance and ad valorem taxes are paid to the state in 2007. 2 This estimate is from the Minerals Management Service (MMS), and it includes Federal Mineral Royalties from carbon dioxide, coalbed methane, condensate, gas plant products, oil, processed and unprocessed gas, and royalties associated with rents, bonuses, and other revenues. Fifty percent of royalties return to Wyoming and 50 percent are paid to the federal treasury (U.S. Minerals Management Services, http://www.mrm.mms.gov/Stats/pdfdocs/formulas.pdf). Native American royalties are not included in this estimate and therefore the receipts paid to reservations are not captured in this analysis. 3 This employment figure is from IMPLAN, whose estimates are derived from U.S. Bureau of Economic Analysis. This includes full-time, part-time, self employed, small business owners, and farm employment. The Wyoming Department of Employment figures are lower than those reported here (May, 2007 labor force estimate is 285,553), as they do not include farm employment, self-employed and small business owners (Wyoming Department of Employment Labor Trends, Volume 45, No. 7, July, 2008). The Bureau of Economic Statistics estimates that Wyoming had 85,987 self-employed (proprietor) jobs in 2006.
Severance taxes from oil and gas activities comprise almost 76 percent of all severance taxes collected by the state and 78 percent of all mineral ad valorem (i.e., mineral property) taxes. Oil and gas taxable valuation from production activities accounts for 53 percent of all assessed valuation within the state. Oil
Booz Allen Hamilton 39
Wyoming Heritage Foundation Oil and Gas Economic Contribution Study
and gas revenues provide for 55 percent of all Federal mineral royalties dispersed to the state and 65 percent of all state mineral royalties. The oil and gas industry is a vital Wyoming industry that contributes significant revenue to state, local, and federal governments, with considerable industry revenues, employment, labor earnings, average earnings and state and local fiscal contributions. See Section 8.5 for a discussion in increased state and government revenue (i.e., extraction taxes) associated with oil and gas price increases.
9.2 Oil and Gas Industry Compared to the Travel Industry in Wyoming The travel industry in Wyoming is another integral part of the state’s economy, as are many other industries in Wyoming. The tourism industry has seen steady growth for a number of years; 2007 visitation in Yellowstone National Park was at the highest levels ever, up almost 10 percent from 2006 levels (U.S. National Park Service, 2008). The travel industry, through the Wyoming Division of Tourism, has been assessing its economic benefits in Wyoming through studies undertaken by Dean Runyan and Associates, which utilizes similar input-output modeling approaches. It is the only industry that has consistently assessed its economic contributions and for this reason, the most recent Travel Industry study is further described below, and the figures are compared with those of the oil and gas industry. A study on the economic impacts of Agriculture in Wyoming was done 17 years ago in 1991, and therefore its figures are quite dated and are not described here. Studies regarding the economic benefits of wildlife and hunting/fishing also have been undertaken but are not examined here.
Additional studies of other important industries in Wyoming, such as mining, healthcare, construction, and agriculture, would create a better understanding of industry interdependencies within state’s economy and their relative economic contributions to the state. Ideally, a series of concurrent and comprehensive studies assessing five to seven key Wyoming industries would be a valuable informational tool for state policy-makers. Such a series of state-funded studies could be done every five to ten years.
Travel and oil and gas industries are very different, which should be noted in their comparison. Generally the oil and gas extraction industry is an exporting and goods-producing industry, while tourism or travel industry, as a service-provider, imports visitors to the state. Oil and gas requires considerable investment and returns considerable revenues, while the tourism industry requires lower investments and has more moderate returns. Oil and gas extraction is considered to be a consumptive or depleting use of natural resources, while tourism and travel are thought to be generally sustainable or non-consumptive in their use of natural resources.
Dean Runyan and Associates finished a study in 2007, Economic Impact of Travel on Wyoming 1997-2006 (herein referred to as Travel Industry Report). This Travel Industry Report estimates the impacts of both leisure and business travel on the state of Wyoming. Oil and gas business travel is likely embedded in the Travel Industry Report figures, and therefore tourism or leisure travel figures are somewhat lower than those reflected in Exhibit 9.2.
Exhibit 9.2 summarizes some of the major economic indicators for both the oil and gas and travel industries in Wyoming, which are provided in 2007 dollars. Therefore, the Travel Industry Report figures have been inflated with IMPLAN’s inflation factors to represent 2007 dollars. The oil and gas revenue, employment, and earnings impacts and multipliers are summarized to both include and exclude the impacts of the tax receipts to state and local governments. The Travel Industry Report estimates travel industry tax revenues, but does not include these fiscal impacts in terms of employment, labor earnings, and revenues. To be consistent with this analysis, economic contribution of tax receipts have been removed from the figures.
Booz Allen Hamilton 40

Wyoming Heritage Foundation Oil and Gas Economic Contribution Study
Exhibit 9.2. Economic Comparison of Oil and Gas and Travel Activities in Wyoming (2007$)
1 Source: Dean Runyan Associates, Economic Impact of Travel on Wyoming 1997-2006, September, 2007. 2 The travel industry state and local tax revenues include lodging, sales, use, and gasoline taxes and do not include property taxes. The oil and gas tax payments include ad valorem, severance, extraction sales taxes, federal and state royalties, but do not include development sales and use taxes, lodging, or gasoline taxes. The oil and gas tax receipts figure was deflated with IMPLAN’s ratios for this institutional sector for reporting in 2006 dollars.
Oil and Gas Activities
Ratio of Oil and Gas Industry to Travel Industry Economic Indicator Travel Activities1
Excluding Tax Impacts
Including Tax Impacts
Excluding Tax Impacts
Including Tax Impacts
Direct Revenue Impacts $2,601,751,748 $13,425,429,277 $15,421,454,183 516% 593%
Total Employment 43,430 39,913 73,229 92% 169%
Total Earnings $1,054,083,793 $2,237,368,349 $3,914,633,314 212% 371%
Gross State Product (i.e., value added) $933,484,517 $11,184,440,523 $13,329,075,050 1198% 1428%
Average Employee Earnings $24,271 $56,056 $53,457 231% 220%
Employment Multiplier 1.45 1.99 3.65 137% 251%
Earnings Multiplier 1.65 1.47 2.57 89% 156%
State and Local Tax Payments2 $106,595,239 $1,996,024,906 1873%
Activities related to the oil and gas industry generate approximately five times as many direct industry revenues as those generated by the travel industry, although the travel industry comprises about 3,500 more jobs than the oil and gas industry. However, if tax payment contribution is included with the employment indicators, the oil and gas activities account for considerably more annual jobs than those of the travel industry. Labor earnings for the travel industry are about half those of the oil and gas industry without tax impacts included; with tax impacts included, the oil and gas activities account for almost four times those of the travel industry. The average earnings per worker for the oil and gas industry are more than twice those of the travel industry. Gross state product figures for the oil and gas activities are from 12 to 15 times those of the travel industry. Oil and gas tax payments to state and local governments are almost 19 times higher than those of the travel industry.
In Wyoming, oil and gas, mining, agriculture, and tourism are generally considered the most important economic drivers in the state. However, there are other important and growing industries, such as health care, construction, telecommunications, and others, that should be further evaluated to better understand their value, industry independence, and growth over time in the Wyoming economy. A study on the economic contribution of government payrolls, purchases and spending within Wyoming would also provide insightful information for policy-makers.
Booz Allen Hamilton 41

Wyoming Heritage Foundation Oil and Gas Economic Contribution Study
9.3 Wyoming and Colorado Oil and Gas Activities A similar study was undertaken for oil and gas activities in Colorado in 2005.9 Exhibit ES 1-1 in the Colorado report is represented below in Exhibit 9.3, with a couple of changes. All revenues, earnings and average earnings have been inflated to 2007 dollars for comparison with those of Wyoming. IMPLAN factors for the two-year adjustment, 2005 to 2007 were used for both the revenues or economic contribution (1.13) and labor earnings (1.04). The Colorado employment has not been changed and therefore reflects 2005 employment. All employment and labor earnings associated with mineral royalty and lease payments and extraction taxes are assumed to be downstream, either indirect (taxes) or induced (royalty payments), as consistent with the analysis in this report; therefore, the employment multiplier for all activities has been modified to reflect this adjustment.
Exhibit 9.3. Total Economic Contribution for Oil and Gas Activities in Colorado in 2005 (2007$) Type of Impact Drilling,
Completion, and Recompletion
Extraction Mineral Royalty & Lease
Payments
Extraction Taxes
Total Economic Contribution
Total Economic Output
$2,476,710,893 $21,307,460,524 $1,021,852,168 $1,203,773,627 $26,009,797,212
Total Employment 19,307 32,471 7,257 11,744 70,779
Total Labor Earnings
$1,161,294,251 $2,484,957,581 $278,222,501 $568,673,410 $4,493,147,743
Earnings per Worker
$60,149 $76,529 $38,339 $48,422 $63,481
Employment Multiplier
2.01 5.63 NA NA 4.54
1 CO’s revenues and labor earnings inflated with IMPLAN’s (2006) inflation factors.
Exhibit 9.3 can be compared to Exhibit 8.10 summarizing the economic contribution of Wyoming’s oil and gas activities. A few of these figures are directly compared in the Exhibit summarized below (Exhibit 9.4). Colorado’s economy is much larger than Wyoming’s economy; in terms of economic output (or gross revenues or sales), Colorado had over seven times more economic output than Wyoming in 2007.
Colorado’s oil and gas-related employment is slightly smaller than that of Wyoming, with 71,000 employed in Colorado and over 73,000 employed in Wyoming, yet total labor earnings in Wyoming are approximately $600 million less due to the lower average earnings in Wyoming. Earnings per worker are approximately $10,000 less in Wyoming than in Colorado.
However, when compared to the state’s economy, it is apparent how important oil and gas is to Wyoming. In Wyoming, oil and gas activities comprise 32 percent of economic output or gross revenues (6% in Colorado), 20 percent of all employment (2% in Colorado), and 25 percent of all labor earnings (3% in Colorado). The oil and gas contribution to GSP in Wyoming is 43 percent of the state’s GSP, while in Colorado, it only accounts for 7 percent of the GSP.
9 The Colorado Oil and Gas Economic Impact study is available at: www.ceri-mines.org/publications.
Booz Allen Hamilton 42

Wyoming Heritage Foundation Oil and Gas Economic Contribution Study
Exhibit 9.4. Comparison of Wyoming and Colorado Economic Indicators (2007$)
Indicator All Oil & Gas Activities in Wyoming
Percentage of Oil and Gas to
Wyoming State Total
All Oil & Gas Activities in Colorado2
Percentage of Oil and Gas to Colorado
State Total
Total Economic Output1 $18,617,065,044 31.6% $26,009,797,212 6.1%
Total Employment 73,229 19.8% 70,779 2.2%
Total Earnings1 $3,914,633,314 25.3% $4,493,147,743 3.2%
Average Earnings $53,457 $41,9073 $63,481 $48,0733
Gross State Product $13,329,075,050 42.7% $17,764,844,651 7.1%
Assessed Valuation $11,303,378,284 52.6% $7,223,758,012 7.2% 1 CO’s revenues and labor earnings inflated with IMPLAN’s (2006) inflation factors. 2 Source for Colorado’s figures is Colorado Energy Research Institute, Oil and Gas Economic Impact Study, June, 2007, Report 2007-1. 3These are average earnings for the associated states.
Exhibit 9.5 illustrates the breakdown in Wyoming and employment associated with these activities. In Wyoming, extraction taxes comprise the bulk of the employment (45%) compared to 17 percent in Colorado. This is likely due to the differences in tax payments between the two states. In Colorado, there was approximately $718 million (see Exhibit 3-7 in CERI report) paid in extraction taxes, while in Wyoming the extraction industry paid $2.0 billion. In 2005, assessed valuation was $5 billion in Colorado (see Exhibit 2-47 in CERI report), which was based on much higher 2005 oil and gas prices, $59.93 and $7.39, respectively. In Wyoming, the oil and gas assessed valuation was $11 billion based on relatively lower prices in 2007 of $58.88 and $4.65 for oil and gas respectively. Obviously, the oil and gas production in Wyoming in 2007 (2.8 billion mcfe) was much higher than that in Colorado in 2005 (1.3 billion mcfe), more than twice as much.
Mineral royalty payments to private mineral owners are higher in Colorado (10%) than in Wyoming (2%), likely due to the larger proportion of federal lands in Wyoming. According to one source, there was 35 percent federal land ownership in Colorado versus 48 percent in Wyoming in 1993 (www.colorado.edu/libraries/govpub/fedlands.htm). Federal mineral ownership is likely an even higher percentage. Extraction industry employment is much higher in Colorado (46%) than in Wyoming (16%). The Denver area comprises considerable extraction employment, as this area supports both Colorado extraction but also extraction operations across the Rocky Mountain West.
Booz Allen Hamilton 43

Wyoming Heritage Foundation Oil and Gas Economic Contribution Study
Exhibit 9.5. Oil and Gas Employment by Activity in Colorado and Wyoming
Wyoming Employment
Drilling, Completion, and
Recompletion 36%
Extraction16%
Private Mineral Royalty Payments
2%
Extraction Taxes46%
Colorado Employment
Drilling, Completion, and
Recompletion27%
Extraction46%
Mineral Royalty & Lease Payments
10%
Extraction Taxes17%
The extraction employment multiplier for Colorado is 5.63, while in Wyoming, it is 2.86. This is likely due to the larger and more diversified Colorado economy, which, as a result, is able to retain the dollars generated by oil and gas extraction sector, influencing the employment multiplier. Overall, the oil and gas employment multipliers are much higher than other industries, 4.54 in Colorado, and 3.65 in Wyoming (see Exhibit 9.6).
Booz Allen Hamilton 44

Wyoming Heritage Foundation Oil and Gas Economic Contribution Study
Exhibit 9.6. Colorado and Wyoming Employment and Labor Earnings Multipliers Employment Labor Earnings (2007$)
Type of Impact Colorado Wyoming Colorado Wyoming1
Direct 15,601 20,090 $1,838,704,678 $1,529,640,037
Total (Direct, Indirect, and Induced) 70,779 73,229 $4,493,147,743 $3,914,633,314
Multiplier 4.54 3.65 2.44 2.56 1 CO’s labor earnings inflated with IMPLAN’s (2006) inflation factors.
There was higher drilling and completion activities in Wyoming (3,697 wells drilled) than there were in Colorado in 2005 (2,570), resulting in 37 and 27 percent of the employment in Wyoming and Colorado respectively. Overall, there were $5.4 billion in capital investments in Wyoming (compared to $2.4 billion in Colorado), with approximately 45 percent (in Colorado it was 50%) remaining within the state. The lower SPC in Wyoming is likely due to the fact that Denver supports much of the operations in both states, increasing the Colorado percentage. Investments per well in Wyoming were $1.45 million (2007$), while in Colorado they were $816,000 (2005$). One reason for this difference is that Booz Allen included facility and surface equipment costs in average capital investments where possible in Wyoming, while these costs were only captured in Colorado if they were included in the Authority for Expenditure form.
Exhibit 9.7 summarizes some of the fiscal contributions to state and local governments for both the states. For consistency with this report, the tax receipts have been obtained for 2007 in Colorado based on the source cited in the Exhibit, and therefore do not coincide with those figures identified in the CERI report. All tax payments to state and local governments in Wyoming are higher than those in Colorado, severance taxes and Federal Mineral royalties are over five times higher. Wyoming oil and gas assessed valuation is one and a half times that in Colorado, consistent with higher production in Wyoming.
Exhibit 9.7. Comparison of Colorado and Wyoming’s Fiscal Contributions (2007$)
Indicator
All Oil & Gas Activities in Wyoming
(% of state total)
All Oil & Gas Activities in
Colorado
(% of state total)
Percent of WY to those of Colorado’s
Source for CO’s Figures
Severance Tax
$666,397,115
(75.5%)
$126,244,455
(88.7%) 527.9% CO Department of Revenue,
2007 Annual Report
Assessed Valuation (Taxable Value)1
$11,303,378,284
(52.6%)
$7,223,758,000
(7.2%) 156.5% CO Department of Local
Affairs, 2007 Annual Report
Federal Mineral Royalties (WY Disbursements, 50%)
$515,500,646
(55.3%)
$98,775,127
(76.5%) 521.9% Minerals Management
Service 2007
State Mineral Royalties $90,031,996
(65.1%)
$24,727,282
(59.8%) 364.1% CO State Lands Department
Booz Allen Hamilton 45
Wyoming Heritage Foundation Oil and Gas Economic Contribution Study
10. Fiscal Analysis: Estimate of Sales Taxes
Wyoming State Statute W.S. 39-15-103(a)(i)(K) imposes a sales and use tax on oil and gas services.10 The statute requires that taxes be imposed on the sales price paid for all services needed for real or tangible property within an oil or gas well site. These taxes are distributed to either the counties or the state. Taxes are imposed on all services throughout the productive life of a well and include those performed at the wellbore to any point within a 250 foot radius. Sales taxes are applied to purchases of tangible property and services that occur within the state while use taxes are applied to out of state purchases of tangible property. The state of Wyoming does offer a sales tax credit to tax payers if they also pay sales taxes on tangible property that is purchased out of state. This credit is applied to relevant sales tax liability due to the state of Wyoming.
A distinction is made by the state of Wyoming between two phases of a productive well including: 1) pre-production phase and 2) production casing phase. Typical activities included in the pre-production phase include seismographic and geophysical services, well site development (e.g. earth work, digging of reserve pits), rigging up, drilling, coring, logging and testing. All these services are considered part of the pre-production phase and are therefore not subject to a sales tax. Note that sales or leases of tangible personal property used or consumed during the pre-production phase is taxable. This includes the purchase, lease or rental of items such as:
• Casing or cement • Rigs • Drilling Fluids
The production casing phase begins with the setting and cementing of production casing.11 Services within the second phase are considered those that are required for the production of any oil and gas. All services needed during the second phase of a well (production casing phase) are taxable under Wyoming State Statues. Types of services during this phase that are subject to sales tax include:
• Labor associated with site maintenance (mowing, weed control, trash hauling) and reclamation • Services related to the measurement of gas flows and gas sampling • Cathodic well protection systems • Testing of lines, tanks and flow systems • Installing or replacing equipment or parts
The state of Wyoming’s Department of Revenue publishes monthly reports summarizing the sales taxes collected by industry and county throughout the state as part of their Sales and Use Tax Distribution Reports.12 The series includes reports titled Minor Industry Code, by month/year, which breaks down the 10 State of Wyoming, Department of Revenue, Excise Tax Division, “Excise Tax Division, Tax Pub #5 – Oil, Conventional Natural Gas & Coal Bed Methane,” January 30, 2004. 11 For open hole completions, the production casing phase begins upon reaching total depth or the completion of the under-reaming. 12 The Sales and Use Distribution Reports can be accessed at http://revenue.state.wy.us/PortalVBVS/DesktopDefault.aspx?tabindex=3&tabid=10.
Booz Allen Hamilton 46

Wyoming Heritage Foundation Oil and Gas Economic Contribution Study
sales taxes collected for industries defined by the four digit codes defined by North American Industry Classification System (NAICS). Discussions with personnel from the Wyoming Department of Revenue indicated that sales taxes earned from activities associated with oil and gas occur within the following sectors:
• 2111 – Oil and Gas Extraction • 2131 – Support Activities for Mining
According to NAICS definitions, both sectors include activities to develop and operate oil and gas wells on a contract or fee basis. Sector 2131 can also include other “mining” activities such as contract services to support the mining (coal and non-metallic minerals) and quarrying of mineral resources (excluding site preparation and related construction activities).13
Sales and use tax data for each of the counties in Wyoming for all months during 2007 were downloaded from the Wyoming Department of Revenue and are summarized for sectors 2111 and 2131 in Exhibit 10.1. The state reported that these two sectors generated over $148 million in sales tax revenue during calendar year 2007.
Exhibit 10.1. 2007 Total Annual Sales and Use Taxes
for Sectors 2111 and 2131
Sector Annual Sales Tax
2111: Extraction $11,458,031
2131: Support of Mining $136,905,194
Total $148,363,225
The sales and use taxes earned within these two sectors for each of the basins in Wyoming was estimated as summarized in Exhibit 10.2.
13 NAICS codes and definitions can be viewed at http://www.census.gov/naics/2007/index.html.
Booz Allen Hamilton 47

Wyoming Heritage Foundation Oil and Gas Economic Contribution Study
Exhibit 10.2. 2007 Sales and Use Tax Estimates for Sectors 2111 and 2131
Basin
County
Sales and Use Tax for 2007
(Sector 2111)
Sales and Use Tax for 2007
(Sector 2131)
Bighorn Basin
Park $1,196,814 $1,189,673
Big Horn $34,747 $457,571
Hot Springs $382,008 $765,993
Total $1,613,570 $2,413,237
Laramie, Hanna, Denver-Cheyenne
Albany $6,170 $142,311
Laramie $15,191 $474,435
Goshen $552 $28,060
Platte $133 $26,658
Total $22,045 $671,464
Greater Green River/Overthrust
Sweetwater $2,147,288 $31,684,798
Lincoln $652,242 $3,146,467
Uintah $46,826 $1,767,571
Carbon $834,096 $10,825,168
Total $3,680,452 $47,424,003
Pinedale Anticline and Jonah
Sublette $3,123,584 $35,962,241
Total $3,123,584 $35,962,241
Wind River
Fremont $640,832 $6,509,763
Natrona* $13,855 $4,869,101
Washakie $20,995 $868,966
Total $675,682 $12,247,829
Powder River
Sheridan $28,142 $4,736,553
Campbell $2,162,981 $19,936,301
Johnson $20,153 $4,846,343
Booz Allen Hamilton 48

Wyoming Heritage Foundation Oil and Gas Economic Contribution Study
Converse $60,022 $2,242,641
Niobrara $45,089 $541,051
Weston -$5,703 $583,364
Crook $14,400 $353,125
Natrona* $13,855 $4,869,101
Total $2,338,938 $38,108,480
No Basin
Teton $18,438 $77,916
Total $18,438 $77,916
State Total $11,472,709 $136,905,171
*Sales taxes for Natrona were divided evenly between Wind River and Powder River Basins.
The percentage of total sales and use taxes by sector for each basin is summarized in Exhibit 10.3 with Greater Green River/Overthrust, Pinedale/Jonah and Powder River generating a significant percentage of total sales taxes for these two sectors throughout the state.
Exhibit 10.3. Percentage of Sales and Use Taxes by Basin Industry
Basin 2111 2131
Big Horn Basin 14.08% 1.76%
Laramie, Hanna, Denver-Cheyenne 0.19% 0.49%
Greater Green River and Overthrust 32.12% 34.64%
Pinedale and Jonah 27.26% 26.27%
Wind River 5.90% 8.95%
Powder River 20.41% 27.84%
Further analysis of sales and use taxes associated Sector 2131 was undertaken to determine how much of these taxes are due to activities directly associated with oil and gas activities. For Sector 2111, an assumption was made that all sales and use taxes associated with this sector were due to oil and gas activities. This is based on the NAICS code definitions which only include extraction and support services for oil and gas activities. This is not the case with Sector 2131 which, according to the NAICS codes, includes other mining activities.
Booz Allen Hamilton 49

Wyoming Heritage Foundation Oil and Gas Economic Contribution Study
Utilizing data collected through economic contribution study, it is possible to apply the average sales and use tax rates to those portions of the drilling and completion investments to which these taxes apply. Booz Allen first determined an average sales tax rate for each of the basins as shown in Exhibit 10.4. The figures were determined by averaging tax rates across the counties included in each basin.
Exhibit 10.4. Estimated Average Sales and Use Tax Rates for Basins within Wyoming Basin Average Sales Tax Rates
Bighorn Basin 0.05
Laramie, Hanna, Denver-Cheyenne 0.0556
Greater Green River/Overthrust 0.0525
Pinedale/Jonah 0.04
Wind River 0.045
Powder River 0.055
State of Wyoming 0.050
Source: Wyoming Department of Revenue, Sales/Use Tax Rates by Locality, Effective 4-1-07 (http://revenue.state.wy.us/PortalVBVS/uploads/MASTERTAXRATECHART_4-1-07_Final.pdf)
The average sales tax rates were used in conjunction with drilling and completion costs as discussed in Sections 7.1 and 8.2. Exhibit 10.5 provides a summary of these costs estimates by basin and the state of Wyoming. Note that expenses specified as main drilling contract, support of drilling activities and earth work have been excluded from total drilling and completion costs due to the stipulation in the Wyoming State Statutes that sales tax rates will not be applied to services provided in the “pre-production” phase of the development of oil and gas wells. The services included in these three categories are more associated with drilling a well than completing the well. The fourth drilling category, wholesale trade, was included in this analysis as it is considered tangible private property which is taxable under the Wyoming State Statutes. Only Wyoming expenditures are included below to estimate sales taxes on these state purchases and services.
The average sales tax rates were applied to the remaining expenditures, shown in row three of Exhibit 10.5. which provided an estimate of sales tax revenue for completion and wholesale trade as summarized in the last row. Sales tax revenues range from $248,000 in the Laramie, Denver-Cheyenne and Hanna Basins to $19 million in Pinedale and Jonah fields (which is Sublette County). When applying an average sales tax rate to the applicable drilling and support industry costs for the state of Wyoming, the total estimate sales tax was estimated to be over $50 million. This is slightly higher than the sum of all the basins ($47 million). The difference is likely due to the different sales tax averages used for the different basins and the state.
Booz Allen Hamilton 50

Wyoming Heritage Foundation Oil and Gas Economic Contribution Study
Exhibit 10.5. Sales Tax Estimates by Basin for Wyoming Oil and Gas Activities
Cost Categories
Greater Green River & Overthrust
Pinedale and Jonah Bighorn Wind River Powder
River
Laramie, Denver-
Cheyenne, Hanna
WYOMING
In State Drilling and Completion $701,672,727 $1,188,859,663 $49,346,008 $119,004,117 $365,292,035 $15,592,479 $2,439,767,029
Total In State Drill Rig, Drilling Support and Earth Work
$460,863,949 $713,555,781 $18,347,564 $62,063,661 $176,696,409 $11,118,833 $1,442,646,196
Total Estimated Taxable Expenses $240,808,778 $475,303,882 $30,998,443 $56,940,456 $188,595,626 $4,473,647 $997,120,833
Average Sales Tax Rate (Basin) 0.057 0.04 0.05 0.045 0.055 0.056 0.050
Estimated Sales Tax $13,726,100 $19,012,155 $1,549,922 $2,562,320 $10,431,695 $248,846 $50,344,215
As stated earlier in this section, the state of Wyoming also collects use tax on out of state purchases of tangible property. At this point, it has been difficult to estimate use taxes using data collected in the economic contribution study. This is due to the complexity of the use tax application which also involves the award of credits for sales taxes paid out of state, and the uncertainty of how the state is actually applying this tax to relevant purchases. For instance, according to the data collected in the economic contribution study, oil and gas vendors operating in Wyoming during 2007 incurred $1.26 billion in out of state wholesale trade purchases associated with materials and equipment needed in the drilling and completion of wells (Exhibit 8.1 and Exhibit 8.2). If all of these expenditures were liable to the use tax, estimated taxes would exceed $63 million, utilizing the average use tax rate of 5 percent.
However, in 2007, the state of Wyoming reported that use taxes from Sector 2131 were $12.4 million. Given the high level of out of state purchases made by the oil and gas industry that may be taxable, Booz Allen assumed that all of the $12.4 million in use taxes for Sector 2131 are due to oil and gas activities. There is uncertainly around this figure due to the above mentioned tax credits and state implementation and enforcement.
Total sales and use taxes paid by the oil and gas industry in Wyoming are estimated to be $62.8 million for sector 2131 (Support for Mining Sector) ($50.3 million for sales tax and $12.4 million for use tax) and $11.5 million for sector 2111 (Extraction Sector), for a total of $74.3 million paid in sales and use taxes in 2007. The total estimated sales and use tax for Wyoming represents 50 percent of the total sales and use tax estimate ($148 million) for Sector 2131 and 2111 for 2007 as reported by the state of Wyoming. These sales and use taxes paid by the oil and gas industry comprise 5.5 percent of all sales and use taxes collected by the state.
Booz Allen believes these figures are conservative estimates of the sales and use taxes paid by the oil and gas industry in Wyoming. This observation is based on the fact that some purchases that are taxable have likely been excluded from the analysis. For instance, the Wyoming Statues state that the “purchase, rental or lease” of drill rigs is a taxable expense. This expense would likely be included in the category called Drilling Rig Expenses which have been excluded from the portion of expenditures that is taxable. Determining the portion of drilling company expenses that are the purchase, rental or lease of drill rigs could not be undertaken. It is also likely that these purchases or rental fees are going to out-of-state
Booz Allen Hamilton 51

Wyoming Heritage Foundation Oil and Gas Economic Contribution Study
providers. In addition, it is also possible that other purchases being made by oil and gas operators or service companies are not being accounted in either Sector 2111 or 2131. Examples include services related to construction and earth work contracts that may be credited to other industries.
Booz Allen Hamilton 52

Wyoming Heritage Foundation Oil and Gas Economic Contribution Study
11. Conclusion
The oil and gas industry in Wyoming significantly contributes to the Wyoming economy. This study estimates that oil and gas activities contribute:
• $18.6 billion in economic output or 32 percent of total economic activity in the state
• 43 percent of Wyoming’s Gross State Product
• 73,229 total employment or 20 percent of the employment in the state
• 25,149 oil and gas-related government employment, 38 percent of all government employment in the state
• $3.9 billion in labor earnings annually or 25 percent of the state’s total labor earnings
• Average annual earnings per worker for these activities are $53,000, which is 28 percent higher than the state average
• $2.0 billion in extraction tax revenue and over $62.8 million in sales and use taxes from development activities.
Wyoming’s oil and gas industry is a vital and significant economic driver of state’s economy. For every job that the oil and gas industry directly employs, there are an additional 2.65 jobs created in downstream economic activity through businesses supporting this industry and employees spending their money in the economy. There is considerable downstream state and local government and educational jobs and labor earnings associated with the substantial state and local taxes paid by the industry. This industry is unique in creating these types of considerable rollover employment and earnings effects in the Wyoming economy.
Additional studies of other important industries in Wyoming, such as mining, healthcare, construction, and agriculture, are vital to create a better and more comprehensive understanding of industry interdependencies within state’s economy and their evolving relative economic contributions to the state. Ideally, a series of concurrent and comprehensive studies assessing five to seven key Wyoming industries would be a valuable informational tool for state policy-makers. Such state-funded studies would ideally be conducted every five to ten years.
Booz Allen Hamilton 53

Wyoming Heritage Foundation Oil and Gas Economic Contribution Study
Appendix A: Acronyms
AFE Authority for Expenditure APD Applications for Permits to Drill B Billion Bbl Barrel BEA Bureau of Economic Analysis BLS Bureau of Labor Statistics CBM Coalbed Methane DOE Department of Energy DOR Department of Revenue EIA Energy Information Agency GSP Gross State Product IMPLAN Impact Analysis for Planning IO Input-Output LOE Lease Operating Expenses NAICS North American Industry Classification System M Million Mcf Thousand cubic feet Mcfe Million cubic feet equivalent MIG Minnesota IMPLAN Group RPC Regional Purchase Coefficient MMS Minerals Management Service SAM Social accounting matrix SPC State Purchase Coefficient WYOGCC Wyoming Oil & Gas Conservation Commission
Booz Allen Hamilton 54
Wyoming Heritage Foundation Oil and Gas Economic Contribution Study
Appendix B: Glossary
Direct Impact The set of expenditures or revenues as a result of activity in the geographic location of the basin, which are run through the IMPLAN model as the direct effect.
Disposable Income The amount of income left to an individual after taxes have been paid available for spending and personal savings. It is also known as take-home pay.
Economic Output Economic Output or Total Industry Output is the value of production by industry for a given time period. Output can be measured either by total value of purchases by intermediate and final consumers, or by intermediate outlays plus value-added. Output can also be thought of as a value of sales plus or minus inventory.
Employment The work in which one is engaged; an occupation by which a person earns income. The percentage or number of people gainfully employed.
Final Demand Consist of purchases of goods and services for final consumption as opposed to an intermediate purchase where the good will be further remanufactured.
Gross State Product GSP, also know as value added, is equal to its gross industry output (i.e., sales or receipts and other operating income, commodity taxes, and inventory change) minus its intermediate inputs (i.e., consumption of goods and services purchased from other US industries or imported).
IMPLAN A software program that estimates input-output (IO) models using data and assumptions to social accounts and multipliers for various scenarios and economics impacts.
Indirect Impact The inter-industry impact of IO analysis that measures the economic activity associated with the directly impacted industries selling and purchasing goods and services to/from other industries.
Induced Impact The effects of increased consumer spending resulting from direct and indirect income changes.
Industries The collection of businesses in an economy within a given region purchasing good and services and paying workers.
Inflation/Deflation The rate at which the general level of prices for goods and services is rising or falling, causing purchasing power to fall or rise. Inflation/deflation rates can be applied to create an assessment of constant dollars across different time periods.
In-State Investment These are operator’s expenditures or investments that are incurred or paid within the state.
Institution Institutions refer to the type of final demand sector. An institution can be any industry, households, federal or state government.
Investment An asset or item that is purchased with the intent of generating income or future appreciation. The purchase of goods that are not consumed today but are used to create future wealth.
Input-Output (IO) Analysis An economic model that allows the assessment of change in overall economic activity as a result of some corresponding change in one or several activities.
Labor Earnings Represents all forms of employment earnings. In IO analysis, it is the sum of employee compensation and proprietor income (income from self-employed people).
Margins Represents the difference between producer and purchaser prices in a retail environment.
Multiplier A factor that quantifies the change in total economic activity as compared to the injection of capital investments or revenues which originally fueled the growth. The SAM multiplier is estimated as a sum of the direct, indirect, and induced effects, divided by the direct effect.
Out-of-State Investment Capital investments that are either made outside or move outside the state of Wyoming.
Booz Allen Hamilton 55

Wyoming Heritage Foundation Oil and Gas Economic Contribution Study
Production Function The relationship between the output of a good and the inputs required to produce that good for any given industry.
Revenues The amount of money that an entity receives during a given time period. The “top line” or “gross income” figure from which costs are subtracted to determine net income. In input-output analysis, industry revenues are also considered total industry output or industry sales.
Regional Purchase Coefficients (RPC)
Ratios representing the portion of regional production used to satisfy local demand.
Social Accounting Matrices (SAMs)
A set of regional economic accounts which describe transfers between institutions, as well as value added components.
State Purchase Coefficients The percentage of the total investments or expenditures that remain or are incurred within the State, which also includes investments within the multi-county basin.
Value-Added Components Payments made by industry to workers, which also includes interest, profits and indirect business taxes. In IMPLAN, value added components consist of employee compensation, proprietary income, other property type income, and indirect business taxes. Value-added is an estimate of Gross State or Regional Product.
Booz Allen Hamilton 56

Wyoming Heritage Foundation Oil and Gas Economic Contribution Study
Appendix C: IMPLAN Study Area Data (Oil and Gas Sectors: 19, 27, and 28)
Booz Allen Hamilton 57

Wyoming Heritage Foundation Oil and Gas Economic Contribution Study
Booz Allen Hamilton 58

Wyoming Heritage Foundation Oil and Gas Economic Contribution Study
Booz Allen Hamilton 59

Wyoming Heritage Foundation Oil and Gas Economic Contribution Study
Booz Allen Hamilton 60

Wyoming Heritage Foundation Oil and Gas Economic Contribution Study
Booz Allen Hamilton 61

Wyoming Heritage Foundation Oil and Gas Economic Contribution Study
Booz Allen Hamilton 62

Wyoming Heritage Foundation Oil and Gas Economic Contribution Study
Booz Allen Hamilton 63

Wyoming Heritage Foundation Oil and Gas Economic Contribution Study
Booz Allen Hamilton 64

Wyoming Heritage Foundation Oil and Gas Economic Contribution Study
Booz Allen Hamilton 65

Wyoming Heritage Foundation Oil and Gas Economic Contribution Study
Booz Allen Hamilton 66

Wyoming Heritage Foundation Oil and Gas Economic Contribution Study
Appendix D: Wyoming Oil and Gas Operators Data Collection Documents
A number of documents were submitted to industry contacts in order to facilitate communication. This includes:
• A letter of introduction to the project (Exhibit D-1)
• Confidentiality Measures (Exhibit D-2)
• Data request document (Exhibit D-3)
• Supporting letter from the Petroleum Association of Wyoming (Exhibit D-4)
Booz Allen met with Wyoming Heritage Foundation representatives to obtain an initial list of industry contacts. The contacts were prioritized and contacted by phone. A follow-up email was then sent to each contact with additional project information. The letter of introduction, shown in Exhibit D-1 was designed to provide general information regarding the project. This letter of introduction was sent to all contacts and some general information regarding the types of information that was needed from operators. This included: drilling, completion, and recompletion expenditures (AFE forms); and production expenditures (often obtained through LOE forms); private mineral and override royalties, lease Payments, surface Damages – payments for access to the minerals and surface lands.
Once the appropriate contact was made at the company, the data request document (Exhibit E-3) was sent to this contact. The document provided industry contacts with more specific information on the expenditure data required for the project. After sending this information, a call was made or an email was sent to make sure the requests were understood and to obtain a timeframe in which the company would be able to furnish the information. Booz Allen also forwarded a support letter from the Petroleum Association of Wyoming (Exhibit E-4) and a copy of the Confidentiality Measures that were put in place to ensure that the industry information is handled with care, statistics and impacts are reported in aggregate, and other measures were taken to protect the proprietary nature of the information. Telephone or email communications were made weekly to follow up with industry contacts to insure deadlines were met. Oftentimes, additional contacts were made within the company to obtain information on vendor names and locations.
Booz Allen Hamilton 67

Wyoming Heritage Foundation Oil and Gas Economic Contribution Study
Exhibit D-1: Letter of Introduction
Booz Allen Hamilton Inc. Suite 840 5299 DTC Boulevard Greenwood Village, CO 80111-3362 Tel 1-303-694-4159 Fax 1-303-694-7367
March 4, 2008
Dear XX,
In recent years, with high prices and increasing demand for domestic oil and gas production, there has been considerable oil and gas activity in Wyoming. As a result, the Wyoming Heritage Foundation is funding a study to investigate and quantify the economic contribution of these activities on the State in 2007. Booz Allen Hamilton has been contracted to estimate the direct and downstream economic impacts of the oil and gas production, development, private mineral royalty payments, and extraction taxes. Booz Allen has utilized a similar methodology to estimate the economic contribution of oil and gas activities in Colorado (please see: www.ceri-mines.org/CERIOil&Gas.pdf for a copy of the report).
As part of this study, it is necessary to customize the economic parameters of the model we use. It is vital that your company participate in this data collection process to ensure the accuracy of the oil and gas economic contribution to the State. Generally, we are collecting operator information on development costs (i.e., average costs to drill and complete wells in various basins), production costs, and private mineral royalty payments. We are also collecting information from supporting vendors and service companies regarding labor, materials, equipment, office locations, and other pertinent data.
Your participation in this study will be entirely confidential. The study will only report aggregate data from responses to the interviews. Either myself or Jessica Dick with the Booz Allen project team will follow up with you to arrange a convenient time for a discussion and interview. We would very much appreciate your participation in this effort.
Sincerely,
Holly Bender, PhD
BOOZ ALLEN HAMILTON INC.
Booz Allen Hamilton 68

Wyoming Heritage Foundation Oil and Gas Economic Contribution Study
Exhibit D-2: Wyoming Economic Contribution Study Confidentiality Measures
• No specific company names will be mentioned in any report or correspondence with third parties interested in this study.
• The economic contribution will be estimated using the modified IMPLAN model and will be reported in terms of total employment, income, economic output, and tax revenue generated by the industry to the State of Wyoming.
• Average expenditures for well development for both labor and materials expenses within basins will be used in combination with publicly available data (e.g. number of wells, production levels) to estimate economic contribution. Only aggregated direct expenditures for these activities to estimate impacts will be reported as part of a final report.
• Upon receipt, all company information will be held and stored behind the Booz Allen protected firewall. No specific company data will be released behind the firewall. The data will only be shared with Booz Allen team members needed to conduct the analysis. Database passwords are required to access industry-specific data.
• The purpose of this study is to better understand the relationships between relevant industries that directly or indirectly support oil and gas development in the state. In order to accomplish this task, the project team is collecting basin specific expenditure data on drilling and completing wells and other capital investments in Wyoming as well as average itemized expenditures, labor and material expense breakdowns, and location of services and materials being purchased. This information will be used to modify and customize the IMPLAN model. IMPLAN is a regional economic model that estimates additional economic activities, in terms of employment and income, generated from a primary activity (oil and gas development). Models such as IMPLAN are based on national averages that often times do not properly consider these important relationships and thus are not accurate in their estimate of total economic contribution.
The updates to the model will consist of modifications of coefficients that represent expenditure relationships between relevant industries. These coefficients are embedded in access database files within the software program. As such, there is no requirement to report any specific company costs, contactor information or other proprietary information to be released as part of this study. However, the study may report on general trends or differences in industry operations that can impact expenditures and investments across basins.
• A Draft Report will be extensively reviewed by industry, academia, and other interested parties before it is finalized for publication.
• The Final Report will be shared and distributed to all operators and service companies that participate in the study.
• Please see the Colorado Oil and Gas Economic Impact Study for an example of the types of information that will be reported. The report is located at the following website: www.ceri-mines.org/CERIOil&Gas.pdf.
Booz Allen Hamilton 69
Wyoming Heritage Foundation Oil and Gas Economic Contribution Study
Exhibit D- 3: Wyoming Oil and Gas Operators Data Request Document
Booz Allen Hamilton (Booz Allen) is requesting information from your company regarding oil and gas development and production expenditures. We are very cognizant of the sensitive nature of this information and insure that no specific cost information for any individual company will be revealed. For instance, ALL costs, fees, and payments WILL BE AGGREGATED across industries and activities and reported only in aggregate to protect the proprietary nature of this information. However, in order to accurately estimate the true ECONOMIC CONTRIBUTION of the industry to the State of Wyoming we need to have accurate information on the average costs incurred by companies within specific basins. This is the number one goal of this effort. We appreciate any help you can provide in facilitating this information collection effort and providing the appropriate point of contact to provide these types of information.
For your information, Bruce Hinchey with the Petroleum Association of Wyoming is supportive of this project. He has written a letter of support the project and provided us with your contact information.
Booz Allen is specifically interested in obtaining the following information from your company for the calendar year 2007:
• Total number of wells drilled and completed by basin in Wyoming • Average capital investments for drilling and completing wells by basin for oil, conventional gas or
coalbed methane gas • Major service companies utilized for drilling and completing wells and locations of service
companies • Number of producing wells by basin • Average production costs for oil, conventional gas, or coalbed methane gas • Specific royalty and payment information for private mineral production, including average
surface land damage payments, override payments, royalty payments, and value of private mineral lease payments and bonuses
A major task within this study is to understand to where the capital investments are being paid. Therefore, we will also be interviewing service companies to allocate their revenues among those that stay within Wyoming and those that move outside the State.
To facilitate this information collection process, it is necessary to contact and collect information from Team Leads for the various basins of operation as well as a Land Group contact. The information needed for each is outlined below.
If this information is difficult to report, we would like to interview (for about an hour) someone within your company who has knowledge about capital investment and production costs as well as private mineral royalties, fees and payments. We require only ESTIMATES of these costs to customize our model, and your subjective knowledge about your company's expenses is better than no information at all!
Booz Allen Hamilton 70

Wyoming Heritage Foundation Oil and Gas Economic Contribution Study
For the Team Lead in Each Basin of Operation
In order to simplify the data collection effort and the impact on each company, we would like to request an example Authority for Expenditure (AFE) document for drilling and completing a well. If possible, these documents should be for a typical well in each basin where you operate (if possible for oil, conventional gas and coalbed methane) for the calendar year 2007.
Once these forms or cost documents are obtained, we would like to contact you to obtain more information on the larger expenses, the names of service companies utilized and their locations, and other pertinent information.
We would also like to obtain information on your 2007 production costs, if possible, by basin of operation and type of resource extracted. If possible, this information should be provided in a cost per mcf or per barrel unit. If these costs cannot be captured per unit of production, we are willing to work with whatever type of reporting units or methods you can provide. Additional data may be requested to convert the cost data into per mcf or per barrel production costs, such as number of producing wells, wells per lease, etc.
For the Land Group (or Division Order) for Each Basin of Operation
On average across each basin of operation, we would like to obtain the following information for 2007 (these should be mutually exclusive royalties, payments and fees):
• Private mineral royalties • The percentage of wells with private mineral ownership • Average production fee as a percentage of production value paid to private mineral owners • Locations of private mineral royalty recipients; provide percentage of royalties paid to recipients
within Wyoming.
• Surface land damage payment • Percentage of wells that are split estates where surface land damages are paid to private
surface owners • The average surface land damage payment paid in a cost per well • Locations of surface land damage payment recipients; provide percentage of payments to
recipients within Wyoming.
3. Override Payments • The number or percentage of wells in the basin where an override payment is made • The average override fee as a percentage of production value • Locations of private override fee recipients; provide percentage of fees paid to recipients within
Wyoming.
4. Average dollar value of leases and bonuses paid for access to private minerals in 2007
Booz Allen Hamilton 71

Wyoming Heritage Foundation Oil and Gas Economic Contribution Study
Exhibit D-4: Supporting Letter from Petroleum Association of Wyoming
951 Werner Court, Suite 100 fax (307) 266-2189 Casper, Wyoming 82601 e-mail: [email protected](307) 234-5333 www.pawyo.org
February 29, 2008 Board of Directors Petroleum Association of Wyoming Casper, Wyoming As you know, we have been in the planning stages for the few months and are ready to execute the oil and gas industry economic contribution study. The effort, coordinated through the Wyoming Business Association and Wyoming Heritage Foundation and in conjunction with economists Dr. Lisa McDonald with The Louis Berger Group and Dr. Holly Bender of Booz Allen Hamilton will require your cooperation and participation in order to make this project successful. In 2005, Drs. McDonald and Bender estimated economic contribution of oil and gas activities in Colorado (see: www.ceri-mines.org/cerioil&gas.pdf) in a peer-reviewed, objective and transparent analysis. This study will utilize a similar highly defensible methodology to the Colorado study. A number of key areas will be examined and require your help in obtaining accurate, specific information. For example, we will be examining capital expenditure data for drilling and completing wells, service company use and expenditures, production cost data, and other aspects of the industry to demonstrate the economic contribution of the industry to the State of Wyoming. Once the data collection effort is complete, we will calculate the direct and downstream economic contribution to the State. I cannot emphasize enough the importance of your participation in this survey and the need for cooperation with the effort. Confidentiality will be of utmost importance and I will work with you individually if needed to satisfy any issues you might have. Our industry’s economic contribution to Wyoming’s economy is vastly underestimated. Dr. Bender or one of her representatives will be contacting you shortly to schedule an interview and follow up to collect data. Thank you in advance for your help. Should you have suggestions about areas to examine, please feel free to advise me at your earliest convenience. Sincerely,
Bruce Hinchey PresidentBooz Allen Hamilton 72
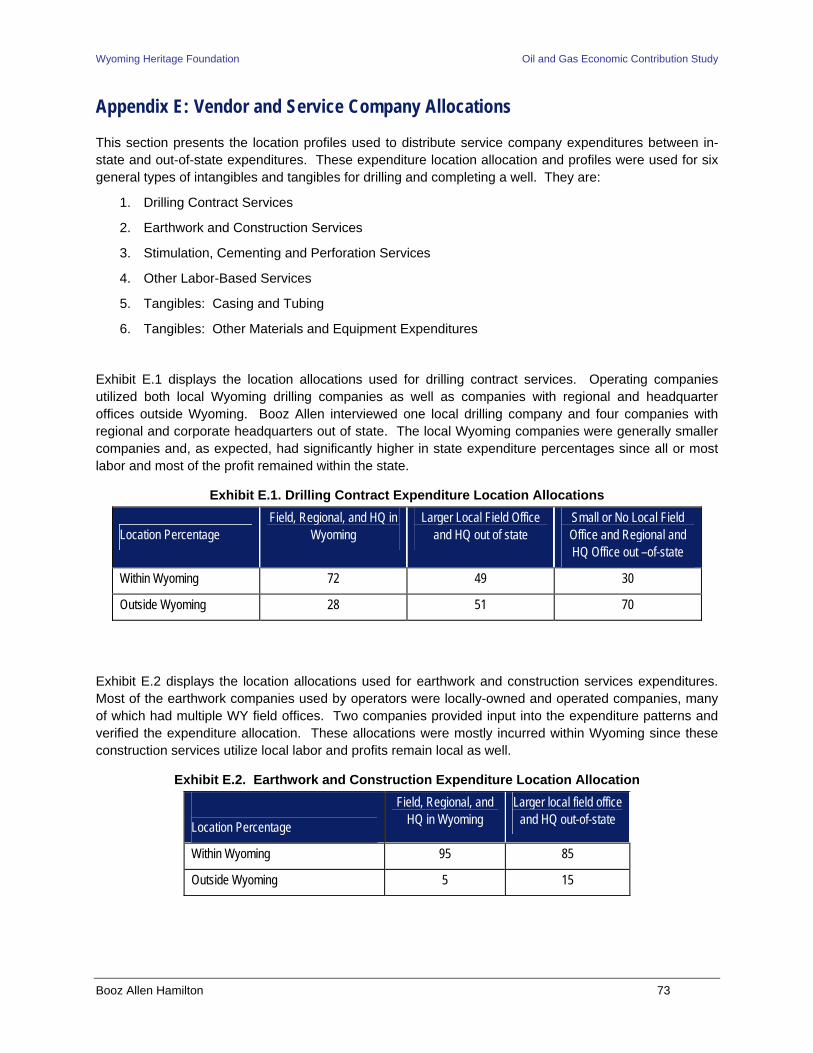
Wyoming Heritage Foundation Oil and Gas Economic Contribution Study
Appendix E: Vendor and Service Company Allocations
This section presents the location profiles used to distribute service company expenditures between in-state and out-of-state expenditures. These expenditure location allocation and profiles were used for six general types of intangibles and tangibles for drilling and completing a well. They are:
1. Drilling Contract Services
2. Earthwork and Construction Services
3. Stimulation, Cementing and Perforation Services
4. Other Labor-Based Services
5. Tangibles: Casing and Tubing
6. Tangibles: Other Materials and Equipment Expenditures
Exhibit E.1 displays the location allocations used for drilling contract services. Operating companies utilized both local Wyoming drilling companies as well as companies with regional and headquarter offices outside Wyoming. Booz Allen interviewed one local drilling company and four companies with regional and corporate headquarters out of state. The local Wyoming companies were generally smaller companies and, as expected, had significantly higher in state expenditure percentages since all or most labor and most of the profit remained within the state.
Exhibit E.1. Drilling Contract Expenditure Location Allocations
Location Percentage Field, Regional, and HQ in
Wyoming Larger Local Field Office
and HQ out of state Small or No Local Field Office and Regional and HQ Office out –of-state
Within Wyoming 72 49 30
Outside Wyoming 28 51 70
Exhibit E.2 displays the location allocations used for earthwork and construction services expenditures. Most of the earthwork companies used by operators were locally-owned and operated companies, many of which had multiple WY field offices. Two companies provided input into the expenditure patterns and verified the expenditure allocation. These allocations were mostly incurred within Wyoming since these construction services utilize local labor and profits remain local as well.
Exhibit E.2. Earthwork and Construction Expenditure Location Allocation
Location Percentage
Field, Regional, and HQ in Wyoming
Larger local field office and HQ out-of-state
Within Wyoming 95 85
Outside Wyoming 5 15
Booz Allen Hamilton 73

Wyoming Heritage Foundation Oil and Gas Economic Contribution Study
Stimulation, cementing, and perforation services, shown in Exhibit E.3, are often the largest expenses for completing an oil or gas well. These activities are largely labor-based services, but do require a significant amount of materials (cement, stimulation materials). In Wyoming, two major companies were interviewed to assess the location allocations. Since these are fairly technical services, it is often the case that these companies need to bring in highly-skilled labor from outside Wyoming to perform these services. Required materials and equipment, non-local labor, and non-local profits drive down the local Wyoming percentage for these services.
Exhibit E.3. Stimulation and Cementing Expenditure Location Allocation
Location Percentage
Larger Local Field Office and HQ out-of-state
Small or No Local Field Office and Most Support from out-of-
state HQ
Within Wyoming 42 30
Outside Wyoming 58 70
Exhibit E.4 summarizes general labor-based services locations allocations for drilling and completing wells. These services include pumper labor, roustabouts, drilling or completion supervision, permitting, legal, surveying, water hauling or water services, and others. Two well servicing companies were interviewed to determine their expenditure location allocations. Knowledge from labor-based service operations in Colorado were also utilized.
Exhibit E.4. General Labor-Based Service Expenditure Location Allocation
Location Percentage
Field, Regional, and HQ Office in
Wyoming
Larger Local Field Office and HQ out-of-
state
Small or No Local Field Office and Most Support
from out-of-state HQ
Within Wyoming 90 80 60
Outside Wyoming 10 20 40
As shown in Exhibit E.5, casing and tubing expenditures for Wyoming have a large out-of-state component as these materials are primarily imported to Wyoming. The small Wyoming percentage is attributed to the overhead for the storage, transportation, and sales of the product.
Exhibit E.5. Casing and Tubing Expenditure Location Allocation
Location Percentage
WY sales office (yard) & reg office in WY / HQ out of
state
WY sales office (maybe yard) / rest out state
No local field office / most support from out of state
HQ
Within Wyoming 20 15 5
Outside Wyoming 80 85 95
Booz Allen Hamilton 74

Wyoming Heritage Foundation Oil and Gas Economic Contribution Study
Exhibit E.6 shows the equipment and materials expenditure location profile. This profile was used for items such as rental equipment, down hole equipment, wellhead equipment, fluid service providers, or other general material and equipment items that were not captured in casing and tubing location profile. Three companies provided information for these profiles. Rental equipment allocations are generally higher for within state expenditures than other wholesale trade items due to the use of Wyoming companies with local overhead, transportation, installation and take-down labor.
Exhibit E.6. General Materials and Equipment Expenditure Location Allocation
Location Percentage
Field, Regional, and HQ in Wyoming
Larger Local Field Office and HQ from out of state
Small or No Local Field Office and Most Support
from out of state HQ
Within Wyoming 35 28 10
Outside Wyoming 65 72 90
During interviews with operators, a large amount of “facility” expenses were identified for surface buildings, housing, storage facilities, and buildings and general facilities for production and well head equipment. Since these facilities are primarily a material cost, but also have a labor component for overhead, installation labor, transportation, the following allocation was used: 30% within Wyoming and 70% outside Wyoming. This was based on our discussions with two companies provided these types of wholesale trade items.
Booz Allen Hamilton 75

Wyoming Heritage Foundation Oil and Gas Economic Contribution Study
Appendix F: References
Colorado Department of Local Affairs, Annual Report, 2007.
Colorado Department of Revenue, Annual Report, 2007.
Colorado Energy Research Institute, 2007, Oil and Gas Economic Impact Analysis, Colorado School of Mines, Report 2007-1, June.
Colorado State Land Board, 2008, Personal Communication with Pete Melonis, 7/15/2008.
Consensus Revenue Estimating Group, Wyoming State Government Revenue Forecast: Fiscal Year 2008-Fiscal Year 2012, January 2008, Table 3.
Independent Petroleum Association of America, 2007, The Oil and Gas Producing Industry in Your State, http://www.ipaa.org/reports/econreports/IPAAOPI.pdf, August.
Dean Runyan Associates, 2007, Economic Impact of Travel on Wyoming: 1997-2006.
Downey, George K., 2006, Using BEA’s Gross State Product Estimates, U.S. Bureau of Economic Analysis, Sept. 8.
IMPLAN Professional, Version 2.0.1025, Copyright MIG, Inc. 1997-2004, www.implan.com.
IMPLAN Manual, 2003, Version 2.0, Copyright MIG.
Miller, Ron and Peter Blair, 1985, Input-output Analysis: Fundamentals and Extensions, Prentice-Hall: Englewood Cliffs, NJ.
Olson, Doug, 1999, Using Social Accounts to Estimate Tax Impacts, Paper give at the Mid-Continent Regional Science Association meetings in Minneapolis, Minnesota, June 11, 1999.
Petroleum Association of Wyoming, April, 2008, www.pawyo.org.
Society of Petroleum Engineers, http://www.spe.org/spe-app/spe/industry/reference/unit_conversions.htm.
U.S. Bureau of Economic Analysis. 2006. http://bea.gov/bea/regional/spi/action.sfm.
U.S. Bureau of Labor Statistics, 2006, www.bls.gov.
U.S. Department of Commerce, Bureau of Economic Analysis, 2007, Survey of Current Business, August, 2007.
U.S. Census Bureau, 2003-2004, Annual Survey of State and Local Government Finances, http://www.census.gov/govs/www/estimate.html.
U.S. Census Bureau, 2002 Economic Census, http://www.census.gov/econ/census02/.
U.S. Minerals Management Service, 2007, Federal Mineral Royalty Revenues, www.mrm.mms.gov/mrmwebstats/.
Booz Allen Hamilton 76

Wyoming Heritage Foundation Oil and Gas Economic Contribution Study
U.S. National Park Service, 2008, Press Release on Yellowstone National Park, January 3.
Wyoming Department of Employment, 2008, Labor Trends, Vol. 45, No. 7, July.
Wyoming Department of State Lands and Investments, Personal Communication with Billie Hunter, Department of Royalty Compliance, 6/18/2008.
Wyoming Department of Revenue, 2007, Annual Report.
Wyoming Department of Revenue, Excise Tax Division, Excise Tax Division, Tax Pub #5 – Oil, Conventional Natural Gas & Coal Bed Methane, January 30, 2004.
Wyoming Department of Revenue Sales and Use Distribution Reports, accessed at http://revenue.state.wy.us/PortalVBVS/DesktopDefault.aspx?tabindex=3&tabid=10.
Wyoming Oil and Gas Conservation Commission, May, 2007.
Wyoming Pipeline Authority, Personal Communication with Brian Jeffries, Executive Director, 8/10/2008.
Booz Allen Hamilton 77