enhanced oil recovery screening in wyoming
TRANSCRIPT
1
Enhanced Oil Recovery Screening in Wyoming
Final Report
5/6/2016
Prepared for Dr. Fu & the University of Wyoming
Prepared By Group 7:
John Baldwin ____
Dylan Morin ____
Jordan Polzin ___ _
Kyle Scalise_______________________________________________________ _
Jake Duda _____________________________________________________ __
2
TABLE OF CONTENTS
Section Page Number
Table of Contents 2
Executive Summary 3
Introduction 3
Phase 1: Planning 3
o Project Workflow 4
o Project Schedule 6
Phase 2: Data Collection 7
Phase 3: Data Analysis 8
o Screening
Phase 4: Determination of Main Project Goals 10
o Ranking
Discussion 22
Conclusion 23
References 24
3
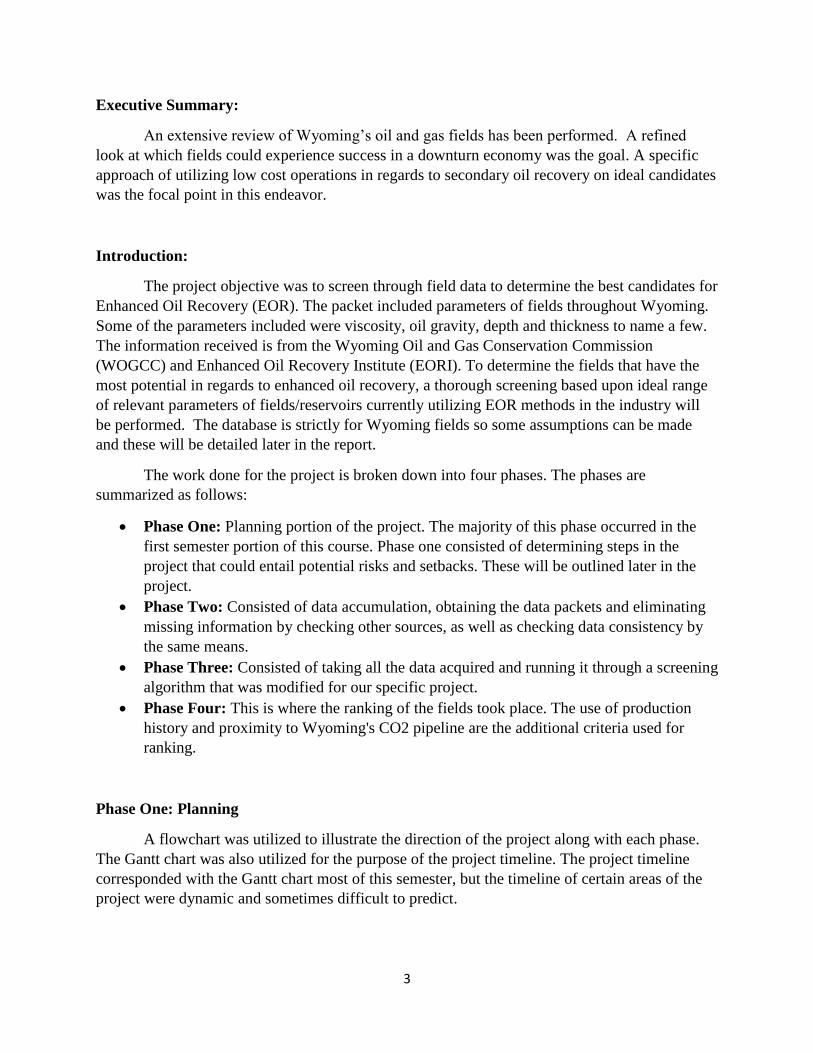
Executive Summary:
An extensive review of Wyoming’s oil and gas fields has been performed. A refined
look at which fields could experience success in a downturn economy was the goal. A specific
approach of utilizing low cost operations in regards to secondary oil recovery on ideal candidates
was the focal point in this endeavor.
Introduction:
The project objective was to screen through field data to determine the best candidates for
Enhanced Oil Recovery (EOR). The packet included parameters of fields throughout Wyoming.
Some of the parameters included were viscosity, oil gravity, depth and thickness to name a few.
The information received is from the Wyoming Oil and Gas Conservation Commission
(WOGCC) and Enhanced Oil Recovery Institute (EORI). To determine the fields that have the
most potential in regards to enhanced oil recovery, a thorough screening based upon ideal range
of relevant parameters of fields/reservoirs currently utilizing EOR methods in the industry will
be performed. The database is strictly for Wyoming fields so some assumptions can be made
and these will be detailed later in the report.
The work done for the project is broken down into four phases. The phases are
summarized as follows:
Phase One: Planning portion of the project. The majority of this phase occurred in the
first semester portion of this course. Phase one consisted of determining steps in the
project that could entail potential risks and setbacks. These will be outlined later in the
project.
Phase Two: Consisted of data accumulation, obtaining the data packets and eliminating
missing information by checking other sources, as well as checking data consistency by
the same means.
Phase Three: Consisted of taking all the data acquired and running it through a screening
algorithm that was modified for our specific project.
Phase Four: This is where the ranking of the fields took place. The use of production
history and proximity to Wyoming's CO2 pipeline are the additional criteria used for
ranking.
Phase One: Planning
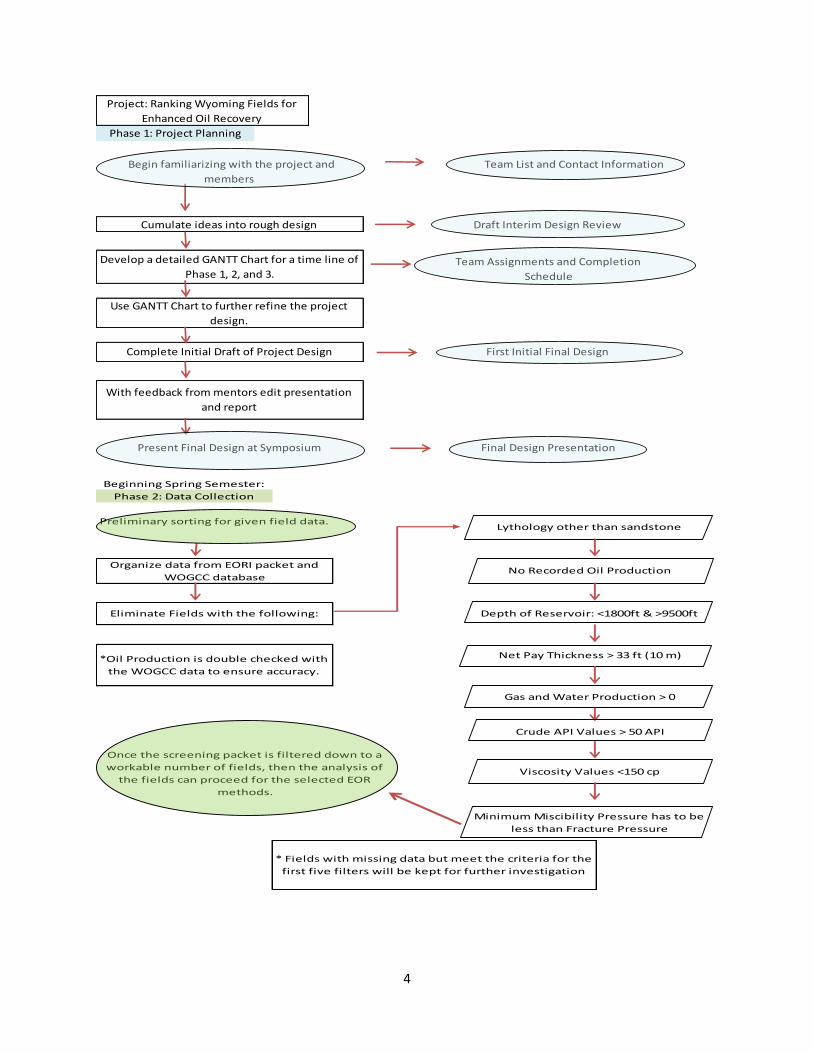
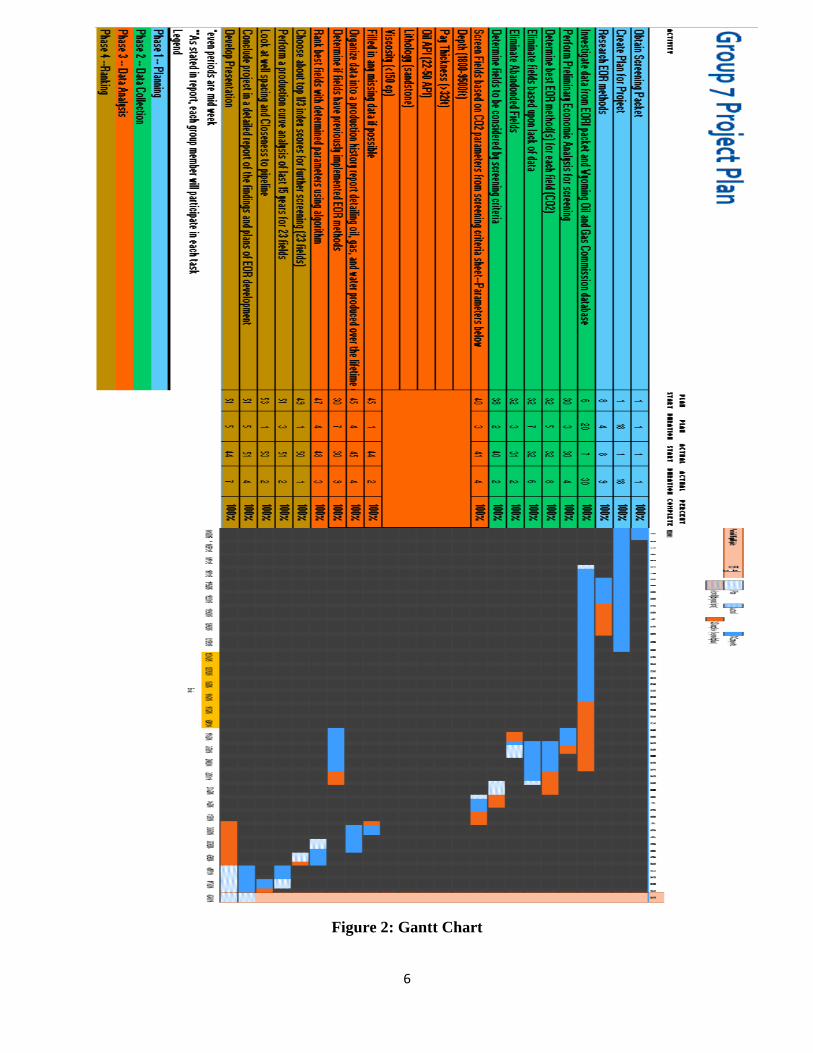
A flowchart was utilized to illustrate the direction of the project along with each phase.
The Gantt chart was also utilized for the purpose of the project timeline. The project timeline
corresponded with the Gantt chart most of this semester, but the timeline of certain areas of the
project were dynamic and sometimes difficult to predict.
4
Once the screening packet is filtered down to a
workable number of fields, then the analysis of
the fields can proceed for the selected EOR
methods.
Minimum Miscibility Pressure has to be
less than Fracture Pressure
Phase 2: Data Collection
Beginning Spring Semester:
Preliminary sorting for given field data.Lythology other than sandstone
Depth of Reservoir: <1800ft & >9500ft
Net Pay Thickness > 33 ft (10 m)
No Recorded Oil Production
Gas and Water Production > 0
Crude API Values > 50 API
Viscosity Values <150 cp
* Fields with missing data but meet the criteria for the
first five filters will be kept for further investigation
Organize data from EORI packet and
WOGCC database
Eliminate Fields with the following:
*Oil Production is double checked with
the WOGCC data to ensure accuracy.
With feedback from mentors edit presentation
and report
Phase 1: Project Planning
Team Assignments and Completion
Schedule
Develop a detailed GANTT Chart for a time line of
Phase 1, 2, and 3.
Complete Initial Draft of Project Design First Initial Final Design
Use GANTT Chart to further refine the project
design.
Present Final Design at Symposium Final Design Presentation
Project: Ranking Wyoming Fields for
Enhanced Oil Recovery
Draft Interim Design Review Cumulate ideas into rough design
Begin familiarizing with the project and
members
Team List and Contact Information
5
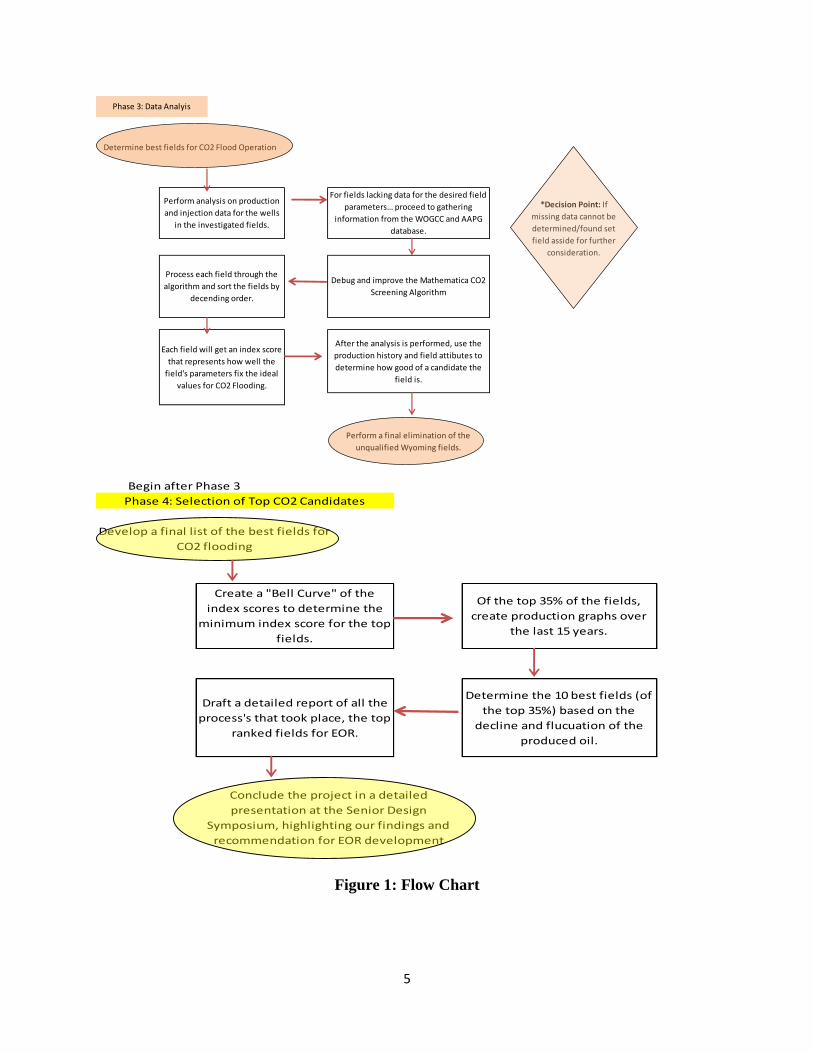
Figure 1: Flow Chart
Determine best fields for CO2 Flood Operation
Perform analysis on production
and injection data for the wells
in the investigated fields.
Process each field through the
algorithm and sort the fields by
decending order.
Each field will get an index score
that represents how well the
field's parameters fix the ideal
values for CO2 Flooding.
After the analysis is performed, use the
production history and field attibutes to
determine how good of a candidate the
field is.
Perform a final elimination of the
unqualified Wyoming fields.
*Decision Point: If
missing data cannot be
determined/found set
field asside for further
consideration.
Phase 3: Data Analyis
For fields lacking data for the desired field
parameters… proceed to gathering
information from the WOGCC and AAPG
database.
Debug and improve the Mathematica CO2
Screening Algorithm
Begin after Phase 3
Create a "Bell Curve" of the
index scores to determine the
minimum index score for the top
fields.
Determine the 10 best fields (of
the top 35%) based on the
decline and flucuation of the
produced oil.
Draft a detailed report of all the
process's that took place, the top
ranked fields for EOR.
Conclude the project in a detailed
presentation at the Senior Design
Symposium, highlighting our findings and
recommendation for EOR development
Of the top 35% of the fields,
create production graphs over
the last 15 years.
Phase 4: Selection of Top CO2 Candidates
Develop a final list of the best fields for
CO2 flooding
6
Figure 2: Gantt Chart
7
Phase Two: Data Collection
In the beginning of the data collection phase, the group relied on the WOGCC and AAPG
for field/reservoir data. These websites contained the relevant and reliable information for the
fields which were utilized for screening.
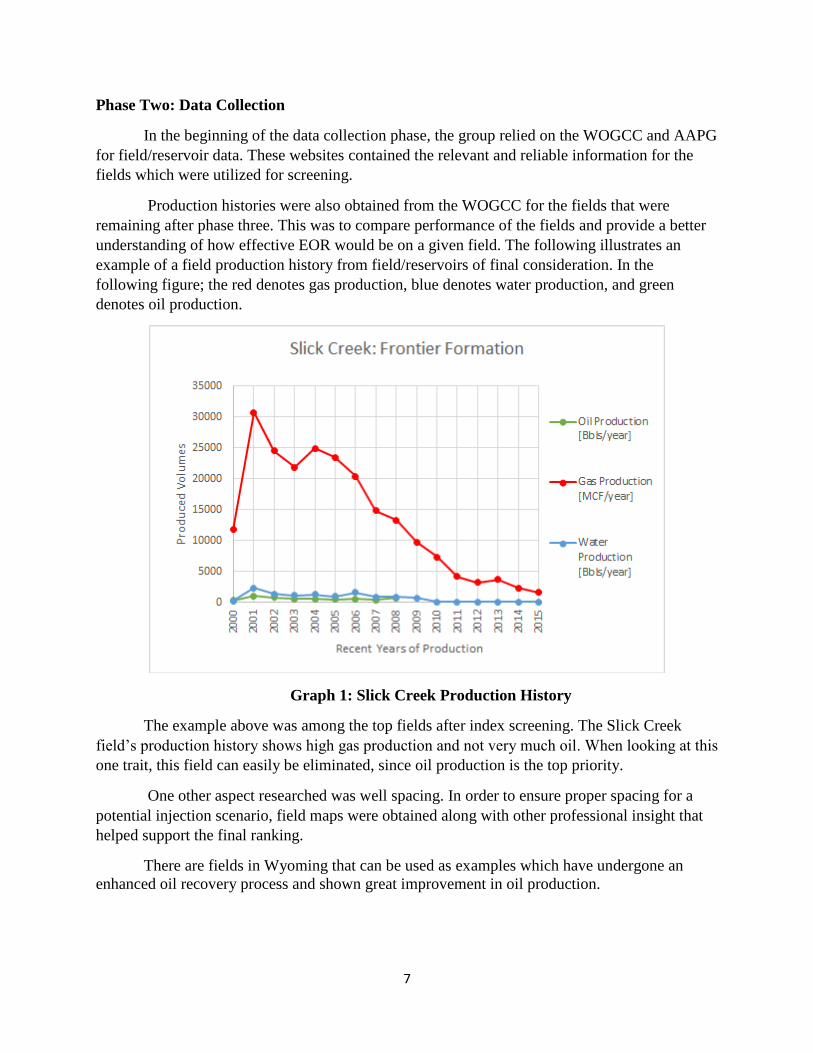
Production histories were also obtained from the WOGCC for the fields that were
remaining after phase three. This was to compare performance of the fields and provide a better
understanding of how effective EOR would be on a given field. The following illustrates an
example of a field production history from field/reservoirs of final consideration. In the
following figure; the red denotes gas production, blue denotes water production, and green
denotes oil production.
Graph 1: Slick Creek Production History
The example above was among the top fields after index screening. The Slick Creek
field’s production history shows high gas production and not very much oil. When looking at this
one trait, this field can easily be eliminated, since oil production is the top priority.
One other aspect researched was well spacing. In order to ensure proper spacing for a
potential injection scenario, field maps were obtained along with other professional insight that
helped support the final ranking.
There are fields in Wyoming that can be used as examples which have undergone an
enhanced oil recovery process and shown great improvement in oil production.
8
Phase Three: Data Analysis
The original screening packet began with close to five-thousand field entries. To be able
to accurately determine good EOR candidates, the data packet had to be screened, sorted, and
reduced in size.
To do this, EOR methods had to be eliminated with viable reason. Surface mining
methods were off the table as the field parameters did not meet the criteria that was required by
those methods, such as, depth and viscosity. With the assistance of an industry professional, and
from researching current EOR projects, the scope was narrowed down to water flooding and
CO2 injection. These methods were both effective on current projects and feasible in an
economic downturn. Further research showed that most fields were already undergoing water
injection, therefore, it was decided CO2 injection would be the EOR method of choice.
The screening process utilized considered only miscible CO2 flooding as the primary
EOR method. The main reason for pursuing miscible CO2 is due to the effectiveness of CO2 on
sweep efficiencies and increased recovery from maturing fields. Wyoming has a large number of
sandstone reservoirs with oil of high API gravity values; both of which are recommended for
efficient recovery with miscible CO2. Other methods might be effective forms of EOR in
Wyoming, but miscible CO2 flooding has been has been proven to be a reliable recovery method
in Wyoming. The breakdown of the screening process is explained below.
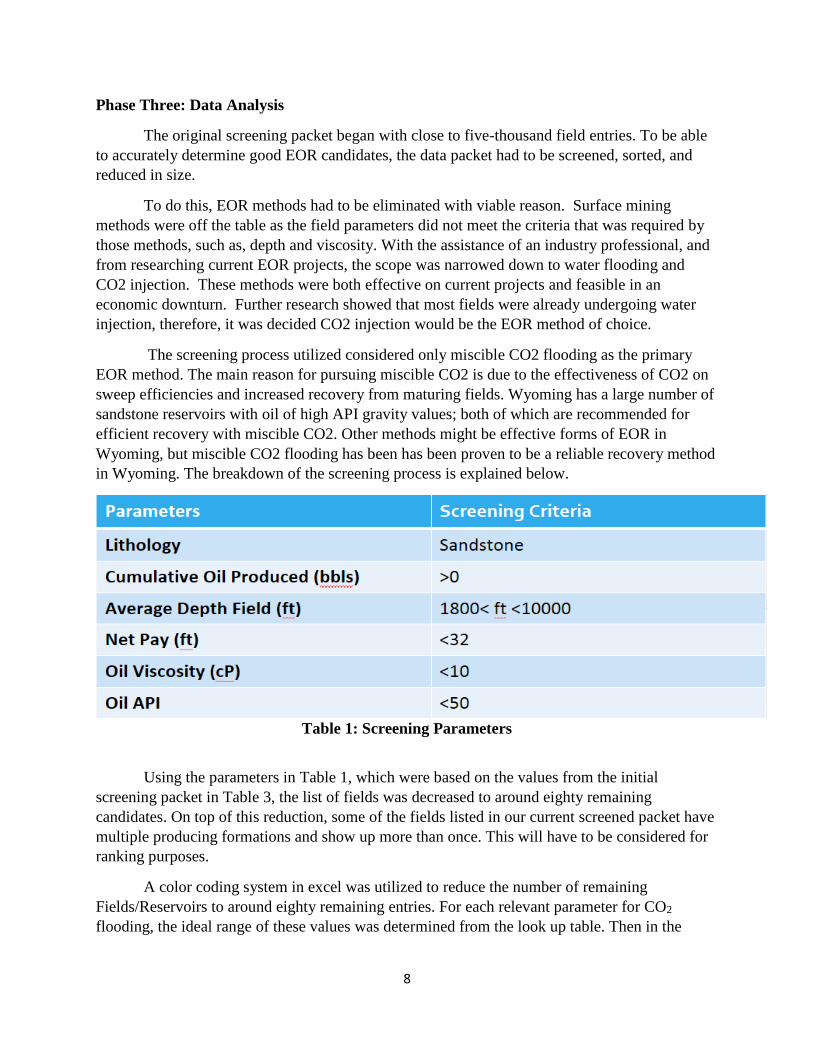
Table 1: Screening Parameters
Using the parameters in Table 1, which were based on the values from the initial
screening packet in Table 3, the list of fields was decreased to around eighty remaining
candidates. On top of this reduction, some of the fields listed in our current screened packet have
multiple producing formations and show up more than once. This will have to be considered for
ranking purposes.
A color coding system in excel was utilized to reduce the number of remaining
Fields/Reservoirs to around eighty remaining entries. For each relevant parameter for CO2
flooding, the ideal range of these values was determined from the look up table. Then in the
9
excel file, all Field/Reservoirs containing parameter values inside these ideal range of values was
highlighted a specific color. This process was done for all four parameters. Once the color
coding was completed, it was analyzed which fields contained a color for at least three
parameters. Knowing fields with less than three ideal parameters could only achieve a maximum
0.5 index score, it was determined to be highly unlikely for this low of a score to end up in the
final ranking of the highest index scores. Thus, these fields with less than three color coded
parameters were eliminated. This is how this process left a remaining number of around eighty
fields left to be ranked.
Fields were eliminated if there was no oil production illustrated in the screening packet or
published in the WOGCC database. Upon investigating the formations of fields with no
production history in the screening packet, the WOGCC database showed no history of such
formations ever producing any fluids over time. These entries in the screening packet were
sorted out of the remaining fields under consideration. In addition, if a field was published in the
screening packet as abandoned at some point in time, the field was eliminated from the
remaining candidates.
From reviewing literature, sandstone formations are the preferred lithology for miscible
CO2 flooding. In a sandstone reservoir, there in a good response in the increase of oil production
during a CO2 flood. Thus, oil and gas fields with lithology other than sandstone were eliminated
out of the remaining candidates.
The oil API range used corresponded to CO2 injection was limited to less than 50° API
because higher API gravity is gas and/or gas condensate. The scope of the project is to only
assess oil fields for enhanced oil recovery.
The depth range chosen reflects the constraints for CO2 injection. Again, these ranges are
the most efficient and allow CO2 injection to deliver the highest volume of hydrocarbons.
The net pay has been filtered because of the effectiveness of the recovery process,
primarily the sweep efficiency, a net pay less than 32 feet is the most effective. This was decided
after reviewing literature about sweep efficiencies and conformance control for miscible CO2
flooding.
The limitation of oil viscosity has been placed to optimize the amount of fluid that gets
mobilized during the recovery process.
Wells that had a lower fracture pressure than minimum miscible pressure were
eliminated. In these reservoirs, the pressures need to have a miscible CO2 flood would fracture
the formation. A fractured formation would result in a loss of conformance control and a loss of
fluids during injection.
Two future parameters included in the final screening are well spacing and proximity to
the CO2 pipeline in Wyoming. Well spacing is important because fields work efficiently when
well spacing is close and when injectors are close to producers, the optimal spacing is around 80
acres per well. The closeness to the pipeline allows our fields to be economical by not having to
invest in infrastructure.
10
With all these considerations (neglecting well spacing and proximity to CO2 pipeline for
now), the remaining fields are now ready to be input and scored in the algorithm, which can be
customized and altered based on CO2 parameters. With this algorithm the most qualified fields
will be determined and ranked for the selected tertiary recovery method.
Figuring out the complex algorithm was another huge step that was accomplished. The
algorithm was run in the Mathematica computer program to do the index ranking; in
Mathematica there is an ability to utilize an integral function. This function was used to find the
overlapping area between the reference and field parameter triangles. The area overlap results in
the index score for the field.
Phase Four: Ranking
The basis of the screening algorithm, obtained by Dr. Alvarado at the University of
Wyoming, was used to help identify and score fields most suitable for CO2 flooding. The
algorithm originally contained coding errors, which resulted in a lack of outputs. The algorithm's
code was corrected and improved upon in order for it to be utilized. In addition, the algorithm
was adjusted to contain only the relevant parameters for CO2 flooding as established by the
screening criteria.
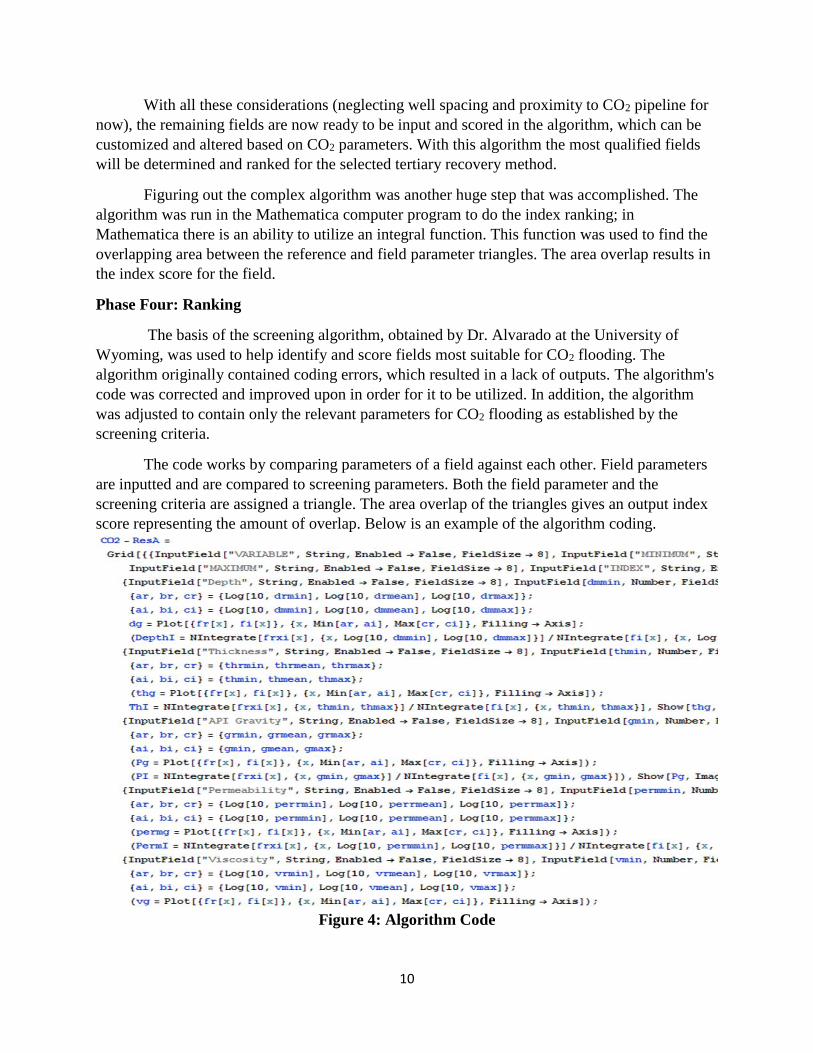
The code works by comparing parameters of a field against each other. Field parameters
are inputted and are compared to screening parameters. Both the field parameter and the
screening criteria are assigned a triangle. The area overlap of the triangles gives an output index
score representing the amount of overlap. Below is an example of the algorithm coding.
Figure 4: Algorithm Code
11
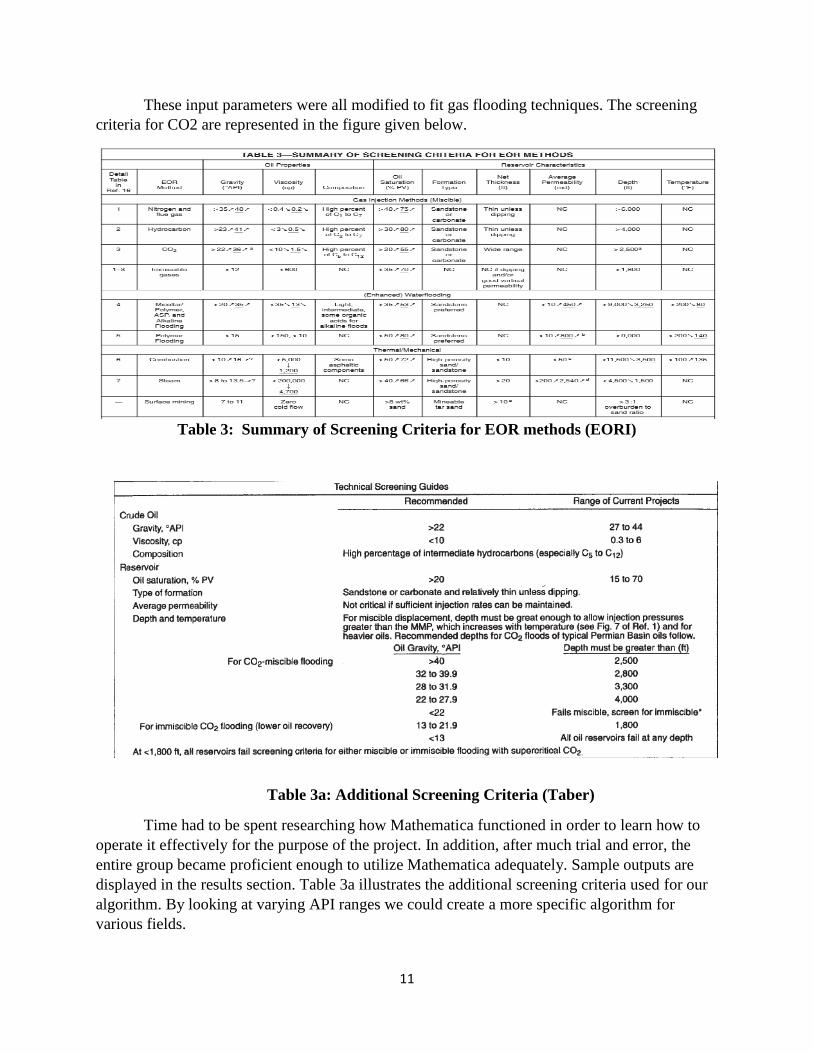
These input parameters were all modified to fit gas flooding techniques. The screening
criteria for CO2 are represented in the figure given below.
Table 3: Summary of Screening Criteria for EOR methods (EORI)
Table 3a: Additional Screening Criteria (Taber)
Time had to be spent researching how Mathematica functioned in order to learn how to
operate it effectively for the purpose of the project. In addition, after much trial and error, the
entire group became proficient enough to utilize Mathematica adequately. Sample outputs are
displayed in the results section. Table 3a illustrates the additional screening criteria used for our
algorithm. By looking at varying API ranges we could create a more specific algorithm for
various fields.
12
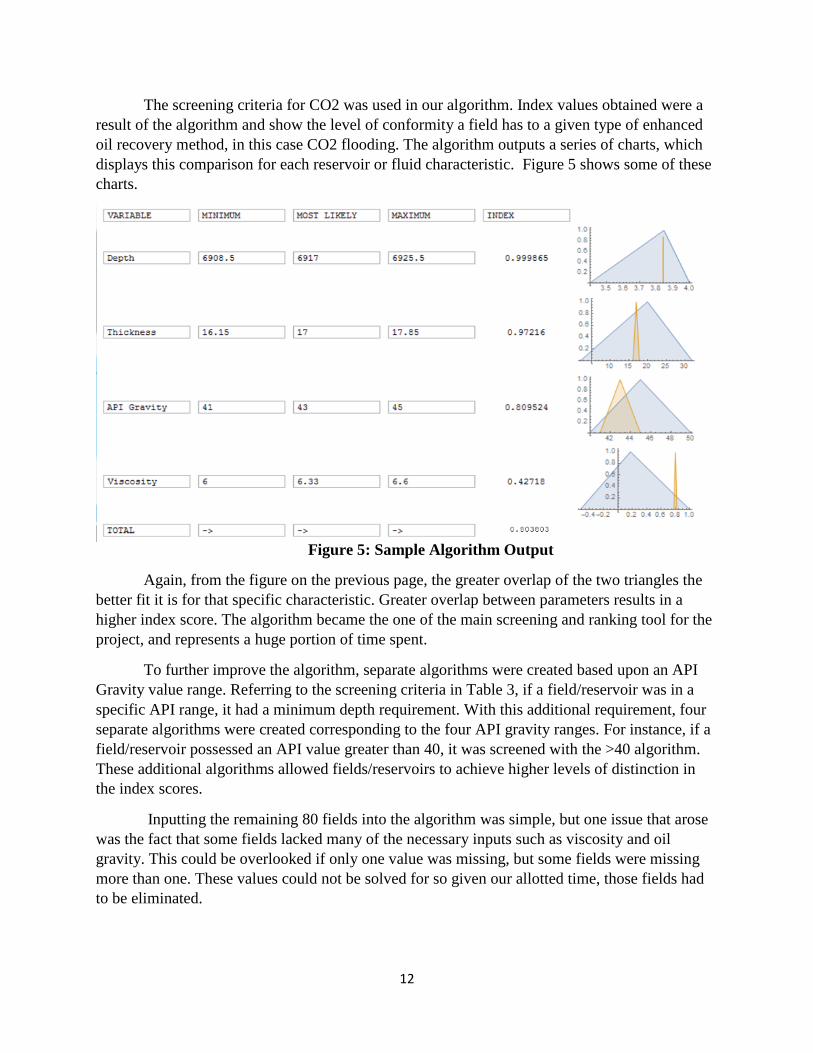
The screening criteria for CO2 was used in our algorithm. Index values obtained were a
result of the algorithm and show the level of conformity a field has to a given type of enhanced
oil recovery method, in this case CO2 flooding. The algorithm outputs a series of charts, which
displays this comparison for each reservoir or fluid characteristic. Figure 5 shows some of these
charts.
Figure 5: Sample Algorithm Output
Again, from the figure on the previous page, the greater overlap of the two triangles the
better fit it is for that specific characteristic. Greater overlap between parameters results in a
higher index score. The algorithm became the one of the main screening and ranking tool for the
project, and represents a huge portion of time spent.
To further improve the algorithm, separate algorithms were created based upon an API
Gravity value range. Referring to the screening criteria in Table 3, if a field/reservoir was in a
specific API range, it had a minimum depth requirement. With this additional requirement, four
separate algorithms were created corresponding to the four API gravity ranges. For instance, if a
field/reservoir possessed an API value greater than 40, it was screened with the >40 algorithm.
These additional algorithms allowed fields/reservoirs to achieve higher levels of distinction in
the index scores.
Inputting the remaining 80 fields into the algorithm was simple, but one issue that arose
was the fact that some fields lacked many of the necessary inputs such as viscosity and oil
gravity. This could be overlooked if only one value was missing, but some fields were missing
more than one. These values could not be solved for so given our allotted time, those fields had
to be eliminated.
13
Again, it was a priority to reduce the number of fields to the top remaining candidates
after the index scoring process. To do this, the top 1/3 of the remaining fields were isolated. This
corresponded to an index score of around 0.7. The top 1/3 of the fields was decided because it
included 22 (22 fields corresponds to about 35%) remaining fields to look at.
Finally, to obtain the best 5 candidates the production history graphs from the year 2000
to 2015 were analyzed for these 22 fields. This will show how oil production has declined over
time and if there is a good response to a water flooding effort in this time period (i.e. increased
water production). This was a step that helped determine which fields are the most promising. Of
these fields the well spacing is given on an average spacing of the number of wells over the total
area of the field, the closer the well spacing is, the more effective a CO2 flood will be on
production. Furthermore, the distance from the CO2 pipeline to the field will be measured for the
final ranking criteria. These final processes will determine the advantages and disadvantages of
the top five candidates considered for miscible CO2 flooding.
The EORI website contains an interactive map of Wyoming which has the capability to
show the proximity of the CO2 pipeline with respect to the final Fields of interest. This map was
utilized to determine the distance of the fields to the pipeline. With the addition of this website
and the interactive map to the project, the proximity to the CO2 pipeline of the final 5 fields was
calculated and these results were utilized in determining the final ranking of Fields.
Results:
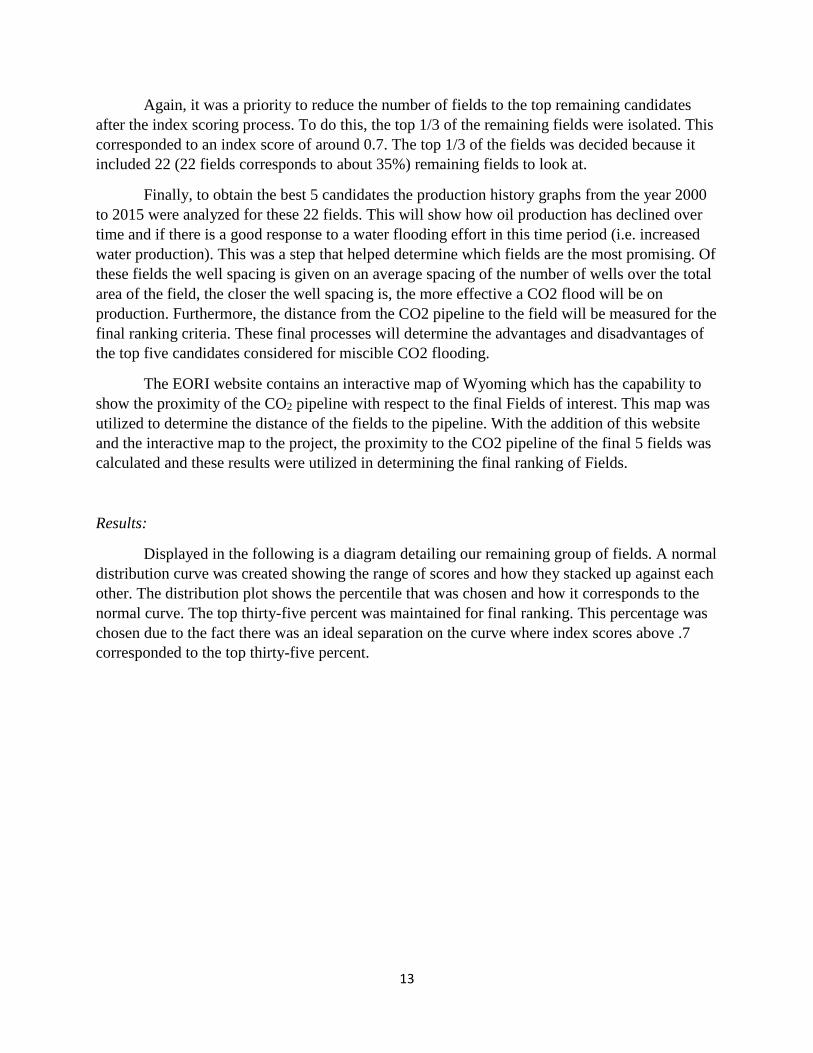
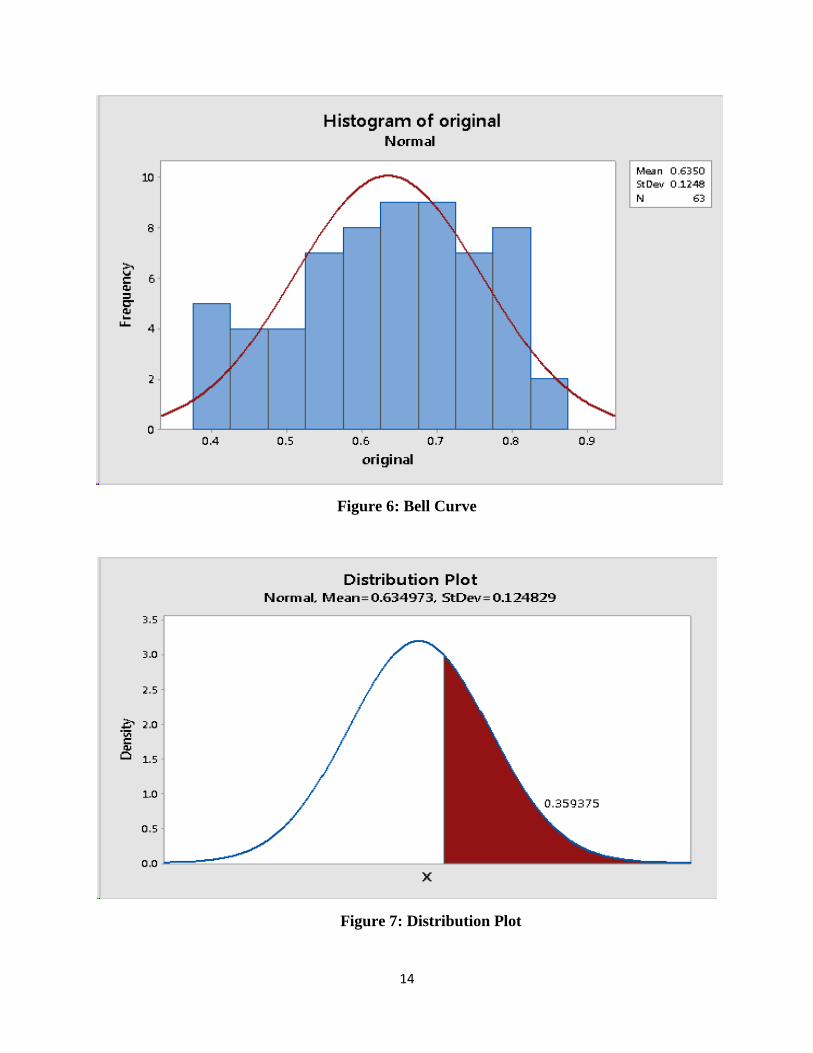
Displayed in the following is a diagram detailing our remaining group of fields. A normal
distribution curve was created showing the range of scores and how they stacked up against each
other. The distribution plot shows the percentile that was chosen and how it corresponds to the
normal curve. The top thirty-five percent was maintained for final ranking. This percentage was
chosen due to the fact there was an ideal separation on the curve where index scores above .7
corresponded to the top thirty-five percent.
14
Figure 6: Bell Curve
Figure 7: Distribution Plot
15
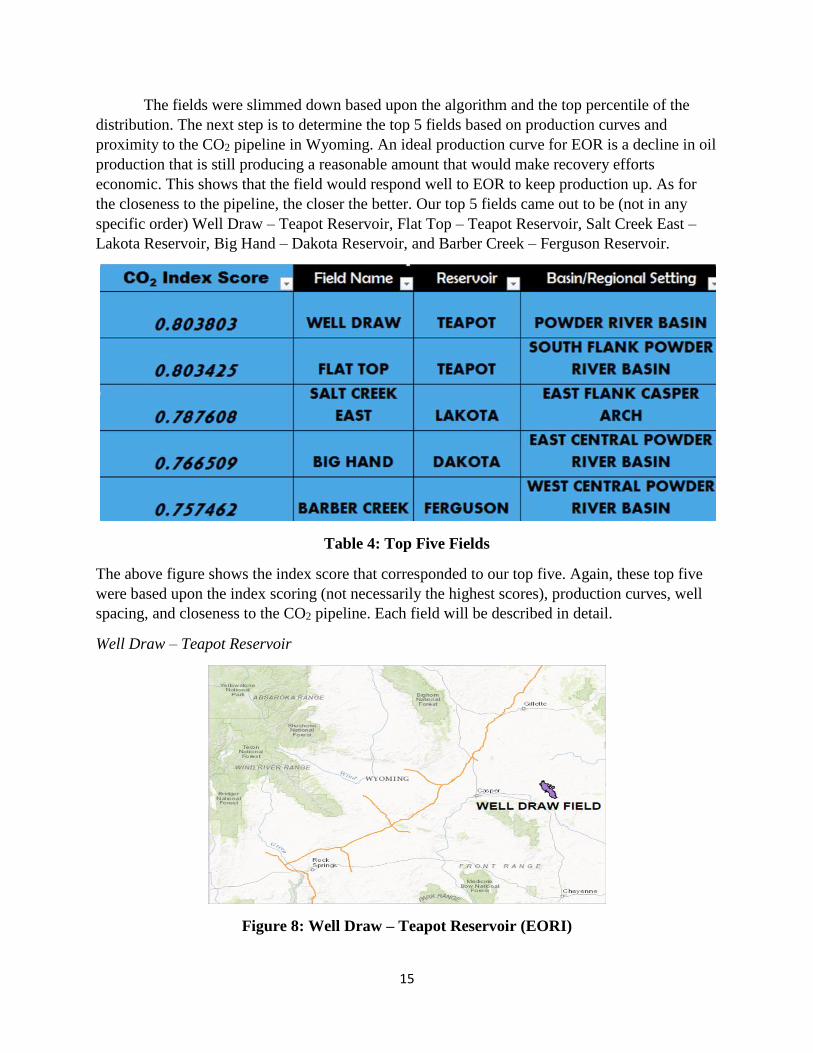
The fields were slimmed down based upon the algorithm and the top percentile of the
distribution. The next step is to determine the top 5 fields based on production curves and
proximity to the CO2 pipeline in Wyoming. An ideal production curve for EOR is a decline in oil
production that is still producing a reasonable amount that would make recovery efforts
economic. This shows that the field would respond well to EOR to keep production up. As for
the closeness to the pipeline, the closer the better. Our top 5 fields came out to be (not in any
specific order) Well Draw – Teapot Reservoir, Flat Top – Teapot Reservoir, Salt Creek East –
Lakota Reservoir, Big Hand – Dakota Reservoir, and Barber Creek – Ferguson Reservoir.
Table 4: Top Five Fields
The above figure shows the index score that corresponded to our top five. Again, these top five
were based upon the index scoring (not necessarily the highest scores), production curves, well
spacing, and closeness to the CO2 pipeline. Each field will be described in detail.
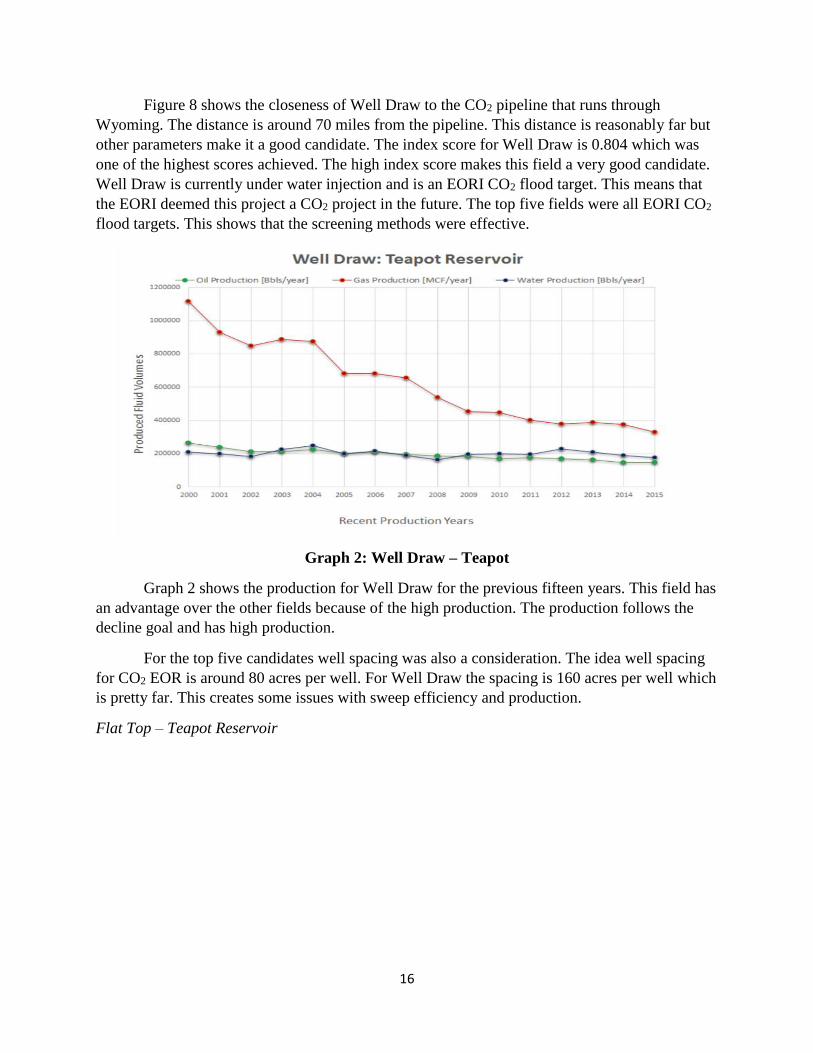
Well Draw – Teapot Reservoir
Figure 8: Well Draw – Teapot Reservoir (EORI)
16
Figure 8 shows the closeness of Well Draw to the CO2 pipeline that runs through
Wyoming. The distance is around 70 miles from the pipeline. This distance is reasonably far but
other parameters make it a good candidate. The index score for Well Draw is 0.804 which was
one of the highest scores achieved. The high index score makes this field a very good candidate.
Well Draw is currently under water injection and is an EORI CO2 flood target. This means that
the EORI deemed this project a CO2 project in the future. The top five fields were all EORI CO2
flood targets. This shows that the screening methods were effective.
Graph 2: Well Draw – Teapot
Graph 2 shows the production for Well Draw for the previous fifteen years. This field has
an advantage over the other fields because of the high production. The production follows the
decline goal and has high production.
For the top five candidates well spacing was also a consideration. The idea well spacing
for CO2 EOR is around 80 acres per well. For Well Draw the spacing is 160 acres per well which
is pretty far. This creates some issues with sweep efficiency and production.
Flat Top – Teapot Reservoir
17
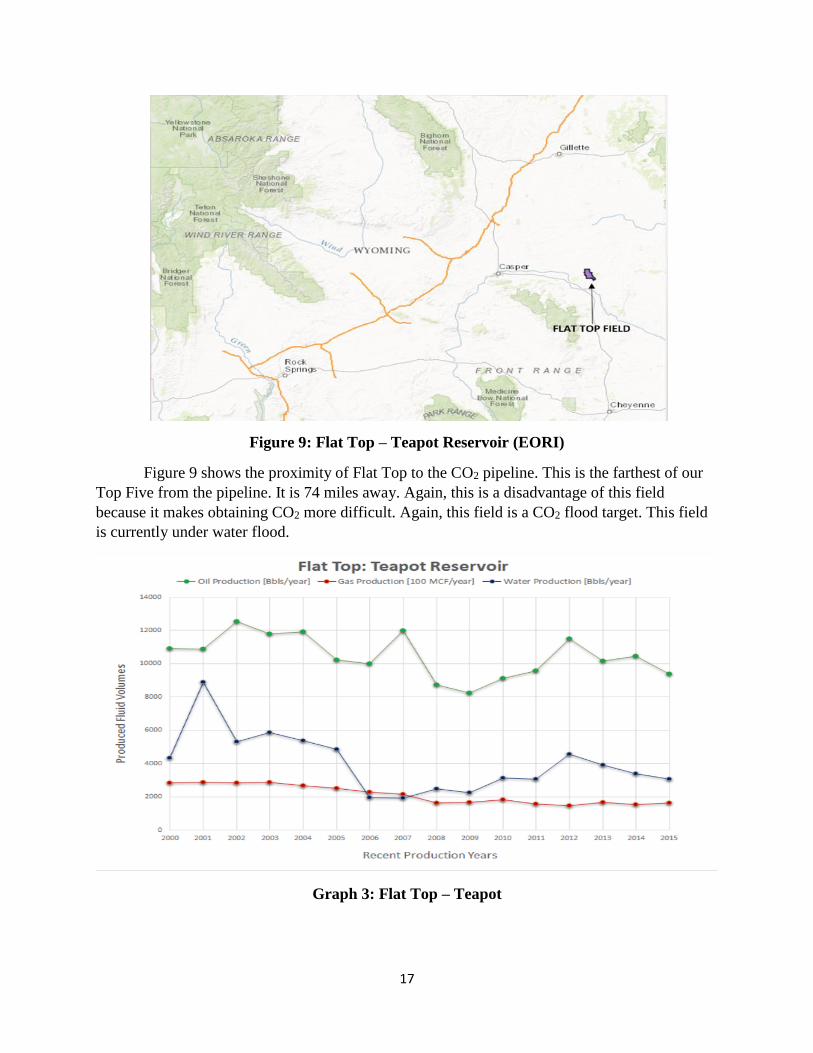
Figure 9: Flat Top – Teapot Reservoir (EORI)
Figure 9 shows the proximity of Flat Top to the CO2 pipeline. This is the farthest of our
Top Five from the pipeline. It is 74 miles away. Again, this is a disadvantage of this field
because it makes obtaining CO2 more difficult. Again, this field is a CO2 flood target. This field
is currently under water flood.
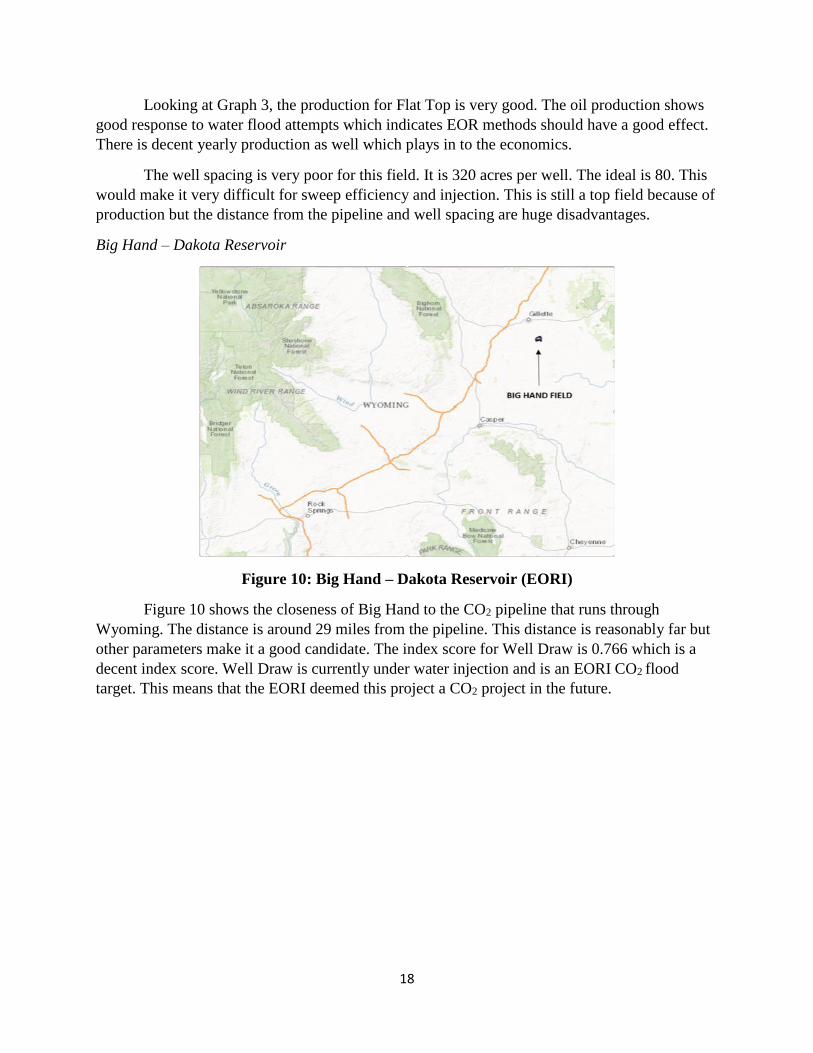
Graph 3: Flat Top – Teapot
18
Looking at Graph 3, the production for Flat Top is very good. The oil production shows
good response to water flood attempts which indicates EOR methods should have a good effect.
There is decent yearly production as well which plays in to the economics.
The well spacing is very poor for this field. It is 320 acres per well. The ideal is 80. This
would make it very difficult for sweep efficiency and injection. This is still a top field because of
production but the distance from the pipeline and well spacing are huge disadvantages.
Big Hand – Dakota Reservoir
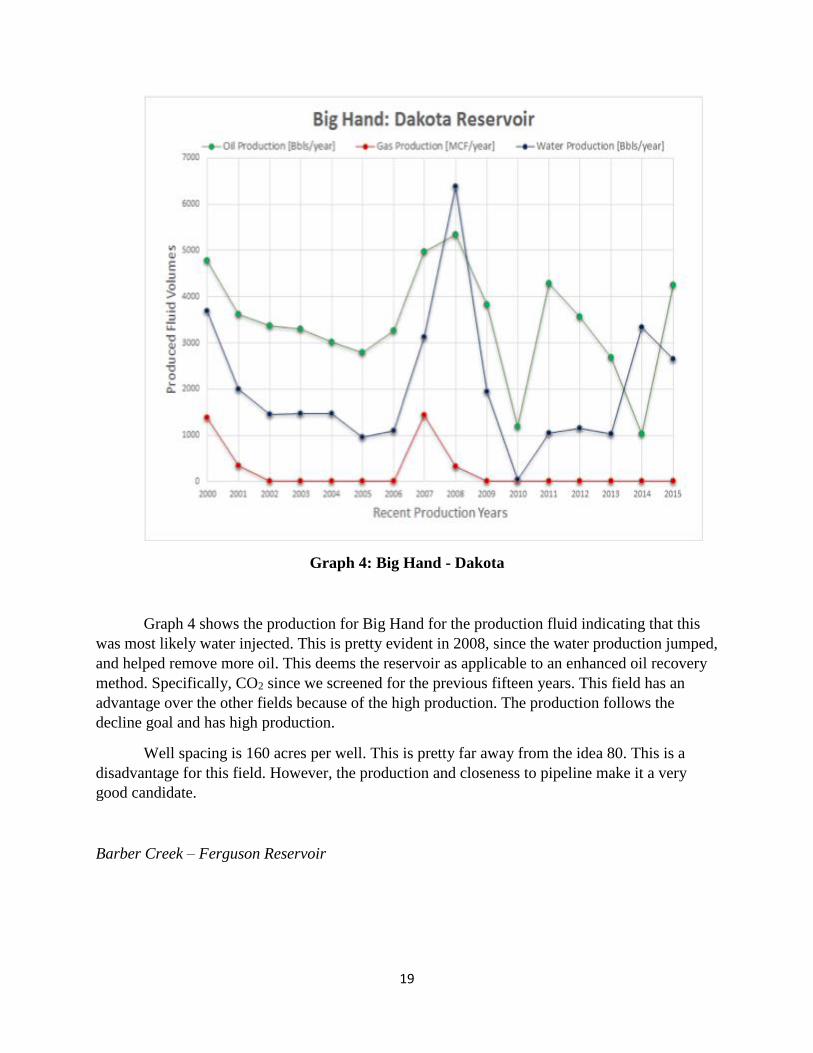
Figure 10: Big Hand – Dakota Reservoir (EORI)
Figure 10 shows the closeness of Big Hand to the CO2 pipeline that runs through
Wyoming. The distance is around 29 miles from the pipeline. This distance is reasonably far but
other parameters make it a good candidate. The index score for Well Draw is 0.766 which is a
decent index score. Well Draw is currently under water injection and is an EORI CO2 flood
target. This means that the EORI deemed this project a CO2 project in the future.
19
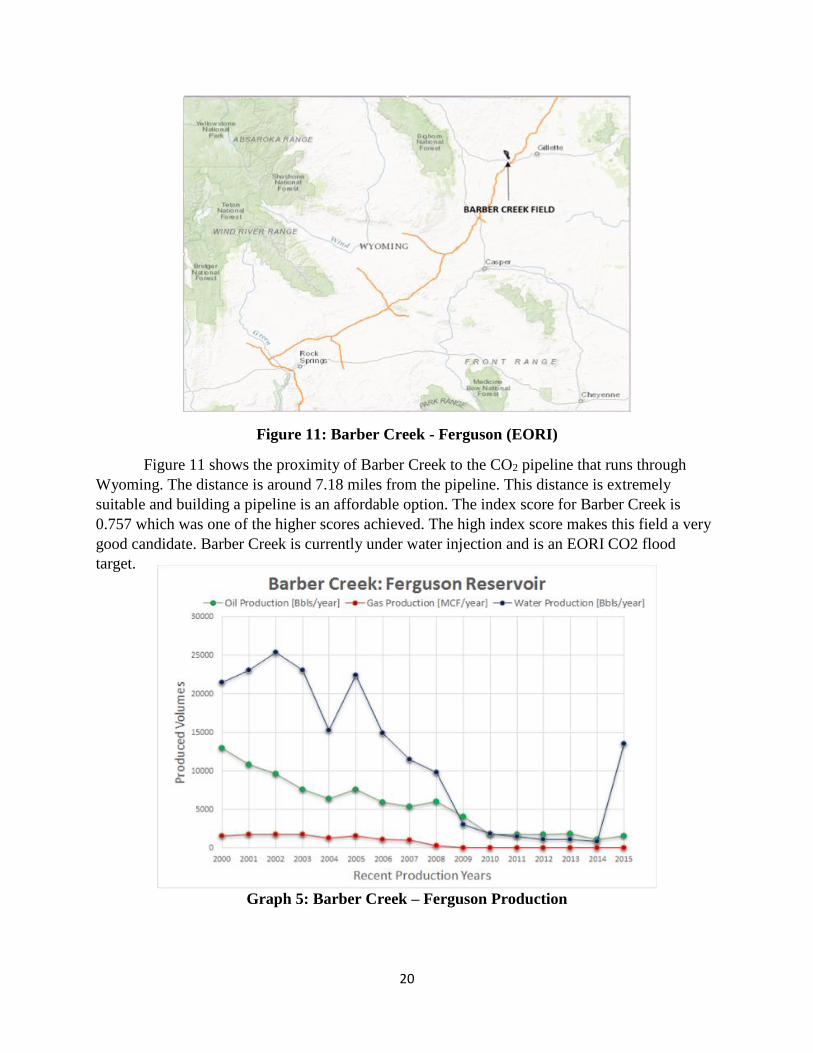
Graph 4: Big Hand - Dakota
Graph 4 shows the production for Big Hand for the production fluid indicating that this
was most likely water injected. This is pretty evident in 2008, since the water production jumped,
and helped remove more oil. This deems the reservoir as applicable to an enhanced oil recovery
method. Specifically, CO2 since we screened for the previous fifteen years. This field has an
advantage over the other fields because of the high production. The production follows the
decline goal and has high production.
Well spacing is 160 acres per well. This is pretty far away from the idea 80. This is a
disadvantage for this field. However, the production and closeness to pipeline make it a very
good candidate.
Barber Creek – Ferguson Reservoir
20
Figure 11: Barber Creek - Ferguson (EORI)
Figure 11 shows the proximity of Barber Creek to the CO2 pipeline that runs through
Wyoming. The distance is around 7.18 miles from the pipeline. This distance is extremely
suitable and building a pipeline is an affordable option. The index score for Barber Creek is
0.757 which was one of the higher scores achieved. The high index score makes this field a very
good candidate. Barber Creek is currently under water injection and is an EORI CO2 flood
target.
Graph 5: Barber Creek – Ferguson Production
21
Graph 5 shows the production from Barber Creek. It is obvious water was injected this
field until the end of the year 2015. It can be seen, there is steady water production as the oil is
declining. The group determined that utilizing a CO2 flood would help stimulate the production.
Rebuilding reservoir pressure shouldn't be the problem, using a different fluid phase to move the
oil would help, and CO2 would achieve this.
The well spacing for barber creek is 80 acres per well. This is very ideal and a big
advantage for this field. The closeness to pipeline and well spacing are big advantages for this
field.
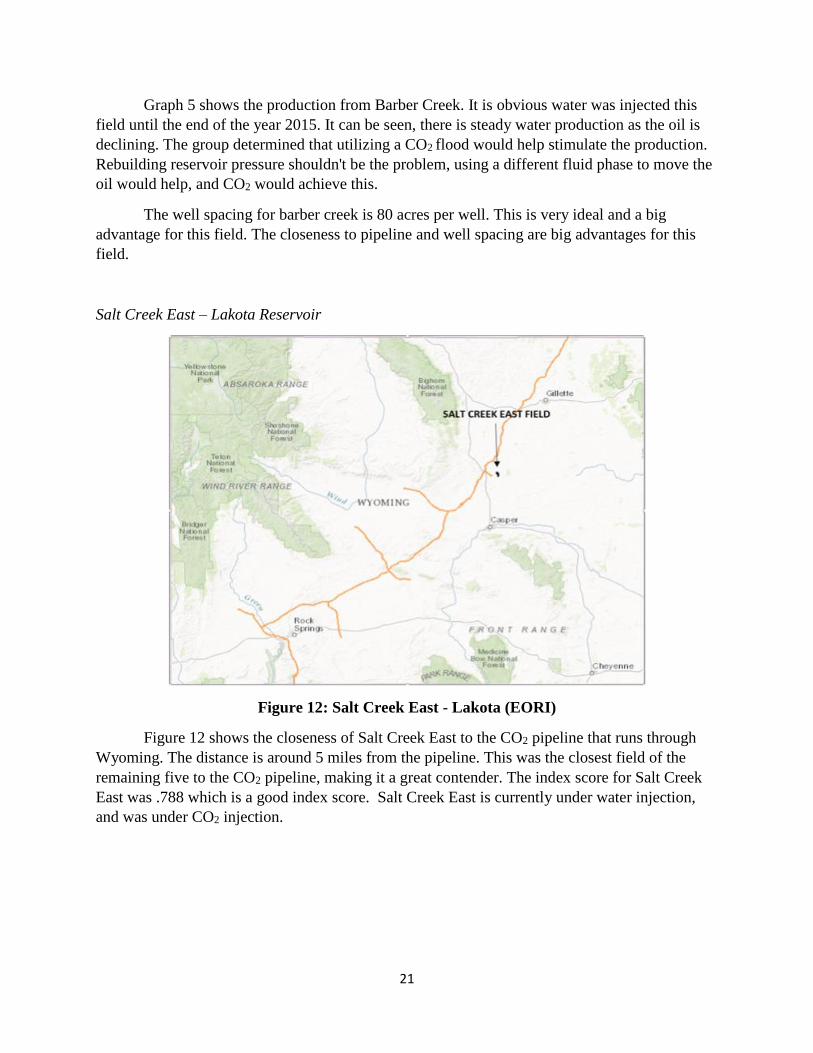
Salt Creek East – Lakota Reservoir
Figure 12: Salt Creek East - Lakota (EORI)
Figure 12 shows the closeness of Salt Creek East to the CO2 pipeline that runs through
Wyoming. The distance is around 5 miles from the pipeline. This was the closest field of the
remaining five to the CO2 pipeline, making it a great contender. The index score for Salt Creek
East was .788 which is a good index score. Salt Creek East is currently under water injection,
and was under CO2 injection.
22
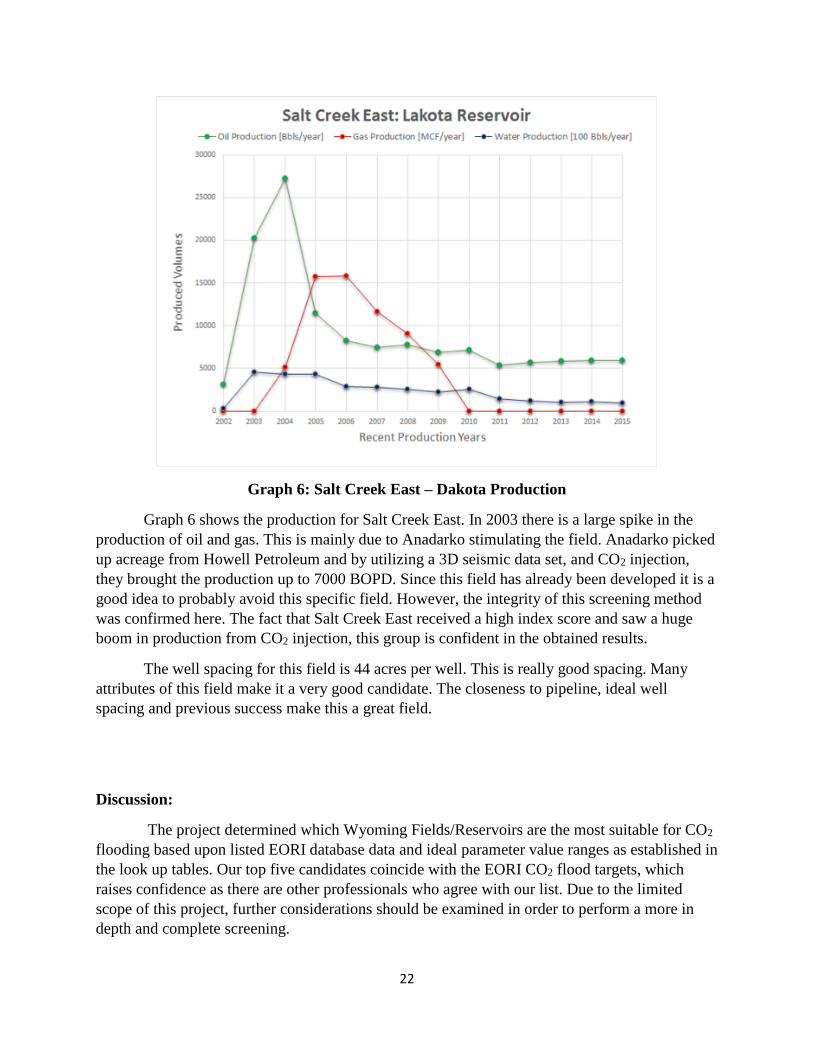
Graph 6: Salt Creek East – Dakota Production
Graph 6 shows the production for Salt Creek East. In 2003 there is a large spike in the
production of oil and gas. This is mainly due to Anadarko stimulating the field. Anadarko picked
up acreage from Howell Petroleum and by utilizing a 3D seismic data set, and CO2 injection,
they brought the production up to 7000 BOPD. Since this field has already been developed it is a
good idea to probably avoid this specific field. However, the integrity of this screening method
was confirmed here. The fact that Salt Creek East received a high index score and saw a huge
boom in production from CO2 injection, this group is confident in the obtained results.
The well spacing for this field is 44 acres per well. This is really good spacing. Many
attributes of this field make it a very good candidate. The closeness to pipeline, ideal well
spacing and previous success make this a great field.
Discussion:
The project determined which Wyoming Fields/Reservoirs are the most suitable for CO2
flooding based upon listed EORI database data and ideal parameter value ranges as established in
the look up tables. Our top five candidates coincide with the EORI CO2 flood targets, which
raises confidence as there are other professionals who agree with our list. Due to the limited
scope of this project, further considerations should be examined in order to perform a more in
depth and complete screening.
23
Further considerations consist of analyzing the geological formations of each field and
reservoir to determine how conducive the associated traps would be with miscible CO2 flooding.
In addition, further economic considerations should be performed such as price of CO2 as
compared to price of crude to evaluate whether at that certain period of time is an economical
opportunity to utilize CO2 flooding or not.
Reservoir simulations of the final field/reservoirs would provide a very accurate and
more insightful determination on how the field/reservoir would respond to a CO2 flood. With
implementing the combination of all of these further considerations, a very appropriate
determination can be made on whether to initiate a CO2 flooding project or not.
Conclusion:
This project was a very challenging endeavor to take on due to the fact that the process of
EOR screening is very subjective in many areas. This project forced us to collaborate efficiently
as a cohesive unit to complete the project. The group utilized the collection of all of our
Petroleum Engineering, problem solving, presentation, and time management skills. In the end,
the entire group feels very comfortable and knowledgeable on how to perform a basic EOR
screening for any method out in the field.
At the conclusion of Undergraduate Research day, the group felt the project and
presentation put forward was an excellent and polished product which demonstrates two
semesters of hard, diligent work.
24
References:
1. Wyoming Oil and Gas Conservation Commission. Web. 28 Apr. 2016.
<http://wogcc.state.wy.us/>.
2. Enhanced Oil Recovery Institute. Web. 28 Apr. 2016. <http://eori.wygisc.org/>.
3. AAPG Datapages/Archives. Web. 28 Apr. 2016.
<http://archives.datapages.com/>
4. Taber, J. J., F. D. Martin, and R. S. Seright. EOR Screening Criteria Revisited-
Part 2: Applications and Impact of Oil Prices. Society of Petroleum Engineers. New
Mexico Petroleum Recovery Research Center, Aug. 1997. Web. Jan.
2016.