www.elana.net using technical analysis in securities trading ivaylo penev, cfa portfolio manager,...
TRANSCRIPT

www.elana.net
Using Technical Analysis in Securities
Trading
Ivaylo Penev, CFA
Portfolio Manager, ELANA Fund Management

www.elana.net www.elana.net
What is Technical Analysis?
Method of evaluating securities by analyzing statistics generated by market activity, such as past prices and volume.
Market action is defined by:
Price actionVolumeOpen Interest

www.elana.net www.elana.net
What is Technical Analysis?
Price action – price dynamics during a period
Volume – the amount of shares/contracts traded for a period
Open Interest – the number of options/futures contracts that are not closed or delivered on a particular day

www.elana.net www.elana.net
Premises of Technical Analysis
Price movements represent all the information available
Prices move in trends
History repeats itself or as Mart Twain said – History does not repeat itself, but it often rhymes

www.elana.net www.elana.net
Chart Types
Line charts
Bar charts
Candlestick charts
Dot charts
Point and figure charts

www.elana.net www.elana.net
Chart Types - Line

www.elana.net www.elana.net
Chart Types - Bar

www.elana.net www.elana.net
Chart Types - Candle

www.elana.net www.elana.net
Candlesticks

www.elana.net www.elana.net
Technical Analysis in Practice
Trend lines
Support and resistance level
Chart patterns – continuation and reversal
Indicators
Other tools

www.elana.net www.elana.net
Trend lines - upward

www.elana.net www.elana.net
Trend lines - downward

www.elana.net www.elana.net
Support and Resistance levels - Definition
Support level – in a down move support is the level where price tends to stop it’s fall at least temporary
Resistance level – the opposite of support, in an up move this is the level where price tends to stop it’s rise at least temporary
Once broken support levels turn to resistance levels and vice versa

www.elana.net www.elana.net
Support and resistance levels

www.elana.net www.elana.net
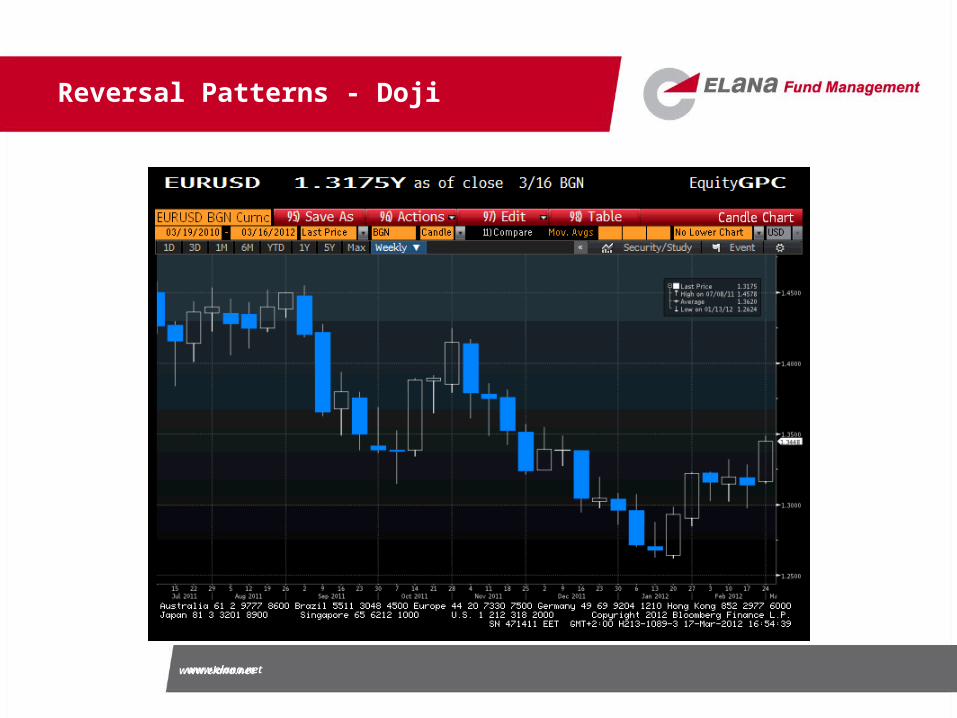
Reversal Patterns - Doji

www.elana.net www.elana.net
Reversal Patterns - Doji
www.elana.net www.elana.net
Reversal Patterns - Doji

www.elana.net www.elana.net
Reversal Patterns – Head and Shoulders

www.elana.net www.elana.net
Reversal Patterns – Double Tops

www.elana.net www.elana.net
Reversal Patterns –Double Bottoms

www.elana.net www.elana.net
Indicators – Moving Average

www.elana.net www.elana.net
Indicators – Bollinger Bands

www.elana.net www.elana.net
Fibonacci Retracements

www.elana.net www.elana.net
Final Words
Technical vs. Fundamental Analysis orTechnical + Fundamental Analysis
Combinations of Indicators
The Trend is Your Friend
A triple top or bottom is a failed double top or bottom

www.elana.net
ЕLANA Fund ManagementSopharma Business Towers5, Lachezar Stanchev str., tower B, Sofia 1756tel.: +359 2 81 000 40, fax: +359 2 95 815 [email protected]