© copyright 2005, cleantech venture network, all rights reserved date: presented by: “cleantech...
TRANSCRIPT
www.cleantech.com© Copyright 2005, Cleantech Venture Network, All rights reserved
Date:
Presented By:
“Cleantech Investment: Patterns, Performance and Prospects”Alternative Investments Workshop University of Toronto
April 20th 2006
Nicholas Parker, ChairmanCleantech Capital Group LLC

www.cleantech.com© Copyright 2005, Cleantech Venture Network, All rights reserved
Is this Important?Is this Important?
Since 1999, 1080 investors have placed more than $8.2 Bn into 1227 ‘cleantech’ venture deals in North America with an estimated additional $4.0Bn in the ROW. (This excludes IPO, debt and project-related financings).
Why? So?

www.cleantech.com© Copyright 2005, Cleantech Venture Network, All rights reserved
AgendaAgenda
• Defining the “cleantech” space
• Cleantech Venture Investment Trends
• Corporate Cleantech Activity
• Making Money in Cleantech
• Opportunities and Challenges

www.cleantech.com© Copyright 2005, Cleantech Venture Network, All rights reserved
Cleantech Venture NetworkCleantech Venture Network
The Cleantech Venture Network™ LLC is a membership organization bringing insight, opportunities and relationships to investors, entrepreneurs and service providers interested in clean technology.
We introduced the "cleantech" concept in 2002 and have since popularized it as a viable investment category.
Principal office in Ann Arbor, Michigan with a presence on US West Coast, Australia, Canada, China and Europe.
We provide information products, related services, and the Cleantech Venture Forum™ series of events,
Cleantech Venture Network ™ is part of the Cleantech Capital Group
LLC

www.cleantech.com© Copyright 2005, Cleantech Venture Network, All rights reserved
Accomplishments since LaunchAccomplishments since Launch
• Achieved operating profit on initial investment.• Met or exceeded all key business plan milestones• 300+ full members: 950 affiliate members• Nine highly successful forums in North America and Europe• Cleantech Venture Monitor (established as the source on
cleantech venturing: media coverage in over 200 publications
• Published two groundbreaking research studies.• Sophisticated front and backend website• High-profile venture advisory boards in NA and EU• US, Canada, EU, Australia and China presence• Launched Cleantech Index• “cleantech” recognized as an investment category

www.cleantech.com© Copyright 2005, Cleantech Venture Network, All rights reserved
Accomplishments by NumbersAccomplishments by Numbers
• Tracked:• nearly $10.0B of venture investments,
• $94B in M&A transactions,
• over 100 IPOs
• Facilitated over $500M in financings• Identified approximately 1100 investors in 1200+ venture
rounds• Directly sourced > 600 new deals for our members• Profiled more than 190 pre-qualified investment
opportunities at our Venture Forums • More than 2000 Forum investor attendees• Built first cleantech index of publicly-traded stocks• Avg. 340,000 hits per month on cleantech.com• Built a core team of twelve FT equivalent employees
www.cleantech.com© Copyright 2005, Cleantech Venture Network, All rights reserved
Cleantech Proprietary ResearchCleantech Proprietary Research
• Responding to unmet demand for authoritative research on the state, performance & opportunities in the cleantech area.
• March 05 published Cleantech Venture Investing: Patterns & Performance the most comprehensive study of its kind ever undertaken.
• January 06 published Cleantech Capital Report 2006 a unique 10 year view on cleantech VC flows and trends. (European version to be published June 06)
• Future reports include:
• Cleantech Capital Directory (online version live)
• Other specialized publications, e.g. Cleantech M&A, CleanBio, M2M, Watertech, Solar in China.

www.cleantech.com© Copyright 2005, Cleantech Venture Network, All rights reserved
Cleantech DefinedCleantech Defined
• Cleantech embraces knowledge-based products and services that:
• optimize the use of natural resources,
• while reducing ecological impact and
• adding economic value by significantly lowering cost and improving profitability.
• Not classic “environmental” technology – more like “biotech” as an investment theme.
• Now fifth largest venture investment category with nearly 10% market share (Q4 2005)

www.cleantech.com© Copyright 2005, Cleantech Venture Network, All rights reserved
The Next Industrial RevolutionThe Next Industrial Revolution
Alongside the information revolution is an industrial revolution reshaping the design and manufacture of almost everything that we see around us. The disruptive products being developed today have significant improvements over the old because they:
Are lighter, smarter and stronger.
Are cheaper to manufacture and operate.
Are less carbon-intensive and more energy efficient
Offer greater service utility per unit of material input
Enable virtually zero waste and/or emissions
Cleantech is emerging as the enabling technology of modern industrial society; the next and
necessary wave of venture innovation in a natural resource constrained world.
www.cleantech.com© Copyright 2005, Cleantech Venture Network, All rights reserved
Cleantech is not EnvirotechCleantech is not Envirotech
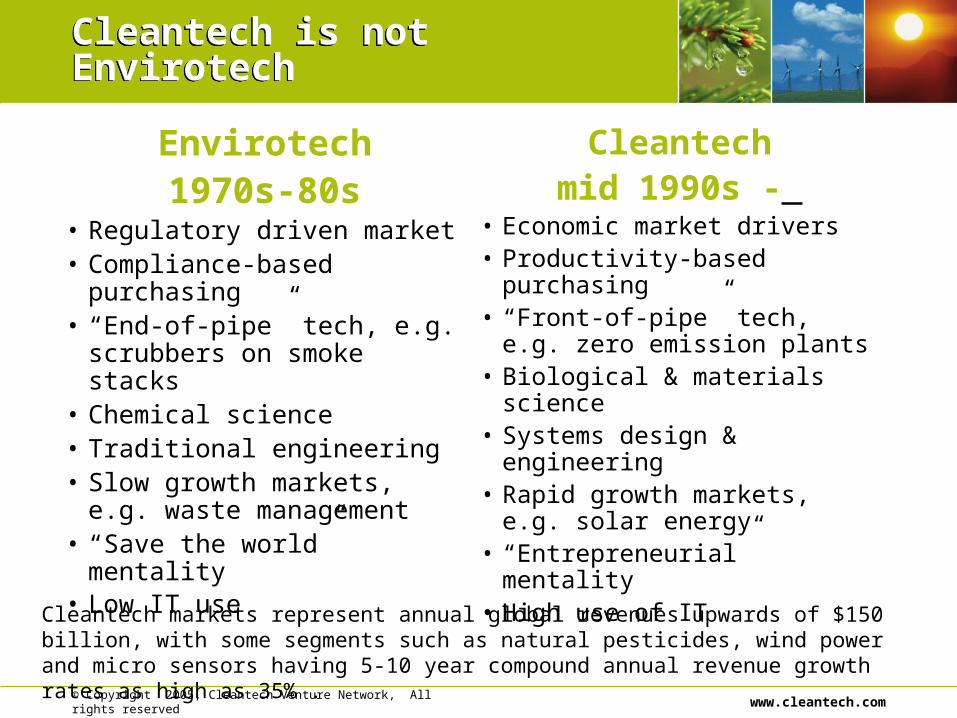
Envirotech1970s-80s
• Regulatory driven market• Compliance-based purchasing• “End-of-pipe” tech, e.g.
scrubbers on smoke stacks• Chemical science• Traditional engineering• Slow growth markets, e.g.
waste management• “Save the world” mentality• Low IT use
Cleantechmid 1990s -
• Economic market drivers• Productivity-based purchasing• “Front-of-pipe” tech, e.g. zero
emission plants• Biological & materials science• Systems design & engineering• Rapid growth markets, e.g.
solar energy• “Entrepreneurial” mentality• High use of IT
Cleantech markets represent annual global revenues upwards of $150 billion, with some segments such as natural pesticides, wind power and micro sensors having 5-10 year compound annual revenue growth rates as high as 35% .

www.cleantech.com© Copyright 2005, Cleantech Venture Network, All rights reserved
Cleantech ExamplesCleantech Examples
Agriculture - bio-based materials, farm efficiency technologies, micro-irrigation systems and natural pesticides
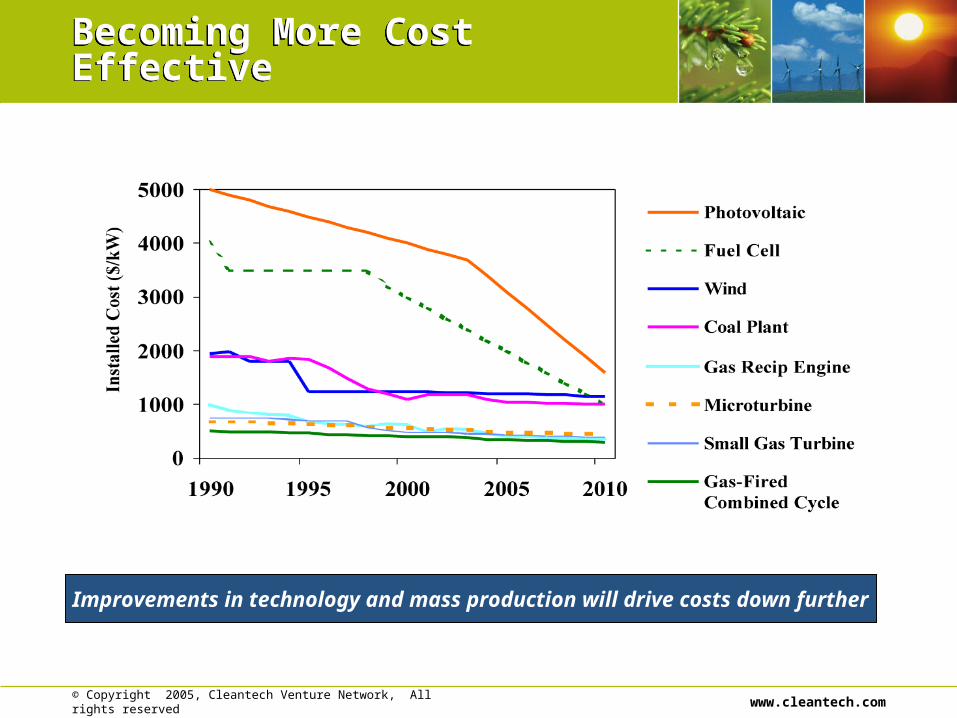
Energy - distributed and renewable energy generation and conversion (including fuel cells, geothermal, wind and photovoltaics); energy management systems; superconducting transmission; energy storage and power quality; key enabling technologies; and related Internet and information technology-based services
Manufacturing - advanced packaging; high value materials recovery; natural chemistry; sensors; smart construction materials; and precision manufacturing instruments.
Transportation - hybrid vehicles, lighter materials, smart logistics software and telecommuting
Water - water recycling and ultra-filtration systems (UV and membrane based systems), sensors and automation systems and desalination equipment
www.cleantech.com© Copyright 2005, Cleantech Venture Network, All rights reserved
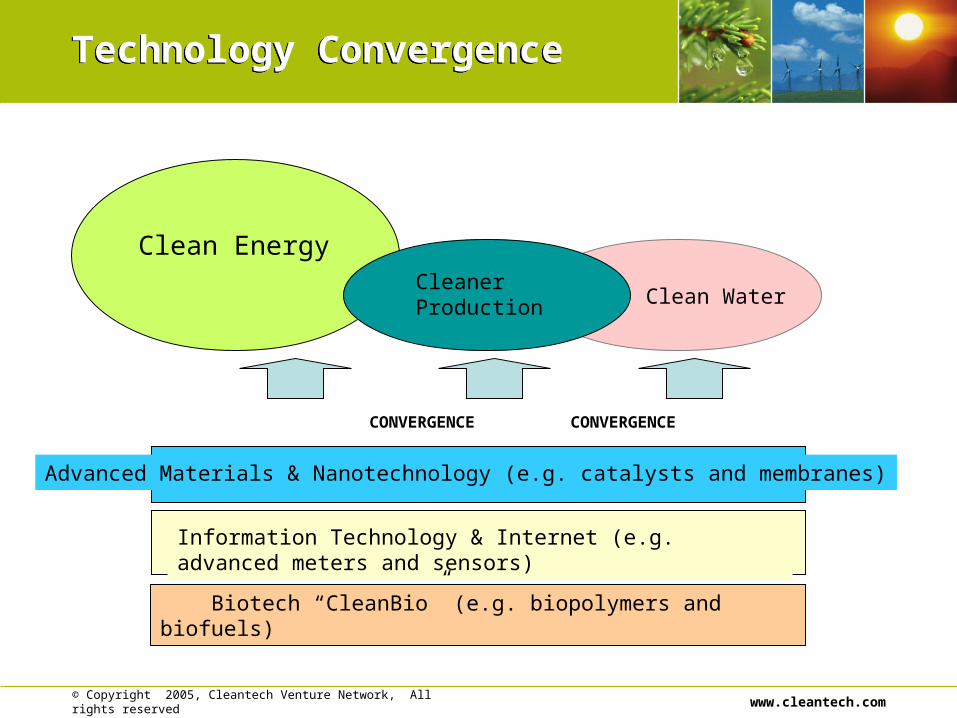
Technology ConvergenceTechnology Convergence
Clean Energy
Clean WaterCleaner Production
Advanced Materials & Nanotechnology (e.g. catalysts and membranes)
Information Technology & Internet (e.g. advanced meters and sensors)
CONVERGENCE CONVERGENCE
Biotech “CleanBio” (e.g. biopolymers and biofuels)
www.cleantech.com© Copyright 2005, Cleantech Venture Network, All rights reserved
Becoming More Cost EffectiveBecoming More Cost Effective
Improvements in technology and mass production will drive costs down further

www.cleantech.com© Copyright 2005, Cleantech Venture Network, All rights reserved
Cleantech Venture Investing1999-2005Cleantech Venture Investing1999-2005
Total Cleantech Venture Investing 1999-2005: $8.2bn
US and Canadian Cleantech Venture Deals by Year, 1999- 2005
191
246
205222
108
134121
0
200
400
600
800
1000
1200
1400
1600
1800
2000
1999 2000 2001 2002 2003 2004 2005
$US
m
0
50
100
150
200
250
300
Nu
mb
er o
f d
eals

www.cleantech.com© Copyright 2005, Cleantech Venture Network, All rights reserved
Cleantech investment by Quarter 1999-2005Cleantech investment by Quarter 1999-2005
Cleantech is growing as an investment category: Now receiving 9+% of all VC in North America
U.S. and Canadian Cleantech Venture Deals by Quarter and as a percentage of total VC (by amount), 1999-2005
5%
6%5%
3%
1%1%2%
3%
2%1% 1%
1%
2% 2%2%
6%6%
5%5%
4%
5%
4%4%
5%
6%
4%
7%
9%
0
100
200
300
400
500
600
700
800
900
19
99
Q1
19
99
Q2
19
99
Q3
19
99
Q4
20
00
Q1
20
00
Q2
20
00
Q3
20
00
Q4
20
01
Q1
20
01
Q2
20
01
Q3
20
01
Q4
20
02
Q1
20
02
Q2
20
02
Q3
20
02
Q4
20
03
Q1
20
03
Q2
20
03
Q3
20
03
Q4
20
04
Q1
20
04
Q2
20
04
Q3
20
04
Q4
20
05
Q1
20
05
Q2
20
05
Q3
20
05
Q4
$ US m
0%
1%
2%
3%
4%
5%
6%
7%
8%
9%
10%

www.cleantech.com© Copyright 2005, Cleantech Venture Network, All rights reserved
Cleantech Venture Investing1999-2005Cleantech Venture Investing1999-2005
Cleantech Periods, $ invested & number of deals
$4,944$3,233
618
363
$0
$1,000
$2,000
$3,000
$4,000
$5,000
$6,000
Q1 1999 - Q4 2001 Q1 2002 - Q4 2005
Bubble and Burst Learning and Diversification
$US
m
0
100
200
300
400
500
600
700
Nu
mb
er o
f d
eals
$ invested US m
Number of deals
Europe is about 40% and Asia 10% of North America
www.cleantech.com© Copyright 2005, Cleantech Venture Network, All rights reserved
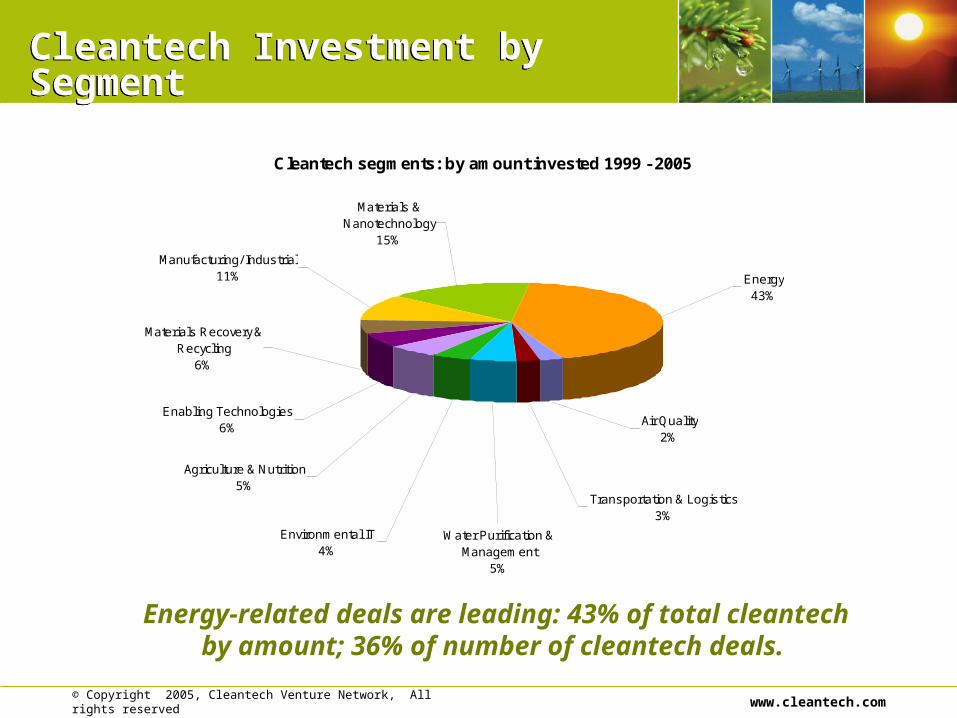
Cleantech Investment by SegmentCleantech Investment by Segment
Energy-related deals are leading: 43% of total cleantech by amount; 36% of number of cleantech deals.
Cleantech segments: by amount invested 1999 - 2005
Materials & Nanotechnology
15%
Manufacturing/ Industrial11%
Materials Recovery & Recycling
6%
Enabling Technologies6%
Agriculture & Nutrition5%
Water Purification & Management
5%
Transportation & Logistics3%
Air Quality2%
Environmental IT4%
Energy43%

www.cleantech.com© Copyright 2005, Cleantech Venture Network, All rights reserved
Investment by Region Investment by Region
Percentage of total amount invested in cleantech by Region (1999-Q3 2005)
Source: Cleantech Venture Network, 2006
Northwest4%
Eastern Canada5%Midwest
9%
Northeast27%
Rockies/Plains3%
Southeast8%
Southwest6%
West Coast35%
Western Canada3%
The West Coast and North East receive over 60% of all cleantech venture capital: Canada takes 9%

www.cleantech.com© Copyright 2005, Cleantech Venture Network, All rights reserved
Cleantech investment by Round and RegionCleantech investment by Round and Region
Amount and number of cleantech deals by Round and Region, 1999 - 2005
125
3225
183181
232526
4652
41
85
141
70
38
5748
29
-
500
1,000
1,500
2,000
Wes
tern
Can
ada
Eas
tern
Can
ada
Nor
thw
est
Sou
thea
st
Roc
kies
/Pla
ins
Sou
thw
est
Mid
wes
t
Nor
thea
st
Wes
t Coa
st
Wes
tern
Can
ada
Eas
tern
Can
ada
Nor
thw
est
Sou
thea
st
Roc
kies
/Pla
ins
Sou
thw
est
Mid
wes
t
Nor
thea
st
Wes
t Coa
st
First Round Follow -on
$US m
0
20
40
60
80
100
120
140
160
180
200
Nu
mb
er o
f d
eals
The Northeast receives 25% of all First Round Cleantech Investments

www.cleantech.com© Copyright 2005, Cleantech Venture Network, All rights reserved
Cleantech investment 1999-2005Cleantech investment 1999-2005
US and Canadian Cleantech Deals by Quarter, Q1 1999- Q2 2005, by Amount and Number of deals.
47
53
76
50
55
65
60
41
2321
36 36
16
3532
242626
534947
59
464743
515142
0
100
200
300
400
500
600
700
800
900
1999
Q1
1999
Q2
1999
Q3
1999
Q4
2000
Q1
2000
Q2
2000
Q3
2000
Q4
2001
Q1
2001
Q2
2001
Q3
2001
Q4
2002
Q1
2002
Q2
2002
Q3
2002
Q4
2003
Q1
2003
Q2
2003
Q3
2003
Q4
2004
Q1
2004
Q2
2004
Q3
2004
Q4
2005
Q1
2005
Q2
2005
Q3
2005
Q4
$ U
S m
0
10
20
30
40
50
60
70
80
Num
ber
of c
lean
tech
dea
ls

www.cleantech.com© Copyright 2005, Cleantech Venture Network, All rights reserved
US Cleantech rounds as % of total US VCUS Cleantech rounds as % of total US VC
US cleantech % of total US VC: comparing first round and follow-on rounds (by amount and number of deals)
8%10%
9%
5%
3%1%
1%
1%
2%
4%
5%
11%
8%
9%
4% 4% 4%
5%
1%2%
1%
5%4%4%
5%
2%
2%
3%
0%
2%
4%
6%
8%
10%
12%
1999 2000 2001 2002 2003 2004 Q1 - Q2 2005
% o
f U
S c
lea
nte
ch
to
US
to
tal V
C
First Round ($ amount)
First Round (# of deals)
Follow-on ($ amount)
Follow-on (# of deals)
Source of all US VC data: PWC/Venture Economics/ NVCA

www.cleantech.com© Copyright 2005, Cleantech Venture Network, All rights reserved
2006 Onward – Growth & ROI2006 Onward – Growth & ROI
Three periods of cleantech, $ amounts and numbers of deals invested Q 1999-Q2 2005 and projected for Q3 2005-Q4 2009
$3,233 $4,944 $8,487
618
1,489
363
$0
$1,000
$2,000
$3,000
$4,000
$5,000
$6,000
$7,000
$8,000
$9,000
Q1 1999 - Q4 2001 Q1 2002 - Q4 2005 Q1 2006 - Q4 2008
Bubble and Burst Learning and Diversification Growth and Returns
$US
m
0
200
400
600
800
1,000
1,200
1,400
1,600
Nu
mb
er o
f d
eals
www.cleantech.com© Copyright 2005, Cleantech Venture Network, All rights reserved
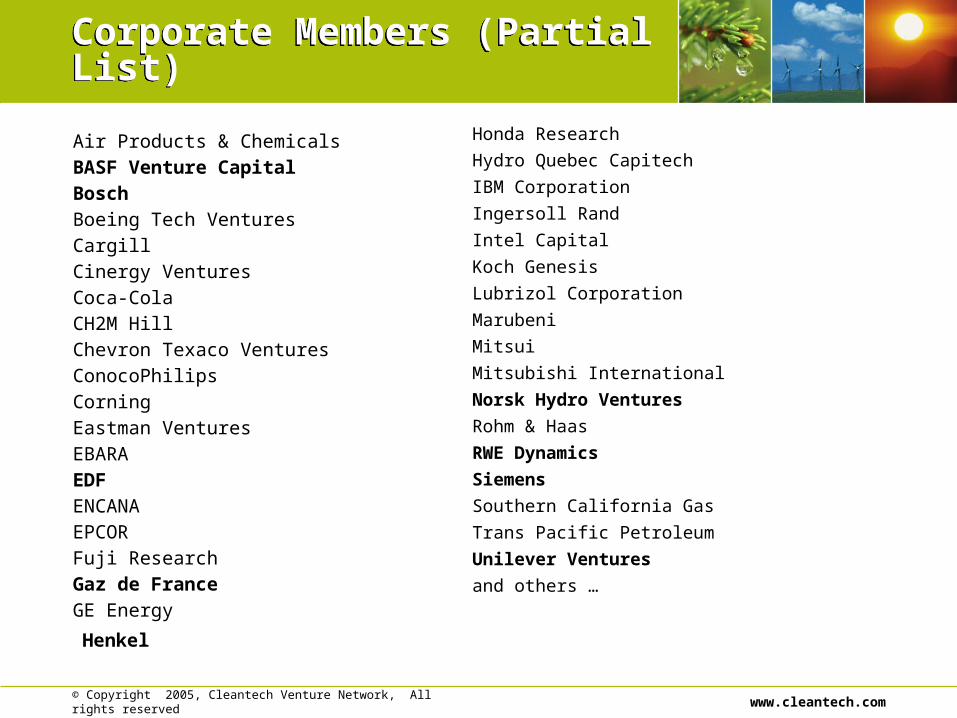
Corporate Members (Partial List)Corporate Members (Partial List)
Honda Research
Hydro Quebec Capitech
IBM Corporation
Ingersoll Rand
Intel Capital
Koch Genesis
Lubrizol Corporation
Marubeni
Mitsui
Mitsubishi International
Norsk Hydro Ventures
Rohm & Haas
RWE Dynamics
Siemens
Southern California Gas
Trans Pacific Petroleum
Unilever Ventures
and others …
Air Products & Chemicals
BASF Venture Capital
Bosch
Boeing Tech Ventures
Cargill
Cinergy Ventures
Coca-Cola
CH2M Hill
Chevron Texaco Ventures
ConocoPhilips
Corning
Eastman Ventures
EBARA
EDF
ENCANA
EPCOR
Fuji Research
Gaz de France
GE Energy
Henkel

www.cleantech.com© Copyright 2005, Cleantech Venture Network, All rights reserved
Who are the Buyers?Who are the Buyers?
Pharmaceutical, Semiconductor and Thermoelectric companies who use large quantities of ultra pure water
Automobile and Aircraft Manufacturers needing higher fuel efficiency from lighter materials
Utilities and Large Energy Users demanding reliable, affordable and low carbon power supplies
Consumer Electronics companies needing to reuse valuable components and materials
Agricultural producers requiring safer and more precise inputs and products
Logistics organizations seeking more efficient use of fleets and containers
www.cleantech.com© Copyright 2005, Cleantech Venture Network, All rights reserved
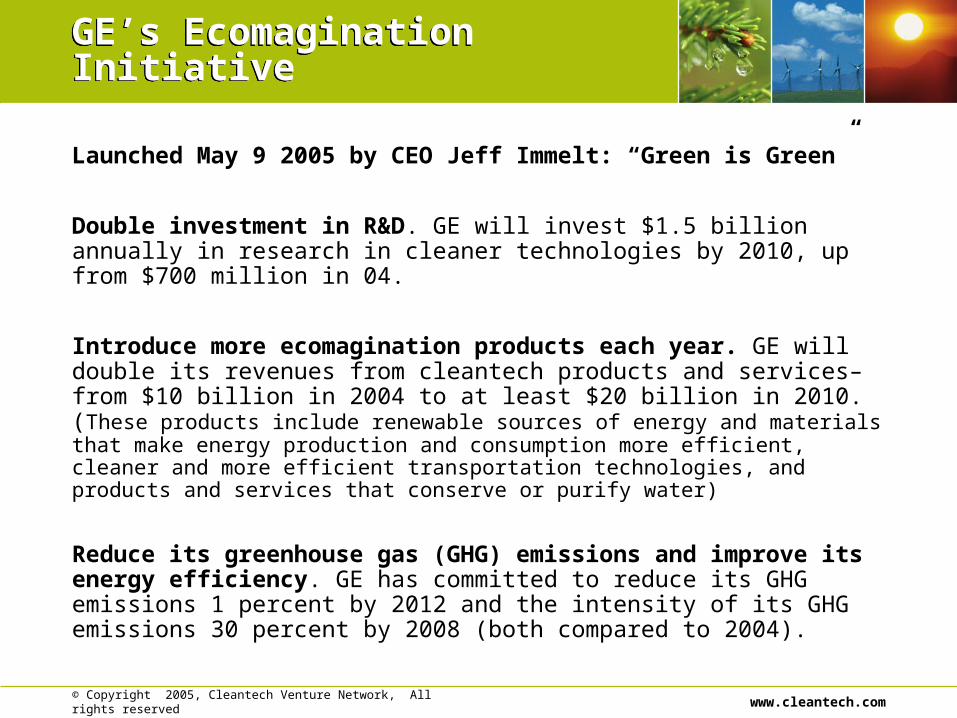
GE’s Ecomagination InitiativeGE’s Ecomagination Initiative
Launched May 9 2005 by CEO Jeff Immelt: “Green is Green”
Double investment in R&D. GE will invest $1.5 billion annually in research in cleaner technologies by 2010, up from $700 million in 04.
Introduce more ecomagination products each year. GE will double its revenues from cleantech products and services– from $10 billion in 2004 to at least $20 billion in 2010. (These products include renewable sources of energy and materials that make energy production and consumption more efficient, cleaner and more efficient transportation technologies, and products and services that conserve or purify water)
Reduce its greenhouse gas (GHG) emissions and improve its energy efficiency. GE has committed to reduce its GHG emissions 1 percent by 2012 and the intensity of its GHG emissions 30 percent by 2008 (both compared to 2004).

www.cleantech.com© Copyright 2005, Cleantech Venture Network, All rights reserved
BP Alternative EnergyBP Alternative Energy
Launched November 29 2005 by BP Chief Executive Lord Browne
Double its investments in the entire umbrella of alternative and renewable energy technologies.
Manage an investment program in solar, wind, hydrogen and combined-cycle-gas-turbine power generation, which could amount to $8 billion over the next ten years.
The effort has a growth potential to deliver revenues of around $6 billion a year within the next decade.

www.cleantech.com© Copyright 2005, Cleantech Venture Network, All rights reserved
Top 10 Acquirers by ValueTop 10 Acquirers by Value
Announced
Acquirer Acquirer DescriptionDeal Value
($MM)Deal
Count
Tyco International Ltd Diversified US Industrial 17,336$ 13
ABB European electrical equipment co. 11,644$ 43
Veolia Environnment European Water treatment & filtration 8,200$ 1
BASF AG European Chemicals and Allied Products 5,827$ 11
GE Diversified US Industrial 4,649$ 24
Suez European Water treatment & filtration 4,200$ 1
Siemens AG Diversified European industrial 4,068$ 54
Danaher Diversified US industrial 3,868$ 78
Hercules Inc US Chemicals and Allied Products 3,148$ 1
Schneider European Water treatment & filtration 3,079$ 28
SPX Corp Diversified US Industrial 2,685$ 9
68,704$ 263

www.cleantech.com© Copyright 2005, Cleantech Venture Network, All rights reserved
Top 10 Acquirers by Deal CountTop 10 Acquirers by Deal Count
Announced
Acquirer Acquirer DescriptionDeal
CountDeal Value
($MM)
Danaher Diversified European industrial 78 3,868$
Siemens AG Diversified European industrial 54 4,068$
ABB European electrical equipment co. 43 11,644$
Schneider European Water treatment & filtration 28 3,079$
Roper Diversified US industrial 27 881$
GE Diversified US industrial 24 4,649$
AMETEK Inc European electronic & electrical equipment co. 16 436$
Honeywell Inc US electronic & electrical equipment co. 16 624$
Cooper Industries Inc US electrical equipment co. 15 2,478$
Osmonics Inc Diversified US (part of GE as of March 2003) 14 140$
ATS Diversified US industrial 13 49$
TOTAL 328 31,917$

www.cleantech.com© Copyright 2005, Cleantech Venture Network, All rights reserved
Can Cleantech Make Money?Can Cleantech Make Money?
• Report released in late March 2005
• 67 initial public offerings: 730 M&A transactions in 30+ countries
• Estimates Cleantech IPOs yielded returns to pre-IPO investors of 5.5x, while European venture-backed IPO generated returns of over 8x.
• Estimates overall returns on cleantech M&A transactions were 4.3x on invested equity, based on more than $94 billion in transactions tracked over the past 2 decades
• A hypothetical portfolio of cleantech venture investments delivered an estimated IRR of approximately 30%. (Assumed 40% of the portfolio’s investments were written off and an average holding period of five years.)
Cleantech Venture Investment – Patterns & PerformanceThe most comprehensive investigations of cleantech investment
performance to date

www.cleantech.com© Copyright 2005, Cleantech Venture Network, All rights reserved
Cleantech Index™Cleantech Index™
The Cleantech Index™ was developed to capture the investment potential associated with the substantial increase in the economic value of clean technologies that will inevitably be unlocked as the global population adjusts to the linkage between economic development and resource sustainability.
For a stock to be included in the selection universe, a company must be identified as one that has an exposure of over 50% to a cleantech segment. Current universe of 75 stocks with market capitalization of approximately $100 billion.

www.cleantech.com© Copyright 2005, Cleantech Venture Network, All rights reserved
Index ComponentsIndex Components
12.31.2005
6
7
2
9
24
7
2
3
5
10
Materials & Nanotechnology
Air Quality & Emission Controls
Transportation & Logistics
Energy Generation
Energy Infrastructure
Energy Storage
Energy Efficiency
Enabling Technologies
Materials Recovery & Recycling
Water Purification &Management

www.cleantech.com© Copyright 2005, Cleantech Venture Network, All rights reserved
Preliminary Index StatisticsPreliminary Index Statistics
Preliminary Return Summary (December 29, 2000 to January 20, 2006)
Start Date End Date PeriodCleanTech Index
CleanTech Index - TR
WilderHill Clean Energy
IndexS&P 500 Index
Dow Jones Industrial Index Nasdaq 100
Palisades Water Index
12/31/1999 1/20/2006 ITD 96.81% 101.75% NA -14.14% -7.22% -54.79% 147.46%
12/29/2000 12/30/2005 5 YR 52.96% 55.81% -10.32% -5.45% -0.64% -29.74% 99.84%
12/31/2002 12/30/2005 3 YR 117.10% 119.16% 72.71% 41.88% 28.48% 67.13% 85.67%
12/31/2004 12/30/2005 1 Yr 9.47% 9.76% 4.07% 3.00% -0.61% 1.49% 8.48%
12/30/2005 1/20/2006 YTD 8.19% 8.20% 12.15% 1.06% -0.47% 1.90% 6.11%
12/30/2005 1/20/2006 QTD 8.19% 8.20% 12.15% 1.06% -0.47% 1.90% 6.11%
Annualized
12/31/1999 1/20/2006 ITD 11.82% 12.28% NA -2.48% -1.23% -12.28% 16.13%
12/29/2000 12/30/2005 5 YR 8.85% 9.26% -2.15% -1.11% -0.13% -6.80% 14.82%
12/31/2002 12/30/2005 3 YR 29.49% 29.89% 19.98% 12.37% 8.71% 18.67% 22.91%

www.cleantech.com© Copyright 2005, Cleantech Venture Network, All rights reserved
Attractive Financials & FundamentalsAttractive Financials & Fundamentals
• Category is not over-invested – opportunity to get in early
• Low enterprise valuations – good multiples are achievable
• Sometimes lower capital intensity than many other categories
• Strong trade exit potential – most M&A
• Strong global corporate, consumer and government demand – strong growth rates
• Evidence of rising public market interest, AIM, Solar
• Emerging fund managers – opportunity for diversification
• Venture grade returns can be achieved!

www.cleantech.com© Copyright 2005, Cleantech Venture Network, All rights reserved
Key Events 2005 – 06 to dateKey Events 2005 – 06 to date
• CalPERS/CalSTRS Green Wave Initiative• $60+ a barrel and OPEC instability – ME, Nigeria, Venezuela• European RE markets• Q-Cells, Suntech Power and Sunpower IPOs• Rise of AiM as Global Cleantech Exchange• Corporate announcements – GE, BP,EdF, Walmart etc• Xerox’s PARC announces cleantech initiative• US President’s State of the Union Address• Carbon trading kicks in and prices rise• The hybrid as status symbol• China and the rush for commodities• KPCB announces $100 M for cleantech investing
– “biggest opportunity of the 21st century”

www.cleantech.com© Copyright 2005, Cleantech Venture Network, All rights reserved
Some ChallengesSome Challenges
Globally:
• Building big-small business partnerships
• Building linkages between different capital suppliers (eg project finance, venture capital and equipment leasing)
• Encouraging appropriate public policies (in the US)
• Bringing cleantech to emerging market economies – BOP + BRICs
• BRICs as sources of Technology and Opportunity
• Globalization of Cleantech Capital• Potential Resource Bottlenecks in Clean Energy
• Constant Counter-Intuitions
Canada:
• Turning public R, D & D into commercial business
• Institutional support for venture capital
• From “clean energy” to “cleantech”
• The Rise of Cleantech Clusters

www.cleantech.com© Copyright 2005, Cleantech Venture Network, All rights reserved
Thank You!Thank You!
www.cleantech.com