www. isl. org info @ isl.org institut für seeverkehrswirtschaft und logistik institute of shipping...
TRANSCRIPT
www . isl . org info @
isl.org
Inst
itu
t fü
r S
eeve
rkeh
rsw
irts
chaf
t u
nd
Lo
gis
tik
Inst
itu
te
of
Sh
ipp
ing
Eco
no
mic
s an
d
Lo
gis
tics
Estimating deepsea, shortseaand transhipment volumes
A data model for container traffic
through the European North Range ports
Sönke Maatsch, ISL

www . isl . org info @
isl.org
Inst
itu
t fü
r S
eeve
rkeh
rsw
irts
chaf
t u
nd
Lo
gis
tik
Inst
itu
te
of
Sh
ipp
ing
Eco
no
mic
s an
d
Lo
gis
tics
Content
1. Data sources for seaborne and hinterland container traffic
2. Decomposing the North Range ports’ seaborne traffic – ISL STM
3. Determining the hinterland distribution
4. Linking foreign trade with transport data – Global Insight EITM
5. Results from latest study for the Hamburg Port Authority (HPA)
6. Future development of the model
Estimating deepsea, shortsea, and transhipment volumes18/04/23 2
www . isl . org info @
isl.org
Inst
itu
t fü
r S
eeve
rkeh
rsw
irts
chaf
t u
nd
Lo
gis
tik
Inst
itu
te
of
Sh
ipp
ing
Eco
no
mic
s an
d
Lo
gis
tics
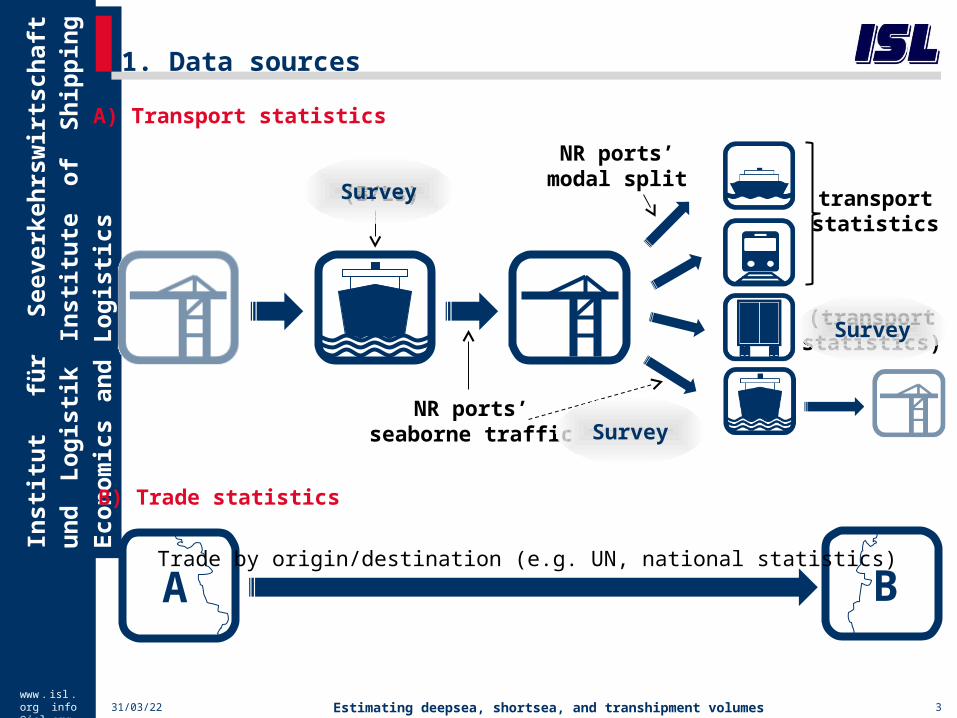
1. Data sources
18/04/23 3
A B Trade by origin/destination (e.g. UN, national statistics)
B) Trade statistics
(B/Ls)
NR ports’seaborne traffic
transportstatistics
(transportstatistics)
NR ports’modal split
A) Transport statistics
Estimating deepsea, shortsea, and transhipment volumes
Survey
Survey
Survey

www . isl . org info @
isl.org
Inst
itu
t fü
r S
eeve
rkeh
rsw
irts
chaf
t u
nd
Lo
gis
tik
Inst
itu
te
of
Sh
ipp
ing
Eco
no
mic
s an
d
Lo
gis
tics
2. Decomposing the North Range ports’ seaborne traffic
18/04/23 4
extra-European container traffic (→ EITM)
intra-European container traffic
ISL Shortsea Shipping Survey: survey among the most important shortsea operators
main question: transhipment shares for each relation
aim: estimating shortsea-land and transhipment traffic per relation(port-to-port or port-to-country level)
North Range ports’ seaborne traffic
Estimating deepsea, shortsea, and transhipment volumes

www . isl . org info @
isl.org
Inst
itu
t fü
r S
eeve
rkeh
rsw
irts
chaf
t u
nd
Lo
gis
tik
Inst
itu
te
of
Sh
ipp
ing
Eco
no
mic
s an
d
Lo
gis
tics
2. Decomposing the North Range ports’ maritime traffic
04/18/23 5
Split of total traffic into shortsea-land and transhipment (NR ports 2005)
intra-European O/D
portport
seasea
land land
shortsea-land:
4.7 mill TEU
deepsea-land:
15.8 mill TEU
extra-European O/D
deepsea-transhipment
shortsea transhipment
shortsea-land
transhipment:
10.5 mill TEU
shortsea-transh.:
0.1 mill TEU
Estimating deepsea, shortsea, and transhipment volumes
?total hinterland traffic: 20.5 mill TEU

www . isl . org info @
isl.org
Inst
itu
t fü
r S
eeve
rkeh
rsw
irts
chaf
t u
nd
Lo
gis
tik
Inst
itu
te
of
Sh
ipp
ing
Eco
no
mic
s an
d
Lo
gis
tics
3. Determining the hinterland distribution
Modal split statistics from the ports:
distribution of hinterland traffic by modes
for some ports: modal split by hinterland regions
Transport statistics:
distribution of hinterland traffic by regions for barge and rail
truck traffic: not available or only available for transport companies
registered in the respective country
Hinterland survey:
distribution of hinterland traffic by regions for truck
modal splits per region
expert interviews / plausibility checks
Estimating deepsea, shortsea, and transhipment volumes18/04/23 6
Modal split and hinterland distribution

www . isl . org info @
isl.org
Inst
itu
t fü
r S
eeve
rkeh
rsw
irts
chaf
t u
nd
Lo
gis
tik
Inst
itu
te
of
Sh
ipp
ing
Eco
no
mic
s an
d
Lo
gis
tics
3. Determining the hinterland distribution
18/04/23 7
Split of total traffic into shortsea-land and transhipment (NR ports 2005)
intra-European O/D
portport
seasea
land land
shortsea-land:
4.7 mill TEU
deepsea-land:
15.8 mill TEU
extra-European O/D
deepsea-transhipment
shortsea transhipment
shortsea-land
transhipment:
10.5 mill TEU
shortsea-transh.:
0.1 mill TEU
Estimating deepsea, shortsea, and transhipment volumes
total hinterland traffic: 20.5 mill TEU
?
www . isl . org info @
isl.org
Inst
itu
t fü
r S
eeve
rkeh
rsw
irts
chaf
t u
nd
Lo
gis
tik
Inst
itu
te
of
Sh
ipp
ing
Eco
no
mic
s an
d
Lo
gis
tics
Content
1. Data sources for seaborne and hinterland container traffic
2. Decomposing the North Range ports’ maritime traffic – ISL STM
3. Determining the hinterland distribution
4. Linking foreign trade with transport data – Global Insight EITM
5. Results from latest study for the Hamburg Port Authority (HPA)
6. Future development of the model
Estimating deepsea, shortsea, and transhipment volumes18/04/23 8

www . isl . org info @
isl.org
Inst
itu
t fü
r S
eeve
rkeh
rsw
irts
chaf
t u
nd
Lo
gis
tik
Inst
itu
te
of
Sh
ipp
ing
Eco
no
mic
s an
d
Lo
gis
tics
4. Linking trade and transport data
Major challenges:
a. from value to volume (tonnes)
b. from tonnes to laden containers
c. inclusion of empties
d. estimation of transport chains
e. first vs. final destination (distribution centres)
Tools used for the North European Container Traffic Model:
Global Insight World Trade Service (WTS) for a. and b.
Imbalance analyses for c.
Global Insight European Inland Transportation Model (EITM) and
ISL Shortsea Traffic Model (STM) for d.
Hinterland survey for d. and e.
Estimating deepsea, shortsea, and transhipment volumes18/04/23 9
Linking trade and transport data

www . isl . org info @
isl.org
Inst
itu
t fü
r S
eeve
rkeh
rsw
irts
chaf
t u
nd
Lo
gis
tik
Inst
itu
te
of
Sh
ipp
ing
Eco
no
mic
s an
d
Lo
gis
tics
4. Linking trade and transport data
Estimating deepsea, shortsea, and transhipment volumes18/04/23 10
Estimation of transport chains
e.g. imports from North East Asia to Poland from WTS: 150.000 laden TEU
150
30
30
70 Hamburg
Rotterdam
Bremen/Bhv.
20 Antwerp
1
1Split by ports based on their market share on the respective relation and in hinterland regions
40 Transhipment
0 Barge
25 Truck*
5 Rail
2
2 Split by mode based on preceding estimations for each port
* Including containers transported to DCs near Hamburg and then on to Poland.

www . isl . org info @
isl.org
Inst
itu
t fü
r S
eeve
rkeh
rsw
irts
chaf
t u
nd
Lo
gis
tik
Inst
itu
te
of
Sh
ipp
ing
Eco
no
mic
s an
d
Lo
gis
tics
4. Linking trade and transport data
Estimating deepsea, shortsea, and transhipment volumes18/04/23 11
Imbalance analysis for empty containers
Basis for estimation:
difference between export and import TEUs per hinterland region
difference between export and import TEUs per maritime relation
Adjustments:
differences between port of discharge and port of loading of containers
equalisations between certain maritime trade routes
Result: estimated transport chains for laden and empty containers
www . isl . org info @
isl.org
Inst
itu
t fü
r S
eeve
rkeh
rsw
irts
chaf
t u
nd
Lo
gis
tik
Inst
itu
te
of
Sh
ipp
ing
Eco
no
mic
s an
d
Lo
gis
tics
4. Linking trade and transport data
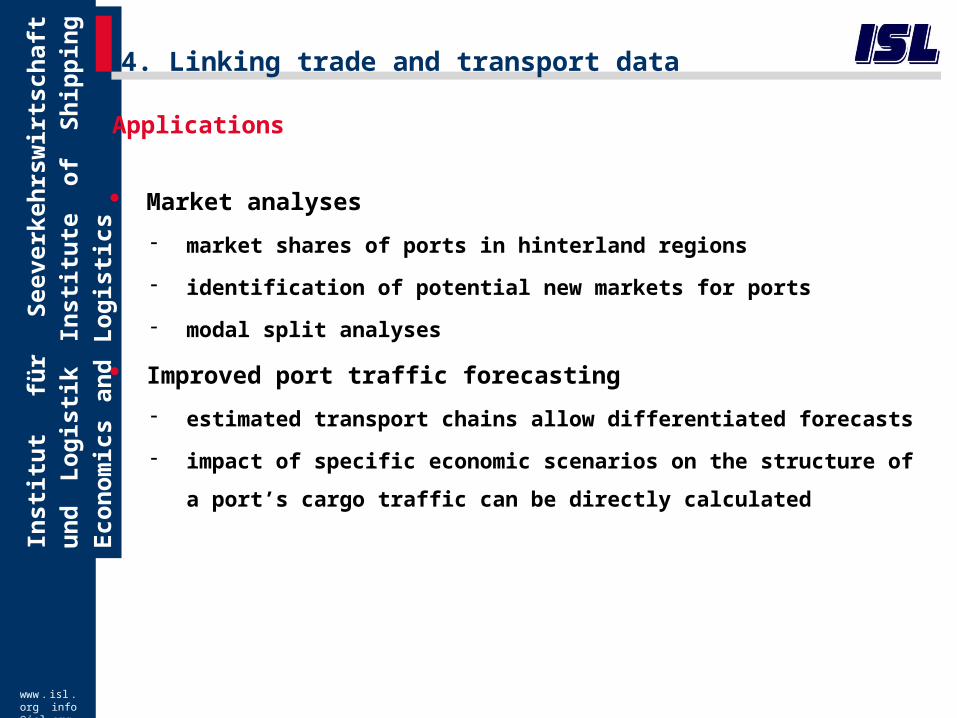
Applications
Market analyses
market shares of ports in hinterland regions
identification of potential new markets for ports
modal split analyses
Improved port traffic forecasting
estimated transport chains allow differentiated forecasts
impact of specific economic scenarios on the structure of a port’s cargo
traffic can be directly calculated

www . isl . org info @
isl.org
Inst
itu
t fü
r S
eeve
rkeh
rsw
irts
chaf
t u
nd
Lo
gis
tik
Inst
itu
te
of
Sh
ipp
ing
Eco
no
mic
s an
d
Lo
gis
tics
5. Latest study for the Hamburg Port Authority (HPA)
Estimating deepsea, shortsea, and transhipment volumes18/04/23 13
Structure of cargo traffic for each North Range port
... market share per segment
Market segment
1000 TEU
share in %
1000 TEU
share in %
1000 TEU
share in %
1000 TEU
share in %
1000 TEU
share in %
1000 TEU
share in %
1000 TEU
share in %
Hinterland* 4403 21 1498 7 6627 32 5353 26 1312 6 1336 7 20530 100
deepsea-land 3852 24 1271 8 4727 30 4351 28 465 3 1145 7 15810 100
shortsea-land 551 12 228 5 1900 40 1003 21 847 18 192 4 4720 100
Transhipment 3692 35 2241 21 2601 25 1129 11 95 1 782 7 10541 100
Total 8095 26 3739 12 9228 30 6482 21 1408 5 2119 7 31071 100
* barge, rail and road
Total
North Range ports
Hamburg Bremen/Bhv. Rotterdam Antwerp Zeebrugge Le Havre
Market segment
1000 TEU
share in %
1000 TEU
share in %
1000 TEU
share in %
1000 TEU
share in %
1000 TEU
share in %
1000 TEU
share in %
1000 TEU
share in %
Hinterland* 4403 54 1498 40 6627 72 5353 83 1312 93 1336 63 20530 66
deepsea-land 3852 48 1271 34 4727 51 4351 67 465 33 1145 54 15810 51
shortsea-land 551 7 228 6 1900 21 1003 15 847 60 192 9 4720 15
Transhipment 3692 46 2241 60 2601 28 1129 17 95 7 782 37 10541 34
Total 8095 100 3739 100 9228 100 6482 100 1408 100 2119 100 31071 100
* barge, rail and road
North Range ports
Hamburg Bremen/Bhv. Rotterdam Antwerp Zeebrugge Le Havre Total
Source: ISL/Global Insight, Containerverkehrsmodell zur Bestimmung der Marktposition des Hafens Hamburg in europäischen Hinterland- und Transhipmentregionen, study for the Hamburg Port Authority, Bremen 2007

www . isl . org info @
isl.org
Inst
itu
t fü
r S
eeve
rkeh
rsw
irts
chaf
t u
nd
Lo
gis
tik
Inst
itu
te
of
Sh
ipp
ing
Eco
no
mic
s an
d
Lo
gis
tics
5. Latest study for the Hamburg Port Authority (HPA)
Estimating deepsea, shortsea, and transhipment volumes18/04/23 14
Market shares by hinterland regions and modal split (ex.: Hamburg)
Source: ISL/Global Insight, Containerverkehrsmodell zur Bestimmung der Marktposition des Hafens Hamburg in europäischen Hinterland- und Transhipmentregionen, study for the Hamburg Port Authority, Bremen 2007

www . isl . org info @
isl.org
Inst
itu
t fü
r S
eeve
rkeh
rsw
irts
chaf
t u
nd
Lo
gis
tik
Inst
itu
te
of
Sh
ipp
ing
Eco
no
mic
s an
d
Lo
gis
tics
6. Planned developments
Estimating deepsea, shortsea, and transhipment volumes18/04/23 15
further projects for North Range ports to improve robustness
building time series
expansion of the scope to the whole continental Europe
(i.e. including Mediterranean)
large-scale survey among importing and exporting companies in
continental Europe
standardizing the interface to Global Insight’s World Trade Service,
thus permitting regularly updated port forecasts

www . isl . org info @
isl.org
Inst
itu
t fü
r S
eeve
rkeh
rsw
irts
chaf
t u
nd
Lo
gis
tik
Inst
itu
te
of
Sh
ipp
ing
Eco
no
mic
s an
d
Lo
gis
tics
04/18/23 16
Thank you for your attention!
Institut für Seeverkehrswirtschaft und LogistikInstitute of Shipping Economics and Logistics
Sönke Maatsch
Tel. +49/4 21/2 20 [email protected]
Universitätsallee GW1 Block A28359 BremenGermanyFax +49/4 21/2 20 96-77
www.isl.org
Economist
Maritime Economics and Transport
Estimating deepsea, shortsea, and transhipment volumes