wrc report tt640/15 hub items/attachments/11633/natsurv... · wrc report tt640/15 . natsurv 3:...
TRANSCRIPT

1
WRC Report TT640/15
NATSURV 3: Water and Wastewater Management in the Soft Drink Industry (Edition 2)
APPENDICES

2
Table of Content
APPENDIX 1 ................................................................................................................................................................................ 3
BEST PRACTICE REVIEW ........................................................................................................................................................................ 3
APPENDIX 2 .............................................................................................................................................................................. 18
ON-LINE SURVEY QUESTIONS .............................................................................................................................................................. 18 Appendix 2.1: First survey ......................................................................................................................................................... 19 Appendix 2.2: Second survey .................................................................................................................................................... 27 Appendix 2.3: Third survey ....................................................................................................................................................... 40
APPENDIX 3 .............................................................................................................................................................................. 59
DETAILED QUESTIONNAIRE FOR SITE VISITS ............................................................................................................................................. 59
APPENDIX 4 .............................................................................................................................................................................. 61
SUMMARY OF RELEVANT REGULATIONS ................................................................................................................................................. 61
APPENDIX 5 .............................................................................................................................................................................. 66
ARTICLES FROM THE INTERNET ............................................................................................................................................................. 66

3
NATSURV 3: Water and Wastewater Management in the Soft Drink Industry (Edition 2)
Report to the Water Research Commission
APPENDIX 1
Best Practice Review
A LITERATURE REVIEW PREPARED IN NOVEMBER 2013 BY:
THABANI MADLALA

4
Contents
1. INTRODUCTION 5
1.1 CONCEPTUAL FRAMEWORK AND THEORETICAL FRAMEWORK 5 1.2 THE SOFT DRINK INDUSTRY 6
2. BEST PRACTICES IN THE SOFT DRINKS SECTOR 7
2.1 EXTERNAL BEST PRACTICES 7 2.1.1 Coalition/Partnership 7 2.1.2 Case studies 8
2.2 INTERNAL BEST PRACTICES 8
2.2.1 Cleaning process 8 2.2.2 Packaging 9 2.2.3 Waste minimisation 14 2.2.4 Water treatment 14 2.2.5 Case studies 15
REFERENCES 16

5
1. INTRODUCTION The soft drink industry is continually developing and applying best practices in order to address environmental issues and reduce the footprint of development activity- both internationally and locally. Such practices may be changed and adjusted in response to public or regulatory concerns, new standards and guidelines, changes in land use policy, environmental conditions or technological innovation. To date, the development of best practices has focused primarily on industry activities associated with exploration and production.
In order to promote environment compliance, major soft drink companies often work together as a coalition such as the Beverage Industry Environmental Roundtable (BIER) and South African National Bottled Water Association (SANBWA). They also collaborate with companies that specialise in packaging (i.e., Polyethylene Terephthalate (PET) bottles and Tetra Pak cartons) or recycling packages. Examples of these companies include Plastipak Packaging Inc.; Tetra Pak; and South Africa’s PETCO. The adoption of best practices in the soft drink industry has taken into account a wide variety of factors, including environmental and social considerations. Most soft drink plants operate in designated industrial sites. Some plants tend to use bottles made of PET or PETE; and others Tetra Pak cartons, which requires less load, less fuel and energy. Some have recently adopted new PET bottles, ‘PlantBottle’, such as the South African Valpre Spring Water (owned by The Coca-Cola Company, South Africa/TCCSA) in Heidelberg.
This paper reports on aspects that are taken into consideration in the development and implementation of best practices in the soft drinks sector, particularly in South Africa. Best practices are structured and presented by looking at (1) a coalition of soft drink companies, (2) cleaning process, (3) packaging, (4) waste minimisation, and (5) water treatment. This is achieved by focusing on carbonated/non-carbonated soft drink, bottled water and juice manufacturing plants.
1.1 Conceptual framework and theoretical framework Various environmental institutions such as the United Nations and Environmental Programmes (UNEP) point out that pollution prevention is a multi-media environmental management approach which emphasises the elimination and/or reduction of waste at the source of generation (UNEP, undated). The ‘Cleaner Production Process’ as a concept and practice is meant to reduce the environmental impact of industry and to promote long-term sustainability by moving towards the prevention rather than the control of pollution. UNEP (Undated) further states that the process is not considered as an absolute state but rather a process that continually evolves with the introduction of improved green technology and innovative ideas.
Built on ideas of cleaner production, and, influenced by optimistic schools of thoughts such as sustainable development, ecological modernization and green economy, best practices are often referred to as a set of guidelines, techniques, ethics or ideas that represent the most efficient or prudent course of action, proven to reliably lead to a desired result (Senupta, 2013; OECD, undated; European Commission, 2006; WRI, undated). Another definition is provided by the Canadian Association of Petroleum Producers (CAPP), which is any kind of existing or new practices that will reduce the time, intensity or duration of the footprint or effect on the land base and/or users of that land base; and management practices recognized to be the most effective and practical means to develop the resource, while minimising adverse environmental and other negative effects (CAPP, 2004). According to the American Productivity & Quality Centre (Undated), the term is used in various fields such as hardware product development, food production and beverage production. A commitment to using the best practices in any field is a commitment to using all the knowledge and technology at one’s disposal to ensure success. One should note that the steps taken in manufacturing sectors to achieve the best practices are often localized rather than universalized.

6
In industrial development, a best practice is a well-defined method that contributes to a successful step in product development. Throughout the industrial development, several best practices are widely followed. The following highlights some of the best environmental practices in production process (De Beers, 2012):
• Manage all issues of environment policy as integral parts of company/entity/facility business and planning; • Develop appropriate environment policies and programmes, monitor their consistent implementation by
accountable and adequately resourced personnel, and ensure that these policies and programmes are communicated to all employees;
• Eliminate the use of chemicals and hazardous substances subject to international bans due to their high toxicity to living organisms, environmental persistence, potential for bioaccumulation, or potential for depletion of the ozone layer and employ alternatives to other hazardous substances used in production processes, wherever technically and economically viable;
• Manage wastes, emissions, dust and the use of potentially harmful substances so as to prevent pollution; and
• Conduct regular environmental audits to evaluate compliance and effectiveness of the environment policy of the business and report the outcomes annually to the supervisory board/management of the company/entity/facility.
However, it is often noted that demonstrated best practices can be slow to spread, even within an organisation. The American Productivity & Quality Centre (Undated) indicates that there could be barriers to adoption of a best practice such as a lack of knowledge about current best practices, a lack of motivation to make changes involved in their adoption, and a lack of skills required to do so.
1.2 The soft drink industry The soft drinks sector comprises - carbonated drinks, bottled water (still and sparkling), concentrates, still and juice drinks, and fruit juices. According to Ercin, Aldaya, and Hoekstra (2011), soft drink bottling or manufacturing involves the following process steps: bottle making, bottle cleaning, syrup preparation, mixing, filling, labelling and packing. Figure 1 shows a flow chart of basic bottling operations.

7
Figure 1. Flow chart of basic bottling operations (ILO, 2011)
Packaging is often referred as the main hotspot for most of environmental impacts (Amienyo, Gujba, Stichnothe and Azapagic, 2013). International best practices followed both internationally and locally are set out in the following sections.
2. BEST PRACTICES IN THE SOFT DRINKS SECTOR
2.1 External best practices
2.1.1 Coalition/Partnership In order to manage some of the challenges facing the planet such as water scarcity, the Water Resources Institute (WRI) indicates that all beverage companies been required to measure, monitor and reduce their water use needs and impacts on the environment and society (WRI, undated). As a result, major soft drink companies have joined the Beverage Industry Environmental Roundtable (BIER), a coalition of beverage companies and supporting partners that aim to advance the industry’s environmental practices. Among the members include SABMiller, The Coca-Cola Company (TCCC), Danone Group, Sun Orchard, Ocean Spray Cranberries, Nestle Waters and PepsiCo. These are some of the companies owning soft drink manufacturing plants, globally. The aim of the roundtable is to define a common framework for industry practices and inform public policy in the areas of water conservation and resource preservation, energy efficiency and climate change mitigation (BIER, 2010). Water stewardship benchmarking is an important primary step in water use quantification. Therefore, sharing of water reduction and conservation best practices will also continue into the foreseeable future.
Similarly as the BIER initiative, the South African National Bottled Water Association (SANBWA) is a partnership of leading South African beverage companies working together to advance the standing of the beverage industry in the realm of environmental stewardship. Among its members are included: Aquelle, Bené, Blue Frost, Bonaqua, Ceres Spring Water division of Ceres Fruit Juices, Jordan, Valpre and Nestle Pure Life. According to SANBWA (Undated),

8
SANBWA runs a benchmarking service for its members on water use. They are officially attached to a larger body, often suppliers and recyclers, such as PET Recycling Company, Polyoak Packaging Systems, Quality Filtration Systems and Nampak Closures (Polyoak, undated; PETCO, undated; Quality filters, 2012; Nampak, 2013). Members of SANBWA must meet specific requirements in respect of the water source, buildings, plant and product. Cost of membership includes commissioning of a range of independent specialists to certify member conformance to very strict standards of quality, safety and efficiency of manufacture. In addition, SANBWA's third party auditors audits members annually to ensure that their source, bottling facility, final product and every aspect of their bottling process adheres to SANBWA’s stringent standards, such as the following (SANBWA, undated):
• Members must display specific information on their product labels for the consumer’s benefit. • Members must test each production batch according to SANBWA’s requirements to ensure adherence to
SANBWA standards.
2.1.2 Case studies
SABMiller/The Coca Cola Company / Water Footprint Network Apart being involved in brewing, SABMiller is one of the biggest bottlers of Coca-Cola products in the world with distribution agreements across six continents- North and South America, Europe, Asia, Australasia and Africa. SABMiller operates franchise bottlers of Coca-Cola products in several continents. For instance, SABMiller in Latin America has 14 bottling plants; Africa and Asia about 17 bottling plants; SA alone about 4 bottling plants, under Amalgamated Beverage Industries (ABI), the largest bottler in the country; and none in North America and Europe, only involved in distribution (SABMiller, 2007; SABMiller, undated). It is clear that the Third World acts as a manufacturing hub for most of the major international companies. Within these sites, about 5 million hectolitres of soft drinks is produced per annum (SABMiller, undated). The company has become a partner of the Water Footprint Network (WFN), an organization that promotes the transition towards sustainable, fair and efficient use by freshwater resources worldwide. As a result, SABMiller is in the process of engaging with agricultural suppliers on the insights provided by these water footprints and building partnerships, most notably with WWF.
SAB/ABI ABI, which has at least four bottling plants based in Phoenix, Devland, Pretoria and Midrand (South Africa), is owned by the South African Breweries (SAB) - division of SABMiller - and the largest bottler of Coca-Cola products within South Africa. ABI’s Sustainable Development Strategy is set within the context of environmental, social and economic pressures that large businesses face today, particularly those that impact the business value chain through packaging; carbon emissions; product safety; the community and the wellbeing of employees (SABMiller, undated). Sustainable development is considered a priority at board level and is central to the business strategy which guides daily operational decisions.
2.2 Internal best practices
2.2.1 Cleaning process WRAP (Undated: 4) defines Clean in Place (CIP) as: “The cleaning of complete items of plant or pipeline circuits without dismantling or opening of the equipment and with little or no manual involvement on the part of the operator. The process involves the jetting or spraying of the surfaces or circulation of cleaning solutions under conditions of increased turbulence and flow velocity”. In other words, CIP acts as a method of cleaning the interior surfaces of pipes, vessels, process equipment, filters and associated fittings, without disassembly. The benefit to industries that use CIP is that the cleaning is faster, less labour intensive and more repeatable, and poses less of a chemical exposure risk to people (WRAP, undated). Most soft drink plants have adopted CIP systems. For example, the Tetra Pak Company- a leading supplier to soft drink plants both internationally and locally- highlights that Tetra Alcip is an eco-friendly, advanced automatic cleaning-in-place system used for cleaning process equipment such as

9
filling machines, pasteurisers, sanitary pipes, tanks, aseptic tanks and plate heat exchangers (Tetra Pak, undated). In addition, it achieves a more environmentally sound operation by cutting water and detergent consumption. Furthermore, the Tetra Alcip unit cuts chemical consumption by a further 6% and water consumption by 21% (Tetra Pak, Undated). The following figure (2) shows one of the CIP technology systems in beverage industries.
Figure 2. Tetra Alcip (Tetra Pak, Undated)
2.2.1.2 Case studies Diageo (brewing company), for instance, has investigated the optimisation of its CIP systems in a number of its sites, for example (WRAP, undated: 10).
• The Leven packaging plant reported potential savings of 222,000 litres of water per annum through more efficient CIP procedures for vessels and pipes between bottle runs;
• The Nangor Road Baileys plant reduced CIP water usage by 5 million litres with water savings in the pasteuriser of 2.4 million litres per year and in the maltodextrin dissolver of 1.05 million litres per year.
• Coors Brewing Limited reports water consumption reduced by around 20,000 m3 per year through the replacement of simple ‘total loss’ CIP sets by multi-channel recovery sets with programmable logic controllers.
2.2.2 Packaging
2.2.2.1 The role of packaging in soft drinks Packaging is used for the containment of raw materials or processed goods in the soft drinks sector. It plays an important role in protecting the product and helps to prevent spoilage. It ensures the safe handling and delivery of the product and helps to identify the product and its contents (Australian Industry Group, undated). Although packaging plays an important environmental role in preventing wastage, it consumes valuable resources such as energy and water, and ultimately produces waste that has to be disposed of, reused or recycled. Advancements in packaging design and materials reflect the industry need to balance environmental considerations with commercial necessities.
There are three main categories commonly used for packaging (Australian Industry Group, undated):
(i) Primary packaging: used around the product at the point of sale (e.g. bottles, plastic bags and containers);

10
(ii) Secondary packaging: groups a number of items together until the product is sold (e.g. boxes and strapping); and
(iii) Tertiary packaging: enables the product to be transported and handled (e.g. pallets, padding and shrink-wrap).
2.2.2.2 Packaging practices (trays and pallets) The Soft drink sector operates in a way that avoids unnecessary packaging. In other words, all unnecessary packaging that is not essential for the protection, containment, handling or identification of the product is eliminated. These include:
• Unnecessary layers (e.g. bags within bags or boxes) • Unnecessary tertiary packaging (e.g. replacing corrugated boxes with reusable containers or with shrink-
wrap that is only a fraction of the weight • Unnecessary labelling (e.g. ink printing directly onto packaging to replace paper labels) • Adhesives.
The following figure (3) shows a beverage tray and pallet used for packaging bottles.
Figure 3. CHEP multi-purpose beverage tray and display pallet (CHEP, Undated)
According to CHEP (Undated), such lightweight plastic packaging materials (trays and pallets), unlike cardboard material, are environmentally friendly in terms of producing smaller footprint as they are re-usable. This improves transport and storage efficiency with low profile stacking when empty and reduces costs and environmental impact by eliminating the need for one way cardboard packaging or reduces waste to landfill when compared to one way packaging.
Case studies Slades Soft Drinks (formerly O’Neil Brothers Soft Drinks), Australia, has eliminated the use of cardboard cartons and pallet pads by relying on the CHEP multi-purpose beverage trays and pallets to prevent damage to the product (Slades, undated; CHEP, undated). CHEP is a leading provider of pallet and container pooling services for the beverage industries in Australia. Using beverage tray prevents wastage through damage from cartons. The co-owner of Slades, for instance, states that when using cartons, different cartons with different bar codes for different flavours are needed; but with the beverage tray and display pallet, consumers can visibly see what flavour it is. This also saves costs because it eliminates the need to print different cartons and saves time.
Other companies or plants, which use similar beverage trays and pallets, include TCCC and PepsiCo. In South Africa, it include TCCSA-related plants (Peninsula Beverages, ABI, Coca-Cola Fortune, and Coca-Cola Shanduka Beverages), Shoreline Beverages in Amanzimtoti, Soda King Franchising in Cape Town and Little Green Beverages in Isando/Johannesburg (Soda King, 2011; Little Green Beverages, undated; Shoreline Beverages, 2013).

11
2.2.2.3 Packaging practices (cartons) Tetra Pak is also one of the leading suppliers of processing and packaging equipment for soft drink plants (Tetra Pak, undated). All aseptic carton packages are made of renewable materials, recyclable paperboard and no refrigeration is needed when distributed and stored, which saves energy.
Juice manufacturing plants in South Africa, often, use less packaging for their products compared to plants manufacturing carbonated drinks. Most of them use Tetra Pak cartons than PET bottles such as Ceres Beverages and Clover (Ceres, undated; Clover, undated). These special shelf safe containers are light and compact. Transporting products in cartons requires fewer trucks, less fuel and energy. As a result, this equates to reduced CO2 emissions, the gases responsible for global warming, into the atmosphere.
2.2.2.4 Packaging design (PET bottle light weighting/ new PET bottle) The new technology shifts from using a traditional PET bottle to a new “green” PET bottle (PlantBottle), which is more eco/environmentally friendly and therefore less hostile to the environment. According to TCCC (Undated), PlantBottle is the first recyclable PET plastic beverage bottle made partially from plants. The packaging functions and recycles just like traditional PET plastic, but do so with a lighter footprint on the planet. There are still few countries that have developed to the new system. This includes US, Canada, Denmark, Japan, Brazil, Mexico, Norway, Sweden, South Africa (Valpre branded water) and Chile (TCCC, Undated). The purpose of this new technology is to move towards a sustainable packaging goal, reducing environmental footprint by reducing material use, increasing recycling, using more recycled and renewable material in packaging, and advancing innovative technologies (TCCC, Undated). Furthermore, PlantBottle packaging fits well into the broader strategy by reducing dependence on non-renewable resources by being a fully recyclable bottle like conventional PET plastic bottles, and by leaving a lighter footprint on the plant and its scarce resources. The following figures (4 and 5) show a new PET bottle package and the basics diagram.
Figure 4. New PET bottle package.

12
Figure 5. PlantBottle basics diagram (TCCC, Undated)
According to TCCC (Undated), the key difference between PlantBottle packaging and traditional PET plastic bottles is that instead of using petroleum and other fossil fuels to produce a key ingredient in the plastic, PlantBottle packaging uses materials that some are plant-based. PlantBottle packaging is made through a process that converts sugarcane into mono-ethylene glycol (MEG), which represents 30 % of the total composition of PET plastic by weight (TCCC, Undated). While the current bottlers only use sugarcane, they expect over the long-term to also be able to use other natural resources like stems, fruit peels and bark in the near future.
Case studies
Valpre Spring Water, Heidelberg
According to TCCSA (Undated), ABI invested approximately R7 million in research and development as well as R29 million in capital over 3 years to develop and test bottles that are among the lightest in the world for the gas retention shelf life that is required. One of the critical success factors of the PET light weighting project was the introduction of Fast Reheat Resin with Hosaf, the only PET resin manufacturer in South Africa. Furthermore, ABI (cited in SAB, 2012) states that it has resulted in a 10% to 15% reduction in the power consumption of almost every blow moulder oven across South Africa as this technology has now been rolled out to most bottlers in the country. The Valpre Spring Water plant (Owned by TCCSA) - based in Heidelberg, Gauteng - has adapted to using such PlantBottle packaging plastic bottles (Valpre, undated). The following figure (6) is a new PET bottle of Valpre branded water.

13
Figure 6. Valpre Spring Water (Valpre, undated)
TCCC (undated) further indicates that in the near future it will move closer to the target of using PlantBottle packaging technology in all of its plastic bottles.
2.2.2.6 Packaging practices (bulk delivery) Other practices in soft drink bottling or manufacturing involves bulk delivery to the market. Delivering in bulk can eliminate the need for tertiary packing, and transport costs can be reduced by choosing the lightest suitable tertiary packaging possible. The following figure (7) is an example of a bulk delivery method.
Figure 7. Intermediate Bulk Containers (IBC) (Schoeller Allibert, 2013a)
IBCs are typically cube-shaped containers that fit onto a standard pallet. Their shape makes them efficient to store and transport. This technology is currently used extensively in the beverage industry.
Case studies The Coca Cola Company
Some major companies have required a more efficient and environmentally friendly Coca-Cola liquid container. TCCC, for instance, developed a 250 litre foldable IBC, supplied by Schoeller Allibert (German IBC manufacturer), designed for soft drink products (Schoeller Allibert 2013b). The fibre-free container makes product handling easier, safer and hygienic, while reducing both costs and waste. The container circulates in a system between the Coca Cola bottling plants and to the supplying partners such as the McDonald's restaurants (Schoeller Allibert 2013b).

14
2.2.3 Waste minimisation
2.2.3.1 Reuse and recycle of packaging The reuse of packaging such as containers, drums, boxes and pallets to store or transfer materials around the plant can be cost-efficient. In South Africa, for instance, PETCO (figure 8) is one of the leading companies that encourages re-using of packaging.
Figure 8. PETCO (Pty) Ltd, (PETCO, Undated)
Most soft drink manufacturing plants are partnered with PET recycling plants, PETCO or Tetra Pak SA, for recycling purposes. According to PETCO (Undated), recycling 1 ton of plastic bottles saves 1.5 ton of carbon. Recycling plastic bottles decreases the need for raw materials and save energy. Discarded PET bottles are collected, baled and delivered to the PET Recycling Plant, where they are colour sorted, washed, granulated, re-washed, extruded and cut into recycled PET pellets. Some plants operate their own internal recycling. ABI Phoenix, for instance, is the maiden recycling site with the rollout underway at all other sites; and recycles 73% of all the waste generated within its operations (SAB, 2012).
The Australian Industry Group (Undated) lists some of the actions that are used by plants, eco-efficiency action:
• Return packaging to suppliers for reuse (e.g. pallets, drums, IBCs, plastic containers and crates, cardboard boxes, wooden crates and padding).
• Reuse packaging around the plant to store or transfer materials. • Investigate options for other businesses, customers or community groups that could reuse packaging waste. • Check the viability of advertising your plant’s packaging waste or utilising another plant’s packaging waste. • Ensure reusable packaging is designed to be simple and easy to clean. • Ensure reusable packaging is designed to be long-lasting (e.g. reinforced corners and edging). • Follow correct handling procedures to avoid damaging packaging. • Ensure that handling equipment is equipped to minimise damage.
2.2.4 Water treatment In line with current environmental practices, advanced food and beverage water treatment is essential for sustainable and profitable potable water and wastewater management. Beverage water treatment requires key technologies that meet the strictest disinfection and purification specifications. Veolia Water Solutions & Technologies South Africa (VWS South Africa), for instance, is mainly responsible with technologies for water treatment for soft drink plants. The following figure (9) is an example of a beverage water treatment system.

15
Figure 9. Beverage water treatment system (VWS(a), Undated)
The water treatment technology plays a role by (VWS(a), undated):
• Supplying re-usable water, thereby reducing overall raw water intake. • Achieving Zero Liquid Discharge for better environment practice. • Helping manufacturers produce final products by supplying high-grade potable water.
Other technologies, specifically for water clarification, advanced clarification technology which incorporates chemical precipitation with sludge thickening. According to VWSb (Undated), this technology is extremely efficient at removing high amounts of precipitated solids from water.
2.2.5 Case studies
ABI ABI has set the benchmark for SABMiller’s priority to make more soft drinks with less water. According to ABI (cited in VWSb), in 1998, the company chose to replace the ageing Mixed Bed Deioniser System with a Nano-filtration System. ABI’s Midrand manufacturing and distribution unit upgraded its water treatment plant, replacing the conventional chemical treatment plant with a Nano/RO membrane filtration plant (VWSb, undated). The following figure (10) is a Nano membrane filtration (Coca Cola Amatil Nano-filtration Plant), used by ABI.
Figure 10. Nano Membrane filtration (VWS(b), Undated)

16
References Australian Industry Group. Undated. Eco-efficiency Toolkit for the Queensland Food Processing Industry. http://www.ecoefficiencygroup.com.au/Portals/0/Eco-efficiency%20Toolkit%20for%20the%20Queensland%20Food%20Processing%20Industry.pdf (accessed 1 November 2013).
American Productivity & Quality Centre. Undated. http://www.apqc.org/search/apachesolr_search?filters=tid:8039 (accessed 10 October 2013).
Amienyo, D., Gujba, H., Stichnothe, H., and Azapagic, A. 2013. Life cycle environmental impacts of carbonated soft drinks, The International Journal of Life Cycle Assessment, 18 (1):77–92.
CAPP. 2004. Guide: Evolving approaches to minimize the footprint of the Canadian oil and natural gas industry. Canada: R. McManus Consulting Ltd.
CHEP. Undated. http://www.chep.com/resources/case_studies/Saldes_Beverage_ manufacturer_innovative/ (accessed 1 November 2013).
Ceres. Undated. www.ceres.co.za (accessed 3 November 2013).
Clover. Undated. www.clover.co.za (accessed 3 November 2013).
Contra Costa Health Services. 2013. Industrial Safety Ordinance: annual performance review and evaluation report. http://cchealth.org/hazmat/pdf/iso/iso-report.pdf (accessed 28 October 2013).
De Beers. 2012. Best Practice Principles. http://www.sharepoint.debeersbpp.com/sites/ bpp/Public/De%20Beers%20BPP%20Requirements%202012.pdf (accessed 12 October 2013).
Ercin, A.E., Aldaya, M.M. and Hoekstra, A.Y. 2011. Corporate water footprint accounting and impact assessment: The case of the water footprint of a sugar-containing carbonated beverage, Water Resources Management, 25(2): 721-741.
European Commission. 2006. Integrated Pollution Prevention and Control: Reference Document on Best Available Techniques in the food, drink and milk industries. http://eippcb.jrc.ec.europa.eu/reference/BREF/fdm_bref_0806.pdf (accessed 12 October 2013).
ILO. 2011. http://www.ilo.org/oshenc/part-x/beverage-industry/item/954-soft-drink-bottling-and-canning (1 November 2013).
Little Green Beverages. Undated. http://www.refreshhh.co.za/aboutlgb.html (4 November 2013).
Nampak. 2013. http://www.nampak.com/Plastics.aspx (accessed 31 October 2013).
OECD. Undated. http://www.oecd.org/innovation/green/toolkit/aboutsustainable manufacturingandthetoolkit.htm (accessed 12 October 2013).
Plastipak. Undated. (http://www.plastipak.com/sustainability/packaging/ (accessed 12 October 2013).

17
PETCO. Undated. http://www.petco.co.za/ag3nt/system/join_petco_02_members.php (accessed 31 October 2013).
Polyoak. Undated. http://www.polyoak.co.za/ (accessed 31 October 2013).
Qualityfilters. 2012. http://www.qualityfilters.co.za/ (accessed 31 October 2013).
SAB. 2012. http://www.sab.co.za/sablimited/action/media/downloadFile?media_fileid=1050 (3 November 2013).
SABMiller. 2007. http://www.sabmiller.com/files/pdf/SABMiller_soft_drinks_report.pdf (accessed 31 October 2013).
SABMiller. Undated. Water footprinting: Identifying and addressing water risks in the value chain. http://www.sab.co.za/sablimited/action/media/downloadFile?media_fileid=918 (accessed 19 October 2013).
SANBWA. Undated. http://www.sanbwa.org.za/membershiplist.asp (accessed 30 October 2013).
Schoeller Allibert. 2013a. http://www.schoellerallibert.com/products (accessed 30 October 2013).
Schoeller Allibert. 2013b. http://www.schoellerallibert.com/cases/case-study-coca-cola (accessed 30 October 2013).
Shoreline Beverages. 2013. http://www.shorelinebev.co.za/site/default.asp
Slades. Undated. http://www.slades.com.au/ (accessed 1 November 2013).
Soda King. 2011. http://www.sodaking.co.za/ (accessed 2 November 2013).
The Coca Cola Company. Undated. http://www.coca-colacompany.com/stories/sustainability-reports (accessed 16 October 2013).
The Coca Cola Company. Undated. http://www.cocacola.co.za (accessed 16 October 2013).
Tetrapak. Undated. www.tetrapak.com/za (accessed 3 November 2013).
UNEP. Undated. http://www.unep.org/ (accessed 30 October 2013).
WRAP. Undated. http://www.wrap.org.uk/sites/files/wrap/CIP%20guidance%20FINAL% 20010512%20AG.pdf (accessed 31 October 2013).
WRI. Undated. http://www.wri.org/ (accessed 24 October 2013).
VWS(a). Undated. http://www.veoliawaterst.co.za/industrial-water-treatment/food-and-beverage-water-treatment/ (accessed 1 November 2013).
VWS(b). Undated. http://www.veoliawaterst.com.au/medias/case-studies/case_cocacolanf.htm (accessed 2 November 2013).

18
NATSURV 3: Water and Wastewater Management in the Soft Drink Industry (Edition 2)
Report to the Water Research Commission
By
Pollution Research Group University of KwaZulu-Natal, Durban
APPENDIX 2
On-Line Survey Questions

19
Appendix 2.1: First survey Circulated in 2013 – this survey asked for company contact details as well as water and effluent management. This survey was limited to 10 questions as only the free version of SurveyMonkey was used.

20
Overview
Welcome to the Pollution Research Group's survey on water and wastewater management in the soft drink industry - a project funded by the South African Water Research Commission.
The aim of this survey is to obtain an indication of the overall water use and effluent generated within the soft drinks sector in South Africa, and to determine the level to which your company would be willing to be involved in terms of attending workshops, answering more detailed questions, and participating in a site visit.
All company information will be held as confidential and any data provided will be reported anonymously.
We thank you for taking your time to participate.
1. Please provide details on your company by answering the questions below
Company name:
Suburb:
City:
Province:
Web site address:
Contact person:
Position in company:
Contact email:
Holding company

21
Overview of production
This section aims to obtain an overview of the type of soft drink produced at your site, and the annual production. Please remember that all information is kept confidential and reported on as Factory A, B etc.
2. Please indicate which soft drink products are manufactured at your site
fec Cola-carbonates fec RTD Tea fec Water of origin
fec Non-cola carbonates fec Nectars fec Prepared water
fec 100% fruit juice fec Sports drinks fec Flavoured water
fec Fruit drinks fec Natural bottled water fec Functional water
Other (please specify)
3. Please provide an indication of the total soft drink production at your site (and per category if available)

22
Process overview
This section aims to obtain an overview of the processes carried out on site.
4. Please indicate which process steps are carried out in the production of soft drinks at your site.
fec
Process water treatment
fec
Deaeration
fec
Storage
fec Raw material storage fec Carbonation fec PET bottle manufacturing
fec Sugar dissolving fec Aseptic filling fec CIP
fec Simple syrup preparation fec Hot filling fec CIP recovery
fec Final syrup preparation fec Bottle washing fec Line purge recovery
fec In-line blending fec Crate washing fec Heat recovery
fec Batch blending fec Labelling
fec Pasteurisation fec Shrink wrapping
Other (please specify)

23
Water consumption
This page aims to obtain an overview of water consumption related to both process and non-process operations.
5. Please indicate the annual volume of water used and the associated cost Total annual water consumption (kl/year):
Cost of water (R/kl):
Total annual cost of water (R/year):
6. Please indicate the source of water to your factory
fec Municipal
fec Borehole
fec Both (please specify percentages in box below)
Other (please specify)

24
7. Please indicate where water meters are installed and the total number (in the comment box)
fec
Main incoming
fec Feed to the Water treatment plant
fec Water treatment plant to factory
fec Administration / non process
fec Preparation
fec Blending
fec Filling
fec Bottle washing / rinsing
fec CIP
fec Cooling towers
fec Gardens
fec Truck washing
fec General washing
fec Effluent
Other (please specify)
25
Wastewater management
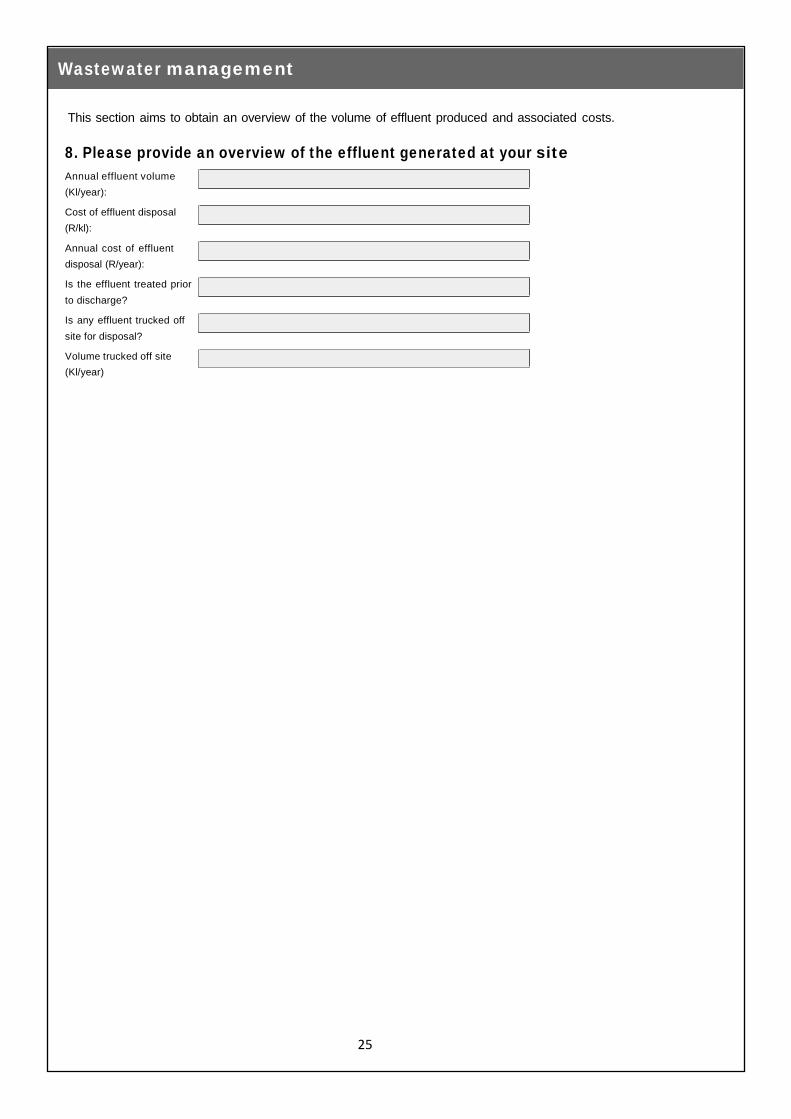
This section aims to obtain an overview of the volume of effluent produced and associated costs.
8. Please provide an overview of the effluent generated at your site
Annual effluent volume (Kl/year):
Cost of effluent disposal (R/kl):
Annual cost of effluent disposal (R/year):
Is the effluent treated prior to discharge?
Is any effluent trucked off site for disposal?
Volume trucked off site (Kl/year)

26
Best practices
This section aims to obtain an overview of best practices carried out or identified
9. Please indicate if you have carried out or are planning any of the following:
Planned In progress Implemented Not applicable Not planned
water sub metering gfedc gfedc gfedc gfedc gfedc
Energy sub metering fec fec fec fec fec
Monitoring and targeting gfedc gfedc gfedc gfedc gfedc
CIP recovery fec fec fec fec fec
Purge line recovery gfedc gfedc gfedc gfedc gfedc
Heat recovery fec fec fec fec fec
Water foot printing gfedc gfedc gfedc gfedc gfedc
Carbon foot printing fec fec fec fec fec
Life cycle analysis gfedc gfedc gfedc gfedc gfedc
Water pinch analysis fec fec fec fec fec
Use of recycled content in bottles
gfedc gfedc gfedc gfedc gfedc
Reduced weight bottles / cans etc.
fec fec fec fec fec
Other (please specify)
Level of involvement
This section aims to identify to what level you would be willing to participate in this project.
10. Please indicate to what level you would like to participate in this project.
fec This on-line survey only
fec Attendance at workshops
fec More detailed emailed questionnaire
fec Telephonic interview
fec Face to face interview
fec Site visit
fec Review of updated Natsurv Guide

27
Appendix 2.2: Second survey Circulated in 2014 – based on feedback from companies, it was realised that confidentiality was the biggest barrier to participation. For this reason, the first survey was modified to remove any requirement for contact details, and refined such that ranges of water use etc. were given rather than a request for actual figures. More than 10 questions could be used as a subscription to SurveyMonkey had been made.

28
Welcome to the on-line survey to determine water and wastewater management practices within the South African Soft Drink industry. The information provided in this survey will be used to update the National Survey (Natsurv) document published by the Water Research Commission in the 1980s. All information will be considered confidential and you do not need to supply the company name. The survey consists of 12 pages and 15 questions, all of which are multiple choice, with space provided for more detailed information should you be willing to share. Many thanks for your time. Best regards Pollution Research Group
*1. Please indicate in which province your manufacturing site is located fec
Gauteng
fec Mpumalanga
fec North West
fec Limpopo
fec KwaZulu-Natal
fec Eastern Cape
fec Western Cape
fec Northern Cape
fec Free State
2. Please indicate the size of your company based on number of employees
fec Micro: < 50 fec Small: 50 to 200
fec Medium: 200 to 450
fec Large: > 450

29
3. Please can you indicate the type of raw water pre-treatment that is carried out
fec Sand filtration fec Membrane filtration
fec Activated carbon
fec UV disinfection
fec Chlorine disinfection
fec Ozone treatment
fec Disinfection (other)
fec None
Any other information
30
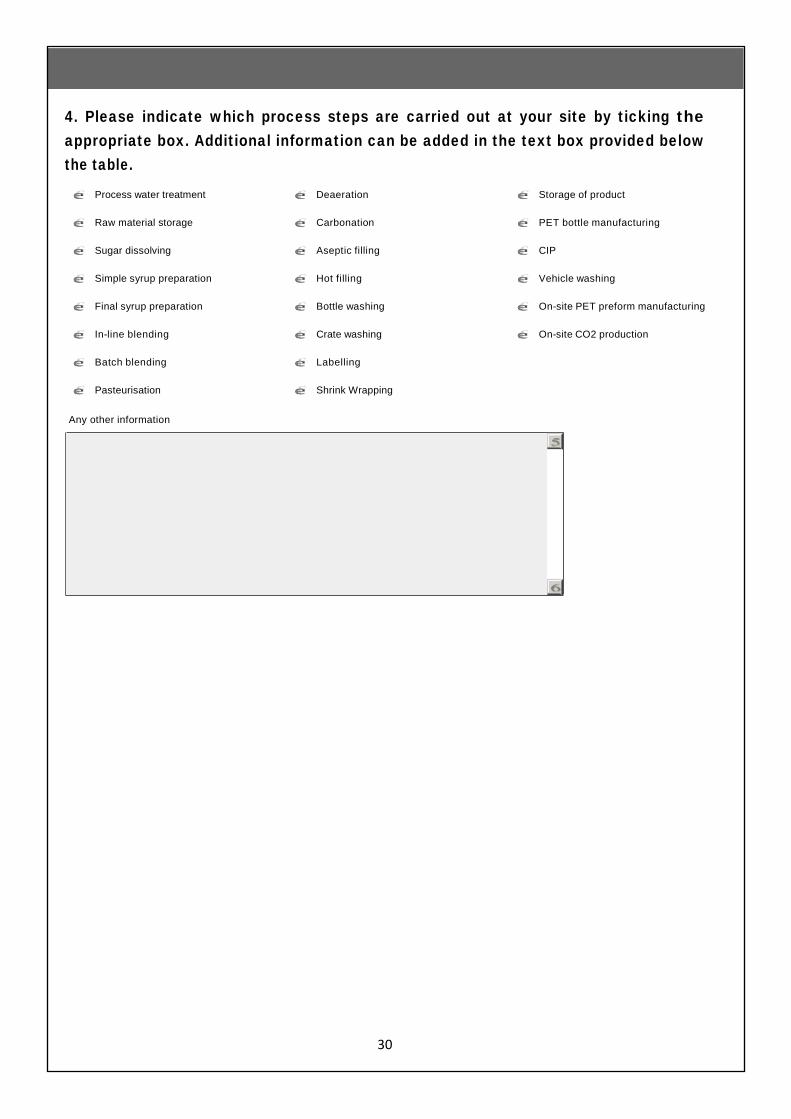
4. Please indicate which process steps are carried out at your site by ticking the appropriate box. Additional information can be added in the text box provided below the table.
fec
Process water treatment
fec
Deaeration
fec
Storage of product
fec Raw material storage fec Carbonation fec PET bottle manufacturing
fec Sugar dissolving fec Aseptic filling fec CIP
fec Simple syrup preparation fec Hot filling fec Vehicle washing
fec Final syrup preparation fec Bottle washing fec On-site PET preform manufacturing
fec In-line blending fec Crate washing fec On-site CO2 production
fec Batch blending fec Labelling
fec Pasteurisation fec Shrink Wrapping
Any other information

31
5. What is the average monthly production in kl (i.e. 1000 litres)? Please tick the appropriate block(s) or insert the actual production in the text box below the table. 0-500 501-1000 1001-2000 2001-5000 5001-8000 8001-10000 >10000
Total gfedc gfedc gfedc gfedc gfedc gfedc gfedc
Carbonated soft drink fec fec fec fec fec fec fec
Non-carbonated soft drink gfedc gfedc gfedc gfedc gfedc gfedc gfedc
100% fruit juice fec fec fec fec fec fec fec
Fruit drinks gfedc gfedc gfedc gfedc gfedc gfedc gfedc
Still bottled water (plain) fec fec fec fec fec fec fec
Carbonated Water (plain) gfedc gfedc gfedc gfedc gfedc gfedc gfedc
Carbonated water (flavoured)
fec fec fec fec fec fec fec
Sports drinks gfedc gfedc gfedc gfedc gfedc gfedc gfedc
Energy drinks fec fec fec fec fec fec fec
Cordials gfedc gfedc gfedc gfedc gfedc gfedc gfedc
Iced Tea fec fec fec fec fec fec fec
Actual average monthly production in Kl

32
6. What is the average monthly water consumption in m3 (Kl)? Please tick the appropriate block(s) or insert the actual figure in the text box below the table.
fec
0-2000
fec
10001-12000
fec
18001-20000
fec 2001-5000 fec 12001-14000 fec 20001-22000
fec 5001-8000 fec 14001-16000 fec 22001-24000
fec 8001-10000 fec 16001-18000 fec >24000
Actual average monthly water use in m3

33
7. Where possible, please indicate the percentage of water used in various process stages by ticking the appropriate block. Please indicate if this data is metered, or if it is estimated. <10% 20-30% 30-40% 40-50% 50-60% 60-70% 70-80% 80-90% 90-100% Metered Don't know
Water pretreatment
gfedc gfedc gfedc gfedc gfedc gfedc gfedc gfedc gfedc gfedc gfedc
Mixing fec fec fec fec fec fec fec fec fec fec fec
Blending gfedc gfedc gfedc gfedc gfedc gfedc gfedc gfedc gfedc gfedc gfedc
Bottle washing
fec fec fec fec fec fec fec fec fec fec fec
CIP gfedc gfedc gfedc gfedc gfedc gfedc gfedc gfedc gfedc gfedc gfedc
General washing
fec fec fec fec fec fec fec fec fec fec fec
Ablutions / admin
gfedc gfedc gfedc gfedc gfedc gfedc gfedc gfedc gfedc gfedc gfedc
Utilities (boiler etc.)
fec fec fec fec fec fec fec fec fec fec fec
Truck washing
gfedc gfedc gfedc gfedc gfedc gfedc gfedc gfedc gfedc gfedc gfedc
Gardens fec fec fec fec fec fec fec fec fec fec fec
Please include any other water using areas not listed above

34
8. What is your average specific water intake (i.e. litres water used per litre product)? Please tick the appropriate block or insert the actual figure in the text block below the table. 1-1.5 1.5-2 2-2.5 2.5-3 3-3.5 3.5-4 4-4.5 Don't know
Overall gfedc gfedc gfedc gfedc gfedc gfedc gfedc gfedc
Carbonated soft drink fec fec fec fec fec fec fec fec
Non-carbonated soft drink gfedc gfedc gfedc gfedc gfedc gfedc gfedc gfedc
100% fruit juice fec fec fec fec fec fec fec fec
Fruit drinks gfedc gfedc gfedc gfedc gfedc gfedc gfedc gfedc
Still bottled water (plain) fec fec fec fec fec fec fec fec
Carbonated Water (plain) gfedc gfedc gfedc gfedc gfedc gfedc gfedc gfedc
Carbonated water (flavoured)
fec fec fec fec fec fec fec fec
Sports drinks gfedc gfedc gfedc gfedc gfedc gfedc gfedc gfedc
Energy drinks fec fec fec fec fec fec fec fec
Cordials gfedc gfedc gfedc gfedc gfedc gfedc gfedc gfedc
Iced Tea fec fec fec fec fec fec fec fec
Actual average specific water intake
35
9. What is your estimated monthly effluent volume as a percent of incoming water? If effluent volume is metered, then please supply the average monthly effluent volume.
fec
<10%
fec
50-60%
fec 10-20% fec 60-70%
fec 20-30% fec 70-80%
fec 30-40% fec 80-90%
fec 40-50% fec 90-100%
Average monthly effluent volume in Kl

36
10. Please indicate any effluent treatment processes carried out on site prior to disposal to sewer
fec
No effluent treatment
fec
Segregation of concentrated process streams
fec pH adjustment fec Anaerobic digestion
fec Holding tank fec Trucking of effluent for off site disposal
Any additional information on effluent management

37
11. Please indicate the average pH of the effluent from your factory by ticking the appropriate box. Any other information can be provided in the text box below the table.
fec
1-2
fec
6-7
fec
11-12
fec 2-3 fec 7-8 fec 12-13
fec 3-4 fec 8-9 fec 13-14
fec 4-5 fec 9-10
fec 5-6 fec 10-11
Other (please specify)
12. Please indicate the average monthly Chemical Oxygen Demand (COD) effluent loading (mg/l) discharged to sewer
fec 0-10 000 fec 20 000-30 000 fec 40 000-50 000 fec 10 000-20 000 fec 30 000-40 000
Acutal average effluent COD loading in mg/l

38
13. Please indicate the average monthly Total Dissolved Solids (TDS) effluent loading (mg/l) discharged to sewer
fec 0-500 fec 3 000-4 000 fec 7 000-8 000 fec 500-1 000 fec 4 000-5 000 fec 8 000-9 000
fec 1 000-2 000 fec 5 000-6 000 fec 9 000-10 000
fec 2 000-3 000 fec 6 000-7 000 fec > 10 000
Or enter the actual average monthly TDS value (mg/l)
14. Please indicate the average monthly Suspended Solids (SS) effluent loading (mg/l) discharged to sewer
fec 0-20 fec 80-100 fec 160-180 fec 20-40 fec 100-120 fec 180-200
fec 40-60 fec 120-140 fec >200
fec 60-80 fec 140-160
Or insert actual average monthly SS value (mg/l)

39
15. In order to obtain an idea of any best practices implemented by the soft drink industry, please indicate which of the following initiatives you have carried out or are planning: Planned In progress Implemented Not applicable Not planned
Water sub metering gfedc gfedc gfedc gfedc gfedc
Electricity sub metering fec fec fec fec fec
CIP recovery gfedc gfedc gfedc gfedc gfedc
Purge line recovery fec fec fec fec fec
Heat recovery gfedc gfedc gfedc gfedc gfedc
Sand filter backwash recovery
fec fec fec fec fec
Carbon filter backwash recovery
gfedc gfedc gfedc gfedc gfedc
RO reject reuse fec fec fec fec fec
Water foot printing gfedc gfedc gfedc gfedc gfedc
Carbon foot printing fec fec fec fec fec
Water pinch analysis gfedc gfedc gfedc gfedc gfedc
Use of recycled content in bottles
fec fec fec fec fec
Reduced weight bottles gfedc gfedc gfedc gfedc gfedc
Heat recovery fec fec fec fec fec
ISO 9001 gfedc gfedc gfedc gfedc gfedc
ISO 14001 fec fec fec fec fec
ISO 50001 gfedc gfedc gfedc gfedc gfedc
Energy management training
fec fec fec fec fec
Water management training
gfedc gfedc gfedc gfedc gfedc
Solid waste segregation fec fec fec fec fec
Any other best practices that you have implemented

40
Appendix 2.3: Third survey Circulated in 2015 – this final revision was prepared after the workshops held in February 2015. It was further refined to give companies the option of including their contact details (but not compulsory) and also included further revisions to the range of data that was requested.

41
Welcome to the on-line survey to determine water and wastewater management practices within the South African Soft Drink industry. The information provided in this survey will be used to update the National Survey (Natsurv) document published by the Water Research Commission in the 1980s. All information will be considered confidential and you do not need to supply the company name. The survey consists of 18 pages and 20 questions, all of which are multiple choice, with space provided for more detailed information should you be willing to share. Many thanks for your time. Best regards Pollution Research Group
1. Please provide details on your company (optional)
Company Name
Company address
Contact person
Contact email
*2. Please indicate if you have been involved in this project previously and in what manner
fec
Site visit
fec
Workshop in Durban (2014)
fec First on-line survey (2013) fec Workshops in 2015
fec Second on-line survey (2014) fec No previous participation
If you have participated in the survey and recognise your organisation in the draft Guide, please indicate the company reference number

42
*3. Please indicate in which province you are located fec
Gauteng
fec
Limpopo
fec
Western Cape
fec Mpumalanga fec KwaZulu-Natal fec Northern Cape
fec North West fec Eastern Cape fec Free State
4. Please indicate the size of your company based on number of employees
fec Micro: < 50 fec Medium: 200 to 450 fec Small: 50 to 200 fec Large: > 450

43
*5. Please indicate your main product(s) as a percent of total production <10% 10-20% 21-30% 31-40% 41-50% 51-60% 61-70% 71-80% 81-90% 91-100%
Carbonated soft drink nmlkj nmlkj nmlkj nmlkj nmlkj nmlkj nmlkj nmlkj nmlkj nmlkj
100% fruit juice mlj mlj mlj mlj mlj mlj mlj mlj mlj mlj
Juice drinks (< 100%) nmlkj nmlkj nmlkj nmlkj nmlkj nmlkj nmlkj nmlkj nmlkj nmlkj
Bottled water mlj mlj mlj mlj mlj mlj mlj mlj mlj mlj
Energy drinks nmlkj nmlkj nmlkj nmlkj nmlkj nmlkj nmlkj nmlkj nmlkj nmlkj
Other Other (please specify)
mlj mlj mlj mlj mlj mlj mlj mlj mlj mlj

44
6. Please can you indicate the type of raw water pre-treatment that is carried out
fec None fec UV disinfection fec Sand filtration fec Chlorine disinfection
fec Membrane filtration fec Ozone treatment
fec Cartridge filtration fec Disinfection (other)
fec Bag filtration fec Coagulation and flocculation
fec Activated carbon fec Settling
Any other information

45
7. Please indicate which process steps are carried out at your site by ticking the appropriate box. Additional information can be added in the text box provided below the table.
fec
Process water treatment
fec
Tunnel Pasteurisation
fec
Labelling
fec Raw material storage fec Deaeration fec Shrink Wrapping
fec Sugar dissolving fec Carbonation fec Storage of product
fec Simple syrup preparation fec Aseptic filling fec PET bottle manufacturing
fec Final syrup preparation fec Hot filling fec CIP
fec In-line blending fec Cold filling fec Vehicle washing
fec Batch blending fec Bottle washing fec On-site PET preform manufacturing
fec Flash Pasteurisation fec Crate washing fec On-site CO2 production
Any other information
46
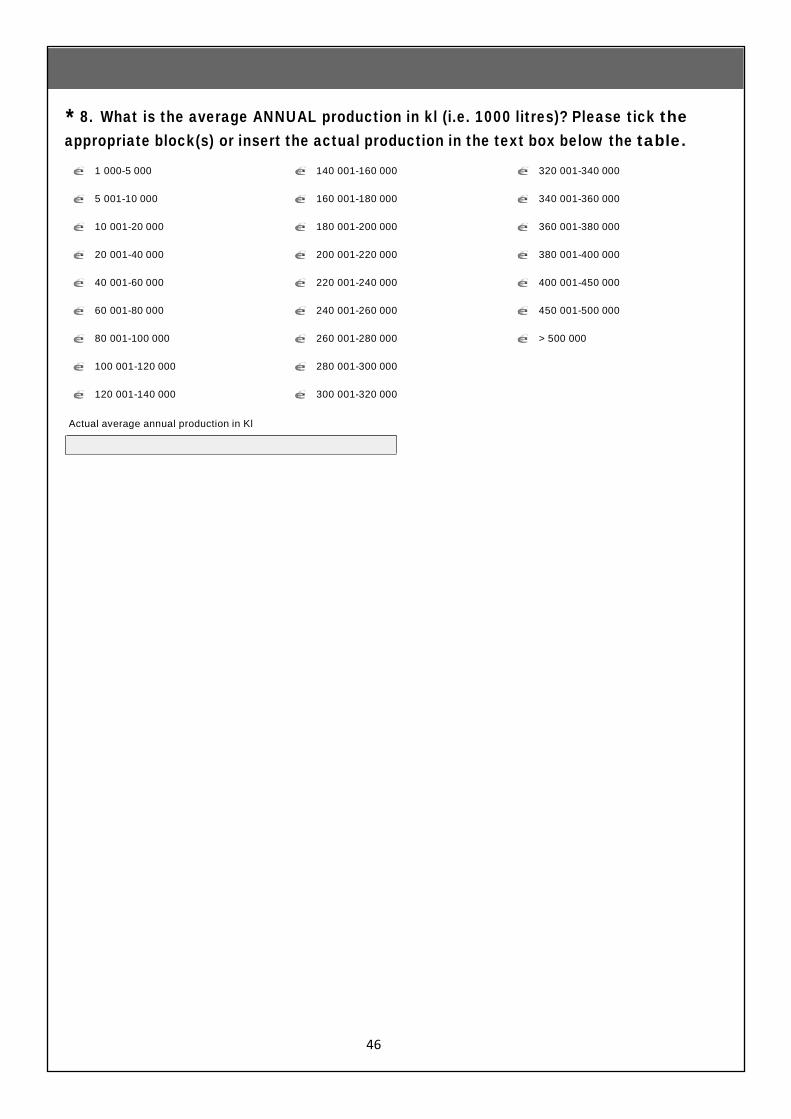
*8. What is the average ANNUAL production in kl (i.e. 1000 litres)? Please tick the appropriate block(s) or insert the actual production in the text box below the table.
fec
1 000-5 000
fec
140 001-160 000
fec
320 001-340 000
fec 5 001-10 000 fec 160 001-180 000 fec 340 001-360 000
fec 10 001-20 000 fec 180 001-200 000 fec 360 001-380 000
fec 20 001-40 000 fec 200 001-220 000 fec 380 001-400 000
fec 40 001-60 000 fec 220 001-240 000 fec 400 001-450 000
fec 60 001-80 000 fec 240 001-260 000 fec 450 001-500 000
fec 80 001-100 000 fec 260 001-280 000 fec > 500 000
fec 100 001-120 000 fec 280 001-300 000
fec 120 001-140 000 fec 300 001-320 000
Actual average annual production in Kl

47
*9. What is the average ANNUAL water consumption in Kl (i.e. 1 000 litres of m3)? Please tick the appropriate block(s) or insert the actual figure in the text box below the table. Please use the TOTAL incoming water data (i.e. water use based on municipal meter reading)
fec
0-2 000
fec
120 001-140 000
fec
300 001-320 000
fec 2 001-5 000 fec 140 001-160 000 fec 320 001-340 000
fec 5 001-10 000 fec 160 001-180 000 fec 340 001-360 000
fec 10 001-20 000 fec 180 001-200 000 fec 360 001-380 000
fec 20 001-40 000 fec 200 001-220 000 fec 380 001-400 000
fec 40 001-60 000 fec 220 001-240 000 fec 400 001-450 000
fec 60 001-80 000 fec 240 001-260 000 fec 450 001-500 000
fec 80 001-100 000 fec 260 001-280 000 fec > 500 000
fec 100 001-120 000 fec 280 001-300 000
Actual average ANNUAL water use in Kl

48
10. Where possible, please indicate the percentage of water used in various process stages by ticking the appropriate block. Please indicate if this data is metered, or if it is estimated.
<10% 10-20% 21-30% 31-40% 41-50% 51-60% 61-70% 71-80% 81-90% 91-100% Metered
Don't know
Water pre-treatment
gfedc gfedc gfedc gfedc gfedc gfedc gfedc gfedc gfedc gfedc gfedc gfedc
Mixing fec fec fec fec fec fec fec fec fec fec fec fec
Blending gfedc gfedc gfedc gfedc gfedc gfedc gfedc gfedc gfedc gfedc gfedc gfedc
Bottle washing
fec fec fec fec fec fec fec fec fec fec fec fec
CIP gfedc gfedc gfedc gfedc gfedc gfedc gfedc gfedc gfedc gfedc gfedc gfedc
General washing
Ablutions / admin
Utilities (boiler etc.)
fec fec fec fec fec fec fec fec fec fec fec
fec gfedc gfedc gfedc gfedc gfedc gfedc gfedc gfedc gfedc gfedc gfedc
gfedc
fec fec fec fec fec fec fec fec fec fec fec fec
Truck washing gfedc gfedc gfedc gfedc gfedc gfedc gfedc gfedc gfedc gfedc gfedc gfedc
Gardens fec fec fec fec fec fec fec fec fec fec fec fec
Please include any other water using areas not listed above

49
*11. What is your average specific water intake or average specific water use ratio (i.e. litres water used per litre product)? Please tick the appropriate block or insert the actual figure in the text block below the table. Please make sure that you use the TOTAL incoming water figure (i.e. municipal water meter reading)
fec
0 and < 1
fec
2.5 and < 2.8
fec 1 and <1.2 fec 2.8 and < 3.0
fec 1.2 and <1.5 fec 3.0 and < 3.2
fec 1.5 and < 1.8 fec 3.2 and < 3.5
fec 1.8 and < 2.0 fec 3.5 and < 4.0
fec 2.0 and < 2.2 fec 4.0 and < 4.5
fec 2.2 and < 2.5 fec 4.5 and above
Actual average specific water intake ratio

50
12. What is your estimated ANNUAL effluent volume as a percent of incoming water? If effluent volume is metered, then please supply the average monthly effluent volume.
fec
<10%
fec
51-60%
fec 11-20% fec 61-70%
fec 21-30% fec 71-80%
fec 31-40% fec 81-90%
fec 41-50% fec 91-100%
Average ANNUAL effluent volume in Kl

51
13. Please indicate any effluent treatment processes carried out on site prior to disposal to sewer
fec
No effluent treatment
fec
Flocculation
fec pH adjustment fec Segregation of concentrated process streams
fec Holding tank fec Anaerobic digestion
fec Screening fec Trucking of effluent for off-site disposal
Any additional information on effluent management

52
*14. Please indicate the average pH of the effluent from your factory by ticking the appropriate box. Any other information can be provided in the text box below the table.
fec
1-2
fec
6.1-7
fec
11.1-12
fec 2.1-3 fec 7.1-8 fec 12.1-13
fec 3.1-4 fec 8.1-9 fec 13.1-14
fec 4.1-5 fec 9.1-10 fec Don't know
fec 5.1-6 fec 10.1-11
Other (please specify)
53
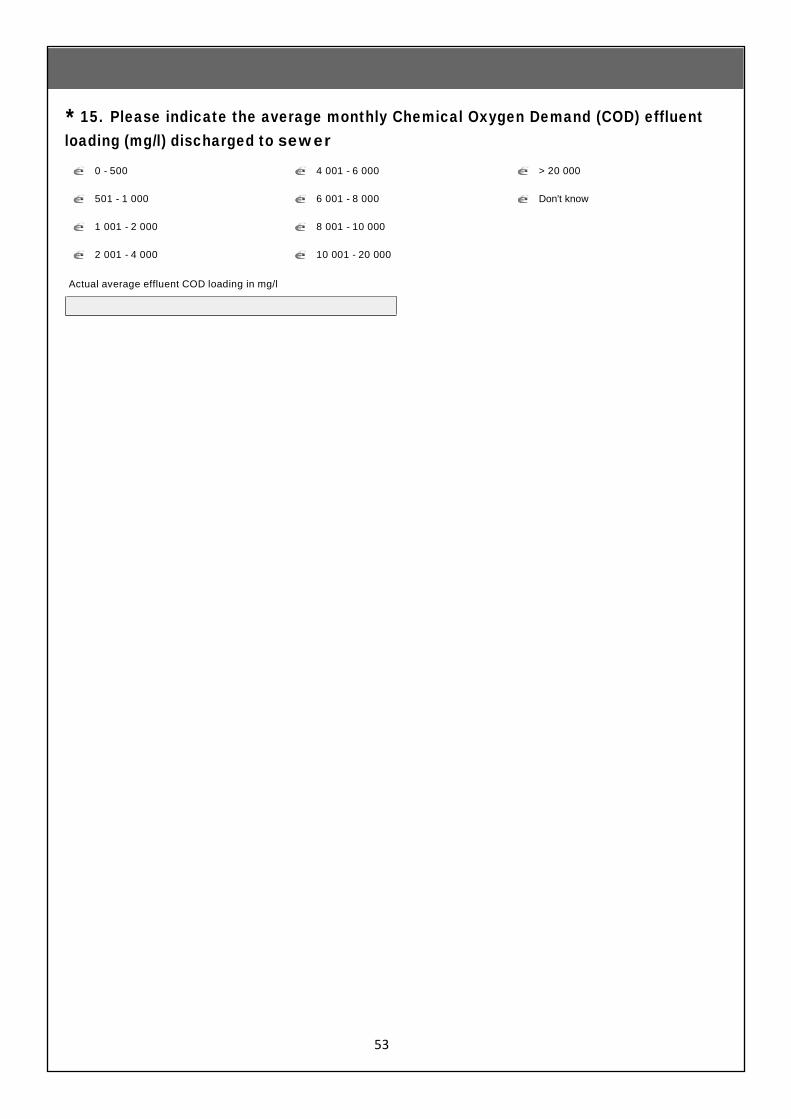
*15. Please indicate the average monthly Chemical Oxygen Demand (COD) effluent loading (mg/l) discharged to sewer
fec
0 - 500
fec
4 001 - 6 000
fec
> 20 000
fec 501 - 1 000 fec 6 001 - 8 000 fec Don't know
fec 1 001 - 2 000 fec 8 001 - 10 000
fec 2 001 - 4 000 fec 10 001 - 20 000
Actual average effluent COD loading in mg/l

54
*16. Please indicate the average monthly Total Dissolved Solids (TDS) effluent loading (mg/l) discharged to sewer
fec 0 - 50 fec 1 000 - 2 000 fec 5 000 - 10 000 fec 50 - 100 fec 2 000 - 3 000 fec > 10 000
fec 100 - 500 fec 3 000 - 4 000 fec Don't know
fec 500 - 1 000 fec 4 000 - 5 000
Or enter the actual average monthly TDS value (mg/l)

55
*17. Please indicate the average monthly Suspended Solids (SS) effluent loading (mg/l) discharged to sewer
fec 0 - 10 fec 101 - 150 fec 301 - 350 fec 11 - 20 fec 151 - 200 fec > 350
fec 21 - 50 fec 201 - 250 fec Don't know
fec 51 - 100 fec 251 - 300
Or insert actual average monthly SS value (mg/l)

56
*18. Please indicate the type of energy that is used on your site fec
Electricity
fec
Diesel for generators
fec Coal fec Diesel for trucks
fec Fuel oil (HFO) fec Petrol
fec Gas (LPG)
Any other comments on energy use

57
Energy use ratio
Use the following conversion factors to calculate total energy use: COAL: 24.3 MJ per kg LPG: 26.7 MJ per litre HFO: 41.6 MJ per litre DIESEL: 38.1 MJ per litre PETROL: 34.2 MJ/L
19. Please indicate your average energy use ratio (i.e. how many MJ are used to produce one litre - MJ/L) using the above conversion factors
fec
0 - 0.05
fec
0.21 - 0.3
fec
0.51 - 0.6
fec 0.051 - 0.1 fec 0.31 - 0.4 fec > 0.6
fec 0.11 - 0.2 fec 0.41 - 0.5 fec Don't know
Actual average energy use ratio in MJ/L

Best Practice 20. In order to obtain an idea of any best practices implemented by the soft drink industry, please indicate which of the following initiatives you have carried out or are planning: Planned In progress Implemented Not applicable Not planned
Water sub metering gfedc gfedc gfedc gfedc gfedc
Electricity sub metering fec fec fec fec fec
CIP recovery gfedc gfedc gfedc gfedc gfedc
Purge line recovery fec fec fec fec fec
Sand filter backwash recovery
gfedc gfedc gfedc gfedc gfedc
Carbon filter backwash recovery
fec fec fec fec fec
RO reject reuse gfedc gfedc gfedc gfedc gfedc
Reuse of bottle wash water fec fec fec fec fec
Water leak prevention programme
gfedc gfedc gfedc gfedc gfedc
Rain water harvesting fec fec fec fec fec
Water foot printing gfedc gfedc gfedc gfedc gfedc
Carbon foot printing fec fec fec fec fec
Water pinch analysis gfedc gfedc gfedc gfedc gfedc
Use of recycled content in bottles
fec fec fec fec fec
Reduced weight bottles gfedc gfedc gfedc gfedc gfedc
Heat recovery fec fec fec fec fec
Condensate recover gfedc gfedc gfedc gfedc gfedc
ISO 9001 fec fec fec fec fec
ISO 14001 gfedc gfedc gfedc gfedc gfedc
ISO 50001 fec fec fec fec fec
Energy management training
gfedc gfedc gfedc gfedc gfedc
Water management training
fec fec fec fec fec
Solid waste segregation gfedc gfedc gfedc gfedc gfedc
Any other best practices that you have implemented

NATSURV 3: Water and Wastewater Management in the Soft Drink Industry: 2nd Edition 2015
59
NATSURV 3: Water and Wastewater Management in the Soft Drink Industry (Edition 2)
Report to the Water Research Commission
By
Pollution Research Group University of KwaZulu-Natal, Durban
APPENDIX 3
Detailed Questionnaire for Site Visits

NATSURV 3: Water and Wastewater Management in the Soft Drink Industry: 2nd Edition 2015
60
This appendix contains the detailed questionnaire used when undertaking site visits with the participating companies. Two versions of the Excel questionnaire have been developed:
• Questionnaire for consultants – this consist of 11 sheets (and an introduction sheet) which provides a list of questions to be asked of the company. Included are tips on what aspects to look for on a site visit, and also a list of useful information that will assist in the analysis.
• Questionnaire for companies – this consists of 9 sheets (and an introduction sheet) which is essentially the same as the consultant’s questionnaire with the tips and lists removed.
Both questionnaires are attached as separate files.
The questionnaire for consultants is used to assist the interview process and site visit, while the one developed for the companies can be emailed to them for completion in their own time, or via a telephone call.
Sheet 1 lists the sheets provided in the questionnaire and a summary of the type of information requested. Sheets 10 and 11 are not present in the questionnaire that is sent to the companies directly.
The questionnaire was developed in order to determine the main aspects related to water and wastewater management practises within the soft drink sector. It needed to be focused and sufficiently brief such that the interview did not take more than an hour of the company’s time. It is therefore not a comprehensive Resource Efficiency and Cleaner Production (RECP) questionnaire and will only assist in providing an overview of the operations and practices within a soft drink factory.
MICROSOFT EXCEL QUESTIONNAIRE FILES ATTACHED IN THE CD:
• Appendix 3a - Questionnaire checklist for consultant • Appendix 3b - Questionnaire for companies
NATSURV 3: Water and Wastewater Management in the Soft Drink Industry: 2nd Edition 2015
61
NATSURV 3: Water and Wastewater Management in the Soft Drink Industry (Edition 2)
Report to the Water Research Commission
By
Pollution Research Group University of KwaZulu-Natal, Durban
APPENDIX 4
Summary of Relevant Regulations

NATSURV 3: Water and Wastewater Management in the Soft Drink Industry: 2nd Edition 2015
62
Regulation Soft Drink Products covered Main aspects
Depa
rtm
ent o
f Hea
lth
Foodstuffs, Cosmetics and Disinfectants Act, 1972 (Act No. 54 of 1972; Amendment Act, No. 39 of 2007) [with effect from 27 March, 2009]
All To control the sale, manufacture, importation and exportation of foodstuffs, cosmetics and disinfectants; and to provide for incidental matters.
- Regulations - soft drink (R1769/1985) Fruit and vegetable drinks; soda water, Indian or quinine tonic water, natural spring water and any sweetened
(flavoured or unflavoured) artificially carbonated water; and ginger beer
Limits on additives; pH must be greater than 2.5
- Regulations - soft drinks: Amendment (R317/2012) Formulated caffeine beverages (e.g. energy drinks)
Requirements for labelling products that contain more than 150 mg/l of caffeine, including that it is not recommended for children under 12 and pregnant / lactating women.
- Regulations relating to all bottled waters (R718/2006) Bottled water (natural, mineral, prepared, spring and water of origin) containing no sugar, sweeteners or
flavourants.
Outlines requirements for each type of bottled water including source, treatment, processing, packaging, labelling and transportation. Sets limits for various elements.
- Regulations relating to all bottled waters Amendment (R455/210) All bottled water
Replacement of the term bottled water with the term packaged water; a change in the levels of copper, manganese and fluoride, and the inclusion of a limit for nitrite.
- Regulations governing the labelling and advertising of foodstuffs All
Sets out requirements for labelling in terms of language, text size, presentation, identification of the product, prohibited statements and listing of ingredients.
- GNR.692 of 16 May 1997: Regulations governing microbiological standards for foodstuffs and related matters
- Including revisions o R.1296 - 16 October 1998 o R.427 - 5 May 2000 o R.490 - 08 June 2001 o R.1588 - 20 December 2002 o R.547 - 23 May 2008 o R.1207 - 14 November 2008 o R.706 - 2 September 2011
All types of bottled water; fruit juices (and other foodstuffs)
Sets out the tests and limits for bacteria and other microbial organisms.
- R 908: Regulations relating to the application of the Hazard Analysis and Critical Control Point system (HACCP system) 27th June 2003
All soft drink and bottled water manufacturers
Sets out the requirements for the HACCP system, without which certification a food and drink manufacturer cannot operate. The HACCP must fall in line with the Joint Food and Agricultural Organization / World Health Organization ("FAO / WHO") Food standards Programme Codex Alimentarius Commission's general requirements (food hygiene), entitled: "Hazard Analysis and Critical Control Point (HACCP) System and Guidelines for its Application", published in the Supplement to Volume 113-1997 document of the Commission.

NATSURV 3: Water and Wastewater Management in the Soft Drink Industry: 2nd Edition 2015
63
Regulation Soft Drink Products covered Main aspects
Depa
rtm
ent o
f Agr
icul
ture
For
estr
y an
d Fi
sher
ies
Marketing Act, 1968 (Act 59 of 1968): Regulations relating to the Classification, Packing and Marketing of Fruit Juice and Drink intended for Sale in the Republic of South Africa
Fruit juices and fruit drinks
- R 286: Amendment (7th November 1980) Fruit juices and fruit drinks Definitions; classification of fruit juice and drinks; required concentrations of juice; additives; prohibitive substances; containers and packing; marking requirements; methods of inspections
- R 929: Amendment (1st May 1981) - R 1325: Amendment (9th July 1982) - R 992: Amendment (13th May 1983) - R 602 : Amendment (30th March 1984) - R 641: Amendment (30th March 1984) Changes to definitions and requirements for blended fruit drinks
Agricultural Products Standards Act, 1990 (Act No 119 of 1990): Regulations relating to the classification, packing and marketing of Fruit Juice and Drink intended for Sale in the Republic of South Africa
Fruit juices and fruit drinks Replaces the Marketing Act, 1968
- R 1801: Amendment (17th November 1995) Changes to description of drinks; expansion of blended fruit drink categories; addition of allowed terms for marketing
- R411: Amendment (14th June 2013)
Changes to and expansion of some definitions; changes to some brix concentrations; changes to minimum juice contents; regulation of the use of certain terms on the packaging; minimum requirements for labelling

NATSURV 3: Water and Wastewater Management in the Soft Drink Industry: 2nd Edition 2015
64
Regulation Soft Drink Products covered Main aspects
Depa
rtm
ent o
f Wat
er a
nd S
anita
tion
National Water Policy for South Africa - White Paper. April 1997 All water users
Sets out the policy of the Government for the management of both quality and quantity of South Africa’s water resources. The first step in the review of the National Water Act of 1956.
National Water Act - 1998 (No. 36 of 1998)
All water users
Provides the legal framework for the effective and sustainable management of SA water resources. That is rivers, streams, dams, and ground water. It contains rules about the way that the water resource (surface and ground water) is protected, used, developed, conserved, managed and controlled in an integrated manner.
National Water Amendment Act - 1999 (No. 45 of 1999) National Water Amendment Bill - 1999 All water users
To amend the National Water Act, 1998 so as to effect textual improvements; and to change the procedure for the appointment of members of the Water Tribunal; and to provide for matters connected therewith.
Water Services Act - 1997 (No. 108 of 1997)
All water users
Deals mainly with water services or potable (drinkable) water and sanitation services supplied by municipalities to households and other municipal water users. It contains rules about how municipalities should provide water supply and sanitation services.
- General and special effluent Standards- Regulation no. 991 18 may 1984 - Requirements for the purification of waste water or effluent
- Discharge limits and conditions set out in the National Water Act, Government Gazette No. 20526, 8 October 1999
- National WATER ACT waste discharge standards DWA 2010 guidelines
All industries
Prescribes the requirements for the purification of waste water or effluent produced by or resulting from the use of water for industrial purposes and sets limits for effluent characteristics such as pH, temperature, cod, suspended solids, metals etc. And the test method to be used. Areas where the special standards must be applied are provided.
Water Services Amendment Act - 2004 (No. 30 of 2004) All water users
To amend the Water Services Act, 1997, so as to enable water boards to perform activities outside the borders of South Africa; and to provide for matters connected therewith.
Water Conservation and Demand Management National Strategy - Draft May 1999
All water users
(i) Contributes to the water conservation / demand management (WC/DM) components of the National Water Resources Strategy; (ii) serves as the nesting framework for the development of water WC/DM sectoral and regional strategies; (iii) describes and promotes a common understanding and interpretation of WC/DM principles for South Africa
National Water Resource Strategy (2012) All water users Set out strategies, objectives, plans, guidelines and procedures for the overall management of the national water resource as outlined in the National Water Act.

NATSURV 3: Water and Wastewater Management in the Soft Drink Industry: 2nd Edition 2015
65
Regulation Soft Drink Products covered Main aspects
Depa
rtm
ent o
f Env
ironm
ent
National Environmental Management Act, (Act 107 of 1998)
All industries
Reinforces the constitutional right of every person to an environment that is not harmful to his or her health or well-being; and everyone has the right to have the environment protected, for the benefit of present and future generations. through reasonable legislative and other measures that prevent pollution and ecological degradation; promote conservation; and secure ecologically sustainable development and use of natural resources while promoting justifiable economic and social development
National Environmental Management: Waste Act, (Act 59 of 2008)
All industries
Sets norms and standards on a national and provincial level; outlines the requirements for waste management plans; outlines waste management measures such as reduction, reuse, recycling and recovery; storage collection and transportation; treatment, processing and disposal; licensing requirements; and registration on the waste information system.
National environmental management: air quality act, 2004 (act no. 39 of 2004)
All industries
To reform the law regulating air quality in order to protect the environment by providing reasonable measures for the prevention of pollution and ecological degradation; to provide for national norms and standards regulating air quality monitoring, management and control by all spheres of government. Encourages the implementation of cleaner production and clean technology.
- No 1210 - National ambient air quality standards, 24th December 2009 All industries Sets limits for SO2, NO2, particulate matter (PM10), Ozone, Benzene, lead and carbon monoxide emissions.

66
NATSURV 3: Water and Wastewater Management in the Soft Drink Industry (Edition 2)
Report to the Water Research Commission
By
Pollution Research Group University of KwaZulu-Natal, Durban
APPENDIX 5
Articles from the Internet

67
This Appendix contains articles referenced from the internet in the event of the link no longer being valid. These references are:
• Cramer, B. (2013) Its getting hard for the soft drink industry. Available at: www.bidnessetc.com/20885-getting-harder-soft-drinks-industry.
• Euromonitor (2015) Country Report Executive Summary: South Africa. Available at: www.euromonitor.com/south-africa.
• FoodReview (2014). South African Food Review. Available at: http://foodreview.co.za/environmental/1286-nampak-bevan-introduces-aluminium-cans.

68
Its getting hard for the soft drink industry - As consumers grow increasingly health-conscious, what will soft drink companies do?
Published: October 1, 2013 at 7:59 pm EST
By: Bob Cramer

69
The first carbonated soft drink was created by accident in 1886. It led to the eventual creation of Coca-Cola (KO ) – a product which is now synonymous with the $520 billion global non-alcoholic beverage industry. Since then, a countless number of soft drinks have been invented and re- invented, but the most dominant recent trend in the industry is a move away from the traditional, sugary, carbonated beverages to non-carbonated and low-calorie versions of the original.
The use of sweeteners in carbonated beverages has been a topic of intense debate for quite some time. While beverage companies maintain their stance that the type and quantity of sweetener being used in their beverages, high fructose corn syrup, is not harmful to human health, numerous studies have shown a direct link between obesity and the consumption of sugary beverages. Even though beverage companies are sticking to their guns on the use of natural and artificial sweeteners, they are simultaneously looking at ways to cut down on harmful ingredients in their products.
In 1982, Coca-Cola became the first major beverage company to introduce a diet soft drink – Diet Coke – as a low-calorie version of its trademark
Coke brand. Since then, most of its competitors have followed suit. But even though huge sums of money have been spent on researching and developing a low-calorie sweetener that makes diet drinks taste just like the original, neither Coca-Cola nor PepsiCo (PEP ) have found an alternative to natural cane sugar.
Both companies still use a form of natural cane sugar to manufacture their beverages in some countries – like Mexico and Thailand – to maintain their traditional taste. Coke manufactured in Mexico, for example, is quite popular in the US, and loyal consumers claim that its taste is far superior to the Coke bottled and sold in the US.
But despite the huge fan base, beverage companies cannot ignore the fact that sugary carbonated beverages have consistently been losing market share for the past few years. We have compared the global nine-year revenue CAGR* for various segments within the non-alcoholic beverage industry in the table below:
As can be seen, consumers are moving away from the consumption of carbonated drinks and towards greater consumption of functional beverages like sports drinks and ready-to-drink tea. What is even more interesting is the fact that year-over-year (YoY) growth in the different segments in 2012 shows that the trend is amplifying. Sales of carbonated beverages grew only 2.2% YoY worldwide in 2012, even as sports and energy drinks grew at almost four times the pace. Notwithstanding that trend, however, carbonated soft drinks still account for the bulk of manufacturers’ revenues.

70
As consumers grow increasingly health-conscious, bottled water is another category that has witnessed robust growth rates. In fact, increasing health consciousness in consumers over the last few years has pushed major beverage companies to significantly diversify their product portfolios. Products like flavored water, ready-to-drink tea and coffee, and sports drinks were all introduced to cater to this trend. Coca-Cola has taken the lead in researching and developing such products, but PepsiCo and Dr. Pepper Snapple (DPS ) are not too far behind.
Within the carbonated soft drinks segment, volumetric growth in the diet soft drinks category has outpaced growth in the non-diet category by almost three times. Coca-Cola has caught on to the trend; in 2009, the company started using Stevia – a low-calorie natural sweetener – in its Diet-Coke and Coke Zero brands. Coca-Cola claims that Stevia contains 60% less calories than traditional sweeteners, and has a minimal effect on the original taste. By using Stevia, Coca-Cola hopes to transform its flagship brands’ image and revive growth in its carbonated beverages segment. The strategy has paid off: Diet Coke recently overtook Pepsi as the second-best selling soft drink in the US.

71
PepsiCo, on the other hand, says that Stevia does not work well with its soft drinks. While it has not yet switched to another ingredient for its carbonated drinks, PepsiCo is looking at alternative low-calorie sweeteners to keep up with the market.
Meanwhile, governments and health groups are increasingly promoting healthier beverage choices amongst customers. The average American still drinks around 42 gallons of carbonated soft drinks every year, down from 53 gallons a decade ago. Although functional beverages are gradually taking over carbonated soft drinks’ market share, the per capita consumption levels are still alarmingly high from a health perspective. The American
Medical Association has recently endorsed a ban on the marketing of carbonated energy drinks to consumers under the age of 18. The New York City Health Department is also engaged in a court battle with the industry over a ban on large sugary drinks sold at restaurants and fast food chains. High schools across the country are also removing sodas and carbonated soft drinks from their lunch menus, and replacing them with fruit juices and low-fat milk.
Beverage companies are only concerned with volumetric growth and earnings, and they do not like losing out to competition. If they acknowledge the secular trend and include healthy beverages in their product lines, they can keep their market shares and reputations for keeping up with the times.
To do that, all players in the global beverage industry need to remember one thing: go healthy, or go home. Visit us again for an in-depth analysis on Coca-Cola and PepsiCo.
*Compound Annual Growth Rate

72
Euromonitor International: www.euromonitor.com
Soft Drinks in South Africa April 2015
EXECUTIVE SUMMARY
Packaging design remains vital to success in soft drinks
In 2014, the soft drinks market in South Africa continued to witness increasing competition as more players entered various categories. The key strategy for most new entrants was to introduce their products at relatively low unit prices in order to encourage volume sales. Packaging design also stood out as one of the key drivers of success in categories where value addition is limited, with a typical example being bottled water, where competition is stiff in terms of both quality and pricing. The ultimate success of a product in such categories tends to boil down to how it is packaged and promoted.
Private label soft drinks continue to shake up the market
Private label products are increasingly becoming an important part of the soft drinks market as more retailers invest in improving product quality as well as allocate more shelf space to these ranges. Consumers are slowly gaining trust in private label soft drinks in terms of their perceived quality. Private label soft drinks in most retail outlets have been positioned as providing value for money in terms of average unit price in a market where consumer spending is under pressure from a sharp rise in the cost of living whilst income growth remains suppressed.
Coca-Cola remains strong despite competition from smaller players
Coca-Cola South Africa (Pty) Ltd continued to lead soft drinks in South Africa in 2014. The company’s leadership continued to be driven by its diversity in terms of product coverage across different soft drinks categories. Carbonates remained a key contributor to the company’s overall success in South Africa. Despite the company’s strong position, smaller players are increasingly exerting pressure on Coca-Cola through introducing new products in categories previously dominated by Coca-Cola and other well-known brands.
New brands enter energy drinks
Energy drinks continued to see the entrance of new players in 2014 as more manufacturers recognised the potential of the category. Energy drinks is currently seen as a category where profit margins are much higher than in more mature categories such as carbonates, where competition is also stiff. Up-and-coming soft drinks manufacturer Little Green Beverages introduced an energy drink in late 2014 under the Refreshhh brand. The average unit price of existing brands is expected to take a dip as the leading players try to fight off price competition from up-and-coming small brands.
Supermarkets to remain an important channel for soft drinks distribution
The supermarket channel continued to lead volumes sales of soft drinks in South Africa in 2014. Most consumers across the country often do their shopping in supermarkets as these outlets are considered much cheaper than other channels when it comes to grocery items such as soft drinks. As the aim of most manufacturers is to maximise their returns, supermarkets provide an effective platform for soft drinks sales to a wider market, hence accounting for a significant portion of sales.
Carbonates in South Africa April 2015 EXECUTIVE SUMMARY
TRENDS
• Carbonates in South Africa are becoming increasingly competitive as more players enter the category, which was previously dominated by just a few companies, such as Coca-Cola. These new players are mainly smaller companies which are using lower unit prices as their key selling point. Subsequently, consumers have greatly benefited from having a broader range of products to choose from in terms of both price and quality.

73
COMPETITIVE LANDSCAPE
• Coca-Cola South Africa (Pty) Ltd continued to dominate carbonates in 2014 with a 71% share of off-trade volume sales. The company continued to benefit from a broad product portfolio, offering brands in almost every category. Coca-Cola has also built strong relationships with various retailers across the country, which has made it relatively easy to distribute its brands to a wider market. The company has also been able to reach out even to independent retailers within township areas where the majority of lower LSM consumers reside.
PROSPECTS
• The volume sales growth of carbonates is expected to remain stable over the forecast period, even slightly increasing. The introduction of cheaper brands can be expected to help stabilise the category in terms of value growth as competition is likely to be driven by lower-priced products in a category where consumers are continuously embracing new products with less scrutiny due to improved quality and distribution.
RTD Tea in South Africa April 2015 EXECUTIVE SUMMARY
TRENDS
• RTD tea remained a niche category in South Africa in 2014, with consumption limited to a small group of consumers. Per capita consumption in the country stood at 1.2 litres, up slightly from 1.1 litres the previous year. Low consumption can be attributed to the fact that RTD tea is still fairly new to South Africans, with the average consumer not considering it as a soft drinks option. This general perception, however, is slowly changing as existing players invest more in promoting RTD tea products across the country.
COMPETITIVE LANDSCAPE
• Bos Brands (Pty) Ltd continued to gain ground in RTD tea in 2014. The company’s sales growth continued to be driven by its broad product range in terms of iced tea flavours as well as RTD tea variants. Being the pioneer in categories such as carbonated RTD tea, it has been relatively easy for Bos Brands to reach out to consumers in terms of innovation.
PROSPECTS
• RTD tea in South Africa is expected to achieve healthy volume growth over the forecast period, primarily due to more brands entering the category. The entry of new players is expected to bring price stability as consumers will have a wider range of products to choose from.
Bottled Water in South Africa April 2015 EXECUTIVE SUMMARY TRENDS
• The expansion of the bottled water category in South Africa remains highly restricted due to the availability of clean tap water, which consumers can always opt for if they cannot afford or choose not to buy bottled water. This has forced manufacturers to resort to introducing innovative pack types in an effort to attract consumers. One strategy has been to introduce larger pack sizes, which are much cheaper than smaller on-the-go packs. Such products, however, appeal more to consumers with bigger families, whilst smaller households continue to opt for smaller pack types.
COMPETITIVE LANDSCAPE
• Coca-Cola South Africa (Pty) Ltd continued to lead bottled water in 2014 with a 35% share of off-trade volume sales. The company prides itself on its broad brand portfolio. Its popular brands include Valpre, Bonaqua and Glacéau, which leads the functional bottled water category.

74
PROSPECTS
• Bottled water in South Africa is expected to remain fairly stable over the forecast period, posting an off-trade volume CAGR of 5%. Category expansion, however, is expected to be restricted by the fact that the country’s tap water is clean and consumers always have another option if bottled water prices become too high.
Concentrates in South Africa April 2015 EXECUTIVE SUMMARY
TRENDS
• Consumers in South Africa in 2014 continued to embrace concentrates as a cheaper alternative to other soft drinks such as carbonates and juice. The consumption of concentrates is prevalent among lower to middle LSM consumer groups as the average unit price of most concentrates is fairly affordable considering that they last much longer and go further than other soft drinks.
Juice in South Africa April 2015 EXECUTIVE SUMMARY
TRENDS
• The volume growth of juice in South Africa remained under threat from limited household income growth. Consumers with limited incomes generally perceive juice to be a luxury soft drink as there are other cheaper alternatives available, such as carbonates and concentrates.
COMPETITIVE LANDSCAPE
• Ceres Fruit Juices (Pty) Ltd continued to lead juice in 2014 with an off-trade volume share of 22%. The company’s leadership is mainly down to its Ceres brand, which has become a household name in the category as it has been around for quite some time. Ceres Fruit Juices is owned by Pioneer Food Group Ltd, which also has a broad portfolio of other juice brands, which includes Liqui-Fruit, Liqui-Fruit Junior and Fruitree. Pioneer Food Group has been able to build solid relationships with retailers, which has enabled it to create a strong distribution network across South Africa.
PROSPECTS
• Ongoing healthy off-trade volume growth is anticipated for juice over the forecast period, with the category projected a CAGR of 5%. Demand is expected to remain limited to middle to high-income consumers as juice will likely remain relatively expensive when compared with other soft drinks such as carbonates and concentrates.

75
South African Food Review http://foodreview.co.za/environmental/1286-nampak-bevan-introduces-aluminium-cans
From steel to aluminium Written by Staff writer Published: 16 July 2014
Nampak Bevcan recently announced it would commence with the use of aluminium cans, in addition to the traditional tin-plated steel beverage cans currently on the market. Its Springs Nuffield plant in the Ekurhuleni Metropolis has the first aluminium line installation, with two more existing tinplate lines to be converted.
Managing director Erik Smuts says: ‘The decision to move to aluminium-bodied cans was a natural progression due to the inherent advantages the conversion will hold for the economy, the beverage industry, consumers and the environment.’
The new aluminium can lines will be capable of running eight can sizes and produce cans at speeds of up to 3000 cans per minute, as opposed to the 1600 steel cans currently produced per minute. ‘Aluminium is already the preferred medium for beverage cans internationally,’ Smuts adds. ‘Globally, 85 per cent of all beverage cans are made from this material.’
According to the company, the benefits of this conversion include the ability to hedge aluminium, which could make it a more stable commodity; transparent material costs, compared to the more volatile price fluctuations with steel; and reduced transportation costs, given that aluminium weighs 60 per cent less than steel.
The conversion to aluminium will also result in a significantly improved carbon footprint status. Approximately 10 per cent less energy will be used in the manufacturing process owing to no external coating being required, only one bank of spray machines and one oven used, and conveying in the production line reduced by two thirds.
Collect-a-Can’s Zimasa Velaphi comments: ‘The value of used aluminium cans is much higher than that of tin-plated steel cans. The conversion will therefore be a more economically viable option for informal can collectors to earn a living or supplement a low income, which will ultimately result in an increase in recycling volumes. Currently the recycling rate of all beverage cans recycled in South Africa is estimated at 72 per cent, significantly more than any other beverage format in South Africa.’
It is estimated that between R100 million and R200 million a year would flow into the scrap metals and recycling industry, allowing an additional 2 000 to 3 000 people a source of income from collecting and selling used cans.