wrc report no. tt 721/17 july 2017
TRANSCRIPT

NATSURV 6: WATER, WASTEWATER AND ENERGY MANAGEMENT AND
RECOMMENDATIONS FOR BEST PRACTICE IN THE CANE SUGAR PROCESSING
INDUSTRY
P.J. WELZ & A. NDOBENI
CAPE PENINSULA UNIVERSITY OF TECHNOLOGY
WRC Report No. TT 721/17
July 2017

i
Obtainable from: Water Research Commission Private Bag X03 Gezina 0031 South Africa [email protected] or download from www.wrc.org.za This report emanates from a project entitled Natsurv 6: Water, Wastewater and Energy
Management and Recommendations for best practice in the cane sugar processing industry
(K5/2504)
ISBN 978-1-4312-0897-5 Printed in the Republic of South Africa © Water Research Commission
DISCLAIMER
This report has been reviewed by the Water Research Commission (WRC) and approved
for publication. Approval does not signify that the contents necessarily reflect the views
and policies of the WRC, nor does mention of trade names or commercial products
constitute endorsement or recommendation for use.
ii
EXECUTIVE SUMMARY
Background to the NATSURV series
Manufacturing and processing industries consume significant quantities of energy and water,
and generate large volumes of wastewater. This prompted the Water Research Commission
(WRC) of South Africa to commission 16 national surveys (NATSURVs) of various agricultural
and non-agricultural industries (malt brewing, poultry, red meat, edible oil, sorghum malt,
beer, dairy, sugar, metal finishing, soft drink, tanning/leather finishing, laundry, textile, oil and
refining, and power generating), culminating in the publication of 16 separate NATSURV
documents between 1986 and 2001. Much of the information in the original series is now
out-dated, and the WRC therefore commissioned a new series of NATSURV documents,
starting in 2014.
The aims and objectives of the NATSURV series
The objective is for the NATSURV series to serve as guides and benchmark tools for
stakeholders, including local governments, industry players, academics, researchers and
engineers. The aims of the NATSURV document pertaining to the South African sugar industry
were adapted from the WRC terms of reference. The primary aims of this publication are:
➢ To provide an overview of the sugar processing industry in South Africa, highlighting
changes that have taken place since the previous NATSURV was published in 1990
and noting projected changes.
➢ To provide information about generic industrial processes, with an emphasis on water
use and wastewater generation and treatment, and also to provide very basic
information on energy use.
➢ To provide information about relevant national and local legislation and by-laws
pertaining to water usage and wastewater generation.
➢ To provide water consumption, specific water consumption and wastewater
generation data (local and global indicators).
➢ To provide information about typical pollutant loads in different effluent streams.
➢ To recommend best practices for water use (intake, treatment, and discharge), and
indicate the extent to which the “reduce, reuse, recycle” principle has been adopted.
Collection of information and data
Information was collected via desktop studies of current literature, by conducting telephonic
interviews and site visits, and by distributing and collecting questionnaires. The South African
Sugar Association and South African Sugar Millers Association served as intermediaries
between the project team and the sugar industry. A draft document was distributed to
industry representatives and to members of the reference group, and a workshop was held
to elicit comments that were taken into consideration when compiling the final document.

iii
Document summary
The document consists of eight sections, including an introduction (Section 1), an overview of
sugar cane processing (Section 2), and recommendations for best practice (Section 7). The
salient points from the remaining sections (Sections 3 to 6) have been extracted for this
executive summary:
Section 3: Environmental and water use regulations and policies applicable to the
sugar industry
Most of the South African sugar mills and/or refineries are older than 50 years, and are
therefore classed as “existing lawful users” for water abstraction in terms of the National
Water Act. Permits for water abstraction from rivers are provided by the Department of
Water and Sanitation. For the majority (9/12) of the study respondents, the relevant limit for
discharge of effluent via irrigation or to rivers is a maximum chemical oxygen demand of
75 mg/L, and there is generally good compliance. One mill discharges to a marine outfall, and
is subject to more comprehensive limits stipulated by the relevant Coastal Management
Agency, while two mills discharge to municipal sewerage systems and need to comply with
municipal limits.
Section 4: Water use and management
Sugar cane contains approximately 70% water, so sugar mills can theoretically operate as net
water producers if process water is reused. Water reuse is the norm and the most important
means of limiting the need for external water supplies by sugar processing facilities. The
quality of water required for each process differs, and recycling loops are tailored so that the
water used for each is “fit for purpose”.
All of the study respondents indicated that they meter their water use, and have water use
targets in place. This is very positive, because it has been shown globally that metering results
in reduced water intake by industries because it creates awareness of water consumption.
Water sources include river water, potable and raw municipal water, borehole water, and
combinations of these.
The specific water intake (SWI) for sugar processing is defined as the volume (in kl) of water
used to process one ton of sugar cane. The SWI determined from the questionnaires for
stand-alone mills ranged from 0.04 to 1.13 kl/ton cane (average 0.37 kl/ton). The mill with
the lowest SWI does not have access to river water for abstraction, with 50% of water intake
being potable municipal water. A concerted effort and implementation of “best practice”
policies, and water-saving infrastructure, processes and policies has allowed this mill to effect
considerable water saving through the years.
Section 5: Wastewater generation and management
In sugar cane processing facilities, different streams of effluent are generated, each having a
particular composition. The character and volume is largely determined by the processes and

iv
equipment that are used at individual facilities. As a general rule, all streams contain
inorganics and suspended solids in varying concentrations that can be removed using primary
physicochemical processes, such as settling and flocculation. Process effluent, wash water
etc. contain high concentrations of organics (mainly sugars and sugar metabolites), and lend
themselves to secondary biological treatment. The temperature of cooling tower blow-down
and effluent from boiler scrubbers is elevated; this needs to be taken into account if the
effluent is discharged directly to the aqueous environment. Ideally, each stream should be
treated and discharged separately, but in practice they are usually combined.
In comparison to water intake, only 75% of respondents indicated knowledge of wastewater
discharge volumes (metered or estimated). No wastewater quality data was provided by the
industry. To offer readers information about the character of effluent quality from cane sugar
processing, global literature data has been included in this document.
Section 6: Energy use and management
The bulk of the energy requirements of the South African sugar industry is provided by
combustion (bagasse, coal, wood or spent bark). Less than 4% of energy is derived from the
grid, while 81% is derived from combustion of bagasse. The industry is in a position to be a
net exporter of electricity, with some mills already selling power derived from the combustion
of bagasse to Eskom. This is seen as a carbon-neutral source of energy, and deserves more
detailed information. However, the main focus of this NATSURV is water and wastewater
management, so the section on energy management has been kept succinct.

v
ACKNOWLEDGEMENTS
The project team would like to thank:
➢ The South Africa Sugar Association and the South African Sugar Millers’ Association,
for providing the vital link between the project team and the sugar industry.
➢ The Sugar Milling Research Institute for providing valuable feedback.
➢ The milling companies (in alphabetical order) for providing the data for this document,
and the industry representatives for providing feedback and contributing to
constructive discussion during the workshop:
- Gledhow Sugar Company (Pty) Ltd
- Illovo Sugar South Africa Ltd
- RCL Foods Sugar and Milling (Pty) Ltd
- Tongaat-Hulett Sugar South Africa Ltd
- UCL Company (Pty) Ltd
- Umfolozi Sugar Mill

vi
Table of contents EXECUTIVE SUMMARY ............................................................................................................... ii
ACKNOWLEDGEMENTS .............................................................................................................. v
List of Abbreviations .................................................................................................................. 1
Section 1: Introduction (background, methodology, delimitation) ........................................... 2
1.1 Industry overview ................................................................................................................... 3
1.1.1 What is sugar? ........................................................................................................................ 3
1.1.2 Uses for sugar......................................................................................................................... 4
1.1.3 Global and local sugar production volumes and trends ........................................................ 4
1.1.5 Sugar cane plantations and mills in South Africa ....................................................................... 6
Section 2: Overview of sugar cane processing .......................................................................... 9
2.1 Production of raw sugar from sugar cane................................................................................... 10
2.1.1 Cane preparation ................................................................................................................. 10
2.1.2 Juice extraction .................................................................................................................... 10
2.1.3 Clarification .......................................................................................................................... 10
2.1.4 Evaporation .......................................................................................................................... 11
2.1.5 Crystallisation ....................................................................................................................... 12
2.1.6 Separation and drying .......................................................................................................... 12
2.2 Sugar refining .............................................................................................................................. 12
2.2.1 Melting ................................................................................................................................. 12
2.2.2 Clarification (primary decolourisation) ................................................................................ 12
2.2.3 Decolourisation .................................................................................................................... 14
2.2.4 Evaporation .......................................................................................................................... 14
2.2.5 Crystallisation ....................................................................................................................... 14
2.2.6 Separation of sugar crystals and molasses .......................................................................... 14
2.2.7 Drying and conditioning ....................................................................................................... 14
2.3 Sugar milling and refining in South Africa ................................................................................... 15
2.4 Process inputs and outputs: beneficial uses for by-products ..................................................... 16
2.4.1 Bagasse................................................................................................................................. 16
2.4.2 Molasses............................................................................................................................... 16
2.4.3 Filter and clarification mud cakes ........................................................................................ 17
2.4.4 Sludge ................................................................................................................................... 17
Section 3: Environmental and water use regulations and policies applicable to the cane
sugar processing industry ........................................................................................................ 19

vii
3.1 Introduction ................................................................................................................................ 19
3.1.1 National policies ................................................................................................................... 19
3.2 Water and wastewater policies .............................................................................................. 20
3.2.1 Water abstraction ................................................................................................................ 22
3.2.2 Water and wastewater storage, including dams and treatment and evaporation ponds .. 22
3.2.3 Effluent disposal ................................................................................................................... 22
Section 4: Water Use and management .................................................................................. 27
4.1 Introduction ................................................................................................................................ 27
4.2 Sources of water for sugar processing ........................................................................................ 27
4.3 Specific water intake – local and global ...................................................................................... 28
4.4 Water recycling and reuse .......................................................................................................... 29
4.5 Simple water-saving measures ................................................................................................... 32
Section 5: Wastewater generation and management ............................................................ 35
5.1 Quality and quantity of wastewater produced ........................................................................... 35
5.1.1 Volume of wastewater generated: monitoring and metering ............................................. 35
5.1.2 Recycling of wastewater and specific wastewater discharge .............................................. 35
5.1.3 Wastewater quality: local and global ................................................................................... 37
5.2 Treatment, management and disposal of wastewater by the local sugar cane processing
industry ............................................................................................................................................. 40
Section 6: Energy use and management ................................................................................. 43
Section 7: Best practice for water and wastewater management in the sugar industry ........ 45
7.1 Introduction ................................................................................................................................ 45
7.2 Summary of guidelines for best practice .................................................................................... 45
7.3 Application of environmental indicators .................................................................................... 48

1 | NATSURV Water, wastewater and energy management in the South African sugar industry
List of Abbreviations
BER Mill with back-end refinery
BOD Biological oxygen demand
CIP Cleaning-in-place
COD Chemical oxygen demand
CW Cooling water
DEA Department of Environmental Affairs
DWA Department of Water Affairs
DWAF Department of Water Affairs and Forestry
DWS Department of Water and Sanitation
EAA Environmental and Agricultural Affairs
EIN Environmental indicator
EMP Environmental management plan
IWRM Integrated water resource management
KZN KwaZulu-Natal
NA Not applicable
NAMC National Agricultural Marketing Council
NATSURV National survey
NG Not given
NWA National Water Act
R Refinery
SAM Stand-alone mill
SASA South African Sugar Association
SASID South African Sugar Industry Directory
SS Suspended solids
SWDV Specific wastewater discharge volume
SWI Specific water intake
TSS Total suspended solids
WIN Water use indicator
WSA Water Services Act
WRC Water Research Commission

1 | NATSURV Water, wastewater and energy management in the South African sugar industry

2 | NATSURV Water, wastewater and energy management in the South African sugar industry
Section 1: Introduction (background, methodology,
delimitation)
Manufacturing and processing industries consume significant quantities of energy and water,
and generate large volumes of wastewater. This prompted the Water Research Commission
(WRC) of South Africa to commission 16 national surveys (NATSURVs) of various agricultural
and non-agricultural industries (malt brewing, poultry, red meat, edible oil, sorghum malt,
beer, dairy, sugar, metal finishing, soft drink, tanning/leather finishing, laundry, textile, oil and
refining, and power generating), culminating in the publication of 16 separate NATSURV
documents between 1986 and 2001. These documents included information about
production processes, water usage, solid waste generation, and wastewater quality, quantity,
and treatment practices.
In response to a number of inter-related factors, including increasing costs of waste disposal,
more stringent legislative requirements, and increasing environmental awareness, more
sustainable methods are constantly being implemented by industry to reduce qualitative and
quantitative industrial pollutant loads and reuse water and waste. In addition, significant
market-related changes have taken place in many industries over the decades. Much of the
information in the original NATSURV series is therefore out-dated, and the WRC
commissioned a new series of NATSURV documents. The objective of the NATSURV series is
to serve as comprehensive guides and benchmark tools for stakeholders, including local
governments, industry players, academics, researchers and engineers.
This document is an updated and expanded version of the previous NATSURV entitled “Water
and wastewater management in the sugar industry” (WRC TT-47-90). The report includes data
stemming from a basic audit of the sugar industry from both a local and global perspective.
When compared to the original, the new document includes an additional section on energy
management, a report on adoption/non-adoption of sustainable procedures by the industry,
and features changes which have taken place over the last two and a half decades since the
first NATSURV was published.
The following methodology was used to obtain data. Firstly, background information was
obtained using desktop studies. Then, working closely with the South African Sugar
Association (SASA), site visits were performed and questionnaires were distributed. Separate
questionnaires were prepared for mills with back-end refineries (Appendix 1), stand-alone
mills, and stand-alone refineries. Questionnaires were obtained from three of the four mills
with back-end refineries (75% compliance), eight of the ten stand-alone mills (80%
compliance), and the stand-alone refinery, giving an overall compliance to the request for
questionnaire completion of 80%. The processing facilities included in the survey were
delimited to those that mill and/or refine sugar cane and raw cane sugar, respectively. Further
upstream (agriculture, transport of cane, etc.) and downstream (value-added) processes were

3 | NATSURV Water, wastewater and energy management in the South African sugar industry
mostly excluded. Other mills that produce speciality sugars were excluded (e.g. wet mills that
produce glucose from maize).
1.1 Industry overview
1.1.1 What is sugar?
The building blocks of all carbohydrates are monosaccharides and disaccharides, the words
being derived from the Latin for one (mono), two (di), and sugar (saccharum). A number of
these sugar molecules exist, all with different structures. Common monosaccharides like
glucose and fructose can be extracted from various agricultural crops like maize and wheat
(Figure 1). Sugar, however, is also the colloquial term for sucrose, which is a disaccharide of
glucose and fructose, and is mainly extracted from the juice of sugar beet or sugar cane plants.
Unlike other crops, these are grown primarily for sugar extraction. Sugar cane is harvested by
chopping off the stems (canes) while leaving the roots so that the plant can grow again,
making it a highly sustainable crop. Sugar beets are planted every year and account for less
than 20% of sugar production globally. Traditionally, cane is used for the production of edible
sugar in South Africa.
The sugar industry combines agriculture and manufacturing to produce raw and refined
sugar. The local industry is one of the world's leading producers of cost-competitive, high-
quality sugar from sugar cane, accounting for around 1% of global production. The industry
makes a vital contribution to employment, particularly in the rural parts of the country, and
contributes significantly to the local economy. It also contributes to the South African gross
domestic product, with exports to other African countries, as well as Asia and the Middle East.
Figure 1: Monosaccharides and disaccharides can be produced from a range of agricultural
feedstock, including glucose and fructose from maize (A) and corn (B), and sucrose from
sugar beet (C) and sugar cane
B A C

4 | NATSURV Water, wastewater and energy management in the South African sugar industry
1.1.2 Uses for sugar
It is common knowledge that sugar can be used as a sweetening agent and is added to foods
or drinks to make them taste more pleasant. For example, sugar balances the bitterness of
coffee or reduces the tartness of sour fruit. In addition, sugar is used as a natural preservative
that binds water to prevent the growth of micro-organisms, therefore reducing food spoilage,
as in jams and preserves (Figure 2).
Sugar is widely used as a feedstock for the production of bioethanol. Approximately half of
the light vehicles in Brazil, the world’s largest sugar producer, are capable of running on 18–
25% ethanol and almost half of the sugar cane crop in that country is used to produce
bioethanol. This is somewhat controversial because rain forests have been cleared to plant
sugar cane.
Sugar is also used as a retardant to slow the setting of cement and glues, as a component of
detergents (sucrose esters), and in the pharmaceutical industry.
Figure 2: Sugar is used in food and beverages as a sweetener and/or as a preservative.
Almost half of the sugar cane in Brazil is used to produce bioethanol.
1.1.3 Global and local sugar production volumes and trends
Cane sugar is produced in regions with tropical or sub-tropical climates, and beet sugar in
temperate regions of the northern hemisphere. The European Union, as the largest producer
of sugar from beets, accounts for approximately 9% of global sugar production. In
comparison, South Africa accounts for close to 1% of global production of saleable sugar from
sugar cane.
Brazil is, by far, the largest grower of sugar cane, producing double that of its closest
competitor, India (Figure 3).

5 | NATSURV Water, wastewater and energy management in the South African sugar industry
Figure 3: Sugar cane production figures for the ten highest global producers, plus South
Africa, in 2013 (FAOSTAT, 2013)
Although almost all cane is destined for sugar production, the optimal growth cycle can be
>12 months, so that only around 70% is harvested each calendar year. The area of land
planted with cane decreased continuously between the 2001/2002 and 2011/2012 seasons
(Figure 4). Other factors, notably the prevailing climatic conditions, have a marked effect on
sugar production. This was demonstrated by the recent drought in 2014 and 2015, which led
to low yields in the 2015/2016 season. Although a similar area of land was planted to cane in
2014/2015 and 2015/2016, the yield decreased from an estimated 65.14 to 54.36 per hectare
of harvested cane, and the amount of cane required for the production of one ton of sugar
increased from 8.39 to 9.12 tons. Close to 15 million tons of sugar cane were crushed in
2015/2016, yielding over 1.6 million tons of saleable sugar, but this was 23% less than in
2014/2015 (SASID, 2016/2017).
Figure 4: Agricultural land planted to sugar cane (sum of green and blue) and harvested
for sugar production (blue) in South Africa (SASID, 2015/2016)

6 | NATSURV Water, wastewater and energy management in the South African sugar industry
Although sugar is in high demand, global prices are distorted; long-term average prices are
less than production costs because some governments provide extensive financial support
in the form of subsidies to local industries. To counter this, many countries, including South
Africa, apply tariffs and other measures to protect local markets. The highly competitive
nature of the global market has made it difficult for countries to export sugar profitably.
There has been a decreasing trend in local export sales over the years since 2001, which
have been compensated for to some degree by an increase in local sales (NAMC, 2016;
Figure 5).
Figure 5: The amount of saleable cane sugar produced in South Africa and sold in global
and local markets from 2001/2002 to 2015/2016 (SASID, 2016/2017)
1.1.4 Sugar cane plantations and mills in South Africa
The bulk of the sugar cane plantations in South Africa are in KwaZulu-Natal (Figure 6), but
some are located in Mpumalanga and the Eastern Cape. In 2016, there were around 21 889
registered cane growers, of which approximately 94% were small-scale growers that supplied
10.3% of the total crop. Of the 1 327 large-scale growers, about a quarter were black
emerging farmers.
Milling companies that own their own estates produce 8.2% of the cane crop (SASID, 2016).

7 | NATSURV Water, wastewater and energy management in the South African sugar industry
Figure 6: A typical sugar cane plantation in South Africa
To prevent spoilage, sugar cane needs to be processed rapidly after harvesting. For logistical
reasons, the 14 sugar mills in South Africa are located in the same regions as the plantations
(Figure 7). In 1990, when the original NATSURV was published, there were 16 mills and a
central refinery. Some consolidation has taken place, and there are currently 14 mills and a
central refinery.
Figure 7: Location of the plantations and 14 sugar mills in KwaZulu-Natal (adapted from
the South African Sugar Association website)
Key:
Irrigated areas
Rain fed areas
Sugar mills

8 | NATSURV Water, wastewater and energy management in the South African sugar industry
Section 1 References:
Burrell, A., Himics, M., van Doorslaer, B., Ciaian, P., Shrestha, S. (2014). European Union (EU) sugar
policy: A sweet transition after 2015? TRC Scientific and Policy report.
Canadian Sugar Institute website: http://www.sugar.ca [accessed 28/07/2015].
Copeland, M. (2015). World sugar news. SA Sugar Journal, 99: 64-65.
Food and Agricultural Organisation Statistics (FAOSTAT) of the United Nations website:
http://www.faostat3.fao.org [accessed 05/08/2015].
Illovo sugar website: http://www.illovosugar.co.za [accessed 18/07/2015].
National Agricultural Marketing Council (NAMC) report (2016). Growing the sugar industry in South
Africa (1-67).
South African Sugar Association (SASA) website: http://www.sasa.org.za [accessed 04/08/2015].
South African Sugar Industry Directory (SASID) (2016/2017).
Tongaat-Hulett website: http://www.huletts.co.za [accessed 23/07/2015].
9 | NATSURV Water, wastewater and energy management in the South African sugar industry
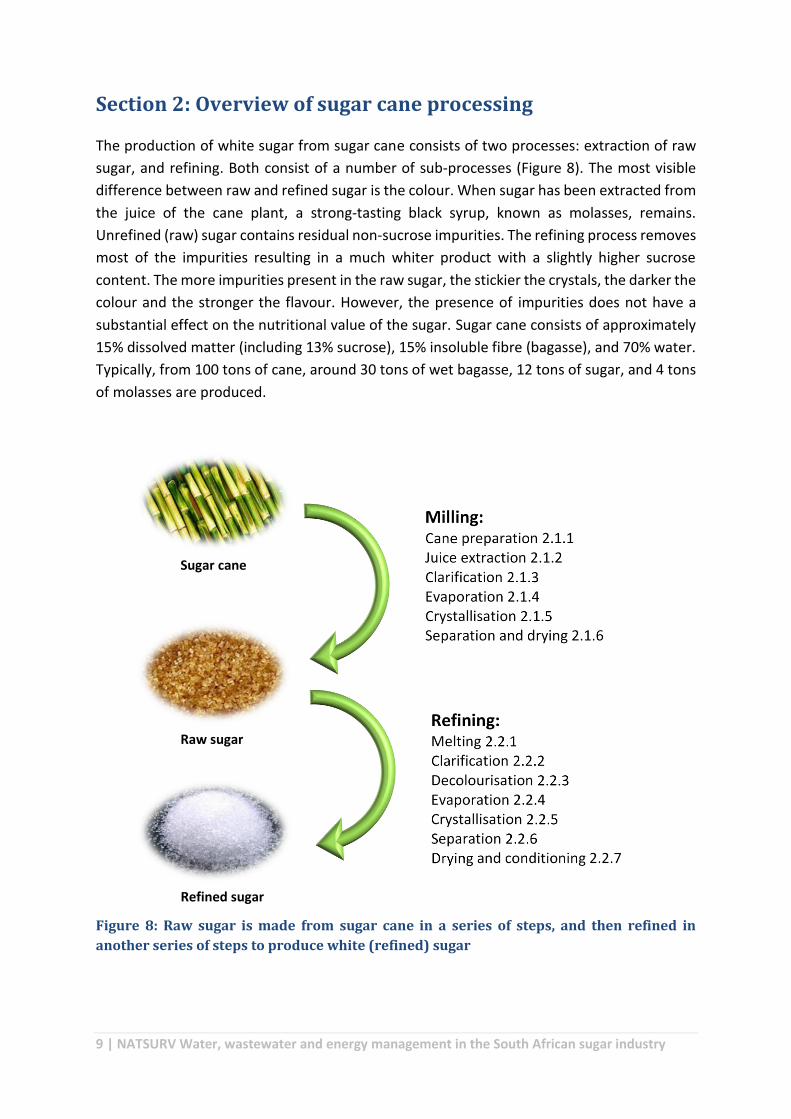
Section 2: Overview of sugar cane processing
The production of white sugar from sugar cane consists of two processes: extraction of raw
sugar, and refining. Both consist of a number of sub-processes (Figure 8). The most visible
difference between raw and refined sugar is the colour. When sugar has been extracted from
the juice of the cane plant, a strong-tasting black syrup, known as molasses, remains.
Unrefined (raw) sugar contains residual non-sucrose impurities. The refining process removes
most of the impurities resulting in a much whiter product with a slightly higher sucrose
content. The more impurities present in the raw sugar, the stickier the crystals, the darker the
colour and the stronger the flavour. However, the presence of impurities does not have a
substantial effect on the nutritional value of the sugar. Sugar cane consists of approximately
15% dissolved matter (including 13% sucrose), 15% insoluble fibre (bagasse), and 70% water.
Typically, from 100 tons of cane, around 30 tons of wet bagasse, 12 tons of sugar, and 4 tons
of molasses are produced.
Figure 8: Raw sugar is made from sugar cane in a series of steps, and then refined in
another series of steps to produce white (refined) sugar
Sugar cane
Raw sugar
Refined sugar

10 | NATSURV Water, wastewater and energy management in the South African sugar industry
This report is not intended to provide an exhaustive account of the production processes
used by the South African sugar industry. A brief description of the generic processes and
principles is given in this section, and Figures 9 and 10 show basic process inputs and
outputs. The water use, wastewater generation and energy aspects of sugar production are
discussed in more detail in Sections 3, 4 and 5, respectively.
2.1 Production of raw sugar from sugar cane A number of steps are required to produce raw sugar from cane (Figure 9). All of these
processes require energy in the form of mechanical energy and/or heat (mainly from steam).
Although water is required in large volumes for juice extraction, minimal (if any) external
water is required for the direct recovery of sugar from the cane because cane contains around
70% water, and process water is recycled. However, additional water is usually required for
start-up, shut-down and various auxiliary activities in the factory. By-products include
wastewater, bagasse, and in some instances, filter mud (Figure 9).
2.1.1 Cane preparation
Cane is mechanically cut and shredded to assist with the extraction of juice from the fibrous
tissue.
2.1.2 Juice extraction
Sugar juice, also known as “mixed” juice, is extracted by either of two processes: milling or
diffusion, the latter being the most common method employed in South Africa. Diffusion
typically has lower capital and operational costs than milling.
Milling is a mechanical process that involves squeezing the prepared cane through a series of
mills containing horizontal rollers (typically six in series). The juice is expelled from the cells,
and the by-product is a lignocellulosic (fibrous) plant material known as bagasse. Imbibition
water is added to the last mill to recover residual sugar which is entrained in the bagasse.
Excess fibre in the juice is removed by mechanical screening before clarification.
The diffusion process relies on liquid extraction of sugar from the prepared cane. During
diffusion, the sugar is washed from the surface of the cells, and also diffuses from the cells
into the less concentrated surrounding liquid.
2.1.3 Clarification
After extraction, the sugar juice still contains some impurities. These are precipitated out of
the solution by the addition of lime (Ca(OH)2). Lime hydrolysis is promoted by heating. The
solids, known as mud, are separated from the clarified sugar juice by sedimentation in
clarifiers. The mud is then either filtered and the filtrate is returned to the process, or the
mud itself is recycled directly to the diffuser. The clarified sugar juice is also known as “clear
juice”.

11 | NATSURV Water, wastewater and energy management in the South African sugar industry
Figure 9: Simplistic schematic flow diagram showing basic steps, intermediate products, and inputs and outputs for a typical sugar mill in South Africa (refining excluded)
2.1.4 Evaporation
The clarified sugar juice contains about 85% water, some of which is removed in a multi-effect
evaporation system which consists of evaporators (effects) in series. The use of multi-effect
evaporators saves significant amounts of water and energy. Steam is only added to the first
effect to provide heat to boil the sugar juice. Thereafter, the vapour produced by evaporation
in each effect is used for heating in the next effect. The pressure in each evaporator in the
series is lower than in the preceding evaporator, so that the juice continues to boil as it is
passed through the series. The concentrated syrup leaves the last effect as a bottom
concentrate known as syrup. Syrup contains approximately 65% sugar and 35% water.

12 | NATSURV Water, wastewater and energy management in the South African sugar industry
2.1.5 Crystallisation
The syrup is further concentrated by boiling in large pans to which magma (small crystals from
lower-grade boiling) or slurry (finely milled sugar) are added as seed (nuclei) for the growth
of larger sucrose crystals. A mixture of crystals and mother liquor, known as massecuite is
formed. The moisture and temperature are closely controlled to achieve the desired
(supersaturated) concentration necessary for optimal crystal formation. The massecuite is
transferred to stirred tanks (crystallisers) where cooling promotes the continuation of crystal
growth.
2.1.6 Separation and drying
The massecuite is centrifuged to separate the viscous black liquor (molasses) from the sugar
crystals. Water and steam may be added to assist with the removal of impurities. Efficient
extraction and separation via centrifugation are needed to produce raw sugar with low ash
and colour content, and a sucrose content of ≥99.3%. This high-value raw sugar is known as
very high polarisation (VHP) sugar. The raw sugar is either directly refined in back-end mills,
or air-dried (e.g. in rotary driers) to reduce the moisture content and prevent spoilage.
After separation, the molasses still contains sugar, so it is boiled again in vacuum pans and
the sugar crystals separated again. This may be repeated a third time. To ensure that the end
product is of high quality, the crystals formed from re-boiling are melted and added to the
syrup to be processed again.
2.2 Sugar refining Refining consists of a number of steps, and results in the production of white sugar, wastes,
and secondary products and by-products. All the processes require energy in the form of
mechanical energy and/or heat (mainly from steam) (Figure 10). Different terminology is used
for the various stages and intermediate products.
If low-grade raw sugar is used, it is first mixed with heavy syrup to soften the outer coating of
residual molasses on the surface of the sugar granules, and the sugar granules are separated
out by centrifugation. This process (affination) is usually not applied in South African
refineries, as the raw sugar is typically very high polarisation (VHP) grade.
2.2.1 Melting
The raw sugar is melted in high-purity, hot, sweet water to produce melt liquor (melt) with a
sugar content ranging between 68 and 72 degrees Brix. The sweet water is typically process
water “contaminated” with sugar. Hot vapour derived from the evaporators provides the
energy for heating.
2.2.2 Clarification (primary decolourisation)
Clarification (also known as primary decolourisation) is achieved by adding lime (Ca(OH)2) and
chemicals and/or gas to the melt liquor under controlled temperature, pressure and pH
conditions. Chemical precipitates are formed that that agglomerate with colour molecules
and other impurities. The impurities in the ensuing mud are removed by separation. Filtration

13 | NATSURV Water, wastewater and energy management in the South African sugar industry
is used for separation, and, in some instances, skimming or settling may also be employed.
Clarification can be achieved by carbonatation (2.2.2.1), sulphitation (2.2.2.2),
phosphatation / phosfloatation (2.2.2.3), or combinations thereof.
Figure 10: Basic schematic flow diagram showing process steps, intermediate products, and inputs/outputs for a typical sugar refinery in South Africa
Energy
Water
Secondary products, by-products, wastes
Key:

14 | NATSURV Water, wastewater and energy management in the South African sugar industry
2.2.2.1 Carbonatation
Carbonatation is a cheap and robust process that achieves about a 30–50% reduction in the
colour of the melt liquor. Ca(OH)2 is added, and carbon dioxide (CO2) is bubbled into the melt
liquor to form a calcium carbonate precipitate (CaCO3↓).
2.2.2.2 Sulphitation
Sulphitation can be used for either primary or secondary purification. The principle is similar
to carbonatation. In this case, sulphur dioxide gas (SO2) is added instead of CO2, resulting in
the formation of a calcium sulphite precipitate (CaSO3↓).
2.2.2.3 Phosphatation/floatation (phosfloatation)
Phosphoric acid (H3PO4) is added with Ca(OH)2 to the melt liquor to form calcium phosphate
(Ca3(PO4)2↓).
In phosfloatation, the clarifying tank is aerated, and impurities become entrained in flocs that
attach to rising air bubbles. A scum forms on the surface, and is removed by a device.
2.2.3 Decolourisation
Decolourisation following clarification is often referred to as “secondary decolourisation”.
The two main methods used in South Africa to remove residual colour and impurities after
primary clarification are sulphitation and ion exchange. The addition of SO2 without lime can
be used after carbonatation to remove residual calcium together with colour molecules and
other impurities. If an ion-exchange decolourisation step is used, then the ion-exchange resins
are regenerated chemically after their functional capacity has been expended. This creates an
effluent stream.
2.2.4 Evaporation
The decolourised liquor (juice) is concentrated in a multi-effect evaporator (see 2.1.4).
2.2.5 Crystallisation
The concentrated liquor (syrup) is crystallised in pans to form massecuite (see 2.1.5).
2.2.6 Separation of sugar crystals and molasses
The massecuite is centrifuged to separate the white sugar crystals from the molasses (see
2.1.6).
2.2.7 Drying and conditioning
After separation, the refined sugar contains around 1% moisture that needs to be reduced to
prevent spoilage and/or caking. The moisture is present in three forms: free, bound, and
inherent. Most of the free moisture on the surface of the crystals is easily removed in rotary
driers. After drying, the residual free moisture, as well as the bound moisture responsible for
caking, is removed by exposure to low humidity air for an extended period (conditioning).
15 | NATSURV Water, wastewater and energy management in the South African sugar industry
2.3 Sugar milling and refining in South Africa Although some upgrades have taken place over the years, most of the infrastructure at the
majority of sugar mills in South Africa is more than 50 years old. Some of the NATSURV
respondents indicated that they had replaced particular infrastructure specifically to save
water, and/or energy. Details of these are given in Sections 4 and 6, respectively.
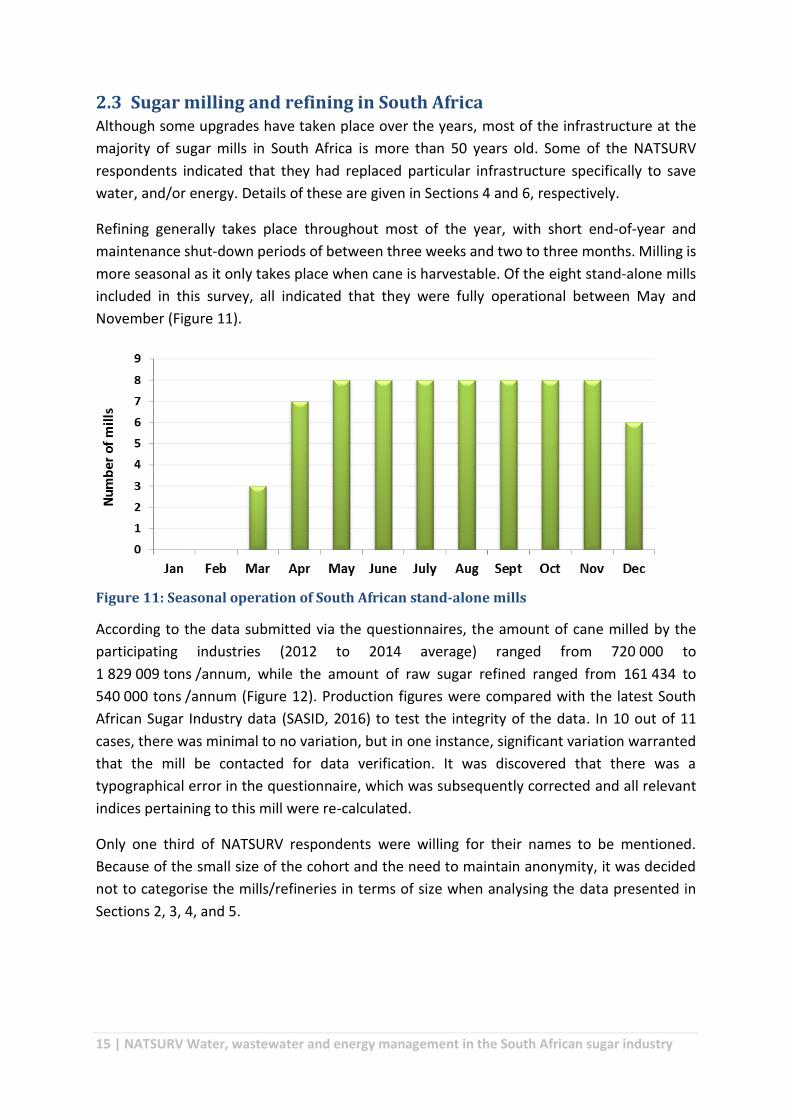
Refining generally takes place throughout most of the year, with short end-of-year and
maintenance shut-down periods of between three weeks and two to three months. Milling is
more seasonal as it only takes place when cane is harvestable. Of the eight stand-alone mills
included in this survey, all indicated that they were fully operational between May and
November (Figure 11).
Figure 11: Seasonal operation of South African stand-alone mills
According to the data submitted via the questionnaires, the amount of cane milled by the
participating industries (2012 to 2014 average) ranged from 720 000 to
1 829 009 tons /annum, while the amount of raw sugar refined ranged from 161 434 to
540 000 tons /annum (Figure 12). Production figures were compared with the latest South
African Sugar Industry data (SASID, 2016) to test the integrity of the data. In 10 out of 11
cases, there was minimal to no variation, but in one instance, significant variation warranted
that the mill be contacted for data verification. It was discovered that there was a
typographical error in the questionnaire, which was subsequently corrected and all relevant
indices pertaining to this mill were re-calculated.
Only one third of NATSURV respondents were willing for their names to be mentioned.
Because of the small size of the cohort and the need to maintain anonymity, it was decided
not to categorise the mills/refineries in terms of size when analysing the data presented in
Sections 2, 3, 4, and 5.

16 | NATSURV Water, wastewater and energy management in the South African sugar industry
Figure 12: The amount of sugar cane milled and raw sugar refined in South African sugar mills and refineries (averages from 2012-2014). BER1 – not given
BER: mills with back-end refineries SAM: stand-alone mills R: refinery
2.4 2.4 Process inputs and outputs: beneficial uses for by-products The sugar industry is well organised to efficiently deal with solid process residues. Transport
of by-products off site for value-added processes or beneficial use is often cost effective
because of the relatively small geographical location of a large industry. Downstream
industries that generate value-added products are therefore located in KwaZulu-Natal.
2.4.1 Bagasse
Sugar milling and refining is energy intensive. Bagasse is an important by-product of cane
sugar extraction (Figure 13). All the mills burn sugar cane bagasse as a major source of energy.
In some instances, excess energy is produced. The industry has the potential to make a
significant contribution to the grid, and there are a number of reports available that outline
how this may be achieved (see Section 6). Emissions from burning bagasse are lower and less
noxious than from conventional fuels such as coal. In addition, sugarcane captures carbon
during growth, making bagasse a carbon-neutral energy source.
South Africa is one of the major global producers of furfural and furfuryl alcohol, and the high-
value speciality chemicals diacetyl and 2,3-pentanedione are also extracted from bagasse.
One NATSURV respondent indicated that bagasse was also sold for animal fodder, while
another also sold bagasse for paper production.
2.4.2 Molasses
Molasses is initially recycled back to upstream processes to maximise product recovery. All
spent molasses in South Africa is utilised further (Figure 13). Fermentation of molasses to
alcohol can be a lucrative downstream process; seven of the twelve respondents send
molasses to one of two facilities that produce large volumes of various grades of ethanol
(including pharmaceutical grade) via fermentation. Molasses is typically sold as animal feed if
the facility is located far from the distilleries and/or is low grade.
0200400600800
100012001400160018002000
Tho
usa
nd
to
ns
cane milled
0
100
200
300
400
500
600
sugar refined
17 | NATSURV Water, wastewater and energy management in the South African sugar industry
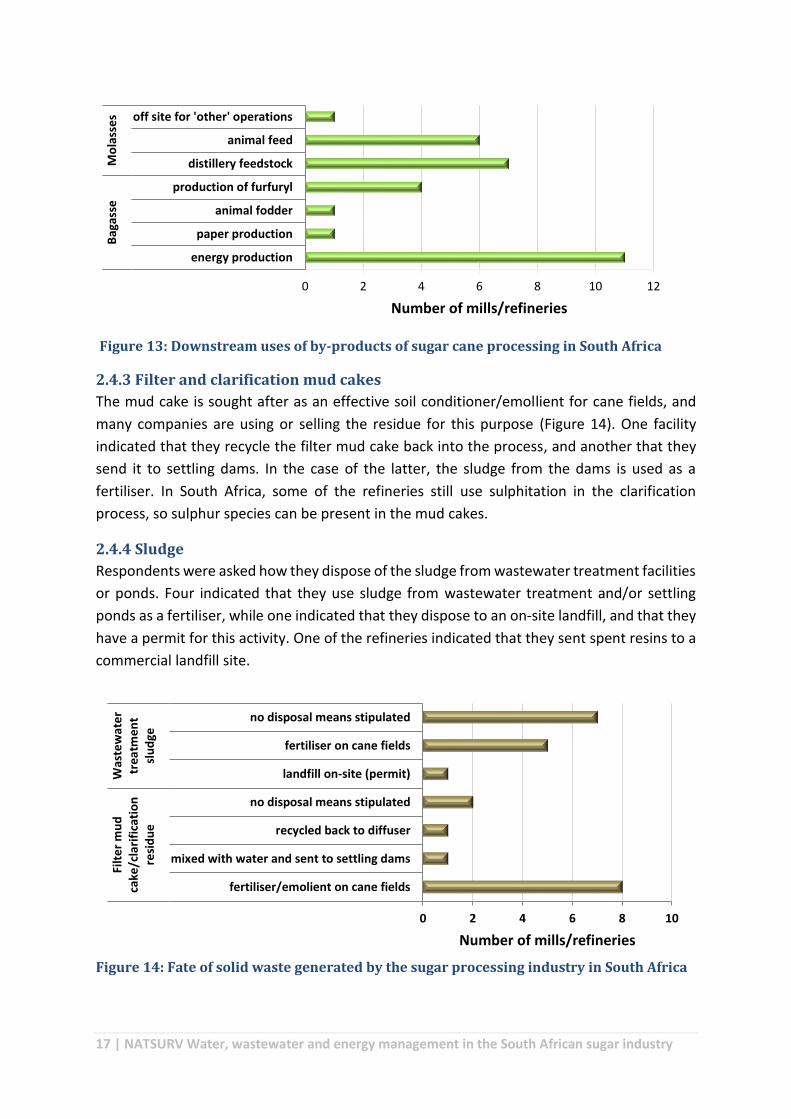
Figure 13: Downstream uses of by-products of sugar cane processing in South Africa
2.4.3 Filter and clarification mud cakes
The mud cake is sought after as an effective soil conditioner/emollient for cane fields, and
many companies are using or selling the residue for this purpose (Figure 14). One facility
indicated that they recycle the filter mud cake back into the process, and another that they
send it to settling dams. In the case of the latter, the sludge from the dams is used as a
fertiliser. In South Africa, some of the refineries still use sulphitation in the clarification
process, so sulphur species can be present in the mud cakes.
2.4.4 Sludge
Respondents were asked how they dispose of the sludge from wastewater treatment facilities
or ponds. Four indicated that they use sludge from wastewater treatment and/or settling
ponds as a fertiliser, while one indicated that they dispose to an on-site landfill, and that they
have a permit for this activity. One of the refineries indicated that they sent spent resins to a
commercial landfill site.
Figure 14: Fate of solid waste generated by the sugar processing industry in South Africa
0 2 4 6 8 10 12
energy production
paper production
animal fodder
production of furfuryl
distillery feedstock
animal feed
off site for 'other' operationsB
agas
seM
ola
sse
s
Number of mills/refineries
0 2 4 6 8 10
fertiliser/emolient on cane fields
mixed with water and sent to settling dams
recycled back to diffuser
no disposal means stipulated
landfill on-site (permit)
fertiliser on cane fields
no disposal means stipulated
Filt
er
mu
dca
ke/c
lari
fica
tio
nre
sid
ue
Was
tew
ate
rtr
eatm
en
tsl
ud
ge
Number of mills/refineries
18 | NATSURV Water, wastewater and energy management in the South African sugar industry
Section 2 References:
Antonio, V.D. and Carlos, A.C. (2001). Sugar processing and by-products of the sugar industry. Food
and Agricultural Organisation (FAO): Rome.
Baikow, V.E. (2013). Manufacture and refining of Raw Cane Sugar. Elsevier: New York.
Chou, C.C. (2000). Handbook of Sugar Refining: A Manual for Design and Operation of Sugar Refining
Facilities. 1st ed. John Wiley & Sons: Canada.
James, C. P., Chou, C.C. (1993). Cane Sugar Handbook: A Manual for Cane Sugar Manufacturers and
their Chemists. 12th ed. John Wiley & Sons: Canada.
National Agricultural Marketing Council (NAMC) of South Africa (2011). Growing the Sugar Industry
in South Africa.
Rein, P.W. (1995). A comparison of cane diffusion and milling. Proceedings of the South African
Sugar Technologists' Association. Tongaat-Hulett Sugar Limited: La Luci.
Tongaat-Hulett website: http://www.huletts.co.za/car/sm_process.asp [accessed 08/12/2016].
South African Sugar Act (Act no 9 of 1978). Government Gazette number 6419.
Illovo (2015). Climate Change and Environmental Impact Report of 2015. Conflict, Political
Geography, 26: 627–638.
Meadows, D.M. (1993). Somewhat dry…a new look at the conditioning of refined sugar. Proceedings
of the South African Sugar Technologists’ Association. Tongaa-Hulett Sugar Ltd: Glenashley.
National Agricultural Marketing Council (NAMC) of South Africa (2013). Growing the Sugar Industry
in South Africa: Lessons, Justifications and Challenges. Strategic Imperatives for Decision Making.
South African Cane Growers Association report (2014). Cane Growers: Annual Report of the Board of
Directors.
South African Sugar Industry Directory (SASID) (2016/2017).

19 | NATSURV Water, wastewater and energy management in the South African sugar industry
Section 3: Environmental and water use regulations and policies applicable to the cane sugar processing industry
3.1 Introduction
3.1.1 National policies
The Constitution of the Republic of South Africa (Act 108 of 1996) stipulates that everyone
has the right to an environment that is not harmful to his or her health or well-being. This
includes the right to environmental protection for the benefit of present and future
generations through reasonable legislative and other measures to prevent pollution and
ecological degradation, promote conservation, and secure ecologically sustainable
development and use of natural resources. These rights must be balanced with the promotion
of justifiable economic and social development. Regulations that address these rights fall
under the responsibility of the Department of Environmental Affairs. The Bill of Rights, which
forms part of the constitution, enshrines the concept of sustainability. Rights regarding the
environment, water, access to information, and just administrative action are specified in the
act. These rights and other requirements are further legislated through the National Water
Act (NWA; Act 36 of 1998). The NWA provides the legal basis for water management in South
Africa. It ensures ecological integrity, economic growth, and social equity when managing
water use. Other policies relevant to the sugar processing sector are the National
Environmental Management Act (Act 107 of 1998), the National Environmental Management:
Waste Act (Act 59 of 2008), and the National Environmental Management: Air Quality Act (Act
39 of 2004) (Figure 15). Broadly speaking, these acts outline the requirements for the storage
and handling of waste on-site, licensing requirements, the establishment of waste
management plans, the setting of limits for air emissions, and the setting of penalties for
offences.
Figure 15: National environmental and water policies relevant to the sugar industry

20 | NATSURV Water, wastewater and energy management in the South African sugar industry
The NWA introduced the concept of integrated water resource management, which provides
for resource- and source-directed measures to manage the aquatic environment. Resource-
directed measures aim to protect and manage the environment that receives water, while
source-directed measures aim to control the impact on the receiving environment by
preventing pollution, reusing water, and treating wastewater. The integration of resource-
and source-directed measures forms the basis of the hierarchy of decision making aimed at
mitigating the effect of waste generation. This hierarchy is based on a precautionary approach
and the order of priority for water and waste management decisions and/or actions is shown
in Figure 16.
Figure 16: Hierarchy of decision making intended to protect the environment
3.2 Water and wastewater policies
The South African sugar processing industry uses municipal water, and/or water abstracted
from rivers or boreholes (Section 4). Final effluent from the sector is evaporated, discharged
to rivers or municipal reticulation systems, or disposed of via irrigation (Section 5).
All water bodies in the hydrological cycle, including underground water, are regarded as water
resources, and are defined in the NWA as “a river or a spring; a natural channel in which water
flows regularly or intermittently; a wetland, lake or dam into which, or from which, water
flows; any collection of water which the Minister may declare to be a watercourse; and
surface water, estuaries and aquifers (underground water)”.
The recently formed Department of Water and Sanitation [DWS, 2014 – formerly the
Department of Water Affairs (DWA) and, before that, the Department of Water Affairs and
Forestry (DWAF)] is the water and sanitation sector leader in South Africa. DWS is the
custodian of the country’s water resources and of the NWA and the Water Services Act, Act
No.108 of 1997 (RSA, 1997). DWS is also the national regulator of the water services sector.
In the various acts and ancillary legislation, the term “water use” refers to water abstraction,
storage, disposal, and related activities (Figure 17). There are different schedules of water
use. Schedule 1 water use includes small-scale abstraction for “reasonable” domestic use,

21 | NATSURV Water, wastewater and energy management in the South African sugar industry
non-commercial farming, grazing (not feed-lots), emergency use (e.g. for fighting fires), and
drinking water, as well as discharge to third party infrastructure or environments (e.g.
municipal reticulation systems, marine outfalls) where the third party (e.g. a municipality)
holds the authority for discharge. Schedule 1 uses are permissible in terms of the NWA and
are not subject to further legislation, barring compliance for discharge with third party
requirements where applicable. There are no set limits for schedule 1 abstraction or
discharge. The sugar processing industry is not a schedule 1 user.
For other schedules of use, the legislation differs according to when the water use activity
first took place, and is classified as either existing or new. “Existing lawful use” mainly applies
when first use was before October 1999. Existing lawful users may be required to register
their water use activities. Due to the age of the South African sugar processing facilities, many
fall into the existing water use category.
New lawful use legislation applies to instances where first use took place after October 1999.
Two scenarios are applicable: (i) Water use is permitted without a licence provided certain
stipulations are met. These stipulations can be found in documents supplementary to the
NWA, known as the General Authorisations (RSA, 1999). Users still need to register their
water use activities. (ii) A licence must be obtained from the DWS if the new lawful water use
does not comply with the stipulations set out in the General Authorisations.
Figure 17: In terms of South African legislation, the term “water use” refers to water abstraction, storage, disposal, and related activities
At a municipal level, the WSA sets out the regulatory framework for institutions tasked with
the supply of water services. The act makes provision for different water service institutions
to be established as follows:
• The water services authority – i.e. the responsible municipality
• The water services provider – the entity whose role is to physically provide the water
supply and sanitation services to consumers
Municipal units are governed by municipal policies and by-laws for the provision of water and
sanitation services, water services development, and sewage disposal. The latter includes the
discharge of domestic, commercial and industrial effluent. Tariffs are set for these services at
a municipal level, and are generally revised on an annual basis.
22 | NATSURV Water, wastewater and energy management in the South African sugar industry
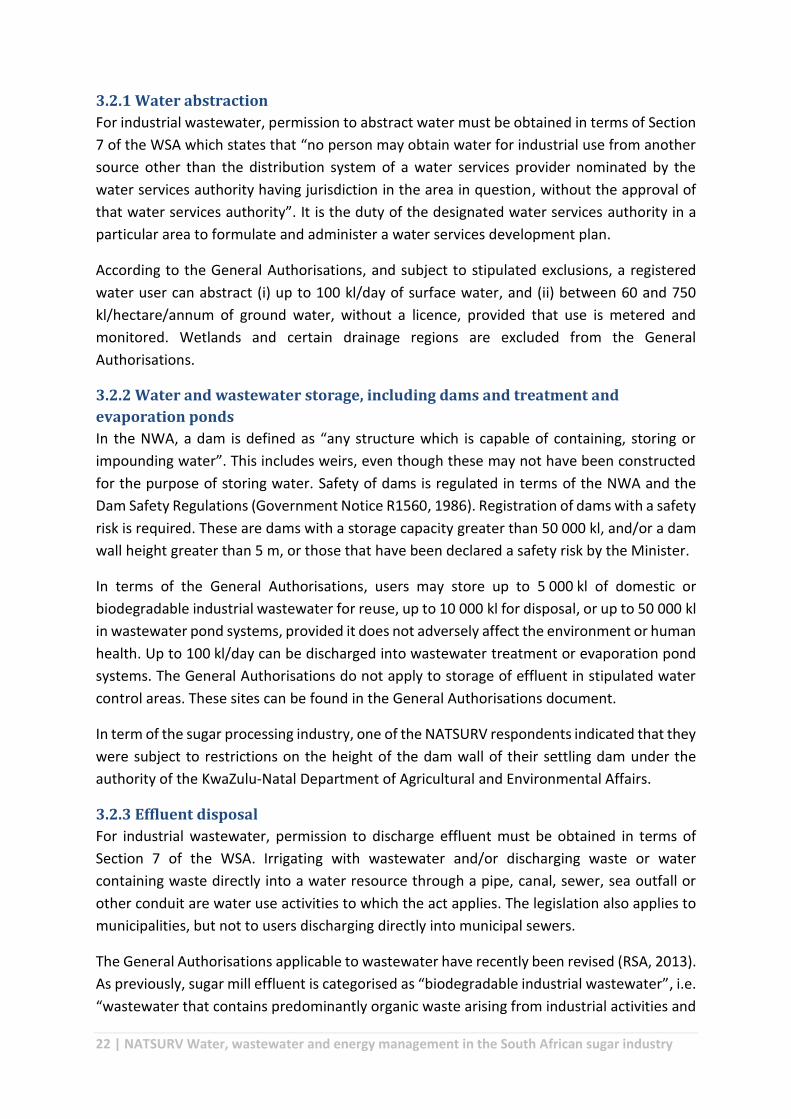
3.2.1 Water abstraction
For industrial wastewater, permission to abstract water must be obtained in terms of Section
7 of the WSA which states that “no person may obtain water for industrial use from another
source other than the distribution system of a water services provider nominated by the
water services authority having jurisdiction in the area in question, without the approval of
that water services authority”. It is the duty of the designated water services authority in a
particular area to formulate and administer a water services development plan.
According to the General Authorisations, and subject to stipulated exclusions, a registered
water user can abstract (i) up to 100 kl/day of surface water, and (ii) between 60 and 750
kl/hectare/annum of ground water, without a licence, provided that use is metered and
monitored. Wetlands and certain drainage regions are excluded from the General
Authorisations.
3.2.2 Water and wastewater storage, including dams and treatment and
evaporation ponds
In the NWA, a dam is defined as “any structure which is capable of containing, storing or
impounding water”. This includes weirs, even though these may not have been constructed
for the purpose of storing water. Safety of dams is regulated in terms of the NWA and the
Dam Safety Regulations (Government Notice R1560, 1986). Registration of dams with a safety
risk is required. These are dams with a storage capacity greater than 50 000 kl, and/or a dam
wall height greater than 5 m, or those that have been declared a safety risk by the Minister.
In terms of the General Authorisations, users may store up to 5 000 kl of domestic or
biodegradable industrial wastewater for reuse, up to 10 000 kl for disposal, or up to 50 000 kl
in wastewater pond systems, provided it does not adversely affect the environment or human
health. Up to 100 kl/day can be discharged into wastewater treatment or evaporation pond
systems. The General Authorisations do not apply to storage of effluent in stipulated water
control areas. These sites can be found in the General Authorisations document.
In term of the sugar processing industry, one of the NATSURV respondents indicated that they
were subject to restrictions on the height of the dam wall of their settling dam under the
authority of the KwaZulu-Natal Department of Agricultural and Environmental Affairs.
3.2.3 Effluent disposal
For industrial wastewater, permission to discharge effluent must be obtained in terms of
Section 7 of the WSA. Irrigating with wastewater and/or discharging waste or water
containing waste directly into a water resource through a pipe, canal, sewer, sea outfall or
other conduit are water use activities to which the act applies. The legislation also applies to
municipalities, but not to users discharging directly into municipal sewers.
The General Authorisations applicable to wastewater have recently been revised (RSA, 2013).
As previously, sugar mill effluent is categorised as “biodegradable industrial wastewater”, i.e.
“wastewater that contains predominantly organic waste arising from industrial activities and

23 | NATSURV Water, wastewater and energy management in the South African sugar industry
premises”. In order to discharge sugar industry wastewater to the environment, or use it for
irrigation purposes, industries need to register with the applicable water services authority.
Existing water users may be subject to different requirements to new water users.
3.2.3.1 Irrigation with biodegradable industrial wastewater
The General Authorisations
The General Authorisations stipulate limits for certain physicochemical parameters in
biodegradable industrial effluent (Table 1). In addition, it is stipulated that: (i) irrigation is only
permitted above the 100-year flood line, or further than 100 m from the edge of a water
resource or a borehole that is utilised for drinking water or stock watering – whichever is
further, (ii) irrigation is not permitted on land that overlies a major aquifer, (iii) the
wastewater quality and quantity needs to be metered, measured and monitored, and the
results recorded, (iv) precautionary practices need to be undertaken to ensure the consistent,
effective and safe performance of the irrigation systems, and (v) the user needs to register
the use with the water services authority.
Table 1: General Authorisations: Stipulated physicochemical limits for irrigation with biodegradable industrial wastewater
Volume (kl/day) ≥500 but ≤2000 ≥50 but ≤500 ≤50
pH 5.5 to 9.5 6 to 9 6 to 9 Chemical oxygen demand (mg/L) ≤75 ≤400 ≤5000 Electrical conductivity (mS/m) 70 to 150 ≤200 ≤200 Sodium adsorption ratio - ≤5 ≤5 Faecal coliforms (per 100 ml) ≤1000 ≤1000 ≤1000 Ammonia as N (mg/L) ≤3 - - Nitrates/nitrites as N (mg/L) ≤15 - - Free chlorine (mg/L) ≤0.25 - - Suspended solids (mg/L) ≤25 - - Ortho-phosphate (mg/L) ≤10 - - Fluoride (mg/L) ≤1 - - Soap, oil or grease (mg/L) ≤2.5
3.2.3.2 Discharge of wastewater into a water resource through a pipe, canal, sewer,
or other conduit
The General authorisations
The General Authorisations do not apply to discharge of wastewater to marine outfalls,
groundwater resources (including aquifers), or water resources with closed drainage systems.
As with the General Authorisations for irrigation, the quality and quantity of the wastewater
must be measured, metered, monitored, and recorded, relevant precautionary practices to
safeguard human and environmental health need to be adopted, and users must register their
water use. Different discharge parameters, called special limits, apply to sensitive river
systems and catchments.

24 | NATSURV Water, wastewater and energy management in the South African sugar industry
The general limits for discharges are given in Table 2. Apart from these parameters, limits are
also stipulated for toxic metals. However, these are not generally relevant to the sugar
industry. In addition to the general limits, industries also need to monitor substances that
may have been added or concentrated by industrial processes, and substances that may be
harmful to humans or the environment. All analyses need to be conducted on grab samples
taken from the point of discharge and processed in laboratories accredited by the South
African National Accreditation System (SANAS).
For discharge volumes of 10 to 100 kl/day, the minimum parameters that must be determined
are the pH, electrical conductivity, and faecal coliforms. For discharge volumes of 100 to
1 000 kl/day, the chemical oxygen demand (COD), ammonia, and suspended solids
concentrations must also be determined. Determination of nitrate/nitrite, free chlorine and
ortho-phosphate is added to the list for discharge volumes of 1 000 to 2 000 kl/day.
Table 2: General Authorisations: Stipulated physicochemical limits for discharge of wastewater into a water resource through a pipe, canal, sewer or other conduit
General limits Special limits
Discharge volume (kl/day) ≤2000 ≤2000 pH 5.5 to 9.5 5.5 to 7.5 Chemical oxygen demand (mg/L) ≤75 ≤30 Faecal coliforms (per 100 ml) ≤1000 0 Ammonia as N (mg/L) ≤6 ≤2 Nitrates/nitrites as N (mg/L) ≤15 ≤1.5 Free chlorine (mg/L) ≤0.25 0 Suspended solids (mg/L) ≤25 10 Ortho-phosphate (mg/L) ≤10 1 (median), 2.5 (maximum) Fluoride (mg/L) ≤1 ≤1 Soap, oil or grease (mg/L) ≤2.5 0 Electrical conductivity (mS/m) 70 above intake to a
maximum of 150 50 above background receiving water,
to a maximum of 100
Discharge to municipal wastewater treatment works
Any industry wishing to discharge to a wastewater treatment works must apply to the
relevant municipality for a trade effluent permit. Trade effluent may not be accepted if it
contains concentrations of substances above stated limits, which vary from municipality to
municipality. In terms of by-laws, municipalities are entitled to take random or scheduled
samples of effluent to ensure compliance with regulations and permits. Separate limits may
apply for wastewater treatment facilities with different capacities, or for discharge to sea
outfalls for coastal municipalities. Depending on local by-laws, requirements for obtaining
permits may include stipulations about discharge days and/or times, and requirements for
up-front assessments to identify possible means of reducing water consumption and
wastewater generation at source. The effluent discharge costs may include punitive fines for
non-compliance to stipulated limits. However, many municipalities strive to rather work with

25 | NATSURV Water, wastewater and energy management in the South African sugar industry
industry to attain acceptable water usage and wastewater discharge quality, than to apply
punitive measures.
Due to its location in the heart of the sugar industry, the eThekwini municipality has been
chosen as an example. This metropolitan municipality requires that the volume of trade
effluent must be determined - either by an effluent meter, or, if no meter is in place, from a
water balance questionnaire which is filled in by the company. In this case, the effluent
volume is calculated by deducting the volume of domestic effluent, process water, and
evaporative losses from the incoming water volume.
Industrial, commercial and institutional customers are charged for the acceptance of sewage
into the municipal sewerage system by means of a volume-based sewage disposal charge,
which replaced sewerage rates from 1 July 2010.
In addition, industries permitted to discharge trade effluent with a pollution load exceeding
that of typical domestic sewage, are charged for disposal according to Equation 1. Data on
basic unit costs for water and effluent and the values for V and Z used in Equation 1 are
provided in Table 3.
Table 3: Basic unit costs for industrial effluent discharge at eThekwini municipality
Period Unit cost (R/kl)
COD charge (V) (R/kl)
SS Charge (Z) (R/kl)
2011-2012 5.34 0.57 0.52
2012-2013 5.68 0.60 0.56
2013-2014 6.07 0.65 0.59
2014-2015 6.54 0.71 0.64 0.69 2015-2016 7.06 0.76
2016-2017* 7.62 0.82 0.74
*predicted values
3.2.3.3 Water service authorities and wastewater discharge compliance by the South African sugar processing industry The mills, and mills with back-end refineries, are generally located in agricultural areas. In
most instances (75% of NATSURV respondents), the DWS is the water service authority and
the applicable discharge limit is either COD (limit of 75 mg/L), or a volumetric maximum which
Equation 1: Volume based charge + V (𝐂𝐎𝐃
𝟑𝟔𝟎 − 𝟏) + 𝐙 (
𝐒𝐒
𝟗 − 𝟏)
Where: COD = chemical oxygen demand in mg/L, SS = settleable solids in L/L, V = rate for the treatment of domestic effluent (COD <360 mg/L), Z = rate for the treatment of domestic effluent (SS <9 ml/L)
j

26 | NATSURV Water, wastewater and energy management in the South African sugar industry
varies from site to site (Table 4). Two NATSURV respondents indicated that they were
required to comply with municipal legislation, and one with legislation of the Integrated
Coastal Management Agency.
Table 4: Legislative compliance by the South African sugar processing industry
Statutory body Parameters Compliant Comments
DWS COD (75 mg/L) yes Not discharged to river if non-compliant
DWS (n = 2) COD (75 mg/L) yes DWS COD (75 mg/L) mostly DWS COD (75 mg/L) no Upgraded plant capacity, presently
upgrading wastewater treatment capacity to cope with load
DWS COD (75 mg/L) NG DWS (n = 3) Volumetric max. yes Local municipality NG NG Metropolitan municipality NG yes Integrated Coastal Management Agency
pH >2 yes SOG 220 mg/L Furfuryl 200 mg/L Formate 6 100 mg/L Acetate 16 000 mg/L O2 absorption 1 000 mg/L COD 20 000 mg/L TDS 900 mg/L TSS 200 mg/L
Effluent discharged via marine outfall
DWS = Department of Water and Sanitation COD = chemical oxygen demand TDS = total dissolved solids TSS = total suspended solids SOG = soap, oil and grease NG = not given
Section 3 References:
Ethekwini metropolitan municipality by-laws and tariffs: www.durban.gov.za [accessed
August 2015]
Department of Water Affairs (2011) South African Department of Water Affairs: National
Water Resource Strategy - Annexure D. South Africa.
Water Services Act (Act No. 108 of 1997) Department of Water Affairs and Forestry.
National Water Act (Act No. 36 of 1998) Department of Water Affairs and Forestry.
General Authorisations in terms of section 39 of the National Water Act (Act no 1191 of 1999).
Department of Water Affairs and Forestry.
Revision of General Authorisations in terms of section 39 of the National Water Act (Act no
169 of 2013). Department of Water Affairs.

27 | NATSURV Water, wastewater and energy management in the South African sugar industry
Section 4: Water Use and management
4.1 Introduction
The South African Sugar Association is currently in the process of formulating an integrated
water resource strategy for the industry in line with the national counterpart. In terms of
water saving, much of the effort of the industry at large is directed at reducing the volume of
irrigation water for cane crops. In comparison to irrigation water, factory process and cooling
water only constitute a small fraction of overall water usage. In addition, cane itself consists
of 70% water which is typically extracted during the milling process and recycled into the
process. In fact, if sugar mills employ best practice scenarios, they can theoretically function
as net water producers.
Nevertheless, factory water use is still significant, and without concerted recycling and reuse,
vast quantities of water can be wasted in sugar milling and refining. For example, in Mauritius
in 1991, it was found that the sugar industry abstracted 45 x 106 kl of process water per
annum, an amount equal to the domestic consumption on the island.
Most of the cane sugar mills and/or refineries in South Africa have ageing infrastructure that
was installed before water saving became a priority. In some cases, upgrades have taken
place. In instances where the process water is costly (e.g. potable water), there is an economic
incentive to save water. Water scarcity is another driver for saving water. This was brought
to the fore during the drought of 2014/2015.
Two of the South African respondents indicated in the questionnaire that they have effected
major upgrades over the past 10 years specifically to save water: At one mill, approximately
half of the water requirements are met through the use of potable municipal water at the
current (2016) cost of R13.20/kl. The high cost of water served as an economic driver for the
facility to install a new plate and frame heat exchanger, filters, a pump, valves, pipes, and a
cooled condensate holding tank so that process condensate could be used instead of potable
water for flocculent preparation.
At a second mill, fill and drift eliminators have been installed on the cooling towers to reduce
water losses. These measures have resulted in these two mills having the lowest specific
water intakes (SWI) of 0.04 and 0.15 kl/ton cane, respectively (Section 4.3).
4.2 Sources of water for sugar processing The major source of water used by the South African sugar industry is a combination of river
water and potable water; borehole and raw municipal water are also used (Figure 18). Two
NATSURV respondents indicated that potable water was obtained by in-house treatment of
river water to potable standard.
The cost of municipal water for three respondents that bought water from a water service
provider in 2016 was R10.20/kl (raw), R13.20/kl and R18.56/kl (potable).

28 | NATSURV Water, wastewater and energy management in the South African sugar industry
Figure 18: Sources of water used by the South African sugar industry
4.3 Specific water intake – local and global Sugar cane contains around 70% water that can theoretically contribute around 0.7 kl/ton to
the process water. Specific water intake (SWI) is the basic measurement used to assess overall
water consumption by industry. For the sugar industry, this parameter is used globally, and is
defined as the volume of external water (i.e. excluding water from cane) used to process each
metric ton of cane. Stand-alone refineries are completely reliant on external water supplies,
and in mills with back-end refineries, the number and scale of activities utilising water are
greater than those of stand-alone mills. It is therefore expected that the SWI from these
facilities will be higher than stand-alone mills with similar cane intake and extraction
processes.
All the sugar processing facilities in South Africa monitor their water intake with meters, so
reliable water usage data was available for analysis. In the 1990 NATSURV, an average SWI
value was calculated, with the exclusion of two high outliers. The number of study participants
was not reported, and the SWI was not split into that from stand-alone mills and refineries
and combined mills/refineries. Table 5 gives the SWI values calculated for the latest NATSURV
respondents. For statistical validity, no direct comparisons are made with the averages
reported in the 1990 document.
The SWI was the lowest at one of the mills that does not have access to river water, where
potable water constitutes almost half of the external water supply (SAM2: 0.04 kl/ton cane).
The SWI was highest at one of the mills with a back-end refinery (BER3). Although the total
SWI at this facility was significantly reduced from the value reported in the 1990 NATSURV
(20 to 9.75 kl/ton cane), it was still significantly higher than at the other two mills with back-
end refineries (0.7 and 0.343 kl/ton cane). The large SWI at BER3 is attributable to large
volumes of river water that are used for cooling on a “once-through” basis, i.e. the majority
of this minimally contaminated water is returned directly to the river.
6
1
4
1 1potable + river
potable + borehole
river only
borehole only
raw municipal only

29 | NATSURV Water, wastewater and energy management in the South African sugar industry
Table 5: Specific water intake in the South African sugar processing industry
potable river other total
SWI: kl/ton cane (mill, combined) and kl/ton raw sugar (refinery)
R refinery 0.13 1.67 - 1.8
BER1 combined - - 0.343** 0.343 BER2 combined - 0.7 - 0.7 BER3* mill 1.0 5.3 - 6.3 refinery 0.45 3.0 - 3.45 combined - - - 9.75*
SAM1 mill - 0.15 - 0.15 SAM2 mill 0.019 - 0.021** 0.04 SAM3 mill - - 0.55*** 0.55 SAM4 mill 0.065 0.410 - 0.475 SAM5 mill - 0.384 - 0.384 SAM6 mill 0.081 0.436 - 0.517 SAM7 mill - 0.480 - 0.48 SAM8 mill 0.41 0.720 - 1.13
R = refinery BER = mill with back-end refinery SAM = stand-alone mill
*Cooling tower water not recycled **borehole ***raw municipal
Global literature values for SWI range from 0.09 to 14.85 kl/ton cane (Table 6). The high-end
values are from Mauritius, a region with higher water availability than South Africa
(Ramjeawon, 2000).
Table 6: Available global values for specific water intake
Type of facility No. Specific water intake Reference
Range (kl/ton cane)
Unknown Unknown
Unknown 1
0.50 to 0.90 0.09 to 0.91
IFC, 2007 Gunjal & Gunjal, 2013
Unknown Unknown
Unknown 8
0.20 to 0.40 1.8 to 14.85
Deshmukh et al., 2014 Ramjeawon, 2000
4.4 Water recycling and reuse The sugar processing industry at large recycles and reuses water. Although the infrastructure
at most South African mills and refineries is old, most recycle cooling water and condensate.
The use of external water and recycled water depends on the specific environmental,
geographic and equipment constraints of each mill. Water recycling constitutes the major
means of water “saving” by the industry. When implementing water recycling in the sugar
industry, the quality and quantity of the water emanating from each process needs to be
critically evaluated to ensure that it is “fit for purpose”. For example, Ingaramo and his
colleagues (2009) divided water use into six cycles (Figure 19).

30 | NATSURV Water, wastewater and energy management in the South African sugar industry
Figure 19: Six water cycles in sugar cane plants that can be used to determine pathways of
recycle and reuse of water. Adapted from Ingaramo et al. (2009).
Cycle 1: The vapour-condensate system: Water vapour from evaporation systems and
crystallisation pans is condensed and can be used for different processes, e.g. imbibition,
sugar washing and melting.
Cycle 2: The scrubber and chimney water system: Purged water from the boilers (cycle 3)
and/or condensate from cycles 1 and 6 can form make-up water for this system, while
wastewater from the scrubbers and chimneys themselves can be treated to remove ash and
be reused as wash water in the same cycle.
2
loss
purge
condensate
loss
Purge loss
condensate6
Process
1
5 4 3
cane sugar
purge
Make-up
Make-up
Make-up
Make-up
Make-up
Cooling system
Condenser
Fresh water
Cooling tower
Water supply
Separation system
BoilerProcess water
Water vapour
Steam
KEY

31 | NATSURV Water, wastewater and energy management in the South African sugar industry
Cycle 3: The boiler water system: The condensate from the boilers can be reused in the
boilers themselves. Blow-down and other losses can be made up with fresh water or,
preferably, with condensate from other cycles.
Cycle 4: The turbine and machinery refrigeration system: Provided the refrigeration water is
de-oiled, it can be recycled using a cooling system with only negligible losses.
Cycle 5: The crystallisation and filter system: The water can be recycled within the system,
with minimal evaporative losses.
Cycle 6: The condenser water system: Barometric condensers require large volumes of water.
Recycling of this water can result in large water savings. However, solids need to be removed
by continual purging, and make-up water needs to be added to make up the deficit.
Water recycling can reduce the need for external water considerably. For example, in a sugar
factory in Mauritius, the SWI was reduced by 90% from 0.91 kl/ton cane to 0.09 kl/ton cane
by instituting water recycling. It was shown that external water requirements for condensers
could be almost halved by partial recirculation (Figure 20).
Further information about water reuse and recycling can be found in Section 7 of this
document (Best practice guidelines for water and wastewater management).
0.220.1
0.36 0.14
0.15
10.03
0
6.88
Imbibition water
Turbo-alternator CW
Milling tandem CW
Crystalliser CW
Boiler make-up
Scrubber feed
Scrubber make-up
Condenser feed
Condenser make-up
0.30.1 0.41
0.150.11
1.3 0.14
1.06
11.28
BA
Figure 20: Example breakdown of raw water inputs (in kl/ton milled cane) for two Mauritian sugar factories with high specific water intake: (A) with partial recirculation of condenser cooling water and scrubber water, and (B) partial recirculation of scrubber water only CW = cooling water Adapted from Ramjeawon (2000)

32 | NATSURV Water, wastewater and energy management in the South African sugar industry
4.5 Simple water-saving measures Although recycling (reuse) is volumetrically the largest contributor to water saving, other
simple measures are also recommended. For example:
➢ Simple equipment upgrades: It is relatively affordable to upgrade water sprayers (e.g.
nozzles that use less water, self-closing nozzles), high-pressure low-volume washing
systems, and auto shut-off valves. It has been shown that the use of these can save
significant volumes of water.
➢ Dry clean-up techniques: Unless products are being recovered, equipment and spills
should be wiped up before washing or rinsing with water (e.g. floors, vessels).
➢ Water use targets: It has been shown that if targets are in place, water saving is more
successful.
➢ Wet clean-up operations: Unless the water is recycled, wet clean-ups operations
waste water. In many instances, mechanical cleaning or dry cleaning techniques are
equally effective. Dry mopping of spills should precede wet operations, unless product
and water is being simultaneously recovered.
➢ Monitoring water use: It has been shown that when water use is metered, water use
is reduced because areas of wastage are highlighted.
Some YES/NO questions about adoption of these simple measures were posed in the
NATSURV questionnaires (Appendix 1). From the answers, it is clear that the industry as a
whole is aware of the need to reduce water usage, and 11/12 of the NATSURV respondents
indicated that they have water usage targets in place. In some instances, targets have been
exceeded by implementing water-saving measures (Table 7).
Most sugar cane processors recycle spillages back into processes, either directly, by hosing
down, or by employing both of these methods (Table 7). Apart from saving water, this allows
recovery of product. As this water is recycled back to the process, none of the respondents
mop up spills prior to hosing down.
Only 5/12 and 1/12 NATSURV respondents indicated that they use high-pressure nozzles and
self-closing nozzles, respectively, on hoses, despite the fact that the installation of these is an
inexpensive and effective way to reduce water usage. This is an area for improvement.
Table 7: Response of 12 South African cane sugar processors to selected “best practice”
questions for efficient water use
Question Response Individual response details yes no none
Spill
ages
Hose down and recycle to process?
6 5 1 Use process condensate for hosing (1)
Recycle directly to process? 8 3 1
Mop up before hosing? 0 11 1

33 | NATSURV Water, wastewater and energy management in the South African sugar industry
Equ
ipm
ent
Cleaning-in-place equipment installed?
4 7 1 On reverse osmosis and nano-filtration plant (1) Caustic CIP plant on evaporators (1) Caustic CIP plant on juicers (1) High-pressure water CIP (1)
High-pressure nozzles on hoses?
5 3 4
Self-closing nozzles on hoses?
1 5 6
Wat
er
use
tar
gets
In place? 11 1 0 To optimise condenser efficiencies Potable water intake (1) Part of environmental management plan (EMP) (1)
Being met? Comments? *Refer to last column
3 * 2 “Mostly” met (2) 90% met (1) 60% met (1) Yes: 2014 exceeded objective to reduce potable water intake from 2.72% to 2.00% on cane. New milestone 1% (1) EMP and targets reviewed periodically (1) Readings monitored and discussed on a daily basis (2)

34 | NATSURV Water, wastewater and energy management in the South African sugar industry
Section 4 References:
Cortes, M.G., Verelst, H., Pedraja, R.E., Gonzalez, S. (2011) Water and wastewater
management in a sugar process production. Chemical Engineering Transactions, 25: 839-844.
Deshmukh, G.K. (2014) Water and wastewater minimization: a case study of Lokmangal sugar
and co-generation industries Ltd, Bhandarkavathe. International Journal of Civil and
Environmental Engineering, 36: 1261-1265.
European Commission Integrated pollution prevention and control reference document on
best available technology in the food, drink and milk industries (2006).
Gunjal, B., Gunjal, A. (2013) Water conservation in sugar industry. Nature, Environment and
Pollution Technology, 12: 325-330.
Heluane, H., Ingaramo, A., Colombo, M., Saba, R., Cesca, M. (2003) Process data analysis in a
cane sugar factory. 6th Conference on process integration, modelling and optimization for
energy saving and pollution reduction, Hamilton, Canada.
Hulett, D.J.L. (1970) Water conservation in sugar mills. Proceedings of the South African Sugar
Technologists Association.
Ingaramo, A., Heluane, H., Colombo, M., Cesca, M. (2009) water and wastewater eco-
efficiency indicators for the sugar cane industry. Journal of Cleaner Production, 17: 487-495.
International Finance Corporation (IFC) (2007a) Environmental Health and Safety Guidelines
for Sugar Manufacturing.
International Finance Corporation (IFC) (2007b) Environmental Health and Safety Guidelines:
General: Environmental Wastewater and Ambient Water Quality.
International Finance Corporation (IFC) (2007c) Environmental Health and Safety Guidelines:
General: Water Conservation.
International Finance Corporation (2011) Good Management Practices for the Cane Sugar
Industry.
Ramjeawon, T. (2000) Cleaner production in Mauritian cane-sugar factories. Journal of
Cleaner Production, 8: 503-510.
Van Zyl, H.J., van Zyl, J.E., Geustyn, L., Ilemobade, A., Buckle, T.S. (2007) Water consumption
levels in selected South African cities. WRC report no 1536/1/06. ISBN 978-1-77005-480-6.

35 | NATSURV Water, wastewater and energy management in the South African sugar industry
Section 5: Wastewater generation and management
5.1 Quality and quantity of wastewater produced
5.1.1 Volume of wastewater generated: monitoring and metering
Of the 12 NATSURV respondents, two indicated that they monitor the total effluent discharge
as well as discharge from specific streams, three that they monitor only the total discharge,
and four that they only monitor one or more specific effluent streams, but not the total
volume (Figure 21A). Half of the respondents indicated that they use meters to measure the
volume of wastewater generated (Figure 21B).
A
Figure 21: Monitoring of wastewater volumes by 12 South African sugar industry NATSURV
respondents: Type of effluent (A) and method of measurement applied (B)
5.1.2 Recycling of wastewater and specific wastewater discharge
It was difficult to obtain reliable data on the specific wastewater discharge volumes (SWDV)
given in Table 8 because South African mills do not necessarily meter specific flows. For
example, at one mill, a large volume of water from the scrubbers is discharged to a settling
dam for cooling and ash settling. The SWDV is based on the gross requirements of the
scrubbers. However, a substantial portion of the settled water is reused, so that the net
(actual) SWDV cannot be calculated.
In the case of the mills with back-end refineries, one of the facilities uses once-through river
water in the cooling towers, which contributes significantly to the total SWDV. The measured
value at this facility is 11.53 kl/ton cane (Table 8). Another combined mill and refinery, despite
having relatively new infrastructure and stringent water-saving measures, receives large
volumes of raw sugar from other mills. This naturally increases its process water requirements
and subsequently the water intake and total SWDV.
In the previous NATSURV, it was stated that the wastewater discharge of plants in South Africa
is “about 30% of water intake” which the authors calculated to be approximately 0.18 kl of

36 | NATSURV Water, wastewater and energy management in the South African sugar industry
wastewater per ton of sugar cane (Figure 8), and that facilities produce between 750 and
2 500 kl of wastewater per day. However, it was not reported whether the figures were
derived from stand-alone mills and/or combined facilities. There was also no indication of the
number and size of the facilities included in the calculations.
After an extensive literature search, only one publication was found that contained SWDVs.
These values were taken from five mills in Mauritius, where the SWI (Section 4) and SWDV
were considered as “high”.
Table 8: Total specific wastewater discharge volumes: local and global
Type of facility No. Reference
Average (kl/ton cane)
Range (kl/ton cane)
Unknown Unknown BER BER SAM
6 ? 2 1 3
5.9 0.18 0.10
11.53* 1.26
2.5 to 12.8 Not given
0.06 to 0.15 -
0.29 to 3.12**
Ramjeawon, 2000 NATSURV, 1990 NATSURV, 2016 NATSURV, 2016 NATSURV, 2016
* Once-through cooling water used **recycling of boiler stack scrubber wastewater not accounted for in calculation R = refinery BER = mill with back-end refinery SAM = stand-alone mill
Effluent from boiler stacks and cooling towers contributes significantly to effluent volume,
but this can be reduced substantially by recycling.
To enable industries to decrease the volume of wastewater generated, it is important to
measure recycled wastewater volumes and discharge volumes from specific processes and
streams.
Four of the NATSURV respondents provided metered values for wastewater discharges from
specific processes or operations, while two provided estimated values (Table 9). Ideally,
effluent volumes should be metered as part of a sound environmental management plan.

37 | NATSURV Water, wastewater and energy management in the South African sugar industry
Table 9: Specific wastewater discharge volumes from various operations
Type of facility
Boiler stacks
Equipment cleaning
Evaporators Cooling towers
Other Comments
kl/ton cane kl/ton cane kl/ton cane
kl/ton cane
kl/ton cane
BER 0.362 (M) 0.05 (M) 0.006 (E) 11.11 (M) - Once-through cooling tower water from river
SAM* 2.98 (M)* - - - 0.14 (M) Other: Combined from all other operations & sewers
SAM 0.29 (M) - - - 0.07 (M) Other: Combined from all other operations
SAM 0.08 (E) - - - 0.001 (E) Other: Combined from equipment cleaning and wash-down
SAM - - - 0.688 (M) -
*significant volume of boiler stack effluent is recycled M = metered E = estimated BER = mill with back-end refinery SAM = stand-alone mill
5.1.3 Wastewater quality: local and global
The major liquid effluents from sugar factories are condenser water, floor (and other) wash-
water, scrubber water, boiler blow-down, and contaminated cane yard run-off. The character
of the effluent from each can differ considerably. If streams are kept separate, they require
different levels of treatment and/or management before disposal of the final effluent.
Despite a specific request in the questionnaire (Appendix 1), none of the respondents
supplied historical wastewater quality data. Data was also not forthcoming from government
sources. Although 50% of the respondents indicated that they would allow sample collection,
the project team decided that unless long-term analyses could be conducted, once-off
sampling could present a distorted picture of the wastewater quality.
For the purpose of the NATSURV document, it is important that readers are provided with
information about the character of wastewater emanating from the sugar industry. In the
absence of data from South Africa, global values from literature sources are presented in
Table 10. Most of the parameters given in the table reflect the character of the effluent from
different sources, or the final combined effluent before any form of treatment. The South
African mills all attempt to comply with the legislative standards (Section 3), which usually
require treatment before discharge.
The results from these studies indicate that the pH of combined effluent from sugar cane
processing plants is slightly acidic, although some waste streams may be alkaline. The
presence of sugar and other organics in the wastewater can lead to high COD concentrations.
Although the effluent can contain phosphates, the COD:N ratio is typically high, making it
nutrient-limited for biological treatment. This can be overcome by treating sugar mill/refinery
effluent simultaneously with domestic effluent. However, this may render the treated

38 | NATSURV Water, wastewater and energy management in the South African sugar industry
effluent unsatisfactory for irrigation or discharge to water courses, unless it is properly
sterilised to remove potential pathogens.
Although COD is seen locally and globally as the most important parameter used to assess
wastewater quality from the sugar cane processing industry, the effluent can contain high
concentrations of suspended solids. The effluent may also be highly coloured, both before
and/or after conventional treatment. In addition, oil from machinery such as mills can be
present in the wash wastewater. Some waste streams, such as boiler blow-down, may have
elevated temperatures which need to be taken into consideration if the water is being directly
discharged before cooling. These parameters all need to be considered by the legislative
bodies, and should also ideally be monitored at timely intervals.
The ratio of BOD5:COD serves as a proxy to determine whether the organic fraction of
wastewater is biodegradable. The ratio in domestic wastewater is typically around 0.6. The
BOD5:COD ratios of untreated final effluent from the sugar industry reported in literature
range from 0.25 to 0.57.
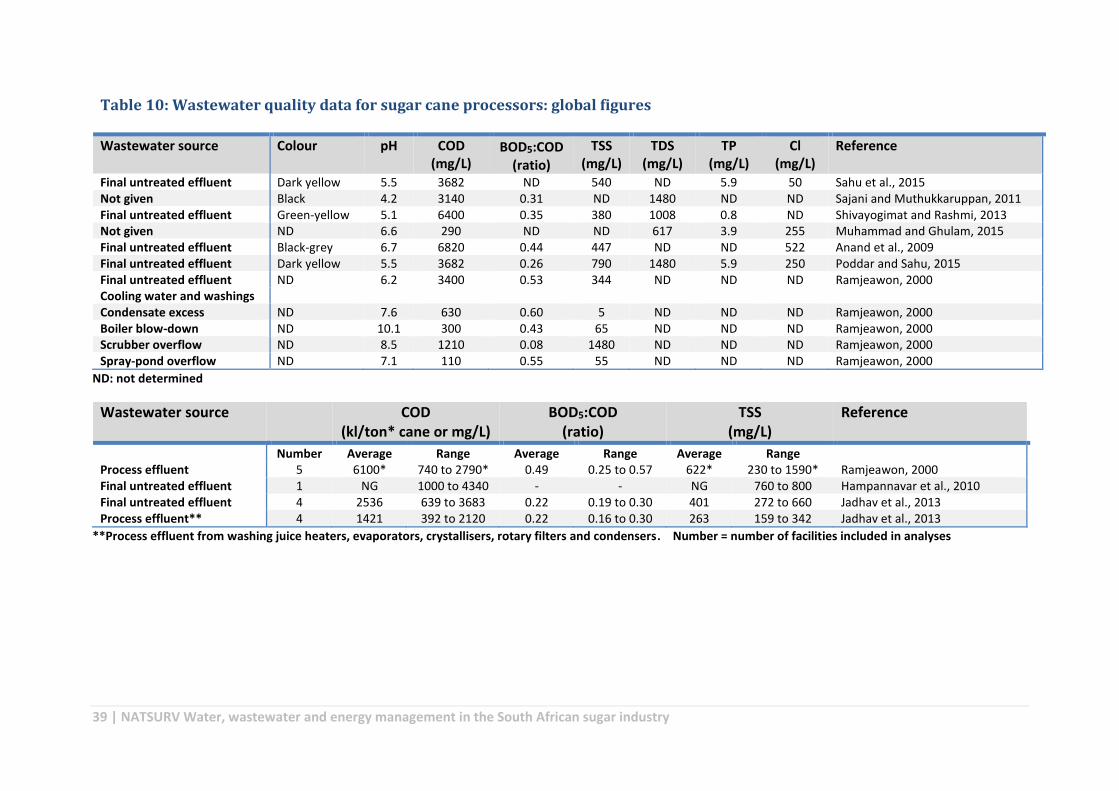
39 | NATSURV Water, wastewater and energy management in the South African sugar industry
Table 10: Wastewater quality data for sugar cane processors: global figures
Wastewater source
Colour pH COD (mg/L)
BOD5:COD (ratio)
TSS (mg/L)
TDS (mg/L)
TP (mg/L)
Cl (mg/L)
Reference
Final untreated effluent Dark yellow 5.5 3682 ND 540 ND 5.9 50 Sahu et al., 2015 Not given Black 4.2 3140 0.31 ND 1480 ND ND Sajani and Muthukkaruppan, 2011 Final untreated effluent Green-yellow 5.1 6400 0.35 380 1008 0.8 ND Shivayogimat and Rashmi, 2013 Not given ND 6.6 290 ND ND 617 3.9 255 Muhammad and Ghulam, 2015 Final untreated effluent Black-grey 6.7 6820 0.44 447 ND ND 522 Anand et al., 2009 Final untreated effluent Dark yellow 5.5 3682 0.26 790 1480 5.9 250 Poddar and Sahu, 2015 Final untreated effluent ND 6.2 3400 0.53 344 ND ND ND Ramjeawon, 2000 Cooling water and washings Condensate excess ND 7.6 630 0.60 5 ND ND ND Ramjeawon, 2000 Boiler blow-down ND 10.1 300 0.43 65 ND ND ND Ramjeawon, 2000 Scrubber overflow ND 8.5 1210 0.08 1480 ND ND ND Ramjeawon, 2000 Spray-pond overflow ND 7.1 110 0.55 55 ND ND ND Ramjeawon, 2000
ND: not determined
Wastewater source COD (kl/ton* cane or mg/L)
BOD5:COD (ratio)
TSS (mg/L)
Reference
Number Average Range Average Range Average Range Process effluent 5 6100* 740 to 2790* 0.49 0.25 to 0.57 622* 230 to 1590* Ramjeawon, 2000 Final untreated effluent 1 NG 1000 to 4340 - - NG 760 to 800 Hampannavar et al., 2010 Final untreated effluent 4 2536 639 to 3683 0.22 0.19 to 0.30 401 272 to 660 Jadhav et al., 2013 Process effluent** 4 1421 392 to 2120 0.22 0.16 to 0.30 263 159 to 342 Jadhav et al., 2013
**Process effluent from washing juice heaters, evaporators, crystallisers, rotary filters and condensers. Number = number of facilities included in analyses

40 | NATSURV Water, wastewater and energy management in the South African sugar industry
5.2 Treatment, management and disposal of wastewater by the local
sugar cane processing industry
Two of the NATSURV respondents indicated that they discharge their final effluent to marine
outfalls, one directly, and one via the municipal reticulation system. Irrigation, followed by
discharge to river systems is currently the most common means of disposal of final effluent
(Figure 22).
Figure 22: Disposal of final effluent by the South African sugar industry
Globally, primary physicochemical and/or secondary biological technologies are typically used
to treat sugar industry effluents, e.g. coagulation with alum in the presence of lime followed
by biological oxidation. Apart from basic solids settling, 4/12 NATSURV respondents indicated
that they currently perform some type of physicochemical treatment: two add lime, one adds
a flocculant, and one dilutes the wastewater (Table 11). Fifty percent of the respondents
indicated that they perform some type of biological treatment: pond systems (4) or activated
sludge (2). One also uses a wetland system as a polishing step, and one treats by natural
percolation through sand. These may also be seen as combined physicochemical/biological
treatment systems (e.g. planted and unplanted constructed/treatment wetlands). An
example of a more sophisticated treatment system that has been installed and is operational
at a South African mill is shown in Figure 23.

41 | NATSURV Water, wastewater and energy management in the South African sugar industry
Table 11: Wastewater treatment and management by South African sugar processors
Type of facility
Treatment Final discharge
R In process of implementing Municipal sewer → marine outfall
BER Anaerobic and aerobic ponds Irrigation
BER Dilution Irrigation
BER Scrubber effluent mixed with spent lime and other effluent streams Irrigation
SAM Solids settling, addition of flocculant, anaerobic and aerobic dams, aeration basin
River Irrigation
SAM Mixed with domestic effluent after treatment in a rotating biological contactor → aeration ponds → clarifier → mixed with scrubber effluent in settling dam (see Figure 24)
River Irrigation
SAM Scrubber water to settling ponds and recycled. Activated sludge treatment for combined storm water , domestic sewage, chemical plant waste, process water etc.
Marine outfall
SAM Anaerobic and aerobic ponds → treatment wetland River
SAM Natural percolation through sand Evaporation dam
SAM No treatment Irrigation
SAM Activated sludge River
SAM Solids separation, lime addition Irrigation
R = refinery BER = mill with back-end refinery SAM = stand-alone mill
Figure 23: Schematic of the treatment system at a South African sugar processing mill, where the effluent is mixed with domestic effluent that has been partially treated in rotating biological contactors, and scrubber water is recycled

42 | NATSURV Water, wastewater and energy management in the South African sugar industry
Section 5 References:
Anand, K., Sivashanmugam, A., Beulah, H., Palaniswamy, N. (2009) Performance evaluation of low cost
adsorbents in reduction of COD in sugar industrial effluent. Journal of Hazardous Materials, 168: 800-
805.
Baban, G & Aparna G. (2013) Water Conservation in Sugar Industry. Journal of Nature Environment
and Pollution Technology, 12: 325-330.
Hampannavar, U.S., Shivayogimath, C.B. (2010) Anaerobic treatment of sugar industry wastewater by
upflow anaerobic sludge blanket reactor at ambient temperature. International Journal of
Environmental Sciences, 1: 631-639.
Harush, D.P., Hampannavar, U.S. (2014) Total water management, operation and maintenance,
troubleshooting of ETP in sugar industry. International Journal of Environmental Sciences, 5: 580-586.
Ingaramo, A., Heluane, H., Colombo, M., Cesca, M. (2009) Water and wastewater eco-efficiency
indicators for the sugar cane industry. Journal of Cleaner Production, 17: 487-495.
International Finance Corporation (IFC) (2007a) Environmental Health and Safety Guidelines for Sugar
Manufacturing.
International Finance Corporation (IFC) (2007b) Environmental Health and Safety Guidelines: General:
Environmental Wastewater and Ambient Water Quality.
International Finance Corporation (IFC) (2007c) Environmental Health and Safety Guidelines: General:
Water Conservation.
International Finance Corporation (2011) Good Management Practices for the Cane Sugar Industry.
Muhammad, A., Ghulam, M. (2015) The physicochemistry of sugar mill effluent pollution of coastlines
in Pakistan. Ecological Engineering, 75: 137-144.
Palazzo, A. (2004) Mill-wide water management in the South African sugar industry. Proceedings of
the South African Sugar Technolgoy Association, 78: 419-426.
Poddar, P.K., Sahu, O. (2015) Quality and management of wastewater in sugar industry. Applied Water
Science, DOI 10.1007/s13201-015-0264-4.
Ramjeawon, T. (2000) Cleaner production in Mauritian cane-sugar factories. Journal of Cleaner
Production, 8: 503-510.
Sahu, O., Gupta, V., Chaudhari, K., Srivastava, V. (2015) Electrochemical treatment of actual sugar
industry wastewater using aluminium electrode. International Journal of Environmental Science and
Technology, 1-12.
Sajani, S., Muthukkaruppan, S.M. (2011) Physico-Chemical Analysis of Sugar Mill Effluent,
Contaminated Soil and its Effect on Seed Germination of Paddy (Oryza sativa L.). International Journal
of Pharmaceutical & Biological Archives, 2:1469-1472.
Shivayogimath, C., Rashmi, J. (2013) Treatment of sugar industry wastewater using electrocoagulation
technique. International Journal of Research in Engineering and Technology, 1: 262-265.

43 | NATSURV Water, wastewater and energy management in the South African sugar industry
Section 6: Energy use and management
The main focus of this NATSURV is water and wastewater management, so this section on
energy management has been kept succinct. The sugar industry is in the position where much
of the energy can be produced by combustion of bagasse, which is seen as carbon neutral.
Other means of energy are coal, wood or spent bark, and diesel (Figure 24).
Figure 24: Different combinations of energy sources, and number of sugar cane processing facilities using each combination
To maintain anonymity, individual energy usage is not provided in this document. Of the study
respondents, only the stand-alone-refinery does not have the option of using bagasse, as no
milling is performed. Over 1 000 mWh/annum (>80% of the energy requirements of the sugar
processing industry) is provided by burning bagasse (n = 10/14, including the stand-alone
refinery (Figure 25). Less than 4% of energy requirements is derived from the grid.
Figure 25: Combined amount of energy produced per annum (MwH), and percentage contribution of different sources of energy, from 10 (of 14) sugar processing facilities in South Africa. Energy conversions applied in calculations: 1 kWh = 3.6 MJ, 1 MT coal = 29 308 MJ, 1 L diesel = 38.79 MJ (higher heating value)
82
11 coal, grid, bagasse
coal, grid, bagasse, wood chips/spent bark
grid, bagasse
coal, grid, diesel
184 MWh(14.9%)
48 MWh(3.9%)
1001 MWh (81.1%)
0.11(<0.1%)
0.13(< 01.%)
coal
grid
bagasse
wood chips
diesel

44 | NATSURV Water, wastewater and energy management in the South African sugar industry
Of the 12 NATSURV respondents, none currently use solar or wind power, but two have plans
to produce bioethanol from cane. Three respondents indicated that they produce excess
energy from bagasse. One company exported 29 GWh of electricity to Eskom in 2016.
Half of the respondents indicated that they had specifically upgraded infrastructure to reduce
emissions and/or save energy. These include:
➢ An upgrade of the boiler plant to reduce coal consumption and emissions, as well as
the installation of new process technology to save steam and energy.
➢ A change of crystalliser drives from worm wheel to planetary gearboxes.
➢ The installation of a Venturi wet scrubber system to reduce emissions.
➢ A “major upgrade” which is currently underway to maximise energy use and reduce
coal dependency, and thus emissions of nitrous oxide and sulphur dioxide (no specifics
given).
➢ The installation of continuous pans and bypassing the press-water clarifier to save
energy.
➢ A “modification” to limit emissions (no specifics given).

45 | NATSURV Water, wastewater and energy management in the South African sugar industry
Section 7: Best practice for water and wastewater
management in the sugar industry
7.1 Introduction The catch-phrase “reduce, reuse, recycle” applies to just about all the world’s resources,
including water, and forms part of the best practice hierarchy (Figure 26).
Best practice is an accepted term that is widely used, and can be defined as “strategies,
activities or approaches that have been shown through research and evaluation to be
effective and/or efficient”. The term is somewhat controversial, because some people feel
that there are always ways to improve, and application of the term suggests that no further
innovation is necessary. The term “best available technology” is now used by some individuals
and groups.
Figure 26: Best practice hierarchy - towards a sustainable future
7.2 Summary of guidelines for best practice In sugar mills and mills with back-end refineries, water is supplied from the cane and from
external sources, and leaves the factory as effluent. Mills can theoretically operate as net
water producers, while stand-alone refineries are completely reliant on external water
sources. Water and effluent management should not be seen as separate entities, as many
so-called effluent streams can be used as water sources. Water recycling is an inherent part
of sugar cane processing in South Africa.
As discussed in Section 4.4, there are many areas where water can be reused in sugar
factories, and recycling/reuse is the primary method of reducing dependency on external
water supplies. The exact manner in which water is recycled and/or reused will differ between
each facility according to operational requirements and existing infrastructure.

46 | NATSURV Water, wastewater and energy management in the South African sugar industry
An example of where a concerted effort was made to improve water use and wastewater
quality in a South African sugar factory was described by Jensen and Schumann (2001). At this
site, effluent water containing mostly sugar and some organics is used instead of condensate
for imbibition (i.e. returned to the process). By doing this, the impurities and product in the
effluent are added to those from the cane. Most of the impurities eventually form part of the
solid waste and/or by-products (boiler smuts, surplus bagasse, and molasses). The rationale
is that instead of a contaminated liquid stream that needs to be treated to comply with
discharge standards, the surplus water for discharge is the condensate that requires minimal
(if any) treatment. If such a strategy is adopted, a sound management plan needs to be
implemented to prevent adverse impacts of poor quality effluent on product quality e.g.
during breakdowns or high precipitation. To achieve this, the factory was retrofitted with
bunded areas containing a series of drains, sumps and storage facilities for specific overflows.
However, there are some drawbacks to this approach, including reduced plant reliability and
an increased need for maintenance of water circuits.
Generic best practice guidelines, summarised in Table 12, range from large-scale changes in
infrastructure, to small-scale changes such as the installation of self-closing nozzles on hoses
and pipes. Factories should scrutinise these to ascertain if and how these measures can be
implemented.

47 | NATSURV Water, wastewater and energy management in the South African sugar industry
Table 12: List of measures that can assist with reducing water use, and/or improving effluent quality and/or reducing effluent quantity
Infrastructure ➢ Replace water-cooled compressors with air compressors. ↓ SWI ➢ Install cleaning-in-place equipment for tanks and pipes. ↓ SWI ↓ SWDV
Simple equipment and measures ➢ Upgrade water sprayers (e.g. nozzles that use less water, self-closing
nozzles), high-pressure, low-volume washing systems, and auto shut-off valves.
↓ SWI
➢ Harvest rainwater. ↓ SWI ➢ Reduce spillages and/or collect product from spillages for reprocessing.
For example, spill collection trays should be installed at appropriate sites. ↓ SWI ↓ EPL ↓ SWDV
➢ Install grids over drains to prevent solids from entering the wastewater. ↓ EPL ➢ Choose the most suitable disinfection chemicals for a particular area.
Preferably use more environmentally friendly/biodegradable alternatives. Use cleaning agents in the correct concentrations and apply according to manufacturers’ instructions. Too low or too high concentrations are not as effective.
↓ EPL
Management and maintenance ➢ Perform regular water audits. Measure and monitor effluent quality and
quantity from each area to identify where product and consumables are being lost.
↓ SWI ↓ EPL ↓ SWDV
➢ Fix leaking pipes timeously. ↓ SWI ↓ EPL ↓ SWDV ➢ Measure and monitor the use and availability of process water and need
for make-up water; adjust recycling/reuse when needed. ↓ SWI ↓ EPL ↓ SWDV
➢ Implement water-use targets. ↓ SWI ➢ Install water meters as part of a water management and monitoring
program. This creates awareness of where water is being wasted. ↓ SWI ↓ SWDV
➢ Cooling towers should be kept clean and in good working order to maximise efficiency. Automatic blow-down should be monitored to prevent excessive water losses. Fill and drift eliminators can reduce evaporative water losses.
↓ SWI ↓ EPL ↓ SWDV
➢ Unless products are being recovered, equipment and spills should be wiped up before washing or rinsing with water (e.g. floors, vessels). In many instances, mechanical cleaning or dry-cleaning techniques are equally effective.
↓ SWI ↓ EPL ↓ SWDV
➢ Educate staff about water conservation, and the potential impact of effluent on the environment.
↓ SWI ↓ EPL ↓ SWDV
➢ Educate staff about how to operate equipment properly in order to save water, reduce effluent and improve effluent quality.
↓ SWI ↓ EPL ↓ SWDV
Water recycling (must be fit for purpose)
➢ Segregate and store wastewater streams for reuse. ↓ SWI ↓ SWDV ➢ Heat condensates should be recovered and reused where possible. ↓ SWI ➢ Use process water of minimum required quality instead of external water. ↓ SWI ➢ Substitute condensate with lower quality process water if possible. ↓ SWI ↓ EPL ➢ Recycled water, such as blow-down water, should be used to moisten coal
ash. ↓ SWI ↓ SWDV
➢ If possible use treated effluent for floor washing and/or beneficial irrigation.
↓ SWI ↓ SWDV
➢ Use clean condensate as make-up water in cooling towers. ↓ SWI ↓ SWDV
SWI = specific water intake; EPL = effluent pollutant load; SWDV = specific wastewater discharge volume
Adapted from IFC (2007a, 2007b, 2007c, 2011) and Ingaramo et al. (2009)

48 | NATSURV Water, wastewater and energy management in the South African sugar industry
7.3 7.3 Application of environmental indicators SWI is the basic measurement used to assess water consumption by industry. However, there
are a number of other eco-efficiency indicators that can be used. These typically require a
large range of measured data and elaborate computational tools. The less complex
environmental water use efficiency indicator known as WIN (Water use INdex) takes into
consideration six inter-related water cycles (systems). To assess whether water from one
cycle may be suitable for use in another, the typical water quality from each cycle is taken
into account in the model. WIN values range from 0 (minimum water usage) to 1 (maximum
water usage).
From a more holistic environmental perspective, it has been suggested that the generation of
wastewater by individual sugar cane processing plants should be assessed using indicators
such as the Environmental INdicators (EIN) — EIN1 and EIN2 — proposed by Ingaramo et al.
(2009). These are simple calculations that take into account the quality and quantity of
effluent. These indicators should ideally be used in conjunction with the WIN to provide a
holistic environmental assessment of environmental water management practices.
Both EIN1 and EIN2 use COD as the proxy value for wastewater quality. EIN1 also takes into
account the local legislative COD limits. However, the COD is not expressed as a
concentration, but as the amount (in kg) of COD generated for each 100 tons of cane crushed.
This is an extremely useful parameter which allows the use of EIN1, EIN2 and WIN to compare
environmental water management across the industry.
From a local perspective, the application of such environmental indicators could allow
milling/refining groups to compare the environmental performance of the plants within their
group. This knowledge would provide insight into which operational choices provide the best
environmental performance outcomes.
WIN can compare water consumption in sugar factories operating under a variety of
conditions and configurations, and is represented by Equation 2:
(𝑊𝑐 − 𝑊𝑅) ÷ (𝑊𝑈𝑃 − 𝑊𝑅) Equation 2
Where,
WC = actual fresh water consumption/100 ton cane (make-up water)
WUP = the upper water consumption/100 ton cane, which is the volume required to satisfy all
water requirements using external water
WR = reference water consumption/100 ton cane, which is the volume of water used if all the
reuse/recycling in cycles 1 to 6 are implemented under stipulated operating conditions
(standard efficiencies).
The WC, WUP and WR are calculated from mass flows according to Equations 3 to 5:

49 | NATSURV Water, wastewater and energy management in the South African sugar industry
𝑊𝐶 = ∑ 𝑤𝑎𝑡𝑒𝑟 𝑖𝑛 𝑝𝑟𝑜𝑑𝑢𝑐𝑡𝑠 𝑎𝑛𝑑 𝑛𝑜𝑛 𝑝𝑟𝑜𝑑𝑢𝑐𝑡𝑠 − 𝑤𝑎𝑡𝑒𝑟 𝑖𝑛 𝑐𝑎𝑛𝑒 + ∑ 𝑙𝑜𝑠𝑠𝑒𝑠 + ∑ 𝑝𝑢𝑟𝑔𝑒𝑠
Equation 3
𝑊𝑈𝑃 = ∑ 𝑤𝑎𝑡𝑒𝑟 𝑖𝑛 𝑝𝑟𝑜𝑑𝑢𝑐𝑡𝑠 𝑎𝑛𝑑 𝑛𝑜𝑛 𝑝𝑟𝑜𝑑𝑢𝑐𝑡𝑠 − 𝑤𝑎𝑡𝑒𝑟 𝑖𝑛 𝑐𝑎𝑛𝑒 + ∑ 𝑢𝑝𝑝𝑒𝑟 𝑙𝑜𝑠𝑠𝑒𝑠
Equation 4
𝑊𝑅 = ∑ 𝑤𝑎𝑡𝑒𝑟 𝑖𝑛 𝑝𝑟𝑜𝑑𝑢𝑐𝑡𝑠 𝑎𝑛𝑑 𝑛𝑜𝑛 𝑝𝑟𝑜𝑑𝑢𝑐𝑡𝑠 − 𝑤𝑎𝑡𝑒𝑟 𝑖𝑛 𝑐𝑎𝑛𝑒 + ∑ 𝑙𝑜𝑤𝑒𝑟 𝑙𝑜𝑠𝑠𝑒𝑠 +
∑ 𝑙𝑜𝑤𝑒𝑟 𝑝𝑢𝑟𝑔𝑒𝑠 Equation 5
For details on WIN and other environmental indicators for the sugar cane processing industry,
refer to Ingaramo et al. (2009).
Section 7 References:
Ingaramo, A., Heluane, H., Colombo, M., Cesca, M. (2009) Water and wastewater eco-
efficiency indicators for the sugar cane industry. Journal of Cleaner Production, 17: 487-495.
International Finance Corporation (IFC) (2007a) Environmental Health and Safety Guidelines
for Sugar Manufacturing.
International Finance Corporation (IFC) (2007b) Environmental Health and Safety
Guidelines: General: Environmental Wastewater and Ambient Water Quality.
International Finance Corporation (IFC) (2007c) Environmental Health and Safety Guidelines:
General: Water Conservation.
International Finance Corporation (2011) Good Management Practices for the Cane Sugar
Industry.
Jensen, C.R.C, Schuman, G.T. (2001) Implementing a zero effluent philosophy at a cane sugar
factory. Proceeding of International Sugar Cane Technology, 24: 74-79.
Ramjeawon, T. (2000) Cleaner production in Mauritian cane-sugar factories. Journal of
Cleaner Production, 8: 503-510.
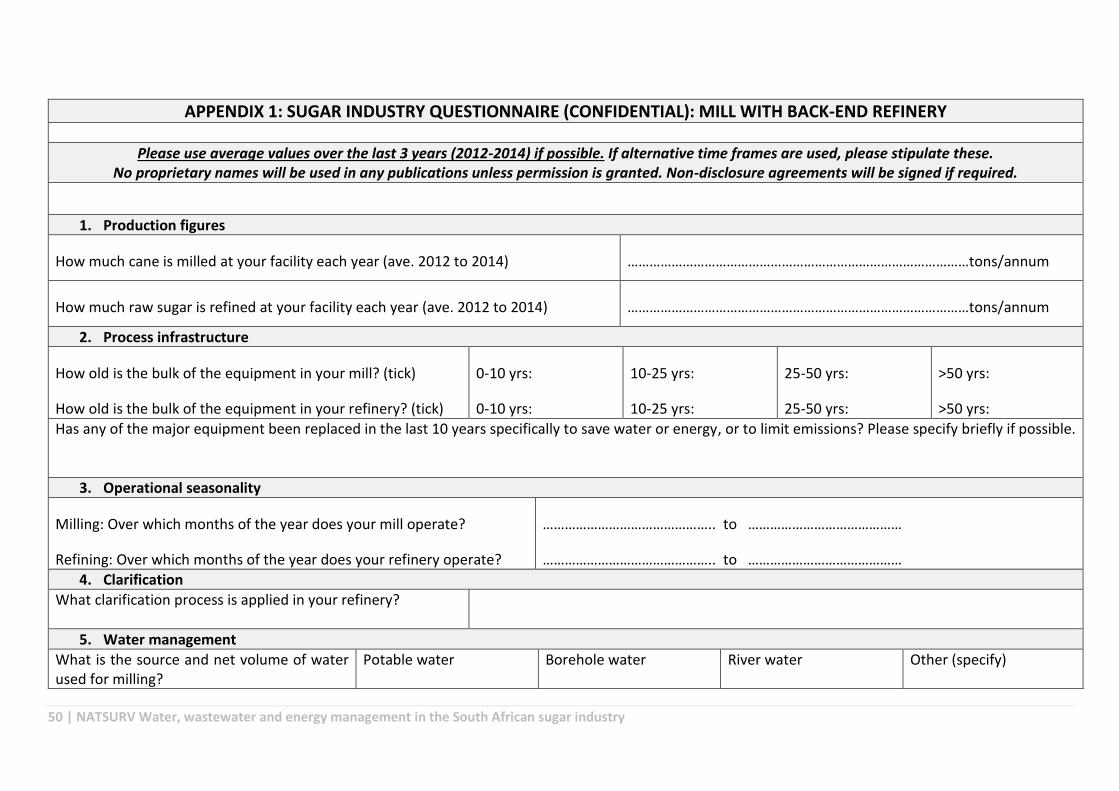
50 | NATSURV Water, wastewater and energy management in the South African sugar industry
APPENDIX 1: SUGAR INDUSTRY QUESTIONNAIRE (CONFIDENTIAL): MILL WITH BACK-END REFINERY
Please use average values over the last 3 years (2012-2014) if possible. If alternative time frames are used, please stipulate these. No proprietary names will be used in any publications unless permission is granted. Non-disclosure agreements will be signed if required.
1. Production figures
How much cane is milled at your facility each year (ave. 2012 to 2014) …………………………………………………………………………………tons/annum
How much raw sugar is refined at your facility each year (ave. 2012 to 2014) …………………………………………………………………………………tons/annum
2. Process infrastructure
How old is the bulk of the equipment in your mill? (tick)
How old is the bulk of the equipment in your refinery? (tick)
0-10 yrs:
0-10 yrs:
10-25 yrs:
10-25 yrs:
25-50 yrs:
25-50 yrs:
>50 yrs:
>50 yrs:
Has any of the major equipment been replaced in the last 10 years specifically to save water or energy, or to limit emissions? Please specify briefly if possible.
3. Operational seasonality
Milling: Over which months of the year does your mill operate?
Refining: Over which months of the year does your refinery operate?
……………………………………….. to ……………………………………
……………………………………….. to ……………………………………
4. Clarification
What clarification process is applied in your refinery?
5. Water management
What is the source and net volume of water used for milling?
Potable water
Borehole water
River water
Other (specify)
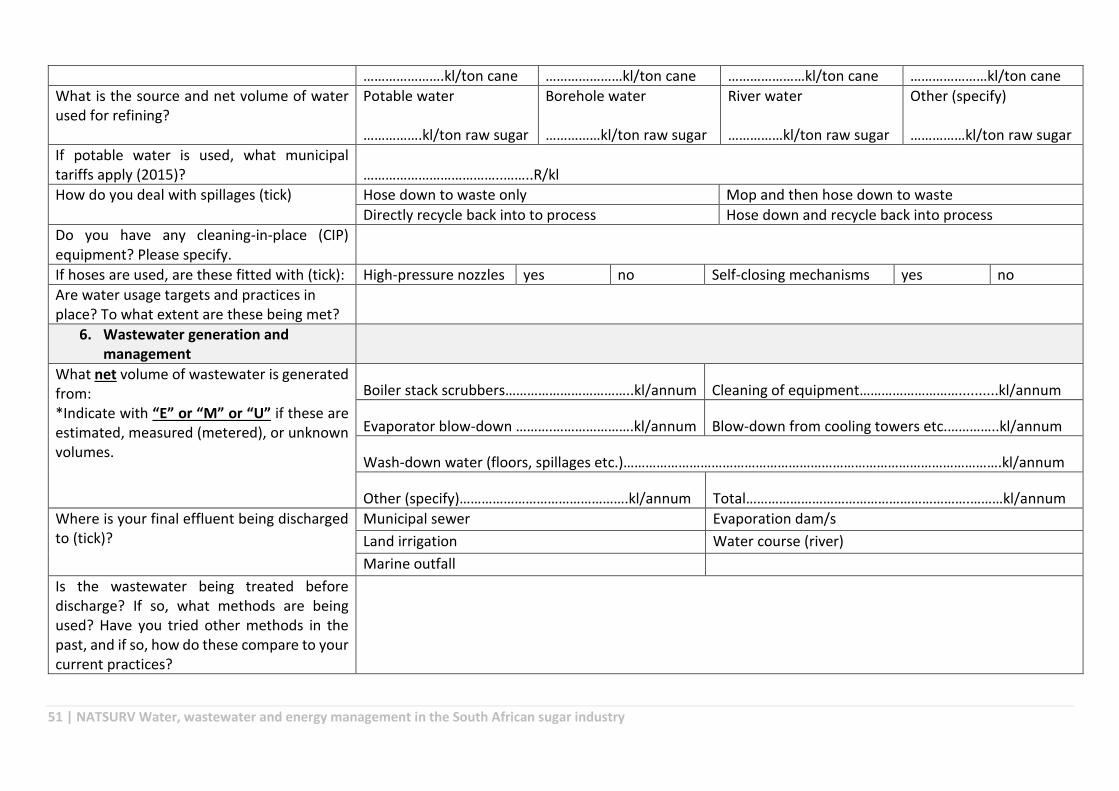
51 | NATSURV Water, wastewater and energy management in the South African sugar industry
………………….kl/ton cane …………………kl/ton cane …………………kl/ton cane …………………kl/ton cane
What is the source and net volume of water used for refining?
Potable water …………….kl/ton raw sugar
Borehole water ……………kl/ton raw sugar
River water ……………kl/ton raw sugar
Other (specify) ……………kl/ton raw sugar
If potable water is used, what municipal tariffs apply (2015)?
………………………………..……..R/kl
How do you deal with spillages (tick) Hose down to waste only Mop and then hose down to waste
Directly recycle back into to process Hose down and recycle back into process
Do you have any cleaning-in-place (CIP) equipment? Please specify.
If hoses are used, are these fitted with (tick): High-pressure nozzles yes no Self-closing mechanisms yes no
Are water usage targets and practices in place? To what extent are these being met?
6. Wastewater generation and management
What net volume of wastewater is generated from: *Indicate with “E” or “M” or “U” if these are estimated, measured (metered), or unknown volumes.
Boiler stack scrubbers……………………………..kl/annum Cleaning of equipment………………………..........kl/annum
Evaporator blow-down ……….………………….kl/annum Blow-down from cooling towers etc.…………..kl/annum
Wash-down water (floors, spillages etc.)………………………………………………………………………………………….kl/annum
Other (specify)……………………………………….kl/annum Total…………………………………………………….………kl/annum
Where is your final effluent being discharged to (tick)?
Municipal sewer Evaporation dam/s
Land irrigation Water course (river)
Marine outfall
Is the wastewater being treated before discharge? If so, what methods are being used? Have you tried other methods in the past, and if so, how do these compare to your current practices?

52 | NATSURV Water, wastewater and energy management in the South African sugar industry
Which statutory body provides your discharge permit (specify local, district or metropolitan municipality, or DWS)? What are your permitted effluent parameter limits?
Are wastewater quality and quantity targets in place? If so, to what extent are these being met? How do the targets compare to statutory requirements?
NB: Please provide us with historical wastewater quality data on different waste streams (if available) and/or the final effluent. This may be provided in a separate document.
7. Energy usage
What quantity of energy is derived from the following sources/fuel, and if applicable, what is the cost of this energy (tariffs and/or raw material costs)?
Electricity from grid Coal
……………………..kW/annum …………………………..R/kWh ……………………..kW/annum …………………………..R/kWh
Wood chips Gas
……………………..kW/annum …………………………..R/kWh ……………………..kW/annum …………………………..R/kWh
Diesel Bagasse
……………………..kW/annum …………………………..R/kWh ……………………..kW/annum …………………………..R/kWh
Other (specify) Other (specify)
……………………..kW/annum …………………………..R/kWh ……………………..kW/annum …………………………..R/kWh
Do you produce excess energy from burning of bagasse (yes/no)? If so, how much.
…………………………………………. kW/annum
Do you have plans to use or produce alternative energy in future?
Solar energy Yes No
Wind energy Yes No
Bioethanol production from bagasse Yes No
Bioethanol production from cane Yes No

53 | NATSURV Water, wastewater and energy management in the South African sugar industry
Other (specify)
8. By-product and solid waste generation and management
Please indicate briefly what the following by-products or wastes are used to produce, or how they are disposed of:
Bagasse…………………………………………………………………………………………………………………………………………………………………
Molasses from mill…………………………………………………………………………………………………………………………………………………
Refiners molasses…………………………………………………………………………………………………………………………………………………..
Filter mud cake………………………………………………………………………………………………………………………………………………………
Residue from clarification………………………………………………………………………………………………………………………………………
Spent filter resins etc……………………………………………………………………………………………………………………………………………..
Sludge from wastewater treatment (if applicable)………………………………………………………………………………………………….
Sludge from dams/ponds etc. (if applicable)…………………………………………………………………………………………………………..
9. Closing questions Yes No
Would you allow the name of your company to be acknowledged in this report?
Would you like to receive a copy of this report and comment prior to publication?
Would you allow us to collect wastewater samples?
Would you or a delegate from your company be interested in participating in the workshop that will be held in coming months?