wps………..7/2017 nilerd working paper series arup...
TRANSCRIPT

1
WPS………..7/2017
NILERD WORKING PAPER SERIES
Arup Mitra
National Institute of Labour Economics, Research and Development Sector A-7, Narela Institutional Area, Delhi-110 040, INDIA
AUGUST 2017

2
ARUP MITRA1
NATIONAL INSTITUTE OF LABOUR ECONOMICS RESEARCH AND DEVELOPMENT (NILERD) AGAIN INTRODUCED THE NILERD WORKING PAPERS SERIES IN AUGUST 2017. THESE PAPERS PRESENT RESEARCH IN PROGRESS OF THE FACULTIES OF NILRED AND ARE DISSEMINATED TO ELICIT COMMENTS AND FURTHER DEBATE. THE VIEWS EXPRESSED IN THESE PAPERS ARE THOSE OF AUTHORS AND NOT THAT OF NILERD. COMMENTS AND OBSERVATIONS MAY PLEASE BE FORWARDED TO AUTHORS. CITATION AND USE OF SUCH PAPERS SHOULD TAKE INTO ACCOUNT ITS PROVISIONAL CHARACTER.
1Currently Director General, NILERD and Professor, Institute of Economic Growth, Delhi. [email protected]; [email protected]

3
Growth, Inequality, Poverty and Urbanization
Arup Mitra
Abstract
The focus in this paper is on growth, inequality and poverty, particularly in relation to urbanization. The analysis is pursued at three levels of disaggregation: states, districts and the million-plus cities. At the state level, urbanization does not show any significant impact on rural poverty though it tends to reduce poverty in the urban areas. Growth influences urbanization positively, while urbanization and expansion in non-agricultural activities both contribute to economic growth. An alternative technique again shows a strong association between urbanization and per capita net state domestic product. Although urban inequality is not strongly correlated with urbanization and growth, the relationship is distinct. While poverty tends to decline evidently, inequality rises in the process of growth and urbanization. Further, a positive relationship among migration, urbanization and growth index is noticeable. The district-level data confirms a positive association among urbanization, work participation rate, percentage of workforce engaged in non-household manufacturing and services, literacy, growth and inequality, though the degree of association is mild. Urbanization shows a strong beneficial effect on poverty at the district level. The regression analysis of urbanization at the district level suggests that both rural and urban growth contribute to urbanization. The rural male work participation rate and rural male literacy also add to urbanization as rural male workers and literates are more likely to migrate to cities in search of better jobs after acquiring work experience and skills. With rural diversification (expansion in nonagricultural activities), the urbanization level also tends to increase, as the rural-urban continuum in terms of activities, tends to improve. From the data at the city level (million-plus cities), there is evidence of poverty, declining in response to growth and city size, which favours the agglomeration effects. If the agglomeration benefits were to be reaped, the mega cities would require further investment. Keywords: urbanization, growth, poverty, city, workforce

4
1. Analytical Framework
In the process of economic growth, inequality may increase, particularly in the initial stages, as seen in the light of the historical experience of the developed countries (Kuznets 1966). Since urbanization also increases in response to per capita income growth, one may infer that inequality and urbanization go hand in hand. In other words, urbanization is a concomitant of rapid growth and since growth and inequality go hand in hand, at least in the initial phases, rising inequality in the urban context need not come as a major surprise, particularly in the context of developing countries. However, from a different perspective, urbanization and reduction in interregional inequality may move together. It is usually observed that urban incomes are higher than rural incomes. Therefore, lagging urbanization can lead to rising rural–urban and regional inequality. On the other hand, rapid urbanization encompassing a large inflow of population from the rural areas benefits many and, thus, inequality may decline. It is, therefore, pertinent to examine the impact of urbanization on growth, inequality and poverty in India. This is a key question both in urban development research and urban policy making. Because of the agglomeration effects and rise in total factor productivity growth, economic growth is expected to be positively associated with urbanization. Also, in the process of urbanization, employment opportunities for all sections of the society including the unskilled and semi-skilled variety of the workforce are expected to grow through several forward and backward linkages between the dynamic sectors and the informal sector. In other words, even the activities that were residual in nature to begin with may acquire productivity gains in the process of urbanization and, thus, offer better levels of living to the workers located in the lower echelons. Since the cost of providing services in the urban areas is usually less than that in the rural areas (as a result of agglomeration effects), the decline in the incidence of urban poverty is likely to take place at a higher pace with rapid urbanization. Even the rural poor benefit in the process of urbanization through inter-linkage effects. Inequality and poverty are likely to have a direct relationship. Given the level of per capita income if inequality rises, it results in an increase in poverty. However, when both growth and inequality rise simultaneously, the poverty outcome is a bit uncertain. The beneficial effects of growth on poverty tend to get neutralized by the adverse effects of increasing inequality on poverty and thus the net decline in poverty can be quite modest. However, at higher levels of growth when inequality tends to

5
decline, poverty is certain to fall. One may, therefore, infer that at higher stages of urbanization, the overall poverty is also expected to decline substantially. However, there can be deviations from this postulation. Since urbanization can offer opportunities to rural migrants to escape poverty—more so because of the agglomeration effects in large human settlements—the relationship between urbanization, on the one hand, and rural and urban poverty, on the other, can be an inverse one even at the lower levels of urbanization. If rural–urban migration is directed to large cities and much of the economic growth also originates from large cities, the decline in poverty and rise in urbanization can occur simultaneously. Ferre et al. (2012) provide evidence from eight developing countries in favor of an inverse relationship between poverty and city size. Poverty is both more widespread and deeper in very small and small towns than in large or very large cities and, more importantly, a majority of the urban poor live in medium, small or very small towns. In other words, the share of small towns in total urban poverty is much more than that of large cities. Also, the authors noted that the greater incidence and severity of consumption poverty in smaller towns is generally compounded by similar greater deprivation in terms of access to basic infrastructure services, such as electricity, heating gas, sewerage and solid waste disposal (also see Lanjouw and Murgai, 2010). Since the urbanization level in India is relatively low, the composition of national poverty has a relatively lager rural share and so also the policy focus, and, thus, urban poverty is often treated as a rural spill-over (Dandekar and Rath, 1971), even when rural to urban migration has not been rapid. The linkages between rural and urban poverty, therefore, needs a thorough investigation, and if the linkages are not found to be strong, more effective strategies need to be initiated for urban poverty reduction specifically. Mahadevia and Sarkar (2012) pointed out that there has been an increase in inequality between the metros and the non-metros. The beneficiaries of economic reforms comprise only the top 20 and 5 percent of the population in the metros and the non-metros respectively, while the bottom 40 per cent of the population in these cities witnessed a rise in consumption only at a decreasing rate. The McKinsey Global Institute Report and that of India’s High Powered Expert Committee (Report on Indian Urban Infrastructure and Services) vouched for promoting urbanization through metropolization and global linkages of large cities. But in the face of existing inequality, such a recommendation, if implemented, is feared to accentuate the degree of inequality further. Mahadevia and Sarkar (2012) also elucidated in terms of investment the pro-metro bias of the largest urban program (Jawaharlal Nehru National Urban Renewal Mission, (JNNURM)). In a paper by Sharma and Kumari (2012), the authors show a relationship between poverty and weights, which are the combined effect of distance to nearest town and class of towns in India. Higher weights are given to bigger towns and closer rural areas in terms of distance. The authors noted a U-shaped curve, implying that poverty reduces till a certain point and after that it starts increasing. This has a very interesting policy implication: if the government wants to invest in poverty alleviation in villages, it should be spent directly within the villages that are more than 20 km away from the nearest town. On the other hand, in the case of poor villages located within 20 km from the towns, government investment should be incurred in the nearby towns, which will indirectly benefit the surrounding rural areas through spillover effects.

6
Another important aspect of inequality and poverty in India is the social dimension. Kundu and Mohanan (2009) noted that inequality across social and religious groups has gone up in rural areas and small towns, but not in large cities. Urban poverty is high not only in backward areas/states but also in many developed states, suggesting that lack of development and the nature and pattern of development both are important for poverty reduction. They noted that vertical inequality in the urban areas had grown faster than in the rural areas. On the other hand, rural poverty is concentrated in a few inaccessible and less developed areas, and among those, with high incidence of a socially disadvantaged population. Using per capita consumption expenditure as a measure of welfare, Deaton and Dreze (2002) noted that interstate inequality increased between 1993–1994 and 1999–2000, and that urban–rural inequality increased not only throughout India but also within states. Jha (2002) found higher inequality in both urban and rural sectors during the reforms period compared to the early 1990s. In the context of cities/towns, Kundu (2006) noted gross inequality between the million-plus cities (with one million or more population), medium towns (with 50,000 to one million population) and small towns (with less than 50,000 population) in terms of employment and consumption. In particular, consumption expenditure differences across different size classes of cities/towns are indicative of severe intra-urban inequality. Kundu (2006) further noted that intra-urban inequality has increased over time. Cali (2008) empirically addressed three important aspects of the urbanization process in India: rural–urban disparities and their relation with economic development; the relation between urbanization and growth; and the convergence hypothesis in cities’ growth. The results support the idea of a U-shaped relation between rural–urban disparities in socio-economic indicators and the level of economic development. Though the level of urbanization and that of economic development go hand in hand across Indian states over time, this relation is not strong. Also the rate of urbanization (change in the proportion of population living in the urban areas) and the rate of economic growth appear to be negatively correlated. Finally, the author noted a tendency towards convergence in growth rates among Indian towns: other things being equal, smaller towns grow faster than large ones. Further, Cali and Menon (2012) pointed out that urbanization has a substantial and systematic poverty-reducing effect in the surrounding rural areas. The authors argue that this effect is causal in nature and is largely attributable to the positive spillovers of urbanization on the rural economy rather than to the movement of the rural poor to the urban areas. We turn to the quantitative aspects of these views later in the following sections. As regards the agglomeration economies large cities are seen to be more productive though the productivity levels start tapering off beyond a threshold limit (Mitra, 2000). Possibilities relating to ancillarization and sub-contracting are much more in large cities as the firms are not only large in number but also they tend to encourage interdependency in an attempt to reduce cost and pursue super-specialization (Mitra, 2014). Further, the rural-urban distinction has grown sharper in response to globalization as much of the activities are undertaken in cities across the world. Whether substantial productivity gains arise from such concentration and whether they actually get translated into higher wages or there are labor market forces such as informalization and contractualization which tend to slow down the wage growth? If the unskilled labor does not gain and wage inequality rises in the process of growth then the role of urbanization in reducing poverty will naturally be curtailed.

7
How urban poverty is to be conceptualized is also an important question. Housing and access to basic amenities, health and education are some of the important dimensions in assessing urban poverty rather than simply considering consumption expenditure. Growth of slums is an endemic feature of urbanization. How improvements in living conditions can be attained so that urbanization becomes inclusive and, at the same time, creates world-class cities for future growth to accelerate is a key challenge for the Indian government. What would be the effective ways of providing support (such as asset creation for livelihood promotion and accessibility to inexpensive transport and other infrastructural facilities) to the urban poor is an important question from the policy point of view. On the whole, evidence related to growth, inequality, poverty and urbanization is not scanty. But at the same time, keeping in view some of these pertinent issues, there is a need to pursue fresh research based on the recent data from the population census of 2011 and National Sample Survey Office’s (NSSO) survey (2011-12) on consumption expenditure. The focus of this paper is on growth, inequality and poverty, particularly in relation to urbanization. The analysis is pursued at three levels of disaggregation—states, districts and the million-plus cities—for which data is available. Three important sources of information are used: (1) NSS data on consumption expenditure, (2) Central Statistical Office (CSO) data on domestic product per capita (growth), and (3) population census data on urbanization and many other socio-economic and demographic characteristics. The study is organized as follows. In section 2, we present estimates of gross domestic product originating from the urban areas. Section 3 presents empirical analysis of growth, inequality, poverty and urbanization, which is pursued at three levels of disaggregation: states, districts and million-plus cities. Section 4 focuses on the multi-faceted nature of poverty and section 5 summarizes the major findings. 2. Contribution of Urban Areas to Overall Growth
The level of urbanization measured in terms of the percentage of population residing in the urban areas is perceptibly low, and it sluggishly increased from around 28 to 31 percent over 2001 to 2011. However, as Mitra and Mehta (2011) estimated that the amount of GDP originating from urban areas at the national level in nine pre-identified sectors of the economy is considerably high (Table 1). Almost 70 per cent of the GDP is generated in urban areas as per the first estimate, which uses the ratio of urban wage to all-areas wage in order to adjust for productivity differentials across rural and urban areas. On the other hand, in the second estimate—using the ratio of urban monthly per capita consumption expenditure (MPCE) to all-areas average MPCE—the figure is around 59 per cent. In non-agriculture activities, the share of urban India is 92 per cent and 76 per cent as per estimates 1 and 2 respectively. Urban India’s share of the GDP can be attributed to the value created by the manufacturing and services sectors. (Table 1 presents the mean values of estimate 1 and estimate 2.) Table 2 presents the proportion of urban areas GDP as part of state GDP (which is otherwise called as state domestic product, SDP) across primary, secondary and tertiary sectors. The numbers in the table represent the mean value of two different estimates of state domestic product or SDP. It is interesting to see that the urban areas’ share of SDP is less than 50 per cent in 17 states, though in terms of non-agricultural SDP, the share is substantially high across most of the states and union territories. Delhi is the most urban state, with 96 per cent of its GDP coming from the urban areas. The contribution of urban areas in rapidly industrializing states such as Gujarat, Maharashtra,

8
Chhattisgarh and Karnataka is almost 85 per cent of the SDP. The contribution of nonagricultural activities to the SDP averages 93 per cent. Big southern states like Andhra Pradesh and Tamil Nadu also have a significant urban contribution to their SDP—58 per cent and 75 per cent respectively. Himachal Pradesh is the least urbanized state, with only 19 per cent of its SDP coming from urban areas. Considering India as a whole, urban areas contributed an estimated 65 per cent of total GDP in 2000-01. Other studies have also indicated a similar high level of contribution made by the urban areas to the national GDP. For example, Barclays in a report said that urban India’s contribution will be around 70 to 75 percent of its GDP by 2020.1 As per the Central Statistical Organization (CSO, 2007) the urban net state domestic product has been greater than its rural counterpart in absolute terms.2
Table 1: Percentage of GDP Originating from Urban Areas: All India (2000-01) Sector-wise Estimation
Agriculture Forestry, Fishing
Mining Manufacturing
Utilities Construction
Trade Trans-port
Finance Services GDP
Non-Agr. GDP
5.1 45.915 74.075 81.09 51.02 83.985 79.22 * 84.585 64.89 83.69
Note: In the percentage of GDP from activities like finance, real estate ownership, and business services, the figures are an overestimation. This is mainly because the same wage rate is assumed to prevail across different areas and activities. Source: Mitra and Mehta (2011)
Table 2: Percentage of State GDP originating from Urban Areas (2000-01)
State Primary Secondary Tertiary SDP
Non-Agricultural SDP
Delhi 25.52 95.15 97.4 95.90 96.88
Chandigarh 32.27 79.74 97.28 91.85 92.55
Maharashtra 10.59 92.17 * 84.98 *
Karnataka 06.36 89.54 * 82.08 *
Chhattisgarh 27.78 82.18 * 82.03 88.49
Pondicherry 18.82 80.54 92.83 81.38 86.04
Gujarat 12.89 89.12 87.98 79.61 84.37
Mizoram 28.13 85.46 92.36 78.34 91.21
Tamil Nadu 11.15 76.68 96.77 74.80 88.38
Madhya Pradesh
12.34 79.56 99.16 73.18 85.01
Meghalaya 01.7 53.84 94.33 71.92 74.56
1 Business Standard March 20, 2014. http://www.business-standard.com/article/news-cm/urban-population-to-contribute-70-75-of-india-s-gdp-by-2020-barclays-114032000273_1.html 2 http://mospi.nic.in/sites/default/files/reports_and_publication/cso_national_accounts/Chapter%2032.pdf

9
Goa 44.82 79.01 66.56 68.71 73.66
West Bengal
05.97 72.37 88.1 62.15 83.34
Jharkhand 41.67 51.5 73.47 60.56 73.27
Andhra Pradesh
08.42 61.35 89.88 57.95 79.20
Rajasthan 05.93 51.69 75.73 49.50 64.52
Uttarakhand 03.67 50.3 72.92 43.01 63.48
Uttar Pradesh
04.12 51.37 70.54 41.81 62.69
Manipur 13.12 33.91 61.56 41.14 53.51
Orissa 08.98 34.08 70.02 40.88 55.45
Punjab 03.47 56.68 70.77 40.46 65.20
Andaman and Nicobar Islands
03.79 37.07 63.95 39.65 55.07
Assam 10.95 47.22 60.23 38.68 57.52
Arunachal Pradesh
03.15 41.05 65.01 38.55 55.83
Nagaland 04.19 44.43 55.86 37.68 53.23
Haryana 05.21 43.72 52.68 34.68 48.94
Kerala 10.47 31.5 41.47 33.35 38.75
Jammu and Kashmir
05.29 37.59 48.17 32.84 45.45
Bihar 04.10 32.65 58.15 32.06 53.40
Sikkim 00.05 19.78 50.03 32.05 41.21
Tripura 02.67 28.69 46.98 31.72 41.16
Himachal Pradesh
01.40 25.27 24.58 19.65 24.60
India 08.73 69.93 83.64 64.89 83.69 Note: The tertiary sector value-added has been grossly overestimated in the urban areas in Maharashtra, Karnataka and Chhattisgarh because of the assumption that the same wage rate prevails across different areas and activities. Source: Mitra and Mehta (2011)
In the 2011 census, 475 urban agglomerations (UAs) with 981 outgrowths (OGs) were been identified as against 384 UAs with 962 OGs in the 2001 census (Table 3). In total, there are 7,935 towns in the country according to the 2011 census. In fact, the number of towns has increased by 2,774 since the last census. Many of these towns are part of UAs and the rest are independent towns. Around 264.9 million persons, constituting 70 per cent of the total urban population, live in the Class I UAs/towns. This proportion has increased considerably over the last census, while the growth has been nominal in the remaining classes of towns.3 Out of 468 UAs/towns belonging to the Class I category, 53 have a population of one million or above, while 18 new UAs/towns have been added
3Census of India 2011: Urban Agglomerations and Cities,
http://censusindia.gov.in/2011-prov-results/paper2/data_files/India2/1.%20Data%20Highlight.pdf

10
to this list since the last census. These are the major urban centers in the country constituting around 160.7 million persons (or 42.6 per cent of the total urban population). There are around two thousand five hundred census towns which have emerged between 2001 and 2011. These towns are not recognized by the government of India (i.e., they continue to be rural) but the population census office identified them as urban areas. Many of them are located in the periphery of large cities and conduct economic activities quite similar to those in the cities. All this suggests that the share of urban GDP in the total will increase further. The Barclay’s report as cited by one of the business dailies in India suggests that the share of urban areas in total GDP will rise to around 70-75 percent by 2020.4 As per the Mid-Term Appraisal of the Eleventh Five Year Plan the urban share of GDP was around 63 per cent in 2009-10 which is expected to increase to 75 percent by 2030.
Table 3: Type of Towns
Type of Towns/UAs/OGs 2011 census 2001 census Statutory Towns 4,041 3,799 Census Towns 3,894 1,362 Urban Agglomeration (UA)
475 384
Class 1 Cities/UA 461 394 Out Growths (OG) 981 962
Source: Census of India 2011: Urban Agglomerations and Cities 3. Empirical Analysis of Growth, Inequality, Poverty and Urbanization
3.1: State-Level Data
Following the economic reforms in India since 1991, growth has been accompanied by a reduction in poverty on a scale, which, on an average, is seen to be larger than the corresponding decline in the 1980s (Sundaram and Tendulkar, 2003). However, Sachs et al. (2002) observed that economic growth across states in the 1990s had a tendency of divergence rather than convergence, implying that states with a higher per capita income grew faster than the states with lower per capita income. Further, it has been noted that states with higher levels of urbanization have grown faster, meaning that external economies of scale or agglomeration economies originating from concentration of population and activities in the rich states with a strong base in infrastructure have resulted in productivity growth. Hence, the poor in these states, at least in the urban areas, might have benefited more than their counterparts in other states. Theoretically, if labor can move freely in large numbers, convergence of income across regions is likely to take place. However, the constraints posed by demand- and supply-side factors and the costs associated with mobility result in income differentials across regions. Below we present figures on urbanization, per capita net SDP in constant prices, rural poverty, urban poverty, rural inequality and urban inequality for the years 2004-05 and 2011-12 (or 2010-11). Here,
4 Business Standard, March 20, 2014 http://www.business-standard.com/article/news-cm/urban-population-to-contribute-70-75-of-india-s-gdp-by-2020-barclays-114032000273_1.html

11
poverty is defined in terms of consumption expenditure (not income because of the lack of data), and it is measured as the percentage of population below the national poverty line set by the Government of India. 5 Inequality is measured in terms of the Gini coefficient pertaining to consumption expenditure. Economic growth in India has been associated with rising inequality as suggested by several indirect indicators (Tables 1 and 2). Unfortunately, in the Indian context we do not have information on income distribution and, therefore, it is difficult to measure income inequality over time. However, the NSSO gives us data on consumption expenditure and the distribution of households based on expenditure size classes. From this, expenditure inequality has been estimated, though it is believed to be much less than income inequality. Since the upper-income households tend to save more and spend less, expenditure inequality is usually a gross underestimate. But, even then, there is evidence in favor of rising inequality over time across several states.
“According to the World Bank, between 1994 and 2005, the income share held by the highest 10 per cent of the population increased from 26 per cent to 28.3 per cent while that of the bottom 20 per cent decreased from 9.09 per cent to 8.64 per cent. According to the OECD, between 1993 and 2008, India's Gini coefficient increased from 0.32 to 0.38. As per the recently released Human Development Report (HDR) 2013, India ranked 136th (134th in 2011) in Human Development Index (HDI). Strikingly, when the HDI is adjusted for inequality, the index loses its value by as much as 29.3 per cent.” 6
India's reforms process resulted in opportunities that could be taken advantage of by a limited few or those who had access to resources. Inequality is being perpetuated by unequal access to health and education between the poor and the rich. As Kundu (2013) points out, inequality in access to education is so glaring that in HDR 2013, India's education index loses more than 40 per cent of its value once adjusted for inequality. In other words, education and health inequality are much sharper than expenditure inequality. Many states reported a rise in inequality over 2004-05 and 2011-12. At the all-India level, growth during this period was around 7 per cent per annum, but this growth has been associated with a rise in inequality both in the rural and urban areas. India's Gini coefficient has gone from 0.26 to 0.28 and from 0.35 to 0.37 in the rural and urban areas respectively (Table 4). There is evidence of growing concentration of wealth among the elite. The consumption of the top 20 per cent of households grew at almost 3 per cent per year in the 2000s as compared with 2 per cent in the 1990s, while the growth in consumption of the bottom 20 per cent of households remained unchanged at 1 per cent per year as per the consumption expenditure surveys of the NSSO.7
In fact, at the state level, we get to see a very mixed picture. Many states registered a rapid growth and witnessed a decline in inequality in either rural or urban areas. On the other hand, there are states that experienced a rise in inequality over time with rapid growth.
5 Tendulkar Committee, Planning Commission, Government of India 6 K. K. Kundu (2013) “India has a problem with inequality, and it won't be solved easily”, May 25, Business Standard
http://www.business-standard.com/article/opinion/india-has-a-problem-with-inequality-and-it-won-t-be-solved-easily-113052500705_1.html 7 Times of India, December 7, 2011

12
Consumption poverty declined over 2004-05 to 2011-12 in a number of states and at the all-India level as well, in both rural and urban areas. The urbanization level, on the other hand, increased at varying levels across states. For example, in Andhra Pradesh, it went up from 32.6 to 37.7 percent, whereas Odisha, one of the low-income states, witnessed a nominal increase from 15 to 16.7 per cent over 2001-2011. Table 4: Growth, Inequality, Poverty and Urbanization
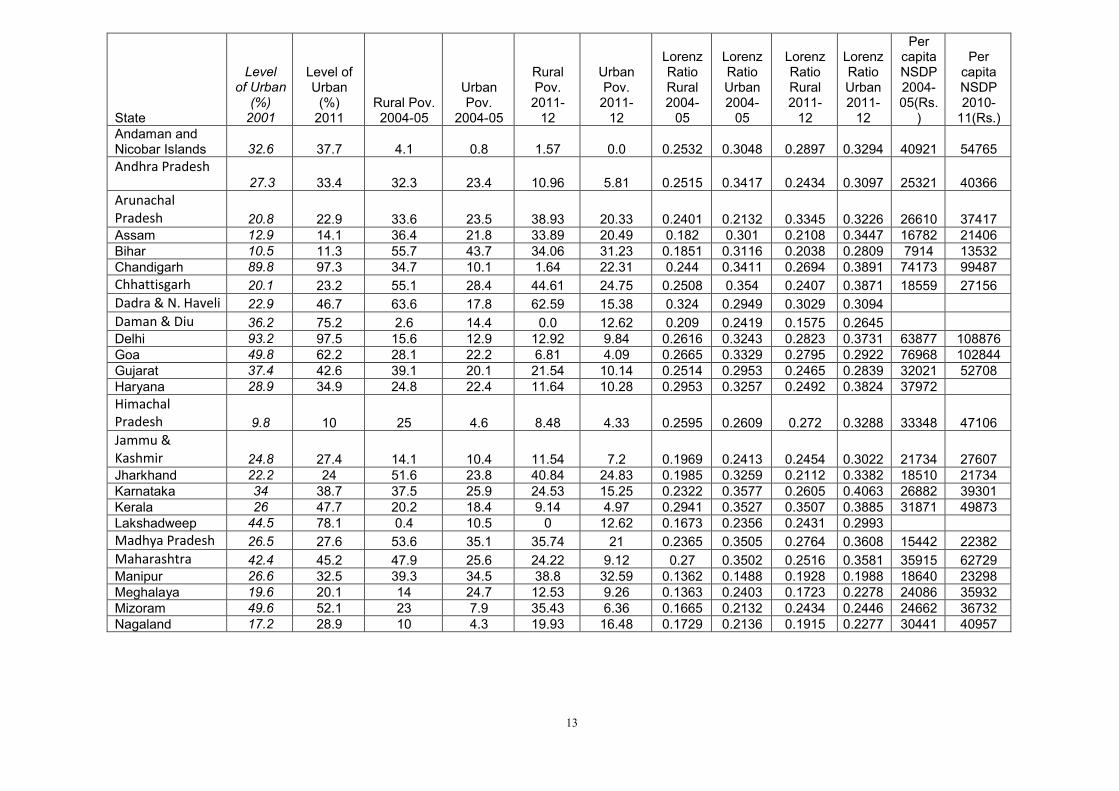
13
State
Level of Urban
(%) 2001
Level of Urban
(%) 2011
Rural Pov. 2004-05
Urban Pov.
2004-05
Rural Pov. 2011-
12
Urban Pov. 2011-
12
Lorenz Ratio Rural 2004-
05
Lorenz Ratio Urban 2004-
05
Lorenz Ratio Rural 2011-
12
Lorenz Ratio Urban 2011-
12
Per capita NSDP 2004- 05(Rs.
)
Per capita NSDP 2010-
11(Rs.) Andaman and Nicobar Islands 32.6 37.7 4.1 0.8 1.57 0.0 0.2532 0.3048 0.2897 0.3294 40921 54765
Andhra Pradesh 27.3 33.4 32.3 23.4 10.96 5.81 0.2515 0.3417 0.2434 0.3097 25321 40366
Arunachal Pradesh 20.8 22.9 33.6 23.5 38.93 20.33 0.2401 0.2132 0.3345 0.3226 26610 37417 Assam 12.9 14.1 36.4 21.8 33.89 20.49 0.182 0.301 0.2108 0.3447 16782 21406 Bihar 10.5 11.3 55.7 43.7 34.06 31.23 0.1851 0.3116 0.2038 0.2809 7914 13532 Chandigarh 89.8 97.3 34.7 10.1 1.64 22.31 0.244 0.3411 0.2694 0.3891 74173 99487
Chhattisgarh 20.1 23.2 55.1 28.4 44.61 24.75 0.2508 0.354 0.2407 0.3871 18559 27156
Dadra & N. Haveli 22.9 46.7 63.6 17.8 62.59 15.38 0.324 0.2949 0.3029 0.3094
Daman & Diu 36.2 75.2 2.6 14.4 0.0 12.62 0.209 0.2419 0.1575 0.2645 Delhi 93.2 97.5 15.6 12.9 12.92 9.84 0.2616 0.3243 0.2823 0.3731 63877 108876 Goa 49.8 62.2 28.1 22.2 6.81 4.09 0.2665 0.3329 0.2795 0.2922 76968 102844 Gujarat 37.4 42.6 39.1 20.1 21.54 10.14 0.2514 0.2953 0.2465 0.2839 32021 52708 Haryana 28.9 34.9 24.8 22.4 11.64 10.28 0.2953 0.3257 0.2492 0.3824 37972
Himachal Pradesh 9.8 10 25 4.6 8.48 4.33 0.2595 0.2609 0.272 0.3288 33348 47106
Jammu & Kashmir 24.8 27.4 14.1 10.4 11.54 7.2 0.1969 0.2413 0.2454 0.3022 21734 27607 Jharkhand 22.2 24 51.6 23.8 40.84 24.83 0.1985 0.3259 0.2112 0.3382 18510 21734 Karnataka 34 38.7 37.5 25.9 24.53 15.25 0.2322 0.3577 0.2605 0.4063 26882 39301 Kerala 26 47.7 20.2 18.4 9.14 4.97 0.2941 0.3527 0.3507 0.3885 31871 49873 Lakshadweep 44.5 78.1 0.4 10.5 0 12.62 0.1673 0.2356 0.2431 0.2993
Madhya Pradesh 26.5 27.6 53.6 35.1 35.74 21 0.2365 0.3505 0.2764 0.3608 15442 22382
Maharashtra 42.4 45.2 47.9 25.6 24.22 9.12 0.27 0.3502 0.2516 0.3581 35915 62729 Manipur 26.6 32.5 39.3 34.5 38.8 32.59 0.1362 0.1488 0.1928 0.1988 18640 23298 Meghalaya 19.6 20.1 14 24.7 12.53 9.26 0.1363 0.2403 0.1723 0.2278 24086 35932 Mizoram 49.6 52.1 23 7.9 35.43 6.36 0.1665 0.2132 0.2434 0.2446 24662 36732 Nagaland 17.2 28.9 10 4.3 19.93 16.48 0.1729 0.2136 0.1915 0.2277 30441 40957

14
Note: Poverty estimates are based on the national poverty line (Tendulkar Methodology).
Source: Data Book, Planning Commission, and official estimates released by Government of India
The plot of growth index, i.e., per capita net SDP against urbanization shows a positive relationship (Graphs 1 and 2).
Orissa 15 16.7 60.8 37.6 35.69 17.29 0.2535 0.3297 0.2341 0.3452 17650 25708 Puducherry 66.6 68.3 22.9 9.9 17.06 6.30 0.2813 0.3019 0.2509 0.2684 48302 79333 Punjab 33.9 37.5 22.1 18.7 7.66 9.24 0.2626 0.3233 0.2691 0.3131 33103 44752 Rajasthan 23.4 24.9 35.8 29.7 16.05 10.69 0.2041 0.3033 0.2275 0.3065 18565 26436 Sikkim 11.1 25.2 31.8 25.9 9.85 3.66 0.2358 0.2317 0.1927 0.198 26693 47655 Tamil Nadu 44 48.4 37.5 19.7 15.83 6.54 0.2584 0.3445 0.2751 0.3297 30062 51928 Tripura 17.1 26.2 44.5 22.5 16.53 7.42 0.2034 0.2996 0.2074 0.292 24394 37216
Uttar Pradesh 20.8 22.3 42.7 34.1 11.62 10.48 0.2337 0.3391 0.2478 0.4052 12950 17349
Uttarakhand 25.7 30.2 35.1 26.2 30.4 26.06 0.2226 0.3017 0.2559 0.3413 24726 44723 West Bengal 28 31 38.2 24.4 22.52 14.66 0.2411 0.3564 0.2351 0.3816 22649 32228 India 27.8 31.2 42 25.5 25.7 13.7 0.2655 0.3475 0.2803 0.3673 24143 35993

15
Graph 1: Urbanization (2001) and Per capita Net SDP (pcnetsdp45: 2004-05)
02
00
00
40
00
06
00
00
80
00
0
0 20 40 60 80 100urb2001
pcnetsdp45 Fitted values
Source: Population census and CSO

16
Graph 2: Urbanization (2011) and Per capita Net SDP (pcnetsdp101: 2010-11)
20
00
04
00
00
60
00
08
00
00
10
00
00
0 20 40 60 80 100urb2011
pcnetsdp101 Fitted values
Source: Population census and CSO

17
Rural and urban poverty tend to vary inversely with urbanization in terms of the fitted line, though the observed points are scattered all around, and they deviate sizably from the fitted line (Graphs 3 and 4). Further, the fitted line for urban poverty is flatter than its rural counterpart in 2011-12, suggesting a greater decline in rural poverty than urban poverty with respect to urbanization. Graph 3: Rural (rpov45) and Urban (upov45) Poverty in 2004-05 and Urbanization in 2001 (urb2001)
02
04
06
0
0 20 40 60 80 100urb2001
rpov45 upov45
Fitted values Fitted values

18
Source: Population census and NSSO Graph 4: Rural (rpov1112) and Urban (upov1112) Poverty in (2011-12) and Urbanization in 2011(urb2011)
02
04
06
0
0 20 40 60 80 100urb2011
rpov1112 upov1112
Fitted values Fitted values
Source: Population census and NSSO

19
The relationship between inequality and urbanization is positive but weak (Graphs 5 and 6). The quadratic fit (an inverted u-shape curve fitted to the data) does not become distinct either in the rural or in the urban areas for the year 2004-05. However, for 2011-12, while rural poverty shows such an inverted u-shaped relationship remotely, urban poverty tends to follow a u-shaped relationship with respect to urbanization. Graph 5: Rural (rlr45) and Urban (ulr45) Inequality in 2004-05 and Urbanization in 2001 (urb2001)

20
.15
.2.2
5.3
.35
0 20 40 60 80 100urb2001
rlr045 ulr045
Fitted values Fitted values
Source: Population census and NSSO Graph 6: Rural (rlr1112) and Urban (ulr1112) Inequality in 2011-12 and Urbanization in 2011 (urb2011)

21
.15
.2.2
5.3
.35
.4
0 20 40 60 80 100urb2011
rlr1112 ulr1112
Fitted values Fitted values

22
.15
.2.2
5.3
.35
.4
0 20 40 60 80 100urb2011
rlr1112 ulr1112
Fitted values Fitted values
Source: Population census and NSSO Based on the cross-sectional figures, the correlation between growth and inequality seems to be positive and significant in the rural context, while it is insignificant in the urban areas. Possibly because rural areas are at lower levels of growth, inequality tends to rise conforming to Kuznet’s (1966) observation. On the whole, the cross-sectional picture suggests that with economic growth, inequality tends to rise only in the rural areas, while in the urban areas, which show a higher level of growth than the rural areas, inequality does not necessarily rise (Table 5 to 7). However, this is only based on cross-sectional data; over time, at the all-India level, growth and inequality both seemed to have moved together. Again, from the cross-sectional data, economic growth is seen to reduce poverty, though the role of other factors is also important. Inequality and poverty are mostly unrelated, though only for 2011-12, there is a negative relationship in the

23
rural context that goes against the stylized facts. In the equation for poverty being a function of both growth and inequality, inequality again shows no effect except in the urban context for 2004-05 where it takes a positive coefficient as one would expect, i.e., with increase in inequality, poverty tends to rise. Cross-sectional data pertaining to 2004-05 suggests that rural and urban poverty are both strongly correlated (r=0.78). Both agricultural and non-agricultural income per capita are moderately and negatively associated with rural poverty (r is -0.40 and -0.36 respectively). Urban poverty and urban inequality show a positive correlation (r=0.20). In terms of growth, non-agricultural income per capita shows a relatively stronger effect (r = -0.47) on urban poverty than agricultural income per capita (r = -0.26), though both have a beneficial effect. The urbanization level in 2001 is seen to be negatively correlated with both rural and urban poverty (2004-05) (r is -0.26 and -0.40 respectively), though rural and urban inequality reveal a positive association with the level of urbanization (r is 0.32 and 0.23 respectively). The most interesting point is that urbanization is strongly and positively related to non-agricultural income per capita (r = 0.85), while it tends to decline with respect to agricultural income per capita (r=-0.47), implying that with agricultural growth, the pace of migration due to rural impoverishment falls, which reduces the urbanization level.
Table 5: Correlation Matrix: Poverty, Inequality and Agricultural and Non-Agricultural Income Per Capita and Urbanization (2001)
RPOV2004-
05 UPOV2004-05
Rural Inequality 04-05
Urban Inequality 04-05
Non-Agr. NSDP per capita2004-05
Agr. and Allied NSDP per capita2004-05
UPOV2004-05
0.78
Rural Inequality 04-05
-0.003 -0.15
Urban Inequality 04-05
0.36 0.20 0.64
Non-Agr. -0.36 -0.47 0.44 0.21

24
NSDP per capita2004-05 Agr. and Allied NSDP per capita2004-05
-0.40 -0.26 0.04 -0.35 -0.28
Urbanization 2001
-0.26 -0.40 0.32 0.23 0.85 -0.47
Note: The correlation between total net SDP per capita and urbanization is estimated at 0.79, that between total net SDP per capita and rural poverty is -0.0.43 and that between total net SDP per capita and urban poverty is -0.53. Source: Author’s calculations Pertaining to 2011-12, the strong and positive correlation between rural and urban poverty is again very much evident (r = 0.75). Interestingly, neither rural nor urban poverty show any significant association with agricultural growth (0.03 and -0.06 respectively), while non-agricultural income per capita shows a beneficial effect on both rural and urban poverty (r is -0.58 and -0.56 respectively). Urbanization in 2011 is negatively correlated with both rural and urban poverty (2011-12) (r is -0.44 and -0.23 respectively) and non-agricultural growth enhances urbanization (r=0.90), while agricultural income per capita reduces it.
Table 6: Correlation Matrix: Poverty, Inequality and Agricultural and Non-Agricultural Income Per Capita and Urbanization (2011)
RPOV2011-
12 UPOV2011-12
Rural Inequality 11-12
Urban Inequality 11-12
Non-Agr. NSDP per capita2010-11
Agr. and Allied NSDP per capita2010-11
UPOV2011-12
0.75
Rural Inequality
-0.22 -0.27

25
11-12 Urban Inequality 11-12
0.03 -0.09 0.56
Non-Agr. NSDP per capita2010-11
-0.58 -0.56 0.43 0.13
Agr. and Allied NSDP per capita2010-11
0.03 -0.07 0.07 -0.35 -0.38
Urbanization 2011
-0.44 -0.23 0.38 0.17 0.90 -0.43
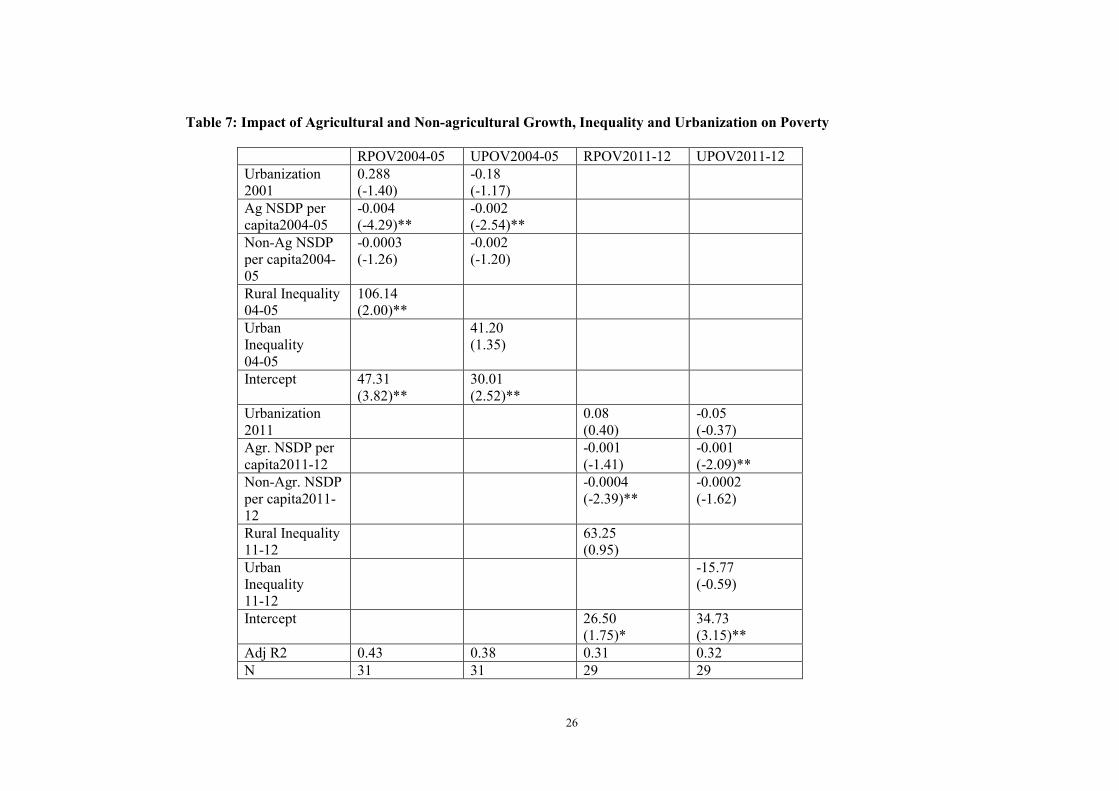
Note: The correlation between total net SDP per capita and urbanization is estimated at 0.88, that between total net SDP per capita and rural poverty is -0.59 and that between total net SDP per capita and urban poverty is -0.40. Source: Author’s calculations. However, some of these findings related to the impact of sectoral growth on poverty tend to change drastically as we regress rural and urban poverty on urbanization, agricultural income per capita, non-agricultural income per capita and inequality index in a multiple regression model. For 2004-05, agricultural income per capita (and not non-agricultural income per capita) is seen to reduce poverty significantly in both the rural and urban areas (see Table 7). Even in 2011-12, urban poverty fell in response to agricultural income per capita, while the non-agricultural income per capita was not significant even at the 10 per cent level. However, in the rural poverty function for 2011-12, non-agricultural income per capita turned out to be highly significant, while agricultural income per capita remained insignificant. These major deviations from what we observed in terms of correlation between pairs of variables may be attributed to the problem of multicollinearity, particularly if we keep in view the fact that other variables included in the model are mostly insignificant.
26
Table 7: Impact of Agricultural and Non-agricultural Growth, Inequality and Urbanization on Poverty
RPOV2004-05 UPOV2004-05 RPOV2011-12 UPOV2011-12 Urbanization 2001
0.288 (-1.40)
-0.18 (-1.17)
Ag NSDP per capita2004-05
-0.004 (-4.29)**
-0.002 (-2.54)**
Non-Ag NSDP per capita2004-05
-0.0003 (-1.26)
-0.002 (-1.20)
Rural Inequality 04-05
106.14 (2.00)**
Urban Inequality 04-05
41.20 (1.35)
Intercept 47.31 (3.82)**
30.01 (2.52)**
Urbanization 2011
0.08 (0.40)
-0.05 (-0.37)
Agr. NSDP per capita2011-12
-0.001 (-1.41)
-0.001 (-2.09)**
Non-Agr. NSDP per capita2011-12
-0.0004 (-2.39)**
-0.0002 (-1.62)
Rural Inequality 11-12
63.25 (0.95)
Urban Inequality 11-12
-15.77 (-0.59)
Intercept 26.50 (1.75)*
34.73 (3.15)**
Adj R2 0.43 0.38 0.31 0.32 N 31 31 29 29

27
Source: Author’s calculations Pertaining to overall growth (net SDP per capita), inequality, poverty and urbanization, we observe the following patterns based on the results from Tables 8 to 14: Urbanization and per capita income are strongly correlated—urbanization turns out to be a significant determinant of growth for both 2004-05 and 2010-11. However, the growth rate in per capita income across states is not significantly related to the changes in the level of urbanization over time. Further, urbanization does not significantly impact inequality. In fact, the correlation between urbanization and urban inequality in 2004-05 and 2011-12 is only 0.22 and 0.17 respectively. However, as mentioned earlier, here inequality is measured merely in terms of consumption expenditure, which is a gross underestimate of income inequality. The fact that both rural and urban poverty are positively related may imply a similarity in the poverty situation in both the rural and urban areas across states. However, it may also reflect the importance of migration of the rural poor to the urban areas in search of livelihoods. The growth index (per capita income) reduces poverty. However, the explanatory power of these equations is extremely low, suggesting that the role of other factors is also important. In fact, factors like infrastructure development, skill formation, asset creation, and health status of the population are some of the most important determinants of poverty (Mitra, 2013). Growth index (per capita income) raises inequality only in the rural context, while its impact is insignificant in the urban areas. Inequality and poverty are mostly unrelated in terms of statistical significance, though only for 2011-12, there is a negative and significant relationship in the rural context. In the equation for poverty taken to be a function of both growth and inequality, inequality again shows no effect except in the urban context for 2004-05, where it takes a positive coefficient. Urbanization does not show any significant impact on rural poverty, though it tends to reduce poverty in the urban areas. However, the R2 is nominal, indicating the impact of many other factors. After controlling for growth and inequality,

28
the effect of urbanization is absolutely insignificant. These estimates are not robust in the sense the explanatory power of the equations is moderate. Quite clearly, there are several other relevant variables that influence poverty. We may further note from Table 10 that growth positively influences urbanization, while expansion in non-agricultural employment tends to reduce it. Though the latter comes as a major surprise, this needs to be interpreted carefully. Given the economic growth, expansion in non-agricultural employment could be of the residual type, which does not provide productive sources of livelihood and, thus, tends to reduce the pace of urbanization. In fact, in the Indian context, employment challenges are severe: a large majority of the workforce, even in the non-agricultural activities, is engaged in the informal sector. Further, urbanization often has been accompanied by expansion in the informal sector as the vast supplies of labor relative to demand pick up petty activities in the informal sector for survival. Migration is also not found to be a significant determinant of urbanization.8 As the natural growth of population dominates the migration flows in the urban areas, the urbanization level is not significantly influenced by migration. On the other hand, urbanization and expansion in non-agricultural activities both contribute to economic growth (Table 11). Rise in demographic pressure, such as urban household size, reduces growth. Economic growth, on the other hand, does not seem to be resulting in a higher work participation rate in the urban areas—the phenomenon that has been widely cited in the Indian context. Even urbanization is not seen to have resulted in an enhanced work participation rate.
Table 8: Impact of Urbanization on Poverty and Inequality
8 As per the definition of migration used by NSSO (2007-08), which aims at capturing the long-duration migrants, a household member is defined to be a migrant whose last usual place of residence (UPR), anytime in the past, was different from the present place of enumeration.
Independent. Var. Dependent Variable RPOV2004-05
UPOV2004-05
RPOV2011-12
UPOV2011-12
Rural Inequality 04-05
Urban Inequality 04-05
Rural Inequality 11-12
Urban Inequality 11-12
Urbanization 2001 -0.242 (-1.73)*
-0.21 (-2.54)**
0.001 (1.32)
0.001 (1.08)
Urbanization 2011 -0.29 (-2.70)**
-0.10 (-1.73)*
0.0004 (1.27)
0.0002 (0.44)
Constant 40.09 27.57 31.57 16.76 0.21 0.28 0.23 0.31

29
Note: ** and * denote significance at 5 and 10 per cent levels respectively. Source: Author’s calculations
Table 9: Effect of Urbanization and Growth on Inequality
Note: ** and * denote significance at 5 and 10 per cent levels respectively. PCNETSDP: per capita net state domestic product. Source: Author’s calculations.
Table 10: Determinants of Urbanization and Urban Work Participation Rate
(7.72)** (9.16)** (6.56)** (5.89)** (15.01)** (16.36)** (16.25)** (15.78)**
Adj.R2 0.05 0.14 0.16 0.04 0.02 0.005 0.02 -0.02 No. of Obs. 35 35 35 35 35 35 35 35
Indep. Var.
Dep. Var. Rural Inequality 04-05
Urban Inequality 04-05
Rural Inequality 11-12
Urban Inequality 11-12
Urbanization 2001
-0.0002 (-0.04)
0.0006 (0.82)
Urbanization 2011
0.0003 (0.43)
0.001 (1.08)
PCNETSDP04-05
1.42e-06 (2.04)**
-7.34e-08 (-0.07)
PCNETSDP10-11
4.29e-07 (0.73)
-6.63E-07 (-0.73)
Constant 0.195 (13.54)**
0.28 (13.93)**
0.22 (15.22)**
0.31 (13.80)**
Adj.R2 0.16 -0.01 0.10 -0.02 No. of Obs.
32 32 31 31

30
Indep Var Dep Var
URBN 2001
URBN 2011 URBN 2011 UWFPRM2011
GR05-06 2.06 (3.30)** GR10-11 -0.43 (-0.51) PCNETSDP10-11
0.0009 (11.18)**
-0.0000 (-0.19)
MIG -0.011 (-0.91)
0.005 (1.22)
UOTHERACTM -1.03 (-2.98)**
0.29 (2.05)**
URBN 2011 0.05 (0.67)
ULITM 0.48 (2.84)**
USCM 0.17 (1.74)*
Constant 12.52 (1.92)* 40.62 (4.42)** 93. 19 (3.18)**
-21.43 (-1.25)
Adj.R2 0.24 -0.02 0.82 0.54 No. of Obs. 32 32 31 31
Note: HHSZ: household size; UWFPRM: main workforce participation rate in the urban areas among males; ULITM: literacy among urban males; USCM: percentage of male scheduled caste population in the urban areas; UOTHERACTM: percentage of urban male workers engaged in non-household manufacturing and services; URBN: percentage of population in the urban areas; MIG: migration rate in the urban areas; PCNETSDP: per capita net state domestic product, GR: annual growth rate in state domestic product. ** and * denote significance at 5 and 10 per cent levels respectively. Source: Author’s calculations

31
Table 11: Impact of Growth on Inequality
Note: PCNETSDP: per capita net state domestic product ** and * denote significance at 5 and 10 per cent levels respectively Source: Author’s calculations
Table 12: Impact of Growth on Poverty
Indep. Var. Dep. Var. Rural Inequality 04-05
Urban Inequality 04-05
Rural Inequality 11-12
Urban Inequality 11-12
PCNETSDP04-05 0.000001 (2.82)**
0.0000006 (0.95)
PCNETSDP10-11 0.0000006 (2.33)**
0.0000002 (0.46)
Constant 0.195 (13.72)**
0.218 (14.09)**
0.218 (15.59)**
0.31 (13.97)**
Adj R 2 0.18 0.13 0.13 -.0.03 No. of Obs. 32 32 31 31
Indep. Var. Dep Var RPOV04-05
UPOV04-05
RPOV11-12
UPOV11-12
RPOV04-05
UPOV04-05
RPOV11-12
UPOV11-12
Change in RPOV
Change in UPOV
GR05-06 -0.35 (-0.69)
-0.47 (-1.32)
GR10-11 0.81 (1.68)
0.74 (2.36)**
PCNETSDP04-05
-0.0004 (-2.61)**
-0.0003 (-3.39)**
PCNETSDP10-11
-0.0003 (-3.90)**
-0.0001 (-2.32)**
Gr in PCNETSDP (04-05 to 10-11)
-1.69 (-1.44)
-1,48 (-1.88)*
Constant 36.57 25.96 12.56 5.18 44.69 31.60 34.45 19.52 -1.75 0.62

32
Note: PCNETSDP: per capita net state domestic product, GR: annual growth rate in state domestic product ** and * denote significance at 5 and 10 per cent levels respectively Source: Author’s calculations
Table 13: Determinants of Growth
Indep. Var. Dep. Var.
PCNETSDP04-05
PCNETSDP10-11
PCNETSDP10-11
URBN 2001 632.70 (7.15)**
URBN2011 1001.42 (9.80)**
901.09 (10.77)**
ULIT -13.50 (-0.03)
UHHSZ -12322.36 (-1.60)
RHHSZ 6520.48 (1.07)
UOTHERACT 1033.07 (3.60)**
Constant 10132.32 (3.07)**
7898.01 (1.84)*
-54374.18 (-0.91)
Adj. R2 0.62 0.76 0.87 No. of Obs. 32 31 31
Note: PCNETSDP: per capita net state domestic product; UHHSZ: household size in the urban areas; RHHSZ: household size in the rural areas; ULIT: literacy rate; UOTHERACT: percentage of urban workers engaged in non-household manufacturing and services; URBN: percentage of population in the urban areas ** and * denote significance at 5 and 10 per cent levels respectively Source: Author’s calculations
(6.90)** (6.99)** (2.37)** (1.50) (9.09)** (9.53)** (8.45)** (6.31)** (-0.22) (0.12) Adj R 2 -0.02 0.02 0.06 0.13 0.16 0.25 0.32 0.0.13 0.03 0.08 No. of Obs 32 32 32 32 32 32 31 31 31 31

33
Table 14: Impact of Growth, Inequality and Urbanization on Poverty
Note: URBN is the percentage of urban population. ** and * denote significance at 5 and 10 per cent levels respectively. Source: Author’s calculations
Indep. Var. Dep. Var. RPOV04-05
UPOV04-05
RPOV11-12
UPOV11-12
RPOV04-05
UPOV04-05
RPOV11-12
UPOV11-12
PCNETSDP04-05
-0.0005 (-2.96)**
-0.0004 (-3.85)**
-0.0006 (-2.60)**
-0.0004 (-2.27)**
PCNETSDP10-11
-0.0003 (-3.71)**
-0.0002 (-3.81)**
-0.0004 (-2.62)**
-0.0003 (-2.17)**
Rural Inequality 04-05
83.43 (1.34)
88.19 (1.41)
Urban Inequality 04-05
19.50 (0.37)
57.71 (1.96)**
Rural Inequality 11-12
57.35 (2.01)*
15.95 (0.30)
Urban Inequality11-12
5.78 (0.25)
3.72 (0.16)
URBN2001 0.17 (0.93)
-0.0103 (-0.08)
URBN2011 0.16 (0.82)
0.06 (0.43)
Constant 28.42 (2.17)**
15.31 (1.76)*
30.30 (2.49)***
20.12 (2.63)**
27.21 (2.06)**
15.22 (1.70)*
30.71 (2.50)**
20.62 (2.62)**
Adj. R2 0.18 0.32 0.31 0.29 0.18 0.30 0.30 0.27 No. of Obs. 32 32 31 31 32 32 31 31

34
Urban–Rural Inequality The differences in the rural–urban consumption disparity are enormous and these differences do not seem to be declining over time (Table 15). The urban areas reported almost double the MPCE figure as compared with the rural areas. The urban–rural differences in the average per capita consumption expenditure are taken to be a function of non-agricultural income per capita, agricultural income per capita and also the urbanization level. However, the results pertaining to 2004-05 or 2011-12 do not turn out to be statistically significant. In other words, the rural–urban inequality could not be explained by the sector-specific growth index or the urbanization level. Table 15: Proportion of Urban (U) to Rural (R) Average Monthly Per Capita Consumption Expenditure
States & UTs U/R MPCE04-
05
U/R MPCE11-
12 Andhra Pradesh 1.739 1.531
Arunachal Pradesh
1.142 1.489
Assam 1.948 1.796
Bihar 1.669 1.337
Chhattisgarh 2.329 1.819
Delhi 1.436 1.194
Goa 1.453 1.267
Gujarat 1.871 1.680
Haryana 1.324 1.754
Himachal Pradesh 1.742 1.602
Jammu & Kashmir
1.349 1.426
Jharkhand 2.317 2.006

35
Karnataka 2.032 1.939
Kerala 1.274 1.277
Madhya Pradesh 2.058 1.786
Maharashtra 2.022 1.970
Manipur 1.183 0.987
Meghalaya 1.816 1.652
Mizoram 1.542 1.562
Nagaland 1.482 1.109
Orissa 1.899 1.935
Punjab 1.566 1.191
Rajasthan 1.632 1.528
Sikkim 1.607 1.666
Tamil Nadu 1.793 1.549
Tripura 2.052 1.607
Uttar Pradesh 1.609 1.774
Uttarakhand 1.512 1.355
West Bengal 1.999 2.007
A & N Islands 1.686 1.712
Chandigarh 2.051 1.275
Dadra & Nagar Haveli
2.470 2.378
Daman & Diu 0.930 0.980
Lakshadweep 1.083 1.124
Pondicherry 1.391 1.480
All India 1.883 1.839
Source: Based on National Sample Data
Bhanumurthy and Mitra (2010) made an attempt to assess the impact of economic reforms on poverty in terms of a decomposition analysis by splitting the percentage change in the incidence of poverty between two time points via

36
growth/mean effect, inequality effect and the population shift effect. This has been pursued for two time periods: one from 1983 to 1993-94 and another from 1993-94 to 1999-00, described as pre-reforms and reforms period respectively. While the growth/mean effect was seen to be dominant and had resulted in a decline in the incidence of poverty in both the periods and in most of the states, inequality, which, in general, rose in the process of growth, raised the poverty ratio at the all-India level. However, in the rural areas of a large number of states, the inequality effect turned out to be beneficial in the second period. Even in the urban areas of several states and at the all-India level too, the adverse inequality effect fell considerably in the second period compared with the first. The population shift effect, which measures the net effect of a rise (and fall) in the percentage of the population residing in the urban (and the rural) areas on the incidence of poverty, appeared to be beneficial in several major states and at the all-India level too, in both the periods. In other words, the overall incidence of poverty in these states fell because of rural–urban migration, though it might have raised the urban poverty (Table 16).
Economic reforms have been pursued at different levels across states, and this seems to have enhanced the inter-state variations in economic growth. Other than the role of agriculture in a few states like West Bengal, the rapid growth of new components of the tertiary sector, such as information technology, business process outsourcing services, financial institutions, and infrastructure services, has impacted upon economic growth at varied levels across states. Besides, economic growth is also dependent on industrial productivity, which, in turn, is a function of agglomeration economies. Economic reforms seem to have generated an effect on factors that broadly fall into this class of agglomeration economies, and hence, economic growth across states has shown divergence instead of convergence. But, interestingly, the beneficial growth/mean effect on poverty increased in magnitude in most of the states in the reforms period relative to the pre-reforms period and, more importantly, its variation across states dropped considerably. This is possibly because of good governance in the rapidly growing and reforming states, and the demonstration effect of this in the slowly growing states. The deleterious effect of inequality on poverty also shows a declining tendency in several states in the reforms phase compared with its previous period. The population shift effect, which showed a tendency of raising urban poverty, also fell in magnitude in the second period compared with the first, across states. And states with greater beneficial growth effects in the second period relative to the first also showed lower adverse population shift effects in the urban areas, that is, a relatively less rise in the incidence of urban poverty caused by the population shift effect (perceived in terms of rural–urban migration). This can be interpreted as the beneficial effects of urbanization, which helped migrants access better employment opportunities in the urban areas and, thus, contributed to reduction in poverty. The fact that the extent of rise in urban

37
poverty due to migration was less in regions that experienced higher beneficial effects of growth on poverty suggests that growth and urbanization moved hand in hand, contributing to poverty reduction. Table 16: Change in Poverty Due to Population Shift or Migration Change in in Rural
Poverty (percentage po point) (1983- 1993-94
Change in in Urban Poverty (percentage po point) 1983- 1993-94)
Change in Rural Poverty (percentage point) (1993-94- 1999-2000)
Change in in Urban Poverty (percentage po point) (1993-94- 1999-2000)
Andhra Pradesh
-2.17 3.81 -0.06 0.16
Assam -1.48 0.5 -1.0 0.18 Bihar -0.59 0.39 -0.12 0.08 Gujarat -2.72 3.5 -1.23 1.51 Haryana -7.21 6.01 -0.16 0.11 Karnataka -2.06 2.58 -1.29 1.78 Kerala -4.97 5.38 0.18 -0.22 Madhya Pradesh
-2.50 2.83 -0.96 1.07
Maharashtra -3.69 3.35 -1.83 1.84 Orissa -1.49 1.16 -0.95 0.82 Punjab -1.99 2.78 -2.01 1.88 Rajasthan -1.40 1.6 -0.22 0.27 Tamil Nadu -2.74 2.75 -4.37 5.1 Uttar Pradesh
-1.71 1.65 -0.71 0.55
West Bengal -0.9
0.47 -0.33 0.17
All India -2.59
2.28 -1.65 1.43

38
Source: Bhanumurthy and Mitra (2010) The Urban Poverty Report 2009 by the Government of India (2009) also noted that across the Indian states, poverty is negatively correlated with the level of urbanization, and large and medium cities have a lower incidence of poverty than small cities in India, though large centers have higher levels in inequality. A World Bank study (World Bank, 2010) also found more widespread poverty in very small towns than in large cities. Gangopadhyay et al. (2010) applied the small area estimation methodology in three states of India in 2004-05 and confirmed that in the states of West Bengal, Orissa and Andhra Pradesh, the poverty level in large cities was much lower than that in small towns. Tripathy (2013) observed that higher levels of economic growth in cities and large city agglomeration are associated with reduction in city poverty and increase in inequality between cities (see Graphs 7 and 8). However, as per the Urban Poverty Report 2009 by the Government of India (2009) about 80 million people were estimated as poor in the cities and towns of India in 2007-08, and urban poverty in some of the larger states is higher than rural poverty, a phenomenon generally known as ‘urbanization of poverty’ and attributed to rural–urban migration (Tripathy, 2013). Such rural–urban differences are perceived despite a negative association between urbanization and urban poverty across states as mentioned earlier. The differences in the findings can be attributed to the fact that the Urban Poverty Report 2009 (2009) refers to all urban areas, while Tripathy (2013) analyses the poverty situation in cities only. Since small towns have a higher incidence of poverty than large cities, the overall urban poverty can turn out to be on the high side.

39
Graph 7: Inequality and City Size
Agra
Aligarh
Allahabad
Amritsar
Asansol
Aurangabad
Bangalore
Bareilly
Bhiwandi
Bhopal
Bhubaneswar
ChandigarhChennai (Madras)
Coimbatore
Delhi
Dhanbad
Durg-Bhilainagar
Guwahati (Gauhati)
Gwalior
Hubli-Dharwad
Hyderabad
Indore
Jabalpur
Jaipur
Jalandhar
JamshedpurJodhpur
KanpurKochi (Cochin) Kolkata (Calcutta)
KotaKozhikode (Calicut)
Lucknow
Ludhiana
MaduraiMeerut
Moradabad
Mumbai (Bombay)
Mysore
Nagpur
NashikPatna
Pune (Poona)
Raipur
Ranchi
Salem
Solapur
Thiruvananthapuram
TiruchirappalliVaranasi (Benares)Vijayawada
Visakhapatnam
.2.3
.4.5
Gin
i
6 7 8 9 10log of Population
Relationship between the Gini Coefficient and Log of City Population, 2005
Source: Tripathy (2013)

40
Graph 8: Poverty and City Size
AgraAligarh
Allahabad
Amritsar
Asansol
Aurangabad
Bangalore
Bareilly
Bhiwandi
Bhopal
Bhubaneswar
ChandigarhChennai (Madras)
Coimbatore
Delhi
Dhanbad
Durg-Bhilainagar
Guwahati (Gauhati)
Gwalior
Hubli-Dharwad
HyderabadIndoreJabalpur
Jaipur
JalandharJamshedpurJodhpur
KanpurKochi (Cochin)
Kolkata (Calcutta)Kota
Kozhikode (Calicut)
Lucknow
LudhianaMadurai
Meerut
Moradabad
Mumbai (Bombay)
Mysore
Nagpur
Nashik
Patna
Pune (Poona)
Raipur
Ranchi
Salem
Solapur
Thiruvananthapuram
Tiruchirappalli
Varanasi (Benares)
Vijayawada
Visakhapatnam
020
4060
Pov
erty
Hea
d C
ount
Rat
io
6 7 8 9 10Log of City Population
Relatioship Between Poverty and Log of City Population, 2005
Source: Tripathy (2013) Urban Labor Market, Migration and Poverty

41
The factor analysis shows that as per factor 1, the workforce participation rate and literacy in the urban areas have a negative association with urban poverty, suggesting the importance of employment generation for poverty reduction (Table 17). Migration is again positively associated with some of the development indicators, while it has a negative relationship with urban poverty and with some of the variables representing demographic pressure like urban household size. In other words, states with a higher incidence of poverty show lower migration rates, implying that the rural migrants are less likely to move to the urban areas of the states that do not provide adequate sources of livelihood and are thus characterized by a greater magnitude of urban poverty. However, this negative association can also be interpreted as a positive outcome in terms of a decline in poverty subsequent to migration from the rural to the urban areas. In factor 2, this pattern is quite pertinent: higher levels of urbanization and growth are associated with higher levels of migration (though the migration rate does not have a high factor loading) and a lower incidence of urban poverty. The results pertaining to the second factor shows that both urbanization and per capita net SDP take a very high factor loading, suggesting a strong association between them. Though inequality is not strongly correlated with urbanization and growth, the relationship is distinct. While poverty tends to decline, inequality rises in the process of growth and urbanization. The work participation rate and the percentage of urban workers engaged in non-household manufacturing and services are also positively associated with growth and urbanization, though in the regression analysis, growth was not found to be a significant determinant of the urban work participation rate. Interestingly, the rural to urban migration rate in the urban areas also shows a positive relationship with urbanization and the growth index, though it does not have a high factor loading. Even the literacy rate does not take a high factor loading, indicating less significance. Caste does not turn out to be significant either in factor 1 or 2, implying that a lower social category of population is not related to any of the other variables significantly.
Table 17: Results from Factor Analysis (Urban)
Variables Factor 1 Factor 2 MIG 0.2586 0.1808 HHSZ -0.8945 -0.1621 WFPR 0.7792 0.3300 LIT 0.7326 0.1992 SC -0.0127 0.0506 OTHERACT 0.3264 0.2910 F/M 0.2294 -0.0504 UPOV -0.4142 -0.4480

42
URBN 0.1114 0.9422 UINEQ -0.0705 0.1066 NSDPPERCAP 0.3120 0.8817 Eigen Value 3.83 1.80 Explained Variation
0.53 0.25
No. of Observation: 31 Note: HHSZ: household size; WFPR: main workforce participation rate; LIT: literacy rate; SC: percentage of scheduled caste population; OTHERACT: percentage of workers engaged in non-household manufacturing and services; F/M: female–male ratio in the population, UPOV: percentage of households below the poverty line in the urban areas; URBN: percentage of population in the urban areas; NSDPPERCAP: net state domestic product per capita; UINEQ: inequality in terms of Gini index in the urban areas. The variables are for 2011 or 2011-12 or 2010-11. Source: Author’s calculations. The results pertaining to the rural specific variables in relation to urbanization are presented in Appendix 1. In the Indian context, there is no specific policy as such for the migrants except for the notified slum clusters that are entitled to receive support in terms of basic amenities. The migrants specifically are not covered by any social security measure. If they are employed in regular jobs in the formal sector, they are entitled to the benefits that are meant for workers in this sector. Otherwise, there is no special scheme for the migrant workers. There is no legal barrier as such on migrants, though the social, cultural and linguistic barriers are enormous for the migrants who come from the rural areas, especially from other states. The city-space is shrinking for the low-income households and more so for the migrants; even entry to the slum is becoming difficult due to shortage of space. In some of the large cities, access to space inside a slum cluster is determined by the contacts that the potential migrants have with those who have already migrated and the paying capacity of the newly migrated to the local muscle-men/slum leaders/members of mafia groups/illegal landlords who earn a rent on public space (Edelman and Mitra, 2006). Though migrants have no legal restriction in disposing of their land at the place of their origin and move to cities, the practical difficulties tend to reduce migration significantly. Besides, there are instances of harassments caused to the migrants by the police authorities, builders and some of the political parties. The slum demolition squads followed by the local governments, which are not often accompanied by resettlement projects, are the biggest factors in discouraging the entry of migrants to cities. Though in a democratic set-up it is difficult to pursue any legal mechanism that hinders the mobility of the population across space, certain prevalent practices stop individuals from benefiting in the process of growth, by posing indirect restrictions on their mobility (Mitra, 2013). The labor market regulations are not applicable to the informal sector. The low-income migrants who are employed in the informal sector are as vulnerable as the locals engaged in the same sector, though migrant workers are

43
confronted with more challenges, particularly in terms of shelter. At the outset of the 2010 Commonwealth Games when slums were demolished, the inhabitants tried to enter public parks in the night for rest. However, the police chased them away, which amounts to creating barriers on migration, though in a democratic setup as that of India, no restriction on migration can be posed explicitly. From the regression analysis, it is observed that higher inequality in the urban areas leads to a higher rate of migration. Higher income or wage inequality at the place of destination is also an indicator of dynamism, which, in turn, tends to raise the expected income differential between the rural and the urban areas and, thus, the potential rural migrants are more likely to shift to urban locations. Economic growth too shows a positive impact on migration. A higher level of urbanization tends to reduce migration, whereas the urban work participation rate is not statistically significant. However, it may be argued that inequality is a result of rather than a reason for migration. Re-specifying migration as a function of growth, urbanization and urban informal sector employment, we are rather able to estimate a better model. Both growth and urban informal sector employment induce migration, while increased urbanization capturing greater demographic pressure suppresses it. MIG = -278.819 + 914.75 UINEQ + 0.005 NSDPPERCAP – 4.16 URBN + 5.17 UWFPR (-1.02) (2.14)** (2.10) ** (-1.74)* (0.64) Adj. R2 = 0.20, N=31 MIG = -6.337 + 0.005 NSDPPERCAP – 5.10 URBN + 0.45INF (-0.06) (3.03)** (-2.24) ** (2.72) ** Adj. R2 = 0.29, N=31 Note: MIG: migration rate; UWFPR: main workforce participation rate among the urban males; URBN: percentage of population in the urban areas; NSDPPERCAP: net state domestic product per capita; UINEQ: inequality in terms of Gini index in the urban areas and INF: urban informal sector employment. ** and * denote significance at 5 and 10 per cent levels respectively. One important fact from which gross inequality can be inferred is that an overwhelming proportion of workers are engaged in the informal sector, though in certain situations, the informal sector also provides productive sources of

44
livelihood and an above-poverty-line level of living. The ‘employment problem’ in the Indian context cannot be conceptualized merely in terms of the open unemployment rate because many cannot afford to remain unemployed for long. On the other hand, the set of working poor is prevalent, implying residual absorption of the workforce in low productivity informal sector activities. Even in the non-agricultural activities, the incidence of the informal sector employment is over and above 70 per cent (NSS, 2009-10). The set of informal workers is extremely large, which includes the self-employed in the informal sector (ranging from street vendors to those who operate micro enterprises with less than ten workers), regular hired workers in the petty enterprises in the informal sector, and casual and contractual workers both in the informal and formal sectors without any employment or social security. There are considerable overlaps between urban informal sector employment and urban poverty. Second, rural to urban migration has a positive association with urban informal sector employment. Often the rural migrants are not able to find jobs in the formal sector and thus pick up menial jobs in the informal sector (Mitra, 2013). Though the urban informal sector provides sources of livelihood and helps reduce the incidence and intensity of urban poverty, the overlaps between slum formation, informalization of employment and poor living standards cannot be overlooked (Mitra, 1994). Nearly 80 per cent of the low-income migrants are located in slums; 90 per cent of the households from slums are engaged in the urban informal sector; the incidence of consumption poverty in the slums is more than 70 per cent and most slum dwellers are susceptible to poor health outcomes (Mitra, 1994). The details on these aspects of the analysis are not presented in this paper because the other paper on rural to urban migration deals with some of these issues. 3.2 District-Level Data Given the complex relationship between urbanization, growth, inequality, poverty, work participation rate, caste, literacy and demographic pressure, as seen from the state-level analysis, we prefer to pursue the multivariate analysis for the district-level data. At the district level, the average MPCE is taken as a proxy for growth and inequality respectively. The correlation matrix given below shows that in relation to urbanization, the average consumption expenditure in both rural and urban areas increases, poverty declines and inequality rises (Table18) 9). The work participation rate and the percentage of workforce engaged in non-household manufacturing and services – both in the rural and urban areas – vary positively with urbanization, indicating the importance of diversification away from agriculture that accompanies urbanization. These correlations are, however, observed at a moderate level. Though urban-rural inequality too has a positive association with urbanization, the correlation is very low (0.13).

45
The rural- and urban-specific growth rates are closely associated with each other. Rural and urban growth is associated with reduction in poverty in both the areas. Poverty is accompanied by a lower work participation rate and less diversification in terms of non-agricultural activities. Poverty and inequality again go hand in hand. The plot of some of the important variables against urbanization suggests the following patterns (Graphs 9 to 12): Growth represented by per capita consumption expenditure rises mildly in response to urbanization; poverty both in the rural and urban areas tends to decline with an increase in urbanization, though there are too many outliers; urban–rural inequality measured in terms of the differences between the urban and rural average consumption expenditure per capita shows almost no relationship with urbanization; the workforce participation rate and the percentage of the workforce engaged in non-household manufacturing and services both show a rising tendency in relation to urbanization. Table 18: The Correlation Matrix URBN RAVMPCE UAVMPCE RBPL UBPL RAVMPCE 0.46 UAVMPCE 0.44 0.67 RBPL -0.31 -0.65 -0.49 UBPL -0.34 -0.50 -0.59 0.52 RINEQ 0.24 0.65 0.41 -0.30 -0.24 UINEQ 0.39 0.41 0.68 -0.23 -0.27 URINEQ 0.13 -0.08 0.68 -0.003 -0.30 RWFPR 0.28 0.31 0.21 -0.22 -0.27 ROTHERACT 0.46 0.56 0.47 -0.35 -0.32 UWFPR 0.35 0.36 0.35 -0.24 -0.37 UOTHERACT 0.29 0.31 0.44 -0.20 -0.39
Note: U and R represent urban and rural areas respectively; HHSZ: household size; CHILD-WOM: proportion of children to women; WFPR: main workforce participation rate; LIT: literacy; SC: percentage of scheduled caste population; OTHERACT: percentage of workers engaged in non-household manufacturing and services; MFGHH: percentage of workers in household manufacturing; F/M: female–male ratio in the population, BPL: percentage of households below the poverty line; URBN: percentage of population in the urban areas; AVMPCE: average monthly per capita consumption expenditure; INEQ: inequality in

46
terms of the difference between the minimum and maximum value of the consumption expenditure; URINEQ: the urban–rural difference in consumption expenditure, a proxy for urban–rural inequality The variables are for 2011 or 2011-12. Source: Population census (2011) and NSS Data (2011-12)
Graph 9: Average Monthly Consumption Expenditure Per Capita in Rural and Urban Areas (2011-12) Plotted against Urbanization (2011)
1
00
02
00
03
00
04
00
05
00
06
00
0
0 20 40 60 80 100URBAN
avg_mpce_R avg_mpce_U
Fitted values Fitted values
Note: R and U stand for rural and urban respectively. Avg_mpce is average monthly per capita consumption expenditure. Source: Population census (2011) and NSSO (2011-12) Graph 10: Incidence of Poverty in Rural and Urban Areas (2011-12) Plotted against Urbanization (2011)

47
02
04
06
08
01
00
0 20 40 60 80 100URBAN
bpl_r bpl_u
Fitted values Fitted values
Note: r and u stand for rural and urban respectively. bpl is below poverty line households. Source: Population census (2011) and NSSO (2011-12)

48
Graph 11: Urban–Rural Inequality (2011-12) in terms of Difference between Urban and Rural Average Consumption Expenditure Per Capita Plotted against Urbanization (2011)
-10
00
01
00
02
00
03
00
04
00
0
0 20 40 60 80 100URBAN
u-rmpce Fitted values
Note: u-r mpce represents differences between urban and rural monthly per capita consumption expenditure per capita. A couple of negative figures represent higher rural magnitudes than their urban counterparts. Source: Population census (2011) and NSSO (2011-12)
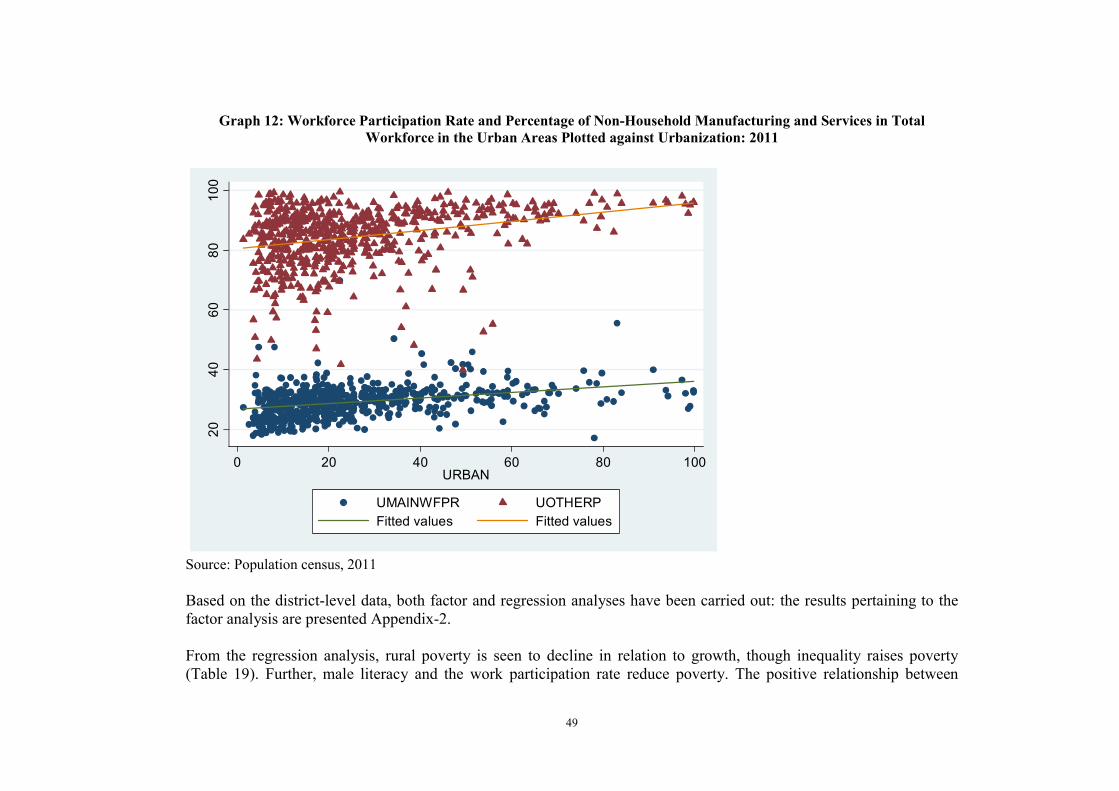
49
Graph 12: Workforce Participation Rate and Percentage of Non-Household Manufacturing and Services in Total
Workforce in the Urban Areas Plotted against Urbanization: 2011
20
40
60
80
10
0
0 20 40 60 80 100URBAN
UMAINWFPR UOTHERP
Fitted values Fitted values
Source: Population census, 2011 Based on the district-level data, both factor and regression analyses have been carried out: the results pertaining to the factor analysis are presented Appendix-2. From the regression analysis, rural poverty is seen to decline in relation to growth, though inequality raises poverty (Table 19). Further, male literacy and the work participation rate reduce poverty. The positive relationship between

50
female literacy and rural poverty is indicative of the extensive rural literacy mission aimed at encompassing more women from poor households. Similarly, in the urban areas, poverty declines in response to rise in growth, male work participation rate and male literacy rate, though inequality raises it. More importantly, urbanization shows a strong beneficial effect on poverty as higher levels of urbanization are associated with lower poverty incidence. The regression analysis of urbanization suggests that both rural and urban growth contribute to urbanization. The rural male work participation rate and rural male literacy also add to urbanization as the rural male workers and literates are more likely to migrate to cities in search of better jobs after acquiring work experience and skill. With rural diversification (expansion in nonagricultural activities), the urbanization index also tends to increase, as the rural–urban discontinuum in terms of activities tends to break down. The rural areas start urbanizing and migration also becomes easier as the differences in the nature of activities across space get dissipated. However, in relation to rural male scheduled caste population, urbanization falls as they represent the socially vulnerable lot who are less likely to afford the cost of migration. With respect to women, we reserve our comments because female migration is governed more by social factors such as marriage (Mitra, 2013). The regression analysis of economic growth in the urban areas again confirms the importance of urbanization. Literacy, increased work opportunities resulting in an enhanced work participation rate and expansion in activities such as non-household manufacturing and services also contribute to growth. However, economic growth in the rural areas is not significantly influenced by urbanization, though the other factors remain pertinent. Urban inequality rises in response to both urbanization and urban growth. Migration of the low-income households from the rural to urban areas resulting in higher levels of urbanization manifests itself in a higher level of inequality. However, increased work opportunities reduce urban inequality, while the presence of the vulnerable social categories such as the scheduled caste population aggravates urban inequality. In the rural context, inequality is not seen to be influenced by urbanization, meaning out-migration does not result in inequality reduction. A greater presence of the scheduled caste population does not add to inequality, suggesting no significant differences in the living standards across social categories in the rural areas, while in the urban context, such differences are more pronounced. Again, greater work opportunities and rural diversification are endemic to controlling inequality in the rural areas. The urban–rural inequality envisaged in terms of the differences in the average consumption expenditure per capita rises in response to expansion in employment opportunities in the non-household manufacturing and services sector in the urban areas. If the level of inequality in the urban areas is high, it tends to raise the rural–urban differences as well. However, urbanization reduces the inter-spatial inequality, implying that urbanization provides livelihood opportunities

51
to the rural population by helping them migrate out from the rural areas and also by transforming the rural areas into urban.
Table 19: Regression Results from District-Level Data: Poverty, Urbanization, Growth and Inequality Functions
Indep. Variables
RPOV11-12
UPOV11-12
URBN URBN UAVMPCE RAVMPCE UINEQ RINEQ URINEQ
RMWFPR -0.165 (-1.72)*
0.62 (5.90)**
0.71 (6.97)**
UMWFPR -0.23 (-2.05)**
RFWFPR 0.065 (1.01)
-0.26 (-3.51)**
-0.007 (-0.09)
UFWPR -0.015 (-0.11)
RWFPR 23.73 (10.65)**
-148.67 (-3.86)**
UWFPR 15.43 (2.58)**
-189.55 (-3.08)**
4.25 ((0.91)
ROTHERACT
0.37 (7.41)**
16.68 (13.81)**
-55.81 (-2.53)**
UOTHERACT
20.05 (6.44)**
-44.19 (-1.36)
11.77 (4.86)**
RMLIT -0.464 2(-3.23)**
0.567 (3.49)**
0.44 (2.81)**
UMLIT -0.67 (-2.90)**
RFLIT 0.398 (3.37)**
-0.22 (-1.68)*
-0.31 (-2.38)**
UFLIT 0.21 (1.31)
RLIT 9.81 (4.99)**
50.56 (1.61)

52
ULIT 21.61 (4.60)**
10.66 (0.22)
-1.88 (-0.51)
RMSC -1.64 (-1.04)
-8.82 (-4.73)**
-6.80 (-3.77)**
UMSC -0.42 (-0.31)
RFSC 1.38 (0.88)
8.66 (4.64)**
6.78 (3.76)**
UFSC 0.39 (0.29)
RSC -7.60 (-0.30)
USC 103.44 (2.53)**
URBN 0.023 (0.66)
-0.086 (-2.51)**
11.34 (8.29)**
1.54 (1.46)
74.29 (4.59)**
-11.85 (-0.72)
-4.22 (-3.38)**
RAVMPCE -0.026 (-17.74)**
0.006 (3.48)**
0.0008 (0.46)
10.63 (16.84)**
UAVMPCE -0.014 (-13.48)**
0.004 (3.82)**
0.003 (2.98)**
7.62 (18.21)**
RINEQ 0.0005 (5.49)**
UINEQ 0.0005 (5.64)**
0.03 (13.11)**
INTER 84.44 (15.19)*
99.39 (11.39)**
-38.998 (-6.31)**
-37.72 (-6.38)**
-1690.19 (-5.59)**
-235.42 (-2.27)**
-3199.97 (-0.99)
-6709.04 (-4.07)**
-472.08 (-1.99)**
No. of Observations
608 592 592 592 602 608 592 608 592
Adj. R2 0.4927 0.42 0.35 0.40 0.37 0.52 0.49 0.44 0.29 Note: For the definition of variables, see Tables 21 and 22. While the subscripts RM, RF, UM and UF represent rural male, rural female, urban male and urban female respectively, simply R and U refer to rural and urban areas for both the sexes. For other variables, see Table 21. ** and * denote significance at 5 and 10 per cent levels respectively. Source: Author’s calculations

53
3.3 Million-plus Cities
Large cities are said to be more productive: more demand-induced employment opportunities are available in large cities, which grow in response to the large quantum of investment undertaken therein. Several socio-economic development indicators tend to improve with an increase in city size (Mitra, 2013). Economic globalization has not reduced the intra-urban or rural–urban growth differentials. Agglomeration economies continue to exist because the new forces in the present context of economic globalization have emerged to substitute the forces that explained their prevalence around two decades back and have been on the decline (Mitra, 2014). In the backdrop of these views we, therefore, take a look at the data set generated for the million-plus cities in India (Map 1). These cities are scattered across space instead of being concentrated in a few regions. However, it seems they are mainly surrounding seaports or are the state capitals or are located in the neighborhood of the state capitals.
The incidence of poverty in million-plus cities is, however, not negligible, as Table 23 indicates. In fact, in some of the cities, the incidence is more than 25 per cent (Table 20), though such cities are very few in number. Within the million-plus cities, there seems to be an inverse relationship between city and poverty (Graph 13). Since we do not have such information for other smaller cities or towns it is difficult to make a comparison and conclude if poverty/unemployment/informal employment is lower in big cities. The skill levels across various occupations are higher in million-plus cities compared with the other categories of urban settlements and hence it may be inferred that poverty tends to decline with city size (Mitra, 2010, Tripathy 2013).
Table 20: Poverty in Million-Plus Cities (2011-12)
Less than 3 per cent
3 to less than 5 per cent
5 to less than 10 per cent
10 to less than 25 per cent
25 per cent and above
Hyderabad Kollam Surat Faridabad Allahabad Ghaziabad Rajkot Jodhpur Kanpur Aurangabad Madurai Pune Jaipur Ranchi Kota

54
Greater Mumbai Thrissur Vijayawada Nashik Agra Tiruchirappalli Coimbatore Visakhapatnam Nagpur Jamshedpur Indore Kochi Ahmadabad Jabalpur Dhanbad Bangalore Meerut Kannur Gwalior Vasai-Verar Kozhikode Srinagar Varanasi Chennai Kolkata Malappuram Lucknow Thiruvananthapuram Amritsar Durg Bhopal Chandigarh Patna Raipur Delhi Asansol Vadodara Source: Based on NSS unit level data
Though city size and poverty or city size and growth (measured in terms of average consumption expenditure per capita) are expected to be strongly associated, the graphs are not indicative of this. Poverty tends to fall with city size and then increase slightly in the case of very large cities. Per capita consumption expenditure figures rise in relation to city size, though the observations are highly scattered instead of being concentrated around the line. In fact, the correlation between log of city size and poverty incidence and log of city size and mean per capita consumption expenditure is seen to be somewhat moderate, i.e., -0.42 and 0.47 respectively.

55
Graph 13: City Size in 2011 and Poverty in 2011-12 (Below Poverty Line—BPL)
01
02
03
04
0
14 15 16 17lnPOP
BPL Fitted values
Note: In the horizontal axis, we have taken the logarithmic transformation of population. Source: Census (2011) and NSS (2011-12)

56
Graph 14: City Size in 2011 and Monthly Per Capita Consumption Expenditure in 2011-12 (mpce_mean)
10
00
20
00
30
00
40
00
50
00
14 15 16 17lnPOP
mpce_mean Fitted values
Note: In the horizontal axis, we have taken the logarithmic transformation of population. Source: Population census (2011) and NSS (2011-12)

57
Map1: Million-Plus Cities
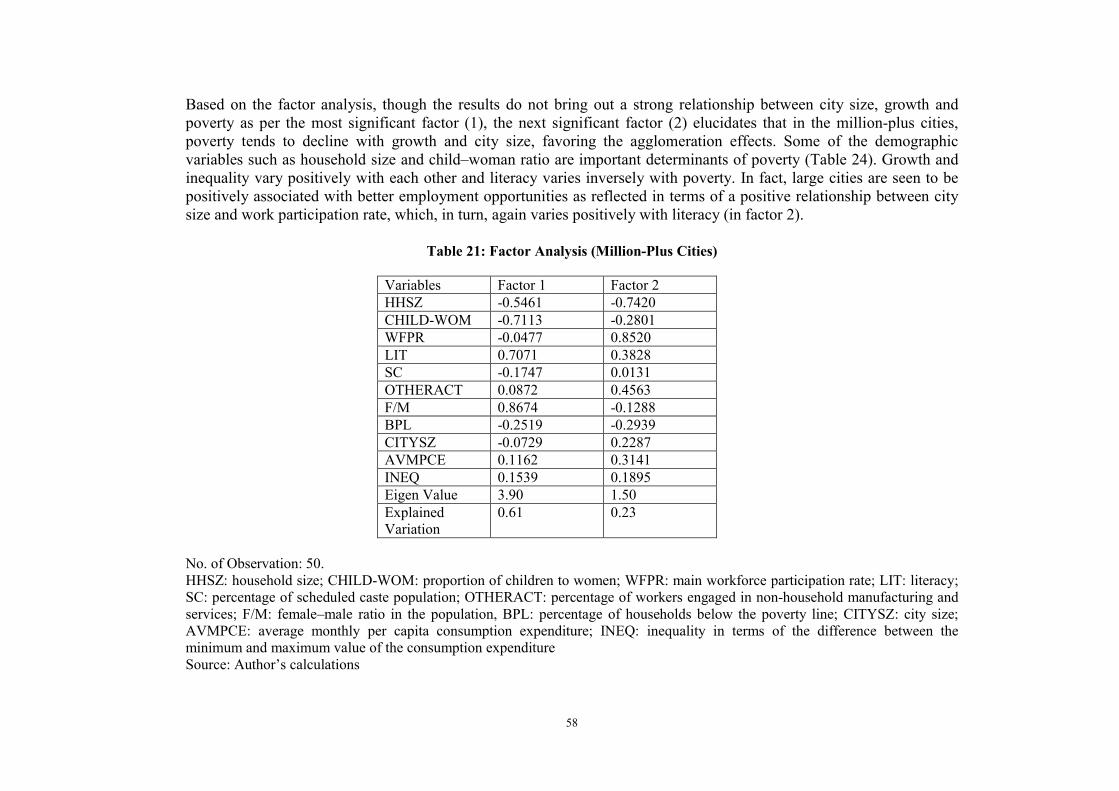
58
Based on the factor analysis, though the results do not bring out a strong relationship between city size, growth and poverty as per the most significant factor (1), the next significant factor (2) elucidates that in the million-plus cities, poverty tends to decline with growth and city size, favoring the agglomeration effects. Some of the demographic variables such as household size and child–woman ratio are important determinants of poverty (Table 24). Growth and inequality vary positively with each other and literacy varies inversely with poverty. In fact, large cities are seen to be positively associated with better employment opportunities as reflected in terms of a positive relationship between city size and work participation rate, which, in turn, again varies positively with literacy (in factor 2).
Table 21: Factor Analysis (Million-Plus Cities)
Variables Factor 1 Factor 2 HHSZ -0.5461 -0.7420 CHILD-WOM -0.7113 -0.2801 WFPR -0.0477 0.8520 LIT 0.7071 0.3828 SC -0.1747 0.0131 OTHERACT 0.0872 0.4563 F/M 0.8674 -0.1288 BPL -0.2519 -0.2939 CITYSZ -0.0729 0.2287 AVMPCE 0.1162 0.3141 INEQ 0.1539 0.1895 Eigen Value 3.90 1.50 Explained Variation
0.61 0.23
No. of Observation: 50. HHSZ: household size; CHILD-WOM: proportion of children to women; WFPR: main workforce participation rate; LIT: literacy; SC: percentage of scheduled caste population; OTHERACT: percentage of workers engaged in non-household manufacturing and services; F/M: female–male ratio in the population, BPL: percentage of households below the poverty line; CITYSZ: city size; AVMPCE: average monthly per capita consumption expenditure; INEQ: inequality in terms of the difference between the minimum and maximum value of the consumption expenditure Source: Author’s calculations

59
Mobility of the Poor Households
We have noted earlier that the incidence of poverty declined over time, while per capita income rose during the same period. However, what is important to know is whether households that were poor at one time point have become non-poor at another time point and vice versa. If some of the households keep oscillating around the poverty line, the decline in the aggregate incidence of poverty does not speak much in terms of inclusiveness. If some of the poor households have escaped poverty and none of the non-poor has become poor again, then the decline in the incidence could be a matter of success because there is hope that the remaining poor households would gradually escape poverty. But it is difficult to confirm some of these patterns from the secondary data. Our survey data from slum households from different types of cities brings out the fact that both upward and downward mobility have taken place over time, though the extent of upward mobility dominates the extent of downward mobility (Mitra, 2004 and 2010). Also, the most dynamic cities have experienced upward mobility to a greater extent than the small cities. This tends to support the agglomeration effects. Rapid urbanization and large cities reduce poverty faster than the small towns or rural areas. As regards income mobility, our survey results support the positive effect of saving, asset formation, education and locational characteristic. Within the cities households living in certain specific pockets have been able to escape poverty possibly because they could benefit by inter-mingling with non-poor households and diversifying their job search networks.
Our survey data, however, does not offer any evidence on mobility from slum to non-slum areas. At the most, some of the slum households are seen to have carried out investment activities on their living units, which may be interpreted as a movement from slum to non-slum living conditions. However, cases showing significant improvements in living conditions are limited in number. One important determinant of housing investment is land tenure; since it is difficult for the slum dwellers to get legal ownership over the land, investment on housing is highly limited.
4. Multi-faceted Nature of Poverty: Well-being of the Low-Income Households The next issue relates to the well-being levels, which not only means consumption poverty but also other aspects of the population in different types of cities with the underlying hypothesis that agglomeration economies in large cities get translated into higher well-being levels. Higher agglomeration economies reflected in terms of higher productivity levels and real earnings imply greater affordability. Nutritional status and accessibility to education and health improve, which, in turn, contribute to the overall well-being levels of the households. Fertility behavior, for example, changes and so also the indicators of social development as one important determinant of housing investment is land tenure; since it is

60
difficult for the slum dwellers to get legal ownership over the land investment on housing is highly limited. Educational levels and health outcomes tend to improve. However, due to the lack of data at the aggregate level or for the total population in a given city, we had to examine this hypothesis indirectly. The question that we pose is: are the households from low-income clusters better off in large cities compared with their counterparts in relatively small ones? Again, on the aspect of well-being, not much information is available from the secondary sources. However, under the UNDP-sponsored project on urban poverty, one survey was undertaken in four cities of different population size and economic activities (i.e., Jaipur, Ludhiana, Mathura and Ujjain).9 These cities were picked up from the list of sixty-four cities prepared specifically for the urban renewal mission (JNNURM). The primary survey enables us to comment on certain aspects of well-being of the slum dwellers in these four cities. While Jaipur and Ludhiana are two million-plus cities, Mathura and Ujjain are relatively small in size. Again, Ludhiana is an industrial city, while Jaipur being a state capital, a tourist centre and also a trade centre has a significant spread of the services sector. Mathura and Ujjain are both religious cities, and between the two, the latter is absolutely stagnant. Such a mix of cities enables us to perceive the well-being of slum dwellers in the context that involves large variations. From the measurement point of view, various dimensions of poverty, rather than only income or consumption poverty need to be considered to assess well-being. However, we could consider only those dimensions that are quantifiable. The following variables have been combined to construct the household-specific well-being index: household size, child–woman ratio, per capita consumption expenditure, proportion of persons in the household who reported illness, percentage of household members who acquired at least primary-level education, percentage of members in the age group 15 to 59, which is a proxy for adult potential earners, percentage of working individuals, age of the household head/principal earner taken as a proxy for experience in the job market, health expenditure per capita, and per capita household income. Household size is likely to reduce well-being because the earnings and the related gains get distributed among a large number of individuals with an increase in the number of members. Similarly, households with a greater child–woman ratio indicate a higher rate of fertility and thus the economic gains get shared among a large number of children. As the percentage of ill members in the household rises, the income loss due to work loss and, also, extra expenditure for curative purposes tend to increase, reducing the well-being level of the household. Health expenditure per capita on a
9 This project and survey sponsored by UNDP-GOI were undertaken by the Institute of Economic Growth, Delhi.

61
priori basis may raise the well-being of the household if it is incurred for protective purposes, enhancing productivity. On the other hand, it may reduce well-being if it is incurred at the expense of consumption of essential items. The other variables are expected to improve well-being. Per capita household income and per capita consumption expenditure raise well-being because higher income and higher consumption enhance the accessibility to a better quality of life and health. Similarly, with a rise in the percentage of household members who acquired at least primary-level education, the accessibility to better jobs and incomes and also awareness about health and children’s education improves. The percentage of members in the age group 15 to 59, which is a proxy for adult potential earners, the percentage of working individuals, and the age of the household head/principal earner, which is a proxy for experience in the job market, contribute to household income positively. Since these variables are heterogeneous, it is difficult to combine them to indicate an overall living standard of the households. Hence, factor analysis was conducted, and using the factor loadings as weights, variables were combined to generate a composite index of well-being. Results of the factor analysis are in conformity with our hypothesis. The factor loading of household size takes a negative sign, which suggests that it reduces the well-being of the households. Household income per capita and consumption expenditure per capita both take positive factor loadings though in terms of magnitude they are moderate like that of household size. On the higher side are the child–woman ratio, the percentage of household members in the age bracket 15 to 59 and the proportion of the number of working members to the total household size. While the child–woman ratio reduces the well-being as reflected in terms of negative factor loadings, the other two variables take a positive coefficient. Education, though highly moderate in terms of magnitude, shows a positive effect except in Jaipur. Health expenditure per capita also shows a positive effect, though magnitude of the factor loadings is quite low.
The well-being index has been constructed using the factor loadings as weights. It indicates that in Jaipur and Ludhiana, 26 and 32 per cent of the slum households respectively are located in the bottom two size classes (Mitra, 2014). However, in Mathura and Ujjain, which are much smaller than the other two cities and also lack growth dynamism, the corresponding figures are 57 and 61 per cent respectively. Thus, the well-being index even among the low-income households seems to have a positive association with city size, confirming the existence of agglomeration benefits.
It is interesting to note that these figures are substantially lower than the incidence of consumption poverty, which is 66.8 per cent in Jaipur, 43.6 per cent in Ludhiana, 75 per cent in Mathura and 88.2 per cent in Ujjain. This would tend to

62
suggest that even when consumption poverty is high, many other facilities that are available in the cities contribute to the well-being of the population. Thus, the restrictions on migration, which are many in indirect terms, deprive the population from taking advantage of the urban facilities.
Housing Poverty
Housing is an important aspect of well-being. Like food, housing is essential for human existence. Also, as an activity when it expands, it creates employment opportunities for several unskilled and semi-skilled workers. It is an indispensable component of urban planning. Any discrepancy between demand and supply can lead to serious problems related to human habitation. Even in the national capital, there is a severe shortage of housing and basic amenities, let alone the average for all urban areas. At the all-India (urban) level, only 66.1 per cent of the households lived in concrete (pucca) houses, 21.3 per cent in semi-concrete (semi-pucca) houses and 12.6 per cent in mud-thatched houses (2011, Census of India). The 2011 Census also indicates that 11 million housing units are vacant, indicating a paradox of housing shortage of 19 million vis-à-vis 11 million vacant units. States and cities need to examine their respective status. Another way of conceptualizing housing poverty is to consider the percentage of population residing in slums with inadequate living space and basic amenities. At the all-India level, 26.31 percent of the urban population lived in slums in 2001. In Delhi, the corresponding estimate was a bit lower in magnitude, but still at 18 per cent. In addition to the notified slums, there are also ‘slum-like’ structures in the city that are unfit for human habitation. If the slum population can be augmented by adding the population living in such structures, the percentage would be even more. Because of acute shortage of affordable shelter, many migrants tend to encroach on city space and squat on public land. Such unauthorized squatter settlements are not only over-crowded and unhygienic but also prone to various environmental and health hazards. The slum problem is both a housing problem as well as an ‘employment problem’. There are several households that reside in slums because they cannot afford better quality housing because of being engaged in low-productivity jobs. On the other hand, there are households that stay in slums in spite of being engaged in jobs with higher remuneration as there is a severe shortage of housing.

63
The report of the technical group (for the 12th Five Year Plan on urban housing) estimated that there were 18.78 million households that did not have housing in 2012.10 In urban Delhi alone, 0.49 million were estimated having housing shortage, in relative terms comprising 2.59 per cent of the total scarcity in urban India. In the equation for slum incidence, there seems to be a direct relationship between urbanization and the percentage of population living in slums across states, though it is not statistically significant. On the other hand, economic growth reduces the incidence of slums, though it is again statistically insignificant. Urbanization without the growth-enhancing channel is seen to reduce the incidence of slums, but it is highly negligible as the correlation is estimated at only -0.05. So we may infer that urbanization does not lead to any rise in the incidence of the slum population. Much of the concerns expressed particularly by demographers and policy makers seem to be exaggerated. With effective intervention, the slum problem, which is expected to aggravate in the process of urbanization, can be tackled. SLUM = 26.03 + 0.175URB - 0.0002 NSDP per cap (6.68)** (1.11) (-1.60) Adj. R2 = 0.02; N=31 Delhi and many other million-plus cities continue to face the problem of the mushrooming growth of slum clusters on land belonging to various agencies. Migrants travel to these cities in search of livelihood, which does not remain confined to the formal economy alone as the informal economy holds significant possibilities of absorption of the unskilled and semi-skilled variety of labor. Besides, there are several residents in the slums who have been staying in such locations for several decades, and some of them were even born in the city. In spite of being in the city for a long time and being aware of the functioning of the labor market and the availability of infrastructural support, these households have not been able to experience any upward mobility. Table A in Appendix 3 provides estimates on the projected slum population in different states and union territories, which are indeed phenomenal.
Though a number of slum development schemes and measures to provide housing to the economically weaker section of the population exist, the land and housing market, especially in the large cities, involves a great deal of speculation. In
10 Source: Report of the Technical Group on Urban Housing Shortage (TG-12), 2012-17. Government of India, Ministry of Housing and Urban Poverty Alleviation, National Buildings Organisation www.mhupa.gov.in

64
practice, space for the economically weaker sections is shrinking day by day (Mitra, 1994). Most of the low-income migrant households land up in slums, which are of two types: registered and unregistered. The registered slums are those that are recognized by the local authorities (municipalities, etc.) and are entitled to receive basic amenities. Also, in case of a decision in favor of slum demolition, the residents are rehabilitated at an alternative area, which is usually on the outskirts of the cities and, thus, remains least preferred by the inhabitants. On the other hand, the unregistered slums do not even have these minimum supports and, thus, run the risk of demolition at any time. Many of the residents of the registered slums are likely to bear initially a “token” and subsequently a voter’s identity card, which recognizes them as the residents of the urban localities and thus provides access to the public distribution system as well. The functioning of the overall land and housing market aggravates inequality, which reduces accessibility of the low-income households to decent living conditions, forcing many to reside in unregistered slums, let alone registered slums.
On the whole there is segregation at least in terms of residence. There are pockets in which low-income households reside with meager incomes and inadequate amenities. The nexus between the builders, politicians and the elite is on the rise as far as city space is concerned (Edelman and Mitra, 2006). The middle-class communities’ accessibility to land is also on the rise as revealed by the increasing expansion of housing societies in the million-plus cities and other large cities. The multiple complexes for commercial purposes are emerging significantly subsequent to the demolition of slums and squatter settlements. As Kundu (2009) argues, the urbanization process is increasingly becoming exclusionary. Slum rehabilitation programs, keeping in view the access to basic amenities and inexpensive transport networks, need to be implemented effectively. Some of the city space has to be reserved for the economically weaker sections of the population; else policies to provide housing to these sections can never be implemented successfully on a large scale. Construction of low-cost housing and provision of credit assistance are some of the effective ways of enhancing accessibility to better living conditions. The housing problem, however, cannot be separated from the ‘employment problem’ because without productive employment and ‘decent wages’, workers can never upgrade their living conditions. 5. Conclusion and Policies
This study assessed the relationship between urbanization, growth, inequality and poverty in the backdrop of labor market and demographic characteristics. From the state-level data, urbanization and per capita income are seen to be strongly correlated—urbanization turns out to be a significant determinant of growth for both the years 2004-05 and 2011-12. Urbanization does not impact on inequality significantly. Growth reduces poverty, though the role of other factors is also important. However, growth raises inequality, though only in the rural context.

65
Inequality and poverty are mostly unrelated. Urbanization does not show any significant impact on rural poverty, though it tends to reduce poverty in the urban areas. However, the explanatory power of the equation is nominal, indicating the impact of many other factors. After controlling for growth and inequality, the effect of urbanization is absolutely insignificant. So, we may conclude that urbanization increases both income and inequality. Besides, urbanization reduces poverty, while inequality increases poverty. We further noted that growth positively influences urbanization. On the other hand, urbanization and expansion in non-agricultural activities both contribute to economic growth. However, economic growth does not seem to be resulting in a higher work participation rate in the urban areas. Even urbanization is not seen to have resulted in an enhanced work participation rate. The results from factor analysis corroborate some of these findings: urbanization and per capita net SDP both take a high factor loading, suggesting a strong association between them. Though urban inequality is not strongly correlated with urbanization and growth, the relationship is distinct. While poverty tends to decline evidently, inequality rises in the process of growth and urbanization. The work participation rate and the percentage of urban workers engaged in non-household manufacturing and services are also positively associated with growth and urbanization. The workforce participation rate and literacy both show a negative association with urban poverty, indicating the importance of employment generation for poverty reduction. Again in relation to urbanization and growth, rural inequality tends to rise and rural poverty declines. Also, there seems to be a positive relationship between the child–woman ratio, household size, poverty and female–male ratio in factor 1, implying that poverty tends to rise with demographic pressure and it is more prevalent in households with a larger number of women. Migration is not found to be a significant determinant of urbanization. Given the moderate flow of population from the rural to the urban areas, this is quite an expected phenomenon. However, both rural and urban poverty are positively correlated, implying a similarity in the poverty situation in the rural and the urban areas across states. Higher inequality in the urban areas is seen to attract more migrants. Higher income or wage inequality at the place of destination is an indicator of dynamism, which, in turn, tends to raise the expected income differential between the rural and the urban areas and, thus, the potential rural migrants are more likely to shift to these urban locations.

66
Economic growth too shows a positive impact on migration. Though a higher level of urbanization tends to reduce migration, from the factor analysis, migration shows a positive relationship with urbanization and the growth index, though it does not have a high factor loading. Migration is seen to be positively associated with some of the development indicators, while it has a negative relationship with urban poverty and some of the variables representing demographic pressure like urban household size. In other words, states with a higher incidence of urban poverty show lower migration rates, implying that the rural migrants are less likely to move to the urban areas that do not provide adequate sources of livelihood to the poor and are thus characterized by a greater magnitude of urban poverty. However, this negative association can also be interpreted as a positive outcome in terms of a decline in poverty subsequent to migration from the rural to the urban areas. The district-level data for the urban areas confirms a positive association between urbanization, work participation rate, percentage of the workforce engaged in non-household manufacturing and services, literacy, growth and inequality, though the degree of association is mild as judged from the moderate factor loadings corresponding to many of these variables. Further, urban poverty is also seen to be negatively associated with these variables, though not strongly. However, in the next significant factor, this relationship between growth, inequality, poverty and urbanization turns out to be much sharper. While growth, inequality and urbanization tend to move in the same direction, poverty declines. In the rural context, from the district-level data, though similar findings are discernible between growth, inequality, poverty and other development indicators including the urbanization level in the district, the factor loadings are much lower in magnitude in the most significant factor. However, in the least significant factor, the growth–inequality–poverty–urbanization nexus gets sharper. On the whole, districts with a higher level of urbanization are associated with reduced rural poverty and higher levels of growth and other development indicators, though inequality is likely to rise in the process. From the regression analysis of the district-level data also, rural poverty is seen to decline in relation to growth, though inequality raises poverty. Further, male literacy and the work participation rate reduce poverty. The positive relationship between female literacy and rural poverty is indicative of the extensive rural literacy mission aimed at encompassing more number of women from poor households. Similarly, in the urban areas, poverty declines in response to rise in growth, male work participation rate and male literacy rate, though inequality raises it. More importantly, urbanization shows a strong beneficial effect on poverty as higher levels of urbanization are associated with a lower poverty incidence.

67
The regression analysis of urbanization at the district level suggests that both rural and urban growth contribute to urbanization. Rural male work participation rate and rural male literacy also add to urbanization as the rural male workers and literates are more likely to migrate to cities in search of better jobs after acquiring work experience and skill. With rural diversification (expansion in nonagricultural activities), the urbanization index also tends to increase as the rural–urban discontinuum in terms of activities tends to break down. The rural areas start urbanizing and migration also becomes easier as the differences in the nature of activities across space get dissipated. The regression analysis of economic growth in the urban areas again confirms the importance of urbanization. Literacy, increased work opportunities resulting in an enhanced work participation rate and expansion in activities such as non-household manufacturing and services also contribute to growth. However, economic growth in the rural areas is not significantly influenced by urbanization, though the other factors remain pertinent. The district-level data also confirm that urban inequality rises in response to both urbanization and urban growth. Migration of the low-income households from the rural to urban areas resulting in higher levels of urbanization manifests itself in a higher level of inequality. However, increased work opportunities reduce urban inequality, while the presence of the vulnerable social categories such as the scheduled caste population aggravates urban inequality. In the rural context, inequality is not seen to be influenced by urbanization, meaning out-migration does not result in inequality reduction. Again, greater work opportunities and rural diversification are endemic to controlling inequality in the rural areas.
From the data at the city level (million-plus cities), there is evidence on poverty declining with growth and city size, favoring the agglomeration effects. Some of the demographic variables such as household size and the child–woman ratio are also the other determinants of poverty (Table 24). Growth and inequality vary positively with each other. Literacy varies inversely with poverty. In fact, large cities are seen to be positively associated with better employment opportunities as reflected in terms of a positive relationship between city size and work participation rate, which, in turn, again varies positively with literacy (in factor 2). Based on the primary survey data, the distribution of slum households across the size classes of the well-being index shows that the percentage of households at the bottom two size classes is much larger in the stagnant and small urban settlements compared with the large and relatively dynamic ones.
For the urban poor to experience an upward mobility, the urban employment programs are pertinent. Most of the urban specific programs in India largely emphasize the importance of basic amenities to the urban poor and the infrastructure

68
needs of the cities. However, safety net for the workers in the low-productivity urban informal sector is essential for reducing the intensity and the incidence of urban poverty. Besides, improvement in health and educational support can have a longer effect on poverty. The well-known employment guarantee program (NREGA) is applicable only in the rural context and does not have an urban counterpart. The increasing rural-urban development disparities may result in increased rate of migration to the urban areas in search of jobs. The ‘Skill India’ program of the present government may again induce migration as rural residents after acquiring skill would look for high productivity jobs in the urban areas. The focus on creating world class cities under the Smart Cities program may motivate rural aspirants to shift to these locations. But stringent anti-slum policies in the so-called smart cities will possibly lead to exclusionary urbanization unless the other urban centers offer opportunities to the low income households and encourage migration. The ‘Make in India’ initiative to boost manufacturing growth may, however, offer employment opportunities which in turn may lead to reduction in poverty.
Some of the major programs of the Ministry of Housing and Urban Poverty Alleviation (MHUPA) meant for the urban areas are: Jawaharlal Nehru National Urban Renewal Mission (JNNURM): Basic Services to the Urban Poor (BSUP) and Integrated Housing and Slum Development Program (IHSDP); Swarna Jayanti Shahari Rozgar Yojana (SJSRY) (i.e., employment programs in the urban areas for the low-income households); Affordable Housing in Partnership (AHIP); Interest Subsidy Scheme for Housing the Urban Poor (ISHUP); Urban Statistics for HR and Assessments (USHA); Integrated Low Cost Sanitation Scheme (ILCS); and projects/schemes for the development of North Eastern Region, including Sikkim. However, the employment programs in the urban context have hardly been implemented. Only the measures related to urban basic services and slum development are evident across many cities. Even among them, the slum rehabilitation or resettlement schemes have remained mostly unsuccessful as the new areas allotted to the slum dwellers are usually outside the city territory where employment opportunities are scanty. On the other hand, the lack of an inexpensive transport system to reach the city centers and other places of work opportunities makes urban survival more stressful for the low-income households, particularly for those who migrate from other places.
A distinction needs to be made between the short-run and the long-run anti-poverty policies. Manufacturing growth is essential for the productive absorption of the unskilled and the semi-skilled variety of labour that shifts out of the agricultural sector. In the long run, for making urbanization more sustainable, growth with employment generation has to be the focus so that the agglomeration effects are utilized towards poverty reduction. Provision of mere doles, which do not contribute to asset formation, for making the poor self-sufficient in the long run cannot result in poverty-free cities. Besides, the urban transport policy also needs to be developed in a more integrated manner so that the low-income households are able to access their sources of livelihood in a cost effective way.

69
In the historical context, urbanization had mostly been a concomitant of industrialization, and it absorbed the rural migrants to a considerable extent, thus resulting in a sizeable increase in the living standards. However, in the Indian context, urbanization and poverty reduction are at the most mildly associated. Though much of the non-agricultural income growth is concentrated in the urban areas, inequality is also seen to have increased alongside. Both the market and the government are required to play a more efficient role so as to enhance the positive spill-over effects of urbanization on growth, employment generation and poverty. The role of the government in making urbanization inclusive has been highly negligible. Growth and employment-oriented strategies need to be introduced in the urban space, taking advantage of the agglomeration economies, so that the relationship between urbanization and poverty can be strengthened substantially.
Infrastructure, education, health, housing and basic amenities deserve a great deal of attention in the urban space. If the agglomeration benefits are to be reaped, the mega cities would require further investment. New towns, which have been coming up in the periphery of large cities in response to exhaustion of space within the city territories, require huge investment in terms of livability and connectivity. Population flow to the large urban settlements both from the rural and the smaller urban settlements has been always rapid in India. In the coming years too, a similar pattern is likely to continue, reassuring the prominence of large cities in the development experience of the Indian subcontinent. Hence, in order to keep pace with supplies of labor and achieve productivity gains through agglomeration economies, newer growth channels and poverty-mitigating strategies need to be explored. The large cities have to emerge as the growth poles in a cost-effective manner and, at the same time, they must adopt pro-poor strategies so that the effects of growth can reach out to all sections of the society instead of being confined to a limited few. Integrated markets need to develop for such pro-poor growth to take place and to fasten the impact of urbanization on poverty reduction.

70
References
Bhanumurthy, N.R. and A. Mitra (2010), Globalization, Growth and Poverty in India, in M. Nissanke and Erik Thorbecke (eds.) The Poor under Globalisation in Asia, Latin America and Africa, Oxford University Press, New York. Cali, M. (2008), Urbanization, inequality and economic growth: Evidence from Indian states and towns, Background note for the World Development Report 2009. Cali, M. and Carlo Menon (2012), Does Urbanization Affect Rural Poverty? Evidence from Indian Districts, The World Bank Economic Review Vol.27, No.2, pp. 171 –201 doi:10.1093/wber/lhs019 Dandekar, V. M., & Rath, N. (1971), Urban poverty in India. Pune: Indian School of Political Economy Deaton and Dreze (2002), Poverty and Inequality in India: A Re-Examination, Economic and Political Weekly, pp. 3729-3748. Edelman, B., & Mitra, A. (2006), Access to basic amenities: The role of political contact, its determinants and adverse effects. Review of Urban and Regional Development Studies, 18(1), pp. 25-40.
Ferré, Céline, Francisco H.G. Ferreira and Peter Lanjouw (2012), Is There a Metropolitan Bias? The relationship between poverty and city size in a selection of developing countries, November 2012 World Bank Economic Review, Vol.26, No.3 Pages: 351–382.
Gangopadhyay, Shubhashis,Ghosh Namrata and Sharma Purti (2010), report on “Generating Poverty Maps for India”, submitted to Planning Commission Gangopadhyay, Shubhashis,Ghosh Namrata, Sharma Purti and Kumari Niloo (2011), report on “Generating Poverty Estimates Using New Poverty Lines”, submitted to Planning Commission Jha, R. (2002) Reducing Poverty and Inequality in India: Has Liberalization Helped? https://crawford.anu.edu.au/acde/publications/publish/papers/wp2002/wp-econ-2002-04.pdf

71
Kakwani, N.N. B. Prakash and H.H. Son, (2000), Growth, Inequality and Poverty: An Introduction, Asian Development Review. Vol. 18, pp. 1-21 Kundu, A. (2006). Urbanization and urban governance: Search for a perspective beyond neo-liberalism, in A. Shaw (Ed.), Indian cities in transition. Hyderabad: Orient Longman
Kundu (2009) Exclusionary Urbanization: A Macro Overview, Economic and Political Weekly, Vol XLIV No. 48. pp 48-58 Kundu, A. and Mohanan, P. C. (2009), Employment and Inequality Outcome in India, OECD Conference Paris, OECD Paris
Kundu, K.K. (2013) “India has a problem with inequality, and it won't be solved easily”, May 25, Business standard
http://www.business-standard.com/article/opinion/india-has-a-problem-with-inequality-and-it-won-t-be-solved-easily-113052500705_1.html Kuznets, S. (1966), Modern economic growth: Rate, structure and spread. New Haven: Yale University Press. Lanjouw, P and R Murgai (2010), Size Matters: Urban Growth and Poverty in India, 1983-2005, Development Economics Research Group Working Paper, World Bank, Washington, DC Mahadevia, D. and S. Sarkar (2012), Handbook of Urban Inequalities, Oxford University Press, New Delhi Mitra, Arup (1994) Urbanization, Slums, Informal Sector Employment and Poverty: An Exploratory Study, B.R. Pub. Corp.
(D.K. Pub. and Dist.), Delhi, 1994. Mitra, Arup (2003), Occupational Choices, Networks and Transfers: An Exegesis Based on Micro Data from Delhi Slums, Manohar Publishers, New Delhi Mitra, Arup (2010) Migration, Livelihood and Well-being: Evidence from Indian City Slums, Urban Studies, 47(7) 1371–1390, June 2010

72
Mitra, Arup (2004), “Informal Sector, Networks and Intra-City Variations in Activities: Findings from Delhi Slums”, Review of Urban and Regional Development Studies, Vol. 16, No. 2, July Mitra, Arup (2013), Insights into Inclusive Growth, Employment and Wellbeing in India, Springer, Delhi Mitra, Arup (2014), “Agglomeration Economies and Wellbeing: Evidence from India”, Athens Journal of Health, Vol. 1, No. 1, March Mitra, A., and Mehta, B. (2011), Cities as the engine of growth: Evidence from India. Journal of Urban Planning and Development, 137(2), 171–183 Report of the Technical Group (11th Five Year Plan: 2007-12) on Estimation of Urban Housing Shortage, Ministry of Housing and Urban Poverty Alleviation, National Buildings Organisation, Government of India, New Delhi Report of the Committee on Slum Statistics/Census (2009), Ministry of Housing and Urban Poverty Alleviation, National Buildings Organisation, Government of India, New Delhi Sachs, J. D., Bajpai, N., & Ramiah, A. (2002, March). Understanding regional economic growth in India (CID Working Paper No. 88), Cambridge: Center for International Development at Harvard University Sharma, P. and N. Kumari (2012), Location as a Poverty Trap, https://www.google.co.in/search?q=sharma+and+kumari&ie=utf-8&oe=utf-8&aq=t&rls=org.mozilla:en-US:official&client=firefox- a&channel=np&source=hp&gfe_rd=cr&ei=ztOJU6OrFojC8geXsYHoDA#channel=np&q=sharma+and+kumari+on+poverty&rls=org.mozilla:en-US:official Sundaram, K. and S.D. Tendulkar, (2003), Poverty among Social and Economic Groups in India in 1990s, Economic and Political Weekly, Vol. – XXXVIII, No. 50, pp. 5263-5276.
Tripathy, S. (2013), Does Higher Economic Growth Reduce Poverty and Increase Inequality? Evidence from Urban India, Indian Journal of Human Development, Vol. 7, No. 1, pp.109-137 World Bank (2011), Perspectives on Poverty in India: Stylized Facts from Survey Data, Washington, DC

73
Appendix-1 State-Level Data: Rural Areas (Factor Analysis Results)
Corresponding to the rural specific variables, literacy and the percentage of workers engaged in non-household manufacturing and services are positively associated (Table Appendix 1.1). Urbanization and growth reveal a strong positive association in relation to which rural inequality tends to rise and rural poverty declines. Caste again enters with a negligible factor loading in factor 1, implying no significant association with poverty. Also, there seems to be a positive relationship between child–woman ratio, household size, poverty and female–male ratio in factor 1, implying that poverty tends to rise with demographic pressure and it is more prevalent in households with a larger number of women. This conforms to the view on feminization of poverty and female-headed households being more prone to poverty, though factor 2 does not suggest so.
Table Appendix 1.1: Results from Factor Analysis (Rural)
Variables Factor 1 Factor 2 Factor 3 HHSZ -0.2555 -0.6846 0.3132 CHILD-WOM -0.1547 -0.8907 0.0923 WFPR 0.1133 0.1999 -0.8894 LIT 0.5304 0.6314 -0.0599 SC 0.0396 0.1467 0.1218 HHMFG -0.2061 0.0960 0.5090 OTHERACT 0.8031 0.2337 0.3018 F/M -0.4439 0.4916 0.1211 RPOV -0.5206 -0.1914 0.0084 URBN 0.9145 0.0379 -0.2345 RINEQ 0.3515 0.3080 0.0069 NSDPPERCAP 0.8918 0.2039 0.2031 Eigen Value 4.33 1.73 1.49 Explained Variation
0.48 0.19 0.17
No. of Observation: 31 Note: HHSZ: household size; WFPR: main workforce participation rate; LIT: literacy rate; SC: percentage of male scheduled caste population; HHMFG: percentage of workers in household manufacturing; OTHERACT: percentage of workers engaged in non-

74
household manufacturing and services; F/M: female–male ratio in the population, RPOV: percentage of households below the poverty line in the rural areas; URBN: percentage of population in the urban areas; NSDPPERCAP: net state domestic product per capita; RINEQ: inequality in terms of Gini index in the rural areas. The variables are for 2011 or 2011-12 or 2010-11. Source: Author’s calculations

75
Appendix-2 District-Level Data (Factor Analysis Results)
Based on the multivariate analysis (factor analysis), the district-level data for the urban areas confirms a positive association between urbanization, work participation rate, percentage of workforce engaged in non-household manufacturing and services, literacy, growth and inequality, though the degree of association is a mild one as judged from the moderate factor loadings corresponding to many of these variables (Table 20). Further, urban poverty is also seen to be negatively associated with these variables, not strongly though. However, as we move on to the next significant factor (2), this relationship between growth, inequality, poverty and urbanization turns out to be much sharper. While growth, inequality and urbanization tend to move in the same direction, poverty declines. Another interesting finding that emerges is that the dependency ratio (child–woman ratio) and the demographic variable (household size) are the two highly significant variables in factor 1 that have a positive association between each other and with poverty as well. On the other hand, they are negatively connected with many of the development indicators. Besides, poverty tends to increase with a rise in household-based activities represented by household manufacturing share in the workforce. Interestingly, the female–male ratio appears to be higher in districts with improved outcomes in terms of poverty, growth, urbanization and work participation rate.
Table Appendix 2.1: Results from Factor Analysis (District: Urban)
Variables Factor 1 Factor 2 UHHSZ -0.7716 -0.1540 UCHILD-WOM -0.8534 -0.1684 UWFPR 0.6353 0.1921 ULIT 0.7374 0.2264 USC 0.1201 0.0383 UOTHERACT 0.3282 0.3096 UMFGHH -0.2011 -0.0983 UF/M 0.3075 0.0014 UBPL -0.3135 -0.4429 URBN 0.2366 0.4735 UAVMPCE 0.2611 0.8050

76
UINEQ 0.1276 0.7407 Eigen Value 3.97 1.18 Explained Variation
0.6374 0.1898
Note: No. of Observation: 592 U represents urban areas; HHSZ: household size; CHILD-WOM: proportion of children to women; WFPR: main workforce participation rate; LIT: literacy; SC: percentage of scheduled caste population; OTHERACT: percentage of workers engaged in non-household manufacturing and services; MFGHH: percentage of workers in household manufacturing; F/M: female–male ratio in the population, BPL: percentage of households below the poverty line; URBN: percentage of population in the urban areas; AVMPCE: average monthly per capita consumption expenditure; INEQ: inequality in terms of the difference between the minimum and maximum value of the consumption expenditure. The variables are for 2011 or 2011-12 or 2010-11. Source: Author’s calculations In the rural context, though similar findings are discernible between growth, inequality, poverty and other development indicators including the urbanization level in the district, the factor loadings are much lower in magnitude in factors 1 and 2, implying the absence of a strong association (Table 21). It is only in factor 3 that the growth–inequality–poverty–urbanization nexus gets sharper. On the whole, districts with a higher level of urbanization are associated with a reduced rural poverty incidence and higher levels of growth and other development indicators, though inequality is likely to rise in the process. Again, such districts with better outcomes are also able to witness a higher female–male ratio in the population. Hence, based on the district-level data, it may be concluded that urbanization not only delivers better outcomes in terms of economic indicators but also social and demographic indicators, though the process of social transformation seems to be taking place at a much slower pace.
Table Appendix 2.2: Results from Factor Analysis (District: Rural)
Variables Factor 1 Factor 2 Factor 3 RHHSZ -0.6615 -0.1201 -0.0750 RCHILD-WOM -0.8758 -0.1914 -0.2291 RWFPR 0.4826 -0.2138 0.1992 RLIT 0.6064 0.2863 0.2864 RSC 0.1626 0.0470 0.0835 ROTHERACT 0.1095 0.7814 0.2365 RMFGHH -0.0320 0.1394 -0.0442

77
RCUL -0.1466 -0.9115 -0.1291 RAGLAB 0.0393 0.0829 -0.1217 RF/M 0.4391 -0.0442 0.0058 RBPL -0.1700 -0.1488 -0.5527 URBN 0.1797 0.3859 0.2479 RAVMPCE 0.2638 0.2676 0.7903 RINEQ 0.1938 0.1964 0.6557 Eigen Value 3.92 1.90 1.69 Explained Variation
0.4115 0.1987 0.1775
Note: No. of Observation: 608 R: rural areas, HHSZ: household size; CHILD-WOM: proportion of children to women; WFPR: main workforce participation rate; LIT: literacy; SC: percentage of scheduled caste population; OTHERACT: percentage of workers engaged in non-household manufacturing and services; CUL: percentage of workforce engaged as cultivators; AGLAB: percentage of workforce engaged as agricultural laborers; MFGHH: percentage of workers in household manufacturing; F/M: female–male ratio in the population, BPL: percentage of households below the poverty line; URBN: percentage of population in the urban areas; AVMPCE: average monthly per capita consumption expenditure; INEQ: inequality in terms of the difference between the minimum and maximum value of the consumption expenditure. The variables are for 2011 or 2011-12 or 2010-11. Source: Author’s calculations

78
Appendix-3
Table Appendix 3.1: State-wise Projected Slum Population from 2011 to 2017
State 2011 2012 2013 2014 2015 2016 2017
Andaman and Nicobar Island 33722 35294 36867 38265 39663 41060 42633
Andhra Pradesh 8188022 8273434 8357451 8440074 8521999 8602530 8681318
Arunachal Pradesh 98248 103459 108669 114127 119833 125788 131494
Assam 1070835 1100118 1129636 1159857 1190780 1222406 1253798
Bihar 1683954 1707378 1730148 1752590 1774376 1795671 1816639
Chandigarh 332473 348685 365154 381881 397321 411474 429744
Chhattisgarh 2111546 2169237 2228058 2287634 2347964 2409802 2470886
Dadra and Nagar Haveli 26083 28813 31542 34424 37305 40035 43219
Daman & Diu 9187 9316 9316 9445 9445 9575 9575
Delhi 3163430 3260984 3360874 3463999 3570716 3681745 3793313
Goa 154759 161494 168229 174815 180801 185741 192476
Gujarat 4662619 4759581 4856740 4954094 5051840 5149782 5245569
Haryana 3288292 3390907 3495059 3600364 3707207 3815202 3923582
Himachal Pradesh 87281 89143 91005 92983 94845 96707 98685
Jammu & Kashmir 494180 504243 514306 524369 534275 544180 553771
Jharkhand 931912 948949 966239 983530 1001202 1019382 1036673
Karnataka 3631147 3700490 3770161 3839998 3910162 3980656 4049341
Kerala 533278 536057 538776 541314 543671 545906 548021
Lakshadweep 1560 1560 1498 1435 1435 1435 1373
Madhya Pradesh 6393040 6523229 6654059 6785528 6917636 7050705 7181214
Maharashtra 18151071 18549628 18950624 19352665 19754009 20152914 20557046
Manipur 75197 75915 76514 76993 77592 78190 78789
Meghalaya 205176 208590 212003 215416 219209 222622 226415
Mizoram 105720 107700 109679 111659 113639 115619 117599
Nagaland 83220 84292 85365 86223 87295 88368 89226
Orissa 1736064 1770623 1805436 1840503 1876078 1912161 1948244
Puducherry 136899 143316 149876 156435 162282 167131 174118
Punjab 2798256 2864014 2930296 2996316 3062598 3128094 3193590

79
Rajasthan 3826160 3894590 3962311 4029561 4095395 4160049 4224939
Sikkim 13321 13803 14124 14605 14926 15408 15729
Tamil Nadu 8644892 8862969 9081045 9298651 9515080 9729624 9940165
Tripura 131080 134137 137003 140061 143118 146175 149232
Uttar Pradesh 10878336 11127210 11378552 11631376 11885434 12139739 12394291
Uttarakhand 826257 846181 866105 886615 906832 927342 947559
West Bengal 8546755 8640642 8733188 8825399 8918616 9014179 9106055
India 93055983 94977993 96907923 98845216 1.01E+08 1.03E+08 1.05E+08
Source: Report of the Committee on Slum Statistics and Census (2011)