wound healing in an in vitro bronchial epithelial cell...
TRANSCRIPT

Wound healing in an in vitro bronchialepithelial cell model
Master of Science Thesis
ANDREAS CARLSSON
Department of Applied Physics
Division of Biological Physics
Chalmers University of Technology
Gothenburg, Sweden, 2013


Wound healing in an in vitro bronchial epithelialcell model
ANDREAS CARLSSON
Department of Applied Physics
Chalmers University of Technology
Gothenburg, Sweden 2013

Wound healing in an in vitro bronchial epithelial cell modelANDREAS CARLSSON
c©ANDREAS CARLSSON, 2013
Department of Applied PhysicsChalmers University of TechnologySE-412 96 GoteborgSwedenTelephone +46 (0)31-772 1000
Cover: Primary normal human bronchial epithelial cell culture immunofluorescentstained for mucin (MUC5AC, red staining) and cilia (TUBB4, green staining).Image captured by confocal microscopy, magnification 40x.
Goteborg, Sweden 2013

Wound healing in an in vitro bronchial epithelial cell modelANDREAS CARLSSONDepartment of Applied PhysicsChalmers University of Technology
Abstract
The aim of this project was to investigate the potential use of differentiated primaryhuman bronchial epithelial cells in air liquid interface as a model for wound healingin vitro. Wounds were simulated by mechanical scratching and whole cigarette smokeexposure. The outcome of the project is aimed to increase the knowledge of primarybronchial epithelial cells in the respiratory research, the ability to use the model forwound healing studies and the potential use of the model for compound testing. Theprimary read-outs used to evaluate the model were real-time quantitative polymerasechain reaction, immunocytochemistry, live imaging, image analysis and trans epithelialelectrical resistance.
From this project primary human bronchial cell cultures were concluded to have a highrecovery potential to both scratch wounds and exposure of whole cigarette smoke. Thewound healing results obtained from this project were connected to previous describedtheories of in vivo wound healing and the major cell populations were observed to recoverover time. Cigarette smoke was observed to significant delay the wound healing of scratchwounded cell cultures, a feature used to investigate pharmaceutical compounds effect tomigration in the cell model. Treatment of three different compounds to the model in thisproject did not show any effect to the cell migration. Live imaging of scratch woundedcell cultures revealed a migration within the whole cell culture during wound healing.Surprisingly, non-wounded fully differentiated cell cultures showed a constant cellularmigration which, as to the writer’s knowledge, has not been previous reported.
Through this project a successful wound healing model was established using a combi-nation of read-outs. A model for cigarette smoke exposure of air liquid interface cultureswas performed and a window for compound treatment was discovered as a result of theimpact of cigarette smoke on cellular migration.
This project was performed in collaboration between Chalmers University of Technol-ogy and AstraZeneca R&D, at the section of Cell and Molecular Pharmacology withinthe department of Respiratory, Inflammation and Autoimmunity at AstraZeneca R&Dfacility in Molndal.
Keywords: Primary normal human bronchial epithelial cells, air liquid interface, wound
healing, ICC, real-time qPCR, live imaging, confocal microscopy, cigarette smoke.

Abbreviations
ALI Air liquid interface
cDNA Complementary DNA
CF Cystic fibrosis
COPD Chronic obstructive pulmonary disease
CPSS Clara cell secretory protein
CSC Cigarette smoke condensate
CSE Cigarette smoke extract
DAPI 4’,6-diamidino-2-phenylindole
DMEM Dulbecco’s Modified Eagle’s Medium
ECM Extracellular matrix
DNA Deoxyribonucleic acid
HBEC Human bronchial epithelial cells
ISO International Standards Organization
MMP Matrix metalloproteinase
mRNA Messenger RNA
NHBE Normal human bronchial epithelial
PBS Phosphate-Buffered Saline
RNA Ribonucleic acid
ROI Region of interest
TEER Trans epithelial electrical resistance
ZO Zonula Occludens

CONTENTS I
Contents
1 Introduction 11.0.1 Aim . . . . . . . . . . . . . . . . . . . . . . . . . . . . . . . 21.0.2 Outline . . . . . . . . . . . . . . . . . . . . . . . . . . . . . 21.0.3 AstraZeneca . . . . . . . . . . . . . . . . . . . . . . . . . . . 3
2 Theory 42.1 Human airway . . . . . . . . . . . . . . . . . . . . . . . . . . . . . . 4
2.1.1 Mucus producing cells . . . . . . . . . . . . . . . . . . . . . 52.1.2 Ciliated cells . . . . . . . . . . . . . . . . . . . . . . . . . . 62.1.3 Progenitor cells . . . . . . . . . . . . . . . . . . . . . . . . . 62.1.4 Basement membrane . . . . . . . . . . . . . . . . . . . . . . 72.1.5 Cell junctions . . . . . . . . . . . . . . . . . . . . . . . . . . 7
2.2 Airway diseases . . . . . . . . . . . . . . . . . . . . . . . . . . . . . 82.2.1 Damage to the epithelium . . . . . . . . . . . . . . . . . . . 82.2.2 Cigarette smoke impact . . . . . . . . . . . . . . . . . . . . 9
2.3 Airway wound healing . . . . . . . . . . . . . . . . . . . . . . . . . 92.4 In vitro models . . . . . . . . . . . . . . . . . . . . . . . . . . . . . 10
2.4.1 Cell cultures . . . . . . . . . . . . . . . . . . . . . . . . . . . 112.4.2 Wound healing models . . . . . . . . . . . . . . . . . . . . . 122.4.3 Smoke exposure techniques . . . . . . . . . . . . . . . . . . . 12
2.5 In vivo models . . . . . . . . . . . . . . . . . . . . . . . . . . . . . 13
3 Analytical procedures 143.1 Quantification of gene expression . . . . . . . . . . . . . . . . . . . 143.2 Quantification of protein expression . . . . . . . . . . . . . . . . . . 143.3 Trans epithelial electrical resistance . . . . . . . . . . . . . . . . . . 153.4 Live imaging . . . . . . . . . . . . . . . . . . . . . . . . . . . . . . . 16
4 Materials and methods 174.1 Normal human bronchial epithelial cells . . . . . . . . . . . . . . . . 17
4.1.1 Culture conditions . . . . . . . . . . . . . . . . . . . . . . . 174.2 Scratch wounds . . . . . . . . . . . . . . . . . . . . . . . . . . . . . 184.3 Trans epithelial electric resistance measurements . . . . . . . . . . . 184.4 Cell staining . . . . . . . . . . . . . . . . . . . . . . . . . . . . . . . 19
4.4.1 Cell fixation . . . . . . . . . . . . . . . . . . . . . . . . . . . 194.4.2 Embedding and sectioning . . . . . . . . . . . . . . . . . . . 194.4.3 Immunoperoxidase staining . . . . . . . . . . . . . . . . . . 194.4.4 Immunofluorescent staining . . . . . . . . . . . . . . . . . . 204.4.5 Hematoxylin/Eosin staining . . . . . . . . . . . . . . . . . . 20

CONTENTS II
4.4.6 Antibody evaluation . . . . . . . . . . . . . . . . . . . . . . 214.4.7 Antibody combinations - Scratch assay . . . . . . . . . . . . 224.4.8 Image capture and analysis . . . . . . . . . . . . . . . . . . 23
4.5 Gene expression . . . . . . . . . . . . . . . . . . . . . . . . . . . . . 244.5.1 Lysis of cell cultures . . . . . . . . . . . . . . . . . . . . . . 244.5.2 RNA purification . . . . . . . . . . . . . . . . . . . . . . . . 244.5.3 cDNA synthesis . . . . . . . . . . . . . . . . . . . . . . . . . 244.5.4 TaqMan assay . . . . . . . . . . . . . . . . . . . . . . . . . . 254.5.5 Gene expression assays . . . . . . . . . . . . . . . . . . . . . 254.5.6 Data analysis . . . . . . . . . . . . . . . . . . . . . . . . . . 27
4.6 Cell-IQ . . . . . . . . . . . . . . . . . . . . . . . . . . . . . . . . . . 284.7 Smoke exposure . . . . . . . . . . . . . . . . . . . . . . . . . . . . . 294.8 Compound treatment . . . . . . . . . . . . . . . . . . . . . . . . . . 30
5 Experimental plan 315.0.1 Method evaluation . . . . . . . . . . . . . . . . . . . . . . . 315.0.2 Scratch assay . . . . . . . . . . . . . . . . . . . . . . . . . . 315.0.3 Smoke assay . . . . . . . . . . . . . . . . . . . . . . . . . . . 325.0.4 Compound treatment . . . . . . . . . . . . . . . . . . . . . . 33
6 Results 356.1 Method evaluation . . . . . . . . . . . . . . . . . . . . . . . . . . . 35
6.1.1 Scratch wounds . . . . . . . . . . . . . . . . . . . . . . . . . 356.1.2 Antibody evaluation . . . . . . . . . . . . . . . . . . . . . . 376.1.3 Trans Epithelial Electrical Resistance . . . . . . . . . . . . . 436.1.4 Cell-IQ . . . . . . . . . . . . . . . . . . . . . . . . . . . . . . 436.1.5 Smoke exposure . . . . . . . . . . . . . . . . . . . . . . . . . 45
6.2 Scratch assay . . . . . . . . . . . . . . . . . . . . . . . . . . . . . . 456.2.1 Cell culturing . . . . . . . . . . . . . . . . . . . . . . . . . . 466.2.2 Physiological barriers . . . . . . . . . . . . . . . . . . . . . . 466.2.3 Cell migration . . . . . . . . . . . . . . . . . . . . . . . . . . 496.2.4 Cell proliferation . . . . . . . . . . . . . . . . . . . . . . . . 526.2.5 Cell populations . . . . . . . . . . . . . . . . . . . . . . . . . 53
6.3 Smoke assay . . . . . . . . . . . . . . . . . . . . . . . . . . . . . . . 566.3.1 Physiological barriers . . . . . . . . . . . . . . . . . . . . . . 576.3.2 Cell migration . . . . . . . . . . . . . . . . . . . . . . . . . . 586.3.3 Cell proliferation . . . . . . . . . . . . . . . . . . . . . . . . 596.3.4 Cellular stress response . . . . . . . . . . . . . . . . . . . . . 606.3.5 Cell populations . . . . . . . . . . . . . . . . . . . . . . . . . 61
6.4 Compound treatment . . . . . . . . . . . . . . . . . . . . . . . . . . 62

CONTENTS III
7 Discussion 657.1 Method evaluation . . . . . . . . . . . . . . . . . . . . . . . . . . . 65
7.1.1 Scratch wounds . . . . . . . . . . . . . . . . . . . . . . . . . 657.1.2 Antibody evaluation . . . . . . . . . . . . . . . . . . . . . . 667.1.3 Trans epithelial electrical resistance . . . . . . . . . . . . . . 677.1.4 Cell-IQ . . . . . . . . . . . . . . . . . . . . . . . . . . . . . . 677.1.5 Smoke exposure . . . . . . . . . . . . . . . . . . . . . . . . . 68
7.2 Scratch assay . . . . . . . . . . . . . . . . . . . . . . . . . . . . . . 687.3 Smoke assay . . . . . . . . . . . . . . . . . . . . . . . . . . . . . . . 727.4 Compound treatment . . . . . . . . . . . . . . . . . . . . . . . . . . 74
8 Conclusions 76
9 Future work 77
10 Acknowledgements 79
Bibliography 80
Appendices 89
Appendix A Media 89
Appendix B Dehydration of ALI cultures 91
Appendix C Mayers Htx/Eosin staining 92
Appendix D TaqMan 93D.1 RNA purification . . . . . . . . . . . . . . . . . . . . . . . . . . . . 93D.2 TaqMan assay mix . . . . . . . . . . . . . . . . . . . . . . . . . . . 94
Appendix E Antibody evaluation 95
Appendix F Compound treatment 97

1 Introduction 1
1 Introduction
Today there are a number of respiratory diseases causing suffering and death bythe human population. Global health issues such as chronic obstructive pulmonarydisease (COPD), asthma and cystic fibrosis (CF) are some of them. COPD caused5% of the global deaths in 2005 and estimations suggests that in the year of 2004,64 million people worldwide were suffering from COPD. Prediction made by theWorld Health Organization (WHO) predicts COPD alone to become the thirdleading cause of deaths by 2030 [1, 2]. Asthma, another global respiratory diseaseless lethal compared to COPD, are the largest non-communicable disease seenamong children. Estimations suggest that 235 million people suffers from asthmaaround the world today. Patients diagnosed with bronchial asthma have shownpresence of epithelial shedding in the airways, a condition causing disruption of theapical epithelial cell layer from the basal membrane, resulting in wounds and lossof epithelial integrity. Regardless of respiratory disease, a common consequenceis that the airway epithelium is exposed to damage or unfavourable conditionwhich eventually can cause harm to the respiratory system. Observations by bothasthmatics and COPD patients reveals a common feature of epithelium damagecausing chronic inflammation and hyperresponsiveness [3].
In order to assess disease stages associated with respiratory diseases such as asthmaand COPD, development of new and refining of existing in vitro models are of in-terest in the early development of pharmaceuticals. Although existing animalmodels are used in the respiratory research, there are issues introducing respira-tory diseases to them. By the human complexity, the human heterogeneity cannotbe reflected in existing animal models [4]. Development of new in vitro models,reflecting an in vivo state, could benefit the development of new drugs to respi-ratory diseases. Using complex cell systems could potentially reduce and to someextent replace animal testing by refinement of new upcoming compounds in drugdiscovery.
Through this project, primary normal human bronchial epithelial (NHBE) cellcultures have been cultured in an air liquid interface (ALI) in order to use fullydifferentiated airway epithelial cells, expressing both mucins and functional cilia,to evaluate a model for wound healing in vitro. The evaluated wound models weresimulated by mechanical scratching and exposure of whole cigarette smoke. TheALI cultures has been documented stable over time [5], suggesting the possibilityof monitoring the wound healing over time. In this project several readouts suchas real-time quantitative polymerase chain reaction (real-time qPCR), live imag-ing, immunocytochemistry (ICC), image analysis and trans epithelial electricalresistance (TEER) were used to follow the wound healing.

1 Introduction 2
1.0.1 Aim
The aim of the project was to establish and evaluate a wound healing assay re-flecting the bronchial epithelium of human airways. The wounds and damages tothe epithelial cell cultures were simulated by two methods, mechanical scratchingand exposure of whole cigarette smoke. Establishing a scratch assay, migrationand proliferation could be monitored, simulating wound healing. Establishing aprotocol for exposure of whole cigarette smoke could promote investigation of thedamage to the cell cultures caused by the cigarette smoke.
In order to analyse the models, multiple analysis methods were evaluated. Thiswork included establishing functional protocol for ICC, including evaluations ofmultiple antibodies for analysis of protein expression. Additional analysis meth-ods evaluated were the performance of live imaging, measurement of TEER andmeasurement of gene expressions by real-time qPCR. Using ALI cultures of NHBEcells, capable of expressing both mucins and functional cilia, a more in vivo-likemodel was assessed compared to existing submerged monolayer cultures. Thismodel could serve as a refined model, for the development of new pharmaceuticalsintended for distribution though the respiratory system, before entering animaltesting.
1.0.2 Outline
The project was divided into four parts; method evaluation, scratch assay, smokeassay and compound treatment. The initial part consisted of evaluating methodsused in the project followed by evaluation of scratch assay and smoke assay. In thelast part of the project, initial trials was performed assessing the effect of threein house AstraZeneca compounds using the scratch assay. Compound A and Bhave previous shown toxic effect in dog airway epithelium in vivo. Through thisinitial trial the outcome results could be compared against previous reported invivo data. A positive control substance C was assessed as well to compare anyimpact of the different compounds.
This project was performed during one year through a collaboration betweenChalmers University of Technology and AstraZeneca R&D, performed at the sec-tion of Cell and Molecular Pharmacology within the department of Respiratory,Inflammation and Autoimmunity at AstraZeneca R&D facility in Molndal.

1 Introduction 3
1.0.3 AstraZeneca
AstraZeneca, a global biopharmaceutical company operating in over 100 countries,specialising in discovery, development, manufacturing and marketing of medicineswithin six areas of health care: cardiovascular, gastrointestinal, infection, neu-roscience, oncology and respiratory and inflammation. The product portfolioof AstraZeneca contains products within all six areas, such as Symbicort R© andPulmicort R© within the health care area for respiratory and inflammation. As-traZeneca was formed through the merge of the Swedish company Astra AB andthe UK based company Zeneca Group PLC in 1999, with the headquarters todaylocated in London UK. Today AstraZeneca has approximately 51’700 employeesworld wide and recorded a revenue of $27.97 billions by 2012 [6].

2 Theory 4
2 Theory
2.1 Human airway
The human airway is divided into two major parts; upper- and lower respiratorysystem. The upper respiratory system consists of the nasal cavity and the pharynx,the lower respiratory system of the larynx, trachea, bronchi, respiratory bronchi-oles and alveolar ducts, see figure 1. The trachea, as well as the initial part ofthe bronchi, is composed of a protective mucous membrane and a pseudostratifiedcolumnar epithelium, consisting of three cell types; ciliated cells, goblet cells andbasal cells, see figure 2. In the lower part of the bronchi, the cell composition ischanged and forms a non-ciliated simple cuboidal epithelium containing ciliatedcells, Clara cells and basal cells. The most distal part, the alveolar duct, is com-posed of simple squamous epithelial cells consisting of alveolar type I and type IIcells [7, 8].
Larynx
Trachea
Bronchi Alveolarducts
Respiratorybronchioles
Figure 1: Illustration of the branching of the human airway, from the larynxto the alveolar ducts. Modified image adapted from Patrick J. Lynch, medical il-lustrator, http://en.wikipedia.org/wiki/File:Lungs diagram simple.svg, uploaded 4August 2010.
The epithelium, found lining the human airways, is one of the basic tissues inhumans forming the epidermis and lining the digestive and genitourinary system.

2.1 Human airway 5
Its function in the respiratory system is to serve as a barrier between the outerenvironment and the underlying tissue. Two striking features of epithelium arethe formation of tight junctions and its cell polarization. Depending on location,the epithelium is divided into different classes based on the morphology. Thetrachea and bronchi are composed of a pseudostratified columnar epithelium [8,9], characterized by a cell sheet where all cells have contact with the basementmembrane and some of the cells reaches the epithelium surface while others donot, see figure 2 [9].
Figure 2: Illustration of a pseudostratified columnar epithelium seen in tracheaand bronchi, consisting of three cell types; ciliated cells (marked as red cells), basalcells (marked as blue cells) and goblet cells (marked as green cells with black dotsrepresenting the mucins).
2.1.1 Mucus producing cells
The protecting mucus membrane, or mucus layer, located in the airway is se-creted by two different cell types, goblet cells located at the surface epitheliumand mucous cells located in the submucosal glands [10]. The goblet cell is locatedin both the upper and the lower respiratory system where approximately 25% ofthe cells forming the bronchial epithelium are goblet cells in humans. The gobletcell primary function is to produce mucins, heavy glucosylated proteins, onto theepithelial surface to form a liquid layer, up to 50 µm thick. This layer, knownas mucus, is in healthy persons composed of 97% water and 3% solid particlesin form of mucins, salts, lipids, cellular debris and other proteins. The mucus isdesigned to trap foreign particles, viruses and other toxins and by ciliary beatingand coughing transport it out of the respiratory system. The removal of mucusthrough cilia beating is known as mucociliary clearance, where mucus from theupper respiratory system is transported down to the pharynx and mucus from thelower respiratory system is transported up to the pharynx where it is swallowedor spitted out. Large amounts of mucus is produced daily and approximately 30ml of mucus is swallowed every day in healthy humans. There are seventeen genesfound encoding for human mucin proteins, where MUC5AC is produced mainly bythe goblet cell and MUC5B mainly by the submucosal gland [8, 11, 12].
2.1 Human airway 6
2.1.2 Ciliated cells
The mucociliary clearance performed by ciliated cells are found in the upper respi-ratory system, down to the start of the respiratory zone where the gas exchange isperformed. The transport of mucus is performed through cilia beating, a coordi-nated movement performed in the same direction with about 12 beats per second[13]. Ciliated cells express clusters of approximately 200 motile cilia, each with alength of about 7 µm and a diameter of 0.2-0.3 µm, at the cell surface towardsthe airway [11, 14, 15]. The cilia is a microtubule organelle consisting of tubulin,a structural protein with equal amounts of α and β monomers. There are sevendifferent β-tubulins in mammals, βI , βII , βIII , βIV a, βIV b, βV and βV I , wherethe cilia found in tracheal epithelium have the specific βIV isotype [16–18]. βIV
(TUBB4) is expressed as a cytoskeletal protein as well and has successfully beenused to stain and visualize the cilia of cultured airway epithelial cells [19].
The cilia is divided into two classes; primary and motile cilia, where motile cilia hasa functional movement in order to transport fluids, such as mucus in the airwaysor fluids in the fallopian tubes and brain ventricles. Primary cilia is nonmotileand its functions is still not fully understood, but hypothesised to act as chemicaland mechanical sensors [20]. Observations suggests motile ciliated cells to origi-nate from primary ciliated cells, where the transcription factor FOXJ1 has beenidentified to control the formation of motile cilia [14, 21].
The sperm, another cell type containing a functional motile organelle, has shownto contain a specific protein present in ciliated cells. Sperm protein 17 (SP17),found in both sperm and testis, has shown to be present in ciliated cells from invivo tissue samples of the larynx, trachea and lungs as well as in in vitro culturedairway epithelial cells [22, 23].
2.1.3 Progenitor cells
Depending of location in the human airway, different cell types are hypothesisedto act as the progenitor cell type. In the upper airway, in the trachea and largebronchi, located below the goblet and ciliated cells in the border to the basementmembrane, the basal cells are found. The basal cell, expressing tumour protein 63(p63), are thought of being the progenitor cell type responsible for proliferation anddifferentiation of goblet and ciliated cells [24, 25]. Further down the small airway, inthe lower part of the bronchi the Clara cells are thought of acting as the progenitorcell type [26]. Clara cells are a non-ciliated cell with the capability of secretinga surfactant, Clara cell secretory protein (CCSP), to the airway epithelium [27].In the most distal parts of the lung, the alveolar epithelium are thought to have

2.1 Human airway 7
their own progenitor cell type, the type II alveolar epithelial cell, which is able todifferentiate into type I alveolar cells [24].
In order to study cellular proliferation expression of several proliferation proteinscan be used, such as the KI-67 protein [28, 29] and the proliferating cell nuclearantigen (PCNA) protein [29], both detected in the nucleus of proliferating cells.KI-67 has shown to be expressed throughout the active phase of cell cycle (G1,S, G2 and mitosis) [28] while PCNA, together with DNA polymerase δ, is activeduring the cell cycle of proliferation [29].
2.1.4 Basement membrane
Beneath the airway epithelium, the supporting basement membrane is found, com-posed by a structure of collagen IV, fibronectin, laminin and glycosaminoglycans.Located deeper and further away from the epithelium, the composition of the base-ment membrane is changed to mainly contain collagen III. The thickness of themembrane is approximately 10 µm in healthy bronchi [24].
2.1.5 Cell junctions
The apical cells of the epithelium are connected to each other by three differenttypes of junctions; occluding junctions, anchoring junctions and communicatingjunctions [24]. The occluding junctions, known as tight junctions in vertebrae,forms a barrier separating the outer environment from the basal lamina and sealsadjacent cells together forming an impermeable barrier to macromolecules. Thetwo major transmembrane proteins in tight junctions are claudins and occludins.Claudins and occludins can be connected to intracellular proteins known as zonulaoccludens (ZO) to anchor the proteins to the cytoskeleton [13]. Claudins are re-sponsible for the permeability regulation between cells and occludins are part of theformation of new tight junctions. There are three different zonula occludens; ZO-1,ZO-2 and ZO-3, where ZO-1 activity is associated with high epithelial resistance[30].
Anchoring junctions are mainly divided into two different forms; adherent junctionsresponsible for cell-cell contacts through transmembrane proteins of the cadherinfamily and focal adhesions responsible for anchoring the cells to the ECM [13].The member of cadherin found in epithelial tissue is known as epithelial cadherin,or E-cadherin encoded by the CDH1 gene [31], important for proper tight junctionformation of airway epithelial cells [30].

2.2 Airway diseases 8
Gap junctions, 2-4 nm wide gaps formed by connexin proteins into small chan-nels, allows transport of inorganic ions and water soluble molecules between cells[13]. Cell-cell signalling through gap junctions in epithelial cells have been seenpromoted through mechanical stimulation, initiating Ca2+ waves spreading to ad-jacent cells to promote cell-cell communication [32].
2.2 Airway diseases
Today there are a number of respiratory diseases responsible for suffering anddeath of the human population such as asthma, COPD and emphysema. COPDis defined as “a preventable and treatable disease state characterized by airflowlimitation that is not fully reversible” [33]. The limitation of airflow is associatedto an abnormal inflammation response within the lungs, caused by toxic gases orparticles. Gases thought as the primary cause of the disease are tobacco smoke aswell as risk factors such as pollution from combustion of biomass for indoor heatingand cooking, work-related exposure of chemicals and dusts [33, 34]. The complexityof COPD causes it not to be assessed as a single disease, but a group of differentdiseases including chronic bronchitis and emphysema [8, 35]. Symptoms arisingfrom chronic bronchitis are such as cough, pulmonary hypertension and cyanosisas a response to intense secretion of mucus into the bronchi. Emphysema is causedof impaired oxygen uptake as a response to the destruction of the epithelium ofthe alveoli [8].
Asthma is classified a chronic respiratory disease characterized by inflammationand sensitivity to stimulus of different allergens causing airway hypersensitivity.Symptoms of swelling in the bronchi is also observed causing a reduction of air-flow to the lungs as a response to excessive mucus production or damage to theepithelium [8]. Asthma is, compared to COPD, not considered as deadly and canbe medicated to control inflammation and to suppress the swelling of the airways[36].
2.2.1 Damage to the epithelium
The airway epithelium serves as the first line of defence and protects the air-way against inhaled particles, pathogens and toxic chemicals [11]. The respirationcauses a constant exposure of potential dangerous materials such as toxic agents,microorganisms, viruses and pollutants as a healthy human inhales approximately12’000 litres of air every day [12]. Independent of the source of injury, causedby diseases or inhalation, the response could result in loss of epithelium integrity,

2.3 Airway wound healing 9
shedding of the epithelium or total denudation of the basal membrane [37]. Disrup-tion of epithelium from human airway have been observed in bronchial asthmaticsshowing presence of epithelial shedding. The injury of the shedding has shown tobe superficial as the shedding mainly contains columnar epithelial cells with lowamounts of basal cells, suggesting a disruption of goblet and ciliated cells [38].
2.2.2 Cigarette smoke impact
Not only does chronic exposure of cigarette smoke causes diseases such as COPDand bronchitis, but low doses can be seen promoting negatively signals in human.Cigarette smoke affects the respiratory system by narrowing the airways whichreduces the amount of oxygen reaching the lungs. The obstruction reduces theuptake of oxygen as well as the hemoglobin efficiency. At cellular level the smokeaffects the mucus producing cells by increase of mucus production and release[8, 39, 40], destroying the cilia causing impairment of the mucociliary clearance[8], decrease expression of epithelial cadherin [41] and induce disassembly of thighjunction proteins ZO-1 and occludin as well as delays the formation of new tightjunctions [42]. In vitro studies of airway epithelial cells exposed to cigarette smokehave shown large stress responses such as increase levels of heat shock protein70 kDa (HSP70B or HSPA6), DNA-damage-inducible transcript 3 (DDIT3) andthioredoxin reductase 1 (TXNRD1) [43]. Inflammatory responses from cigarettesmoke have been observed by increased levels of cytokines, such as interleukin-6(IL-6) and IL-8 [44]. IL-8 is released as a response to inflammatory stimuli, suchas cigarette smoke [45], causing accumulation of neutrophils to the exposed area[46]. Cigarette smoke has also shown to negatively affect the cellular proliferation[47].
2.3 Airway wound healing
The specific wound repairing processes of airway epithelium are today not fullyunderstood. Several methods, such as implanting human xenografts in nude micehave been used to study the wound healing processes [48]. Suggested processesof wound healing, can for simplicity be divided into four major steps; dedifferen-tiation, migration, proliferation and redifferentiation [49], see figure 3. Upon aninjury to the epithelium an acute inflammatory response is initiated and immunecells are located to the injured area. Cytokines, chemokines and growth factors arereleased in the area, as a part of the healing process, together with other factorsto promote cell migration [50]. The cells next to the wound edge starts to dedif-ferentiate and migrate, in order to cover the denuded wound area and establish a

2.4 In vitro models 10
confluent layer of undifferentiated cells. Once the wound is covered, cells in thewound area starts to proliferate forming a cuboidal stratified cell layer which, asthe healing continuous, changes and forms into a pseudostratified cell layer. Thelast step in the healing process involves redifferentiation of the undifferentiatedcells, establishing a fully functional epithelium [48, 49].
(a) Normal (b) Wound (c) Dedifferentiation
(d) Migration (e) Proliferation (f) Redifferentiation
Figure 3: Epithelial wound healing illustrated through four steps. As a normalepithelium is introduced to a wound, cells adjacent to the wound edge will startto dedifferentiate (cells shown in yellow) and migrate (cells shown in orange) tothe wounded area to form an epithelial barrier to the underlying tissue. Once thewound area is covered, cells will start to proliferate (cells shown in pink) and finallyredifferentiate to establish a fully functional epithelium.
The cellular migration seen in wound healing have been linked to MMP-9, a matrixmetalloproteinase (MMP), in airway epithelium. In vitro studies suggest involve-ment of MMP-9 to the migration and differentiation during re-epithelization ofthe airway epithelium [48]. MMPs, a family of extracellular endopeptidases orig-inally considered as a family of extracellular enzymes controlling the degradationof ECM, possesses the ability to alter the affinity of cell-cell interactions. MMP-9is considered to be a weak collagenase and involved in promoting cell migration inairway epithelium [51]. In vitro studies of both HBEC and human nasal epithelialcells (HNEC) reveals an increased expression of MMP-9 during wound healing.The increased levels of MMP-9 has predominant been observed in migrating cellsadjacent to wound edges [52, 53].
2.4 In vitro models
To assess disease stages associated with respiratory diseases, the development ofnew and refinement of existing in vitro models are of interest. Today the existing

2.4 In vitro models 11
animal models used in respiratory research suffers the ability to introduce diseasessuch as COPD and asthma on to them.
2.4.1 Cell cultures
To assess problems and investigate disease stages in vitro, different cell models areavailable from different areas of the respiratory tract. Cell cultures available formodulating the respiratory regions are found from the of nasal, tracheal, bronchialand alveolar area. Cell cultures are available both as immortalised cell lines andas primary cells. Bronchial epithelial cells available as immortalised cell lines aresuch as Calu-3 (carcinoma cells), 16HBE14− (transformed cells) and BEAS-2Bcells (transformed cells). Primary cells are found as NHBE cells from healthydonors as well as epithelial cells from COPD and asthmatic donors. Depending onexperimental design, nasal, tracheal and bronchial epithelial cells can be culturedin an air liquid interface to mimic more in vivo like conditions [54].
The use of primary cells or immortalized cell lines has both benefits and limita-tions. Primary cells has the advantage of a closer representation of an in vivosituation, expressing both mucus producing cells and functional cilia in combina-tion of high TEER values and consistent mRNA and protein expressions. Thevariation between cell donors, cell passage and experiments leads to the need ofstable protocols. The primary cells are more expensive, harder to manipulate andaccesses a limited cell source compared to immortalized cell lines. [19, 55].
Mimicking the in vivo situation, using in vitro models, ALI cell cultures possessesmultiple benefits as a model. ALI cultures of human bronchial epithelial cells areable to differentiate and mature, containing large amounts of functional ciliatedcells [22], goblet cells producing mucus onto the air milieu and basal cells. Ep-ithelial cells are initially seeded in a submerged condition and transferred to anair liquid interface once the cells are confluent, see figure 4. The exposure of airto the cells, in combination with retionic acid containing culture medium, triggersthe differentiation of different cell types, formation of tight junctions and pseudos-tratification of the cell layer. Compared to submerged monolayer cultures, ALIcultures possesses a more in vivo like state with the ability of aerosol stimulation,with potential of evaluating pharmacological compounds for distrubution throughthe airway as well as irritants and toxic compounds. ALI cultures also possessesthe possibility to culture epithelial cells in co-cultures with other cell types suchas fibroblasts or immune cells to promote an even more in vivo like model [54].

2.4 In vitro models 12
(a) Submerged culture (b) ALI culture
Figure 4: Cultivation of epithelial cells are initially performed in a submerged con-dition. Once the cells are confluent and covers the growth area to 100%, the cultureis transferred to an air liquid interface (ALI) by removal of the apical medium. Theexposure of air to the apical compartment triggers the differentiation of the epithelialcells into different cell types, formation of tight junctions and pseudostratificationof the cell layer.
The human in vivo situation compared to in vitro models of airway epithelium haveshown large similarities. Investigation of a total of 158 genes connected to ciliated,basal and secretory cells using 358 probe sets showed similar expression profiles to81% of the expressed genes. ALI cultures showed differences in higher expressionof basal cell markers and proliferation markers compared to the in vivo samples,which had higher expression of ciliated cell markers and markers connected to thecytoskeleton and immune responses [56].
2.4.2 Wound healing models
Wound healing models of airway epithelial cells have been documented successfullyused, with both submerged and ALI cultures. Scratch assays are commonly usedto introduce wounds [52, 57–61] as well as other similar techniques such as celldetachment through NaOH exposure [53, 62] and cell removal by high air pressure[63] in order to assess wound healing properties of cell cultures.
2.4.3 Smoke exposure techniques
Models simulating the effects of cigarette smoke to cell cultures have been per-formed through different techniques. Cigarette smoke, composed of several thou-sand different components [64], distributed approximately by a 6.5% particle phaseand a 93.5% vapour phase [65]. To submerged cell cultures stimulation of cigarette

2.5 In vivo models 13
smoke is commonly distributed through culture medium containing diluted cigarettesmoke, either by cigarette smoke extract (CSE) [39–42, 66, 67] or cigarette smokecondensate (CSC) [68, 69]. CSE is usually prepared by bubbling cigarette smokethrough culture medium and thereby representing the vapour phase. CSC is pre-pared by extracting the particulate matter from smoked cigarette in DMSO fol-lowed by dilution in culture medium, thereby representing the particle phase. TheCSE and CSC are diluted in desirable concentration and used to expose the cellculture during a defined period of time.
Techniques to simulate the behaviour of cigarette smoking more closely to thein vivo situation can be performed by exposure of whole cigarette smoke to ALIcultures, using smoking robots such as the Vitrocell VC10 [70] or the BorgwaldtRM20S [71]. A predefined set up, according to International Standards Organi-zation (ISO), 35 ml of smoke is taken during two seconds every one minute tosimulate in vivo smoking conditions [43, 71, 72]. Smoking machines such as theBorgwaldt RM20S enable the possibility to reproduce smoke exposure experimentsover different time periods with specific determined smoke dilutions. The deviceis automatic and is able to load, light and extract burned out cigarettes, and canbe used for chronic and prolonged smoking experiments [72].
2.5 In vivo models
In vitro models are often evaluated before experiments are performed in in vivomodels, using laboratory animals, in the pharmaceutical industry. Animals used asin vivo models do possess differences between animals and humans. Lung structuresuch as the structure of mice, differs from humans as well as the cell compositionbetween the two species. The tracheal epithelial cell structure in mice is composedof large parts of ciliated cells and Clara cells, while the Clara cells are found inthe distal bronchial airways in humans. The mucus producing submucosal glands,located both in the upper and lower airways in humans, are present only in theupper parts of the trachea in mice [37]. In healthy humans, the protective mucuslayer covering the airway is produced by goblet cells (MUC5AC) and submucosalglands (MUC5B), while in mice almost no Muc5ac is produced. The airways ofmice are more similar to the structure of the lower airway in humans [11]. Alter-natives to use animal models in more refined ways are through human xenograftmodels. Using airway epithelial xenografts in mice, the maturation and regenera-tion of human airway can closely be studied to better understand wound healing[37].

3 Analytical procedures 14
3 Analytical procedures
In order to follow cellular changes through gene expression, protein expressionand non invasive techniques, different analysis tools can be adapted. This lasttheoretical part will describe different available readouts used to investigate cellularbehaviour throughout the project.
3.1 Quantification of gene expression
Real-time quantitative polymerase chain reaction (qPCR) was used to evaluatethe expression of different genes. To perform qPCR, collected mRNA samples istranscribed into single stranded cDNA through reverse-transcription polymerasechain reaction (RT-PCR). cDNA is used as template to perform qPCR. Addingfluorophore labelled probes, specific to the gene or target sequence of interest, eachPCR cycle will cleave a certain amount of fluorophores, emitting light at a specifiedwavelength. The emitting light is measured when reaching over a predeterminebaseline set to separate background noise from a correct signal. If the targetsequence is highly expressed in the sample, the emitting light will reach the baselineby fewer PCR cycles compared to a low expressed target, allowing determinationin real time during each PCR cycle [73].
In this project, TaqMan assays were used with qPCR to quantify different geneexpressions. Based on the Taq polymerase and dual-labelled fluorescent probes,TaqMan assays have been shown to be a fast, reliable and reproducible technique[74].
3.2 Quantification of protein expression
Analysis and quantification of protein expression within cell samples can be adaptedby immunocytochemistry techniques. Specific proteins can be targeted and markedwith fluorescent labelled antibodies and the fluorescent signal can be measuredthrough image analysis, allowing determination of protein changes over time.
To determine the functionality and specificity of an antibody, all antibodies used inthe project were evaluated through immunoperoxidase staining in sectioned epithe-lial cell cultures. Visual localization of the antibody in the cell culture determinedits specificity. Functional antibodies, determined by the evaluation, were laterused by immunocytochemistry methods to detect specific proteins in fixated cellcultures. Using image analysis tools to captured images of stained cell cultures,

3.3 Trans epithelial electrical resistance 15
measurements of percent stained area of each sample could be determined. Thecell cultures were seen sensitive to mechanical strain and cells were seen detachedfrom the supporting membrane holding the culture during permanent mountingto microscope glass. To avoid inaccurate measurements of amount stained area,measurements were conducted to different regions of interest (ROI’s) within eachcell culture to gain more accurate data. The ROI’s were manually determinedthrough visual inspection of each cell membrane analysed.
3.3 Trans epithelial electrical resistance
Validating the health of epithelial cell cultures, a non-invasive technique known asTrans Epithelial Electrical Resistance (TEER) was used. The technique relies onmeasuring the resistance of an electric current travelling across the cell culture.Epithelial cells are linked together by formation of tight junctions, forming animpermeable barrier to macromolecules. The TEER technique uses an electric re-sistance meeter to measure the electrical resistance between an upper and a lowerliquid filled compartment, usually filled with PBS or culture medium, where themembrane containing the epithelial cell culture separates the two compartments[54], see figure 5. The plasma membrane of the epithelial cells has documented highresistance and the measured resistance is reflecting the current travelling throughthe tight junctions as a result of its ionic permeability [75]. Fully differentiatedHBEC cultures expresses tight junctions with high resistance, reaching normal val-ues between 200-1000 Ω·cm2 [54].
Figure 5: Illustration of the TEER set up. The epithelial cell culture, submerged inPBS or culture medium, is placed between two electrodes during the measurement.

3.4 Live imaging 16
3.4 Live imaging
Live imaging, a non-invasive method, was used to track the cellular migrationwithin the cell cultures. Using the Cell-IQ system (CM Technologies, Tampere,Finland), two culture plates could be monitored simultaneous in a system combin-ing the environment of an incubator with a automated phase-contrast microscopy.The on build software allowed specific areas of interest within the cell cultures to beselected for continuing imaging. Captured images were at a final stage merged intovideos to visualize cellular movements and could be analysed to measure cellularmigration over time.

4 Materials and methods 17
4 Materials and methods
The project was, as previous described, divided into four different parts; methodevaluation, scratch assay, smoke assay and compound treatment. The methodevaluation was conducted in the beginning of the project spanning over a largepart of the total work. All methods were evaluated before starting the scratchassay. Following section will describe the materials and methods used during theproject.
4.1 Normal human bronchial epithelial cells
Primary NHBE cells (Lonza, Basel, Switzerland) isolated from the epithelial celllayer lining the airway directly above the bifurcation of the lungs were receivedat passage 1. Three different cell donors were used, see table 1. All donors werescreened for cancerous tissue and diseases directly affecting the lungs1.
Table 1: NHBE cell donors used during the project.
Donor Batch number Age Sex Race Smoker
1849 231849 32 Male Caucasian No
4449 244449 60 Male Caucasian No
12240 4F0786 17 Male Caucasian No
4.1.1 Culture conditions
NHBE cells (Lonza, CC-2540), expanded2 to passage 2 (1’000’000 cells/ml), wereseeded on collagen coated, 1:100 volume/volume PureCol (Advanced BioMatrix,5005-B)/ddH2O, Transwell permeable polyester membrane inserts in 24 well plates(Corning, 3470). Cells were plated at a concentration of 30’000 cells/cm2 inNHBE medium, a mixture of BEBM (Lonza, CC-3171) and BEGM SingleQuotKit (Lonza, CC-4175). When reached confluence the immersed culture was trans-ferred, by removal of the apical medium, to an air liquid interface in ALI medium,a mixture of BEBM (Lonza, CC-3171), BEGM SingleQuot Kit (Lonza, CC-4175),
1Information provided by Lonza.2Passage 1 cells were expanded to passage 2 by Cecilia Forss, Senior Research Scientist,
AstraZeneca R&D Molndal.

4.2 Scratch wounds 18
1.5 mg/ml BSA (Sigma, A9418), 0.1 mM Retinoic acid (Sigma, R2625), DMEM(Gibco, 41965-039), 100 mM Minimum Essential Medium Sodium Pyruvate (Gibco,11360-039), 200 mM L-Glutamine (Gibco, 25030-024) and Minimum EssentialMedium Non-Essential Amino Acids (Gibco, 11140-035). Lists of media and spe-cific medium content can be seen in Appendix A. Medium was changed everysecond or third day. In connection to medium change, the produced mucus wasgently removed through aspiration. Cell cultures were held in a controlled environ-ment at 37C, 5% CO2 and 95% rH during cultivation and were let to differentiateapproximately 28 days before experimentation.
4.2 Scratch wounds
Scratch wounds were introduced to cell cultures by scratching with glass Pasteurpipettes connected to 0.6 bar vacuum. Cell debris were removed by washing cul-tures with 37C PBS (Gibco, 10010-015).
4.3 Trans epithelial electric resistance measurements
Trans epithelial electrical resistance was monitored with EVOM2 Epithelial Voltohm-meter (World Precision Instruments Inc., Sarasota, FL, USA) connected to STX2Chopstick Electrode (World Precision Instruments Inc.) or Endohm 6 mm Cul-ture Cup (World Precision Instruments Inc.). The measurements were conductedadjacent to the medium change to minimize environmental changes for the cellcultures. The devices were, prior to the measurements, cleaned with ethanol andPBS (Gibco, 10010-015). Prior to measurement, cell cultures were washed with37C PBS (Gibco, 10010-015), followed by a short incubation (2-3 minutes) in37C PBS (Gibco, 10010-015) in both the apical and basolateral compartment.TEER values were collected in triplicates for each culture investigated. To decidethe resistance of the cell culture, TEER values were collected in triplicates for ablank Transwell insert containing no cells and subtracted from TEER values fromcell cultures according to equations 1-3.
RMean cell culture =R Cell culture + R Cell culture + R Cell culture
3(1)
RMean blank membrane =R Blank membrane + R Blank membrane + R Blank membrane
3(2)

4.4 Cell staining 19
R True cell culture = RMean cell culture − RMean blank membrane (3)
4.4 Cell staining
Following section will cover the staining procedure from cell fixation to differ-ent staining methods, description of antibodies evaluated, the set up of antibodycombinations and data analysis of immunofluorescent samples collected throughconfocal microscopy to determine the protein expression.
4.4.1 Cell fixation
Cell cultures were fixated in 4% paraformaldehyde (PFA) (HistoLab, 02176) for 20minutes. The removal of PFA was followed by washing with PBS (Gibco, 10010-015). Cell cultures were kept in PBS (Gibco, 10010-015) at 4C until forthcominganalysis.
4.4.2 Embedding and sectioning
Membranes were cut loose using 6 mm biopsy punches (Integra Miltex, PA, USA).Membranes were dehydrated with the tissue processor Microm STP 120 (MICROMInternational GmbH, Walldorf, Germany) according to protocol, see Appendix B.Membranes were cut in half and embedded in paraffin. A Leica RM2165 mictro-tome (Leica, Copenhagen, Denmark) was used to obtain 0.3 µm slices mounted onmicroscope slides.
4.4.3 Immunoperoxidase staining
Microscope slides containing cell culture sections were dewaxed and rehydratedin xylene and in graded ethanol solutions (99.5%, 95%, 70% and 50%). Detec-tion of antigens were improved by incubation with Dako Target Retrieval Solution(Dako, S1699) at 96C. Endogenous peroxides were blocked by incubation with1% hydrogen peroxide (H2O2) (AppliChem, A0626,0250) in methanol. Avidin andbiotin binding sites were blocked using Streptavidin/Biotin Blocking Kit (VectorLaboratories, SP-2002) and background staining was reduced by blocking unspe-cific bindings with block buffer; 1% BSA (Sigma, A9418), 5% Goat serum (VectorLaboratories, S-1000) and 0.05% Tween-20 (Sigma, P1379) in PBS (Gibco, 10010-015). Primary antibodies were diluted (1-2 µg/ml) in block buffer and incubated

4.4 Cell staining 20
for 1-2 hours at room temperature or over night at 4C followed by incubation withbiotinylated secondary antibody, 0.67 µg/ml diluted in block buffer, for 60 min-utes. Biotinylated secondary antibodies were treated with avidin-biotin complexthrough R.T.U. Vectastain Elite ABC-Peroxidase Reagent (Vector Laboratories,PK-7100) and visualized through staining with ImmPACT NovaRED (Vector Lab-oratories, SK-4805). Counter staining was performed in hemotoxlin. Samples weredehydrated in graded ethanol (80%, 95% and 99.5%) and in xylene prior to perma-nent mounting in VectaMount Permanent Mounting Medium (Vector Laboratories,H-5000).
Negative controls were performed by incubation of IgG antibodies, see table 5, fromthe same host as the intended primary antibody and with the same concentration.
4.4.4 Immunofluorescent staining
Cell cultures were permeabilized with 0.25% Triton X-100 (Sigma, T-6878) in PBS(Gibco, 10010-015) for 20 minutes. Background staining was reduced by blockingunspecific bindings with block buffer; 2.5% BSA (Sigma, A9418), 5% Goat serum(Vector Laboratories, S-1000) and 0.05% Tween-20 (Sigma, P1379) in PBS (Gibco,10010-015) for 30 minutes. Primary antibodies were diluted to 1 µg/ml in blockingbuffer and incubated with cells for 60 minutes. Secondary fluorescent labelledantibodies were diluted to 0.5-1 µg/ml in PBS and incubated for 30 minutes.Cell cultures were permanently mounted onto microscope slides with VectashieldMounting Medium with DAPI (Vector Laboratories, H-1200) and sealed with coverglass and nail polish. Samples were stored in -20C until visualization.
In cases of signal enhancement, the previous description was slightly modified.Primary antibody incubation was followed with incubation of biotinylated IgGantibody, 0.67 µg/ml in block buffer. Visualization of the antibody was performedusing a strepavidin conjugated fluorescent antibody, 0.5-1 µg/ml in PBS (Gibco,10010-015).
Negative controls were performed by incubation of IgG antibodies, see table 5, fromthe same host as the intended primary antibody and with the same concentration.
4.4.5 Hematoxylin/Eosin staining
Microscope slides containing samples of cell culture sections were stained accordingto Mayers hematoxylin/Eosin protocol, see Appendix C, using an automatic slidestainer, Sakura DRS 601 Diversified Stainer (Sakura Finetek USA, Inc., Torrence,CA, USA).

4.4 Cell staining 21
4.4.6 Antibody evaluation
To visualize cell types and cell markers, antibodies were tested both through im-munoperoxidase and immunofluorescent staining. Evaluated antibodies can beseen in table 2.
Table 2: Antibodies evaluated during the project for visualization of cell typesand cell markers. Documented use of individual antibodies can be seen in the rightcolumn.
Antigen (Supplier) Target Host/Isotype Clonality Ref.
β-Tubulin (Abcam, ab6046) Cilia Rabbit IgG Polyclonal [76]
CCSP (Aviva, ARP41524) Clara cells Rabbit IgG Polyclonal
FoxJ1 (Antibodies, ABIN734288) Ciliated cells Rabbit IgG Polyclonal
FoxJ1 (eBioscience, 14-9965) Ciliated cells Mouse IgG1 Monoclonal [77]
FoxJ1 (Sigma, HPA005714) Ciliated cells Rabbit IgG Polyclonal
KI-67 (Dako, M7240) Proliferation Mouse IgG1 Monoclonal
MUC5AC (Abcam, ab3649) Goblet cells Mouse IgG1κ Monoclonal [78, 79]
MUC5AC (Thermo, MS145-P1) Goblet cells Mouse IgG1κ Monoclonal [80]
p63 (Abcam, ab53039) Basal cells Rabbit IgG Polyclonal
p63 (Atlas Antibodies, HPA006288) Basal cells Rabbit IgG Polyclonal
p63 (R&D Systems, MAB1916) Basal cells Mouse IgG2β Monoclonal
p63 (Santa Cruz, sc-8343) Basal cells Rabbit IgG Polyclonal [81]
SP17 (Biorbyt, orb100865) Cilia Rabbit IgG Polyclonal
SP17 (Sigma, HPA037568) Cilia Rabbit IgG Polyclonal
TUBB4 (Abcam, ab119254) Cilia Mouse IgG2β Monoclonal
TUBB4 (GeneTex, GTX102095) Cilia Rabbit IgG Polyclonal
TUBB4 (Novous, NBP2-00927) Cilia Mouse IgG2β Monoclonal
TUBB4 (Thermo, PA5-21416) Cilia Rabbit IgG Polyclonal
ZO-1 (Abcam, ab59720) Tight junctions Rabbit IgG Polyclonal [78]
ZO-1 (BD, 610966) Tight junctions Mouse IgG1 Monoclonal [82]
ZO-1 (Invitrogen, 33-9100) Tight junctions Mouse IgG1κ Monoclonal [78]
ZO-1 (Invitrogen, 61-7300) Tight junctions Rabbit IgG Polyclonal [83]
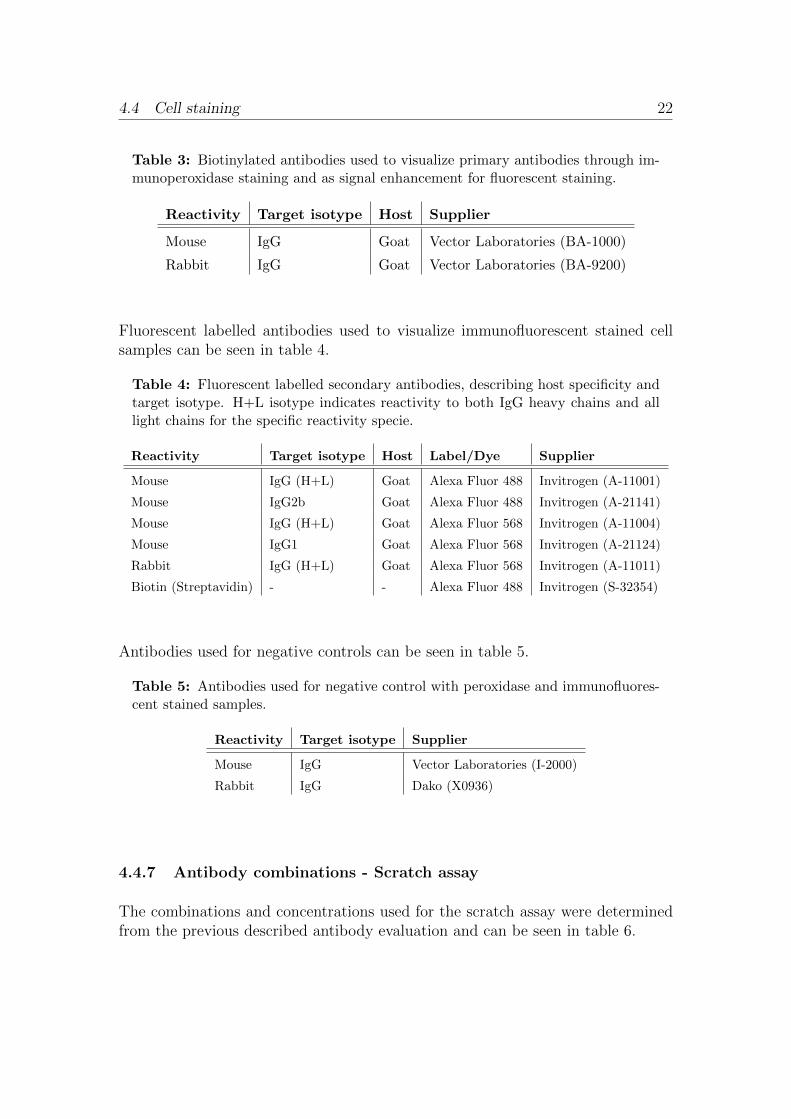
Biotinylated antibodies used to visualization of immunoperoxidase stained samplesand for signal enhancement of fluorescent stained samples can be seen in table 3.
4.4 Cell staining 22
Table 3: Biotinylated antibodies used to visualize primary antibodies through im-munoperoxidase staining and as signal enhancement for fluorescent staining.
Reactivity Target isotype Host Supplier
Mouse IgG Goat Vector Laboratories (BA-1000)
Rabbit IgG Goat Vector Laboratories (BA-9200)
Fluorescent labelled antibodies used to visualize immunofluorescent stained cellsamples can be seen in table 4.
Table 4: Fluorescent labelled secondary antibodies, describing host specificity andtarget isotype. H+L isotype indicates reactivity to both IgG heavy chains and alllight chains for the specific reactivity specie.
Reactivity Target isotype Host Label/Dye Supplier
Mouse IgG (H+L) Goat Alexa Fluor 488 Invitrogen (A-11001)
Mouse IgG2b Goat Alexa Fluor 488 Invitrogen (A-21141)
Mouse IgG (H+L) Goat Alexa Fluor 568 Invitrogen (A-11004)
Mouse IgG1 Goat Alexa Fluor 568 Invitrogen (A-21124)
Rabbit IgG (H+L) Goat Alexa Fluor 568 Invitrogen (A-11011)
Biotin (Streptavidin) - - Alexa Fluor 488 Invitrogen (S-32354)
Antibodies used for negative controls can be seen in table 5.
Table 5: Antibodies used for negative control with peroxidase and immunofluores-cent stained samples.
Reactivity Target isotype Supplier
Mouse IgG Vector Laboratories (I-2000)
Rabbit IgG Dako (X0936)
4.4.7 Antibody combinations - Scratch assay
The combinations and concentrations used for the scratch assay were determinedfrom the previous described antibody evaluation and can be seen in table 6.

4.4 Cell staining 23
Table 6: Combinations of antibodies used in the scratch assay to perform dou-ble staining. The secondary antibodies are presented with concentration used inparenthesis.
Combination Primary antibody Primary antibodyconcentration
Secondary antibody
1 FOXJ1 (eBioscience) 3 µg/ml 568 Mouse IgG1 (1 µg/ml)
1 TUBB4 (Novus) 1 µg/ml 488 Mouse IgG2b (0.5 µg/ml)
2 MUC5AC (Thermo) 1 µg/ml 568 Mouse IgG1 (0.5 µg/ml)
2 TUBB4 (Novus) 1 µg/ml 488 Mouse IgG2b (0.5 µg/ml)
3 p63 (Atlas Antibodies) 3 µg/ml 488 Strep.av. (0.8 µg/ml)
3 KI-67 (Dako) 1 µg/ml 568 Mouse IgG (H+L) (1 µg/ml)
4 ZO-1 (BD) 1 µg/ml 488 Strep.av. (1 µg/ml)
4 p63 (Santa Cruz) 1 µg/ml 568 Rabbit IgG (1 µg/ml)
4.4.8 Image capture and analysis
Image analysis were performed on immunofluorescent stained cell cultures in thescratch assay using confocal microscopy to capture images of the different samplesand staining. A Nikon Eclipse 90i (Nikon Corporation, Tokyo, Japan) confocalunit was used with supplied EZ-C1 software Gold version 3.50, build 724 (NikonCorporation, Tokyo, Japan). Settings used for visualization of double staining wereset according to table 7. Image capture was conducted using a plan apochromat10.0x/0.45/4.00 dry objective and a plan apochromat 40.0x/0.95/0.14 correctionring spring-loaded, CGC 0.11-0.23 mm objective. The offset was set to 127, dwelltime to 1.68 µs and a 30 µm pinhole was used.
Table 7: Setting used in the EZ-C1 software controlling the confocal unit. The fourdouble staining combinations previous described were set using individual gains foreach fluorophore. The coverage of the image area in relation to total membrane areais shown in parenthesis.
Combination Gain 488 Gain 568 Zoom (Coverage)
1 99 73 10x (5%)
2 88 73 10x (5%)
3 100 83 10x (5%)
4 87 - 40x (0.3%)
Three images were collected for each sample. Image analysis was performed using

4.5 Gene expression 24
the image software ImageJ3 with the extension4 of ”LOCI Tools” allowing ImageJto operate the Nikon .ids image file format. Each image was analysed by selectingthree regions of interest (ROI). These ROI’s were placed at different areas, tryingto cover all aspects characterizing the image. The three specific ROI’s were usedfor analysing all images from all co-combinations, allowing analysis of 60% of theimage.
4.5 Gene expression
Following section describes the procedure used to investigate gene expressionswithin the cell cultures, starting with cell preparation and purification of mRNAto the different gene assays used and data analysis.
4.5.1 Lysis of cell cultures
Upon sample taking, cells were washed once in PBS (Gibco, 10010-015) and put onwet ice. Cells were lysed in 200 µl 1:1 volume/volume Total RNA Lysis Solution(Applied Biosystems, 4305895)/PBS (Gibco, 10010-015). The lysed cell sampleswere transferred to Eppendorf tube on dry ice and stored in -80C until RNApurification.
4.5.2 RNA purification
Lysed cell samples were loaded on to a 96 well Total RNA Purification tray (Ap-plied Biosystems, 4305673) fitted on a ABI Prism 6100 Nucleic Acid PrepStation(Applied Biosystems, Foster City, CA, USA). RNA purification was performed ac-cording to protocol from Applied Biosystem, see table D1 in Appendix D. Collectedsamples were stored in 96 well plates in -80C upon cDNA synthesis.
4.5.3 cDNA synthesis
Using a High Capacity cDNA Reverse Transcription Kit (Applied Biosystems,4368813) according to protocol from Applied Biosystems, a 2x RT master mix wasprepared on ice. Containing 2.0 µl 10x RT Buffer (Applied Biosystems, 4319981),
3Schneider C.A., Rasband W.S. and Eliceiri K.W. NIH Image to ImageJ: 25 years of imageanalysis. Nature Methods, 2012. 9(7):671-675.
4Found at Open Microscopy Environment web page; http://www.openmicroscopy.org/

4.5 Gene expression 25
0.8 µl 25x dNTP Mix (100mM) (Applied Biosystems, 362271), 2.0 µl 10x RT Ran-dom Primers (Applied Biosystems, 4319979), 1.0 µl MultiScribe Reverse Tran-scripase (Applied Biosystems, 4319983) and 4.2 µl nuclease-free water, for eachreaction. For negative controls, MultiScribe Reverse Transcriptase was replacedwith nuclease-free water.
RNA samples were transferred to a nuclease-free 96 well plate and mixed withequal amounts of 2x RT master mix to a final volume of 20 µl/reaction. ThecDNA synthesis was performed using a PCR cycler, Veriti 96 well Thermal Cycler(Applied Biosystems, Foster City, CA, USA), programmed according to AppliedBiosystems starting with incubation in 25C for 10 minutes followed by 37C for120 minutes and 85C for 5 minutes. cDNA samples were stored in -20C untilTaqMan experiments.
4.5.4 TaqMan assay
cDNA samples were diluted to 1-3 ng/ml. Assay mixes were prepared accord-ing to protocol from Applied Biosystems, see table D2 in Appendix D. Samplesof 3 µl diluted cDNA and 7 µl assay mix were transferred to a MicroAmp Op-tical 384-Well Reaction Plate (Applied Biosystems, 4309849). Negative controlswere mixed using 3 µl nuclease-free water and 7 µl assay mix. Plates were sealedwith MicroAmp Optical Adhesive Film (Applied Biosystems, 4311971). Quantita-tive real-time PCRs were performed using ABI Prism 7900HT Sequence DetectionSystem (Applied Biosystems, Foster City, CA, USA). Samples were analysed sep-arately with its own baseline to ensure amplification of a specific product usingABI Prism 7900HT SDS software (Applied Biosystems, Foster City, CA, USA. Athreshold cycle value (CT -value) was calculated from the software comparing atwhat specific PCR cycle the reporter dye exceed a baseline set automatic by thesoftware.
4.5.5 Gene expression assays
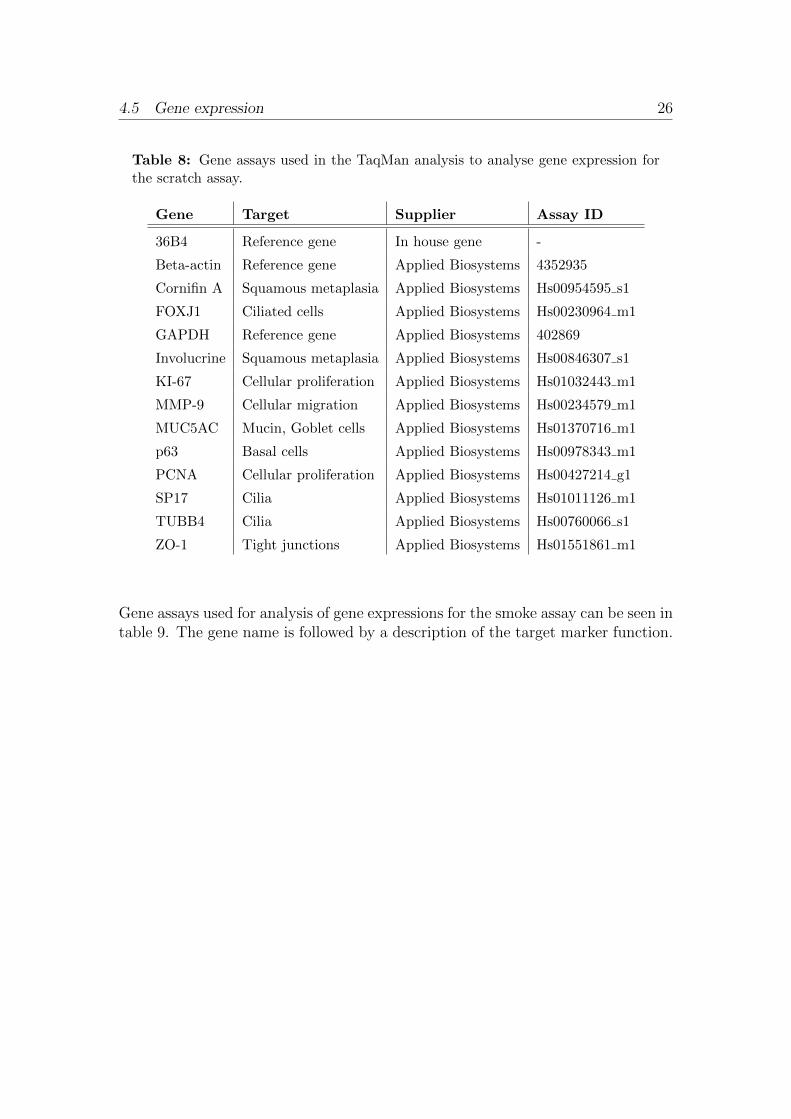
Gene assays used for analysis of gene expression for the scratch assay can be seen intable 8. The gene name is followed by a description of the target marker function.
4.5 Gene expression 26
Table 8: Gene assays used in the TaqMan analysis to analyse gene expression forthe scratch assay.
Gene Target Supplier Assay ID
36B4 Reference gene In house gene -
Beta-actin Reference gene Applied Biosystems 4352935
Cornifin A Squamous metaplasia Applied Biosystems Hs00954595 s1
FOXJ1 Ciliated cells Applied Biosystems Hs00230964 m1
GAPDH Reference gene Applied Biosystems 402869
Involucrine Squamous metaplasia Applied Biosystems Hs00846307 s1
KI-67 Cellular proliferation Applied Biosystems Hs01032443 m1
MMP-9 Cellular migration Applied Biosystems Hs00234579 m1
MUC5AC Mucin, Goblet cells Applied Biosystems Hs01370716 m1
p63 Basal cells Applied Biosystems Hs00978343 m1
PCNA Cellular proliferation Applied Biosystems Hs00427214 g1
SP17 Cilia Applied Biosystems Hs01011126 m1
TUBB4 Cilia Applied Biosystems Hs00760066 s1
ZO-1 Tight junctions Applied Biosystems Hs01551861 m1
Gene assays used for analysis of gene expressions for the smoke assay can be seen intable 9. The gene name is followed by a description of the target marker function.

4.5 Gene expression 27
Table 9: Gene assays used in the TaqMan analysis to analyse gene expression forthe smoke assay.
Gene Target Supplier Assay ID
36B4 Reference gene In house gene -
Beta-actin Reference gene Applied Biosystems 4352935
Caspase-3 Cell apoptosis Applied Biosystems Hs00234387 m1
CDH1 Cell-cell adhesion Applied Biosystems Hs01023894 m1
DDIT3 Stress response Applied Biosystems Hs01090850 m1
FOXJ1 Ciliated cells Applied Biosystems Hs00230964 m1
GAPDH Reference gene Applied Biosystems 402869
HSPA6 Stress response Applied Biosystems Hs00275682 s1
IL-8 Interleukin 8 Applied Biosystems Hs00174103 m1
KI-67 Cellular proliferation Applied Biosystems Hs01032443 m1
MMP-9 Cellular migration Applied Biosystems Hs00234579 m1
MUC5AC Mucin, Goblet cells Applied Biosystems Hs01370716 m1
p63 Basal cells Applied Biosystems Hs00978343 m1
TXNRD1 Stress response Applied Biosystems Hs00182418 m1
ZO-1 Tight junctions Applied Biosystems Hs01551861 m1
4.5.6 Data analysis
Acquired CT -values were normalized by subtracting the CT -value from a geometricmean of the three reference genes (CT reference
) from the CT -values from the geneof interest (CT target), see equation (4).
∆CT target = CT target − CT reference(4)
To calculate the fold change, the CT -value from a null value is subtracted fromevery CT -value followed by insertion of the ∆∆CT -value in equation (6).
∆∆CT target = ∆CT target −∆CT null sample(5)
2−∆∆CT target (6)

4.6 Cell-IQ 28
From each technical triplicate an average fold change are calculated and plottedwith errorbars shown through standard error of the mean (SEM), see equation (7).
SEx =s√n
(7)
where:
s is the sample standard deviationn is the number of samples
4.6 Cell-IQ
Cell behaviours and movements, visualization of wound closure and analysis wereconducted using the Cell-IQ system (CM Technologies, Tampere, Finland). Tran-swell 24 well plates used during cell cultivation were filled with 700 µl ALI mediumto all wells and samples were preferable placed in the middle of the plate to ensureas little evaporation of medium as possible during image capture. Following theplate preparation, the plate lid was changed to Cell-Secure lid (ChipMan, 44003)designed with inlet and outlet gas connectors. To the gas outlet Acrodisc CR 13mmsyringe filter with PTFE membrane (PALL, 4423) was mounted to ensure sterilityand the lid was sealed to the plate with non coloured adhesive tape. The plate wasmounted into one of the two sliding plate holders inside the Cell-IQ incubator andconnected the inlet to the gas supply. Using the supplied Cell-IQ Imagen software(CM Technologies, Tampere, Finland) image z-stack were set to 17.6 µm, imageexposure to 5 ms and gas inlet to 6 ml/minute distributed in a repeated cyclewith 15 minutes of gassing followed by 30 minutes with no gas. Image capture wasset to continuous image recording and was let to record until manually stopped.Medium change was performed accordingly to any other cell culture and the imagecapture was temporarily paused. Imagining of wound healing was captured with aCFI Plan Fluorescence DL10x (Nikon Corporation, Tokyo, Japan) objective, witha grid of 3×3 images chosen in the middle of the well. To visualize the whole wella grid of 9×9 images could be used.
The image analysis, with supplied Cell-IQ Analyser (CM Technologies, Tampere,Finland), was performed by merging the grids into one single image. As the largeimages generates large amount of data to analyse, all images were compressed to40% of its original size. By manually generate samples of images to the Cell-IQAnalyser software, libraries were build containing approximately 1600-3000 imagesdisplaying cell layers and the wound, simulated by the membrane. During analysis,

4.7 Smoke exposure 29
each image was compared to the library resulting in data displaying the amountof area covered with cells versus the area of the wound.
4.7 Smoke exposure
Cigarette smoke was generated through Borgwaldt RM20S R© (Borgwaldt KC GmbH,Hamburg, Germany) smoking machine. According to protocol supplied by Borg-waldt, the Borgwaldt RM20S machine was let to warm up for 20 minutes followedby functional calibration. Calibration was conducted before every smoke experi-ments where the airflow through the machine was set to 20 cm/s and puff volumeto 35 ml. Leakage test was conducted on all cigarette holders to ensure no leakagein the system. Whole cigarette smoke was generated from Kentucky Reference2R4F cigarettes (University of Kentucky, Lexington, KY, USA). Diluted cigarettesmoke was generated according to international smoking standards with a 35 mlsmoke puff drawn over a time of two seconds every one minute. Transwell insertscontaining differentiated NHBE cells were mounted into sterile whole smoke expo-sure chambers (British American Tobacco, patent publication No.WO 03/100417)under sterile conditions.
A modified model based on previous publication [71] was used, where the wholesmoke exposure chambers were connected to the Borgwaldt RM20S smoking ma-chine and a culture medium feeding system according to figure 6a. Peristalticpumps were used to deliver fresh medium into the chambers and to remove oldmedium. Up to four chambers, each containing up to eight inserts in air liquidinterface seen in figure 6b, were able to be smoked during one session. DMEM(Gibco, 41965-039) was used as culture medium and was continuously fed intothe basolateral compartment to keep cell cultures in air liquid interface. Culturemedium and chambers were held at 37C during smoke exposure experiments.
Evaluation of cigarette smoke to NHBE cell cultures was conducted at four dif-ferent smoke dilutions; 1:5, 1:10, 1:20 and 1:50 volume/volume smoke/air. Smokeexperiments were conducted during 30 minutes with DMEM (Gibco, 41965-039)fed at 10 ml/minute and chamber.
The smoke assay were conducted by exposure of 1:50 volume/volume smoke/airdilution for 30 minutes, with DMEM (Gibco, 41965-039) feed at 10 ml/minute andchamber.

4.8 Compound treatment 30
Smoke machine
Culture medium
Waste
Exhaust value
1
2
3
4
(a) Illustration of the smoke exposure set up.Numbered circles are used to donate the fourdifferent exposure chambers.
Smoke in Medium out
Medium in
Smoke out
NHBE cells Transwell insert Culture medium
(b) Illustrative cross section of anexposure chamber describing thedifferent flows and medium posi-tion to Transwell inserts. Mediumand smoke are countercurrent feedin this model.
Figure 6: Schematic figures of the smoke exposure set up and the exposure cham-ber.
4.8 Compound treatment
AstraZeneca R&D in house compounds A, B and positive control C were useddiluted in sterile DMSO (Sigma, D2438) in the three concentrations 0.1 µM, 1 µMand 10 µM. Differentiated NHBE cell cultures were treated, after scratch woundedaccording to previous described method, with 20 µl of compound applied apically.

5 Experimental plan 31
5 Experimental plan
Following the method evaluation, experimental plans for the scratch assay andsmoke assay were established. At a final stage of the project the scratch assaywas used to perform one last experiment, the compound treatment, using threedifferent AstraZeneca compounds to study their effect to wound healing.
5.0.1 Method evaluation
During the method evaluation different methods and techniques to introduce re-producible scratch wounds, using tools such as pipette tips and cell scrapers, wereevaluated. Two different measuring devices for TEER measurements were evalu-ated on one cell donor.
Antibodies presented in table 2 were evaluated through two techniques; immunoper-oxidase staining of sectionized NHBE cell cultures in order to distinguish the lo-calization of binding sites and immunofluorescent staining on whole NHBE cellcultures to investigate potential use for image analysis. Potential double staining,using combinations of two different secondary antibodies, were evaluated throughimmunofluorescent staining on whole NHBE cell culture.
The Cell-IQ system was investigated to monitor and analyse cell migration anddetermine wound closure of scratch wounded cell cultures.
Four different cigarette smoke dilutions; 1:5, 1:10, 1:20 and 1:50 volume/volumesmoke/air, were evaluated to NHBE cell cultures.
5.0.2 Scratch assay
The wound healing process of scratch wounded cell cultures were investigatedmainly through four different read outs; formation of physiological barriers (TEERmeasurements), cell migration (Cell-IQ analysis), gene expression (TaqMan anal-ysis) and protein expression (immunofluorescent staining). Samples were collectedat eight different time points according to table 10. The assay was conducted threetimes, each time on a different donor. The three donors used are shown in table 1.
The TEER measurements were performed at the same culture inserts throughoutthe whole study, from day one in ALI until the end if the experiment. Cell-IQanalysis were conducted on scratch wounded cultures and monitored during oneweek. Investigated gene expressions by TaqMan analysis can be seen in table 8.
5 Experimental plan 32
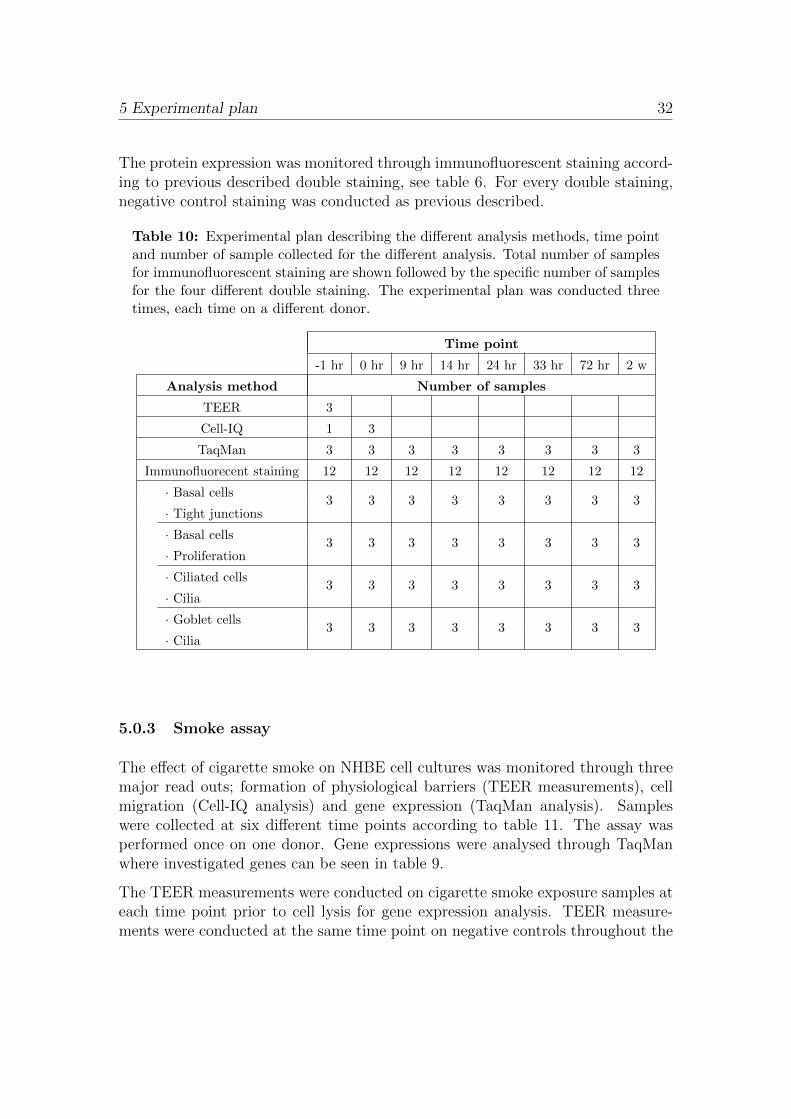
The protein expression was monitored through immunofluorescent staining accord-ing to previous described double staining, see table 6. For every double staining,negative control staining was conducted as previous described.
Table 10: Experimental plan describing the different analysis methods, time pointand number of sample collected for the different analysis. Total number of samplesfor immunofluorescent staining are shown followed by the specific number of samplesfor the four different double staining. The experimental plan was conducted threetimes, each time on a different donor.
Time point
-1 hr 0 hr 9 hr 14 hr 24 hr 33 hr 72 hr 2 w
Analysis method Number of samples
TEER 3
Cell-IQ 1 3
TaqMan 3 3 3 3 3 3 3 3
Immunofluorecent staining 12 12 12 12 12 12 12 12
· Basal cells3 3 3 3 3 3 3 3
· Tight junctions
· Basal cells3 3 3 3 3 3 3 3
· Proliferation
· Ciliated cells3 3 3 3 3 3 3 3
· Cilia
· Goblet cells3 3 3 3 3 3 3 3
· Cilia
5.0.3 Smoke assay
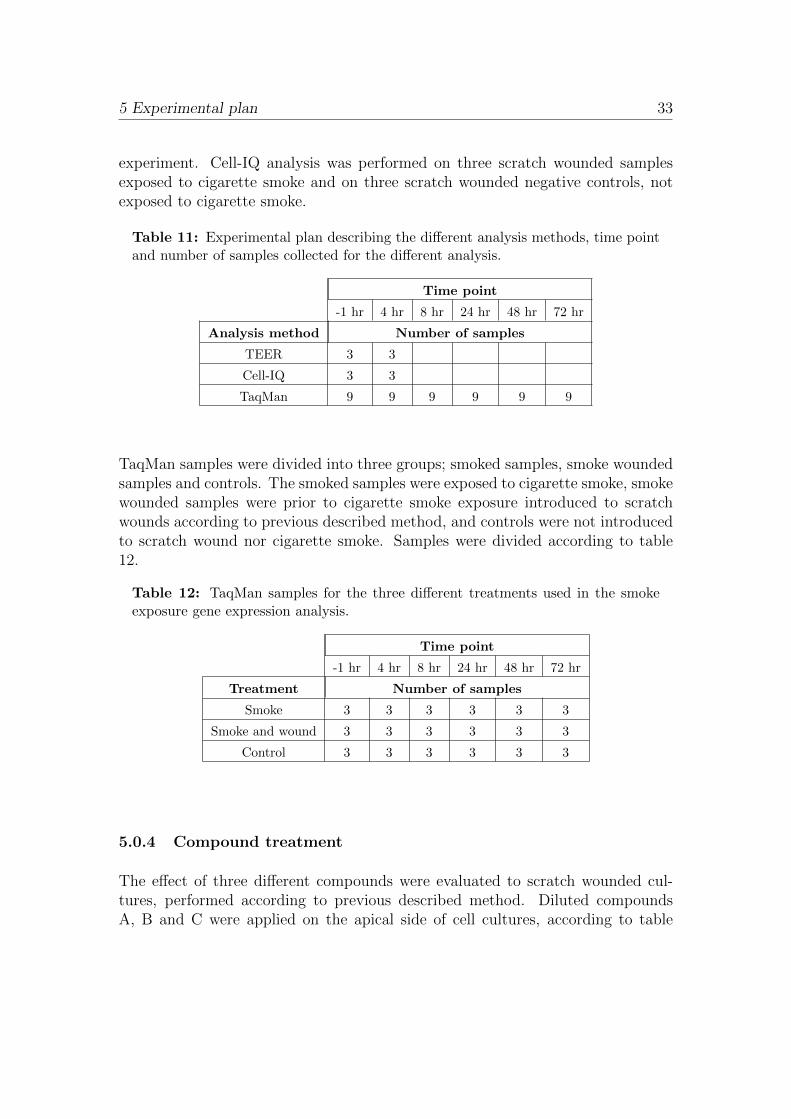
The effect of cigarette smoke on NHBE cell cultures was monitored through threemajor read outs; formation of physiological barriers (TEER measurements), cellmigration (Cell-IQ analysis) and gene expression (TaqMan analysis). Sampleswere collected at six different time points according to table 11. The assay wasperformed once on one donor. Gene expressions were analysed through TaqManwhere investigated genes can be seen in table 9.
The TEER measurements were conducted on cigarette smoke exposure samples ateach time point prior to cell lysis for gene expression analysis. TEER measure-ments were conducted at the same time point on negative controls throughout the
5 Experimental plan 33
experiment. Cell-IQ analysis was performed on three scratch wounded samplesexposed to cigarette smoke and on three scratch wounded negative controls, notexposed to cigarette smoke.
Table 11: Experimental plan describing the different analysis methods, time pointand number of samples collected for the different analysis.
Time point
-1 hr 4 hr 8 hr 24 hr 48 hr 72 hr
Analysis method Number of samples
TEER 3 3
Cell-IQ 3 3
TaqMan 9 9 9 9 9 9
TaqMan samples were divided into three groups; smoked samples, smoke woundedsamples and controls. The smoked samples were exposed to cigarette smoke, smokewounded samples were prior to cigarette smoke exposure introduced to scratchwounds according to previous described method, and controls were not introducedto scratch wound nor cigarette smoke. Samples were divided according to table12.
Table 12: TaqMan samples for the three different treatments used in the smokeexposure gene expression analysis.
Time point
-1 hr 4 hr 8 hr 24 hr 48 hr 72 hr
Treatment Number of samples
Smoke 3 3 3 3 3 3
Smoke and wound 3 3 3 3 3 3
Control 3 3 3 3 3 3
5.0.4 Compound treatment
The effect of three different compounds were evaluated to scratch wounded cul-tures, performed according to previous described method. Diluted compoundsA, B and C were applied on the apical side of cell cultures, according to table
5 Experimental plan 34
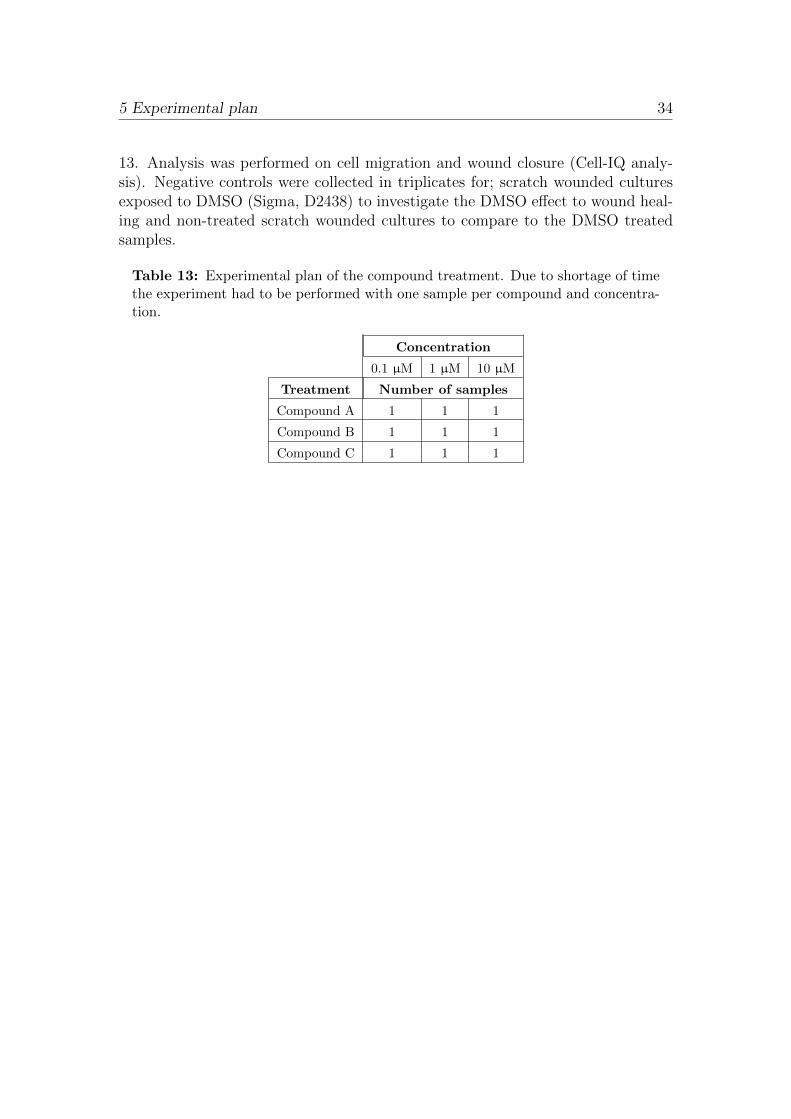
13. Analysis was performed on cell migration and wound closure (Cell-IQ analy-sis). Negative controls were collected in triplicates for; scratch wounded culturesexposed to DMSO (Sigma, D2438) to investigate the DMSO effect to wound heal-ing and non-treated scratch wounded cultures to compare to the DMSO treatedsamples.
Table 13: Experimental plan of the compound treatment. Due to shortage of timethe experiment had to be performed with one sample per compound and concentra-tion.
Concentration
0.1 µM 1 µM 10 µM
Treatment Number of samples
Compound A 1 1 1
Compound B 1 1 1
Compound C 1 1 1

6 Results 35
6 Results
The project was, as previous described, divided into four different parts; methodevaluation, scratch assay, smoke assay and compound treatment. The results arepresented, divided into the four parts, in following section.
6.1 Method evaluation
The methods used in the scratch assay and smoke assay were evaluated and testedin order to reproduce the experiment throughout the different parts of the project.Result from the evaluation influencing the oncoming project parts are visualizedin the following section.
6.1.1 Scratch wounds
Through investigation of different tools to produce scratch wounds in the cellcultures, it was concluded that small hand-held tools were easier handled andcontrolled. By using plastic pipette tips in different sizes (100 µl, 300 µl and1000 µl), it was seen that scratch wounds were lined by bankings of cells alongthe wound edge, see figure 7a. More over, the pipette tips produced an irregularwound shape hard to reproduce.
Using glass Pasteur pipettes did, in comparison to plastic pipette tips, not causeany bankings of cells along the wound edge and resulted in a sharp clean cutwith a more constant wound shape with a fixed width, see fig 7b. Connectingthe Paster pipette to a vacuum suction pump and applying a constant vacuumduring the scratching, the removal of cells from the membrane were enhanced andaggregation of cells at the end of the scratch wound were reduced.

6.1 Method evaluation 36
(a) 1000 µl plastic pipette. (b) Pasteur pipette.
Figure 7: Evaluation of scratch wounds by two types of pipettes.
Scratches produced by Pasteur pipettes were measured through image analysis andwere concluded to have an average width of 1.4 mm. Membrane area cleared of cellsfrom this scratch technique was estimated through calculations and measurementsto be 27% of the total culture area, see figure 8.
Figure 8: Scratch wounded cell culture.

6.1 Method evaluation 37
Studying scratch wounds produced by Pasteur pipettes in microscope revealeddamage to the membrane below the cell cultures. The depth and width of amembrane scratch was investigated by sectioning the membrane perpendicular tothe scratch. Sections were visualized and investigated in bright field microscope,showing a destruction in the membrane, see figure 9.
Figure 9: Section visualizing damage to the membrane caused by a Pasteur pipetteduring scratching.
6.1.2 Antibody evaluation
The antibody evaluation was as previously described divided into two parts. Theinitial part demonstrating the localisation of antibody binding to the NHBE cellculture by immunoperoxidase staining of culture sections. The later part demon-strate immunofluorescent staining of whole NHBE cell cultures.
The immunoperoxidase staining with antibodies specific to NHBE cell cultures canbe seen in figure 10. Positive staining are shown in red while the counter stainingare visualized in light blue representing non-stained areas.
The three major cell types, ciliated cells, goblet cells and basal cells were visualizedthrough enzymatic staining as seen in figure 10. Ciliated cells were visualized bystaining of FOXJ1 (eBioscience), see figure 10a. Red staining can be seen locatedin the nucleus of cells expressing cilia on the apical side. Staining of the cilia
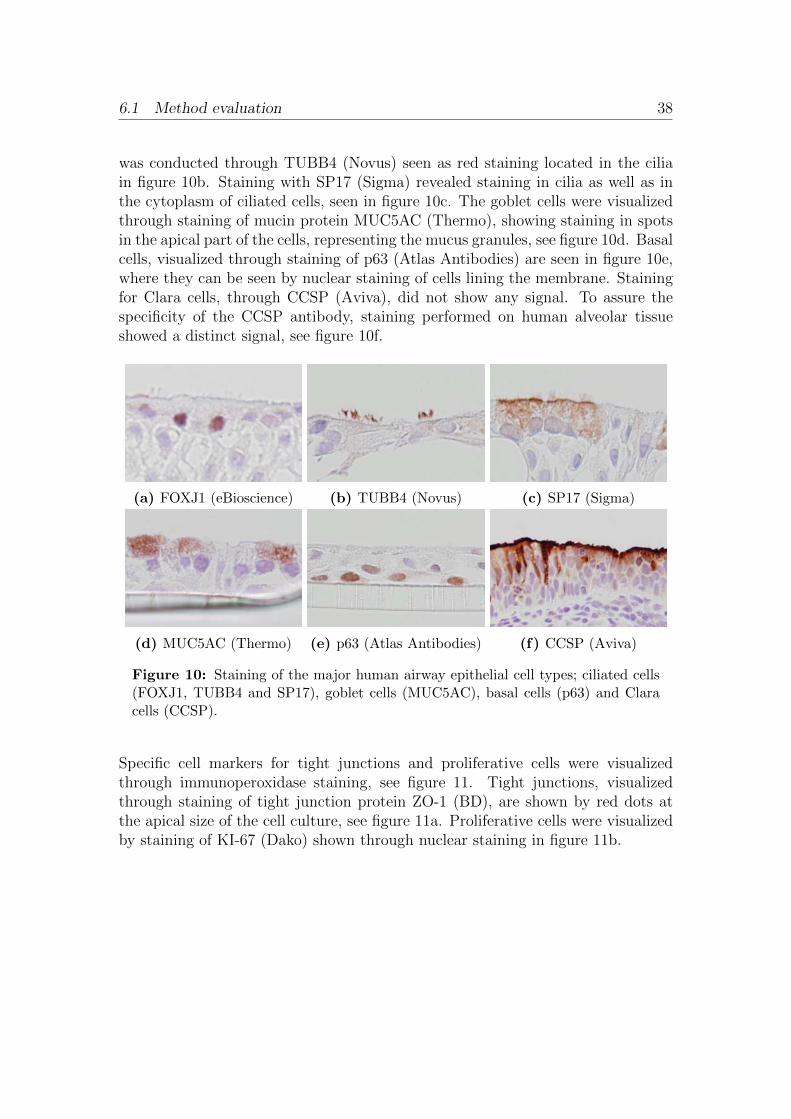
6.1 Method evaluation 38
was conducted through TUBB4 (Novus) seen as red staining located in the ciliain figure 10b. Staining with SP17 (Sigma) revealed staining in cilia as well as inthe cytoplasm of ciliated cells, seen in figure 10c. The goblet cells were visualizedthrough staining of mucin protein MUC5AC (Thermo), showing staining in spotsin the apical part of the cells, representing the mucus granules, see figure 10d. Basalcells, visualized through staining of p63 (Atlas Antibodies) are seen in figure 10e,where they can be seen by nuclear staining of cells lining the membrane. Stainingfor Clara cells, through CCSP (Aviva), did not show any signal. To assure thespecificity of the CCSP antibody, staining performed on human alveolar tissueshowed a distinct signal, see figure 10f.
(a) FOXJ1 (eBioscience) (b) TUBB4 (Novus) (c) SP17 (Sigma)
(d) MUC5AC (Thermo) (e) p63 (Atlas Antibodies) (f) CCSP (Aviva)
Figure 10: Staining of the major human airway epithelial cell types; ciliated cells(FOXJ1, TUBB4 and SP17), goblet cells (MUC5AC), basal cells (p63) and Claracells (CCSP).
Specific cell markers for tight junctions and proliferative cells were visualizedthrough immunoperoxidase staining, see figure 11. Tight junctions, visualizedthrough staining of tight junction protein ZO-1 (BD), are shown by red dots atthe apical size of the cell culture, see figure 11a. Proliferative cells were visualizedby staining of KI-67 (Dako) shown through nuclear staining in figure 11b.

6.1 Method evaluation 39
(a) ZO-1 (BD) (b) KI-67 (Dako)
Figure 11: Staining of tight junctions (ZO-1) and proliferative cells (KI-67).
The result from the antibody evaluation through immunoperoxidase staining canbe seen in table 14. Antibodies resulting in insufficient staining, either by non-specific staining or no staining, were not further used in the project.
Table 14: Results from antibodies evaluated through immunoperoxidase staining.
Antigen (Supplier) Target Comment to staining
β-Tubulin (Abcam, ab6046) Cilia Non-specific staining (whole cell)
CCSP (Aviva, ARP41524) Clara cells No signal in NHBE cell cultures
FoxJ1 (Antibodies, ABIN734288) Ciliated cells No signal
FoxJ1 (eBioscience, 14-9965) Ciliated cells See figure 10a
FoxJ1 (Sigma, HPA005714) Ciliated cells Non-specific staining (whole cell)
KI-67 (Dako, M7240) Proliferation See figure 11b
MUC5AC (Abcam, ab3649) Goblet cells Staining comparable to figure 10d
MUC5AC (Thermo, MS145-P1) Goblet cells See figure 10d
p63 (Abcam, ab53039) Basal cells Non-specific staining (basal cells and cilia)
p63 (Atlas Antibodies, HPA006288) Basal cells See figure 10e
p63 (R&D Systems, MAB1916) Basal cells No signal
p63 (Santa Cruz, sc-8343) Basal cells Staining comparable to figure 10e
SP17 (Biorbyt, orb100865) Cilia Non-specific staining (whole cell)
SP17 (Sigma, HPA037568) Cilia See figure 10c
TUBB4 (Abcam, ab119254) Cilia No signal
TUBB4 (GeneTex, GTX102095) Cilia No signal
TUBB4 (Novous, NBP2-00927) Cilia See figure 10b
TUBB4 (Thermo, PA5-21416) Cilia No signal
ZO-1 (Abcam, ab59720) Tight junctions No signal
ZO-1 (BD, 610966) Tight junctions See figure 11a
ZO-1 (Invitrogen, 33-9100) Tight junctions No signal
ZO-1 (Invitrogen, 61-7300) Tight junctions No signal
Antibodies specific to desired cell type or cell marker were investigated by im-

6.1 Method evaluation 40
munofluorescent staining of whole cell cultures. Immunofluorescent staining ofciliated cells can be seen in figure 12a, where nuclear staining through FOXJ1(eBioscience) are seen in red and cilia through TUBB4 (Novus) in green. Struc-tural visualization of cilia can be seen at 60 times magnification in figure 12b.Visualization of cilia could also be seen by SP17 (Sigma), see figure E1 in Ap-pendix E.
(a) FOXJ1 (red) and TUBB4 (green) (b) TUBB4
Figure 12: Immunofluorescent staining of ciliated cells through nuclear staining byFOXJ1 and staining of tubulin in cilia by TUBB4.
Basal cells were stained through p63 (Atlas Antibodies) to cultures fixated at day7 and day 39. Positive stained basal cells are seen in samples from day 7 comparedto day 39 in figure 13, where basal cells are seen in pink and all cell nucleus areseen in blue through DAPI staining. Sample from day 7 were seen having a largeramount of positive stained cells compared to day 39. Basal cells were also seenusing p63 (Santa Cruz), see figure E2 in Appendix E.

6.1 Method evaluation 41
(a) Day 7 in ALI (b) Day 39 in ALI
Figure 13: Immunofluorescent staining of basal cells through p63 (pink) togetherwith DAPI (blue) for visualization of cell nucleus.
Visualization of tight junction protein ZO-1 (BD) was possible to distinguish fromthe background staining, using a biotinylated enhancement step, as a green meshpattern seen in figure 14a together with cell nucleus seen in blue through DAPIstaining. The formation of tight junction protein ZO-1 from culture cultivated for7 days in ALI can be seen in figure 14b, where only sporadic meshed pattern couldbe found.
(a) ZO-1, day 30 (b) ZO-1 day 7
Figure 14: Immunofluorescent staining of tight junction protein ZO-1 (green) to-gether with DAPI (blue) for visualization of cell nucleus.

6.1 Method evaluation 42
Goblet cells were stained through MUC5AC (Thermo), seen in green in figure15a. Visualization of proliferative cells through KI-67 (Dako) can be seen in redin figure 15b together with basal cells, through p63 (Atlas Antibodies), in green.Cells shown in orange or yellow were both positively stained with p63 and KI-67.
(a) MUC5AC (b) KI-67 (red/yellow) and p63 (green)
Figure 15: Immunofluorescent staining of goblet cells (MUC5AC), proliferativecells (KI-67) and basal cells (p63).
Different double staining combinations were discovered where two different markerscould be used to analyse one cell population. Possible combinations of doublestainings investigated can be seen in table 15.
Table 15: Possible double staining investigated.
Target Primary Antibody Primary Antibody
Mucins and cilia MUC5AC (Thermo) TUBB4 (Novus)
Mucins and cilia MUC5AC (Thermo) SP17 (Sigma)
Cilia and ciliated cells TUBB4 (Novus) FOXJ1 (eBioscience)
Basal cells and proliferative cells p63 (Atlas Antibodies) KI-67 (Dako)
Basal cells and tight junctions p63 (Santa Cruz) ZO-1 (BD)

6.1 Method evaluation 43
6.1.3 Trans Epithelial Electrical Resistance
Evaluation of two different measuring devices, chop sticks and EndOhm, wereperformed during the scratch assay for donor 1849. The differences between thetwo devices are seen in figure 16, showing no significant difference between the twodevices.
Figure 16: Evaluation of the two measuring devices, STX2 Chopsticks and En-dohm, during differentiation and wound healing of donor 1849.
6.1.4 Cell-IQ
Using the Cell-IQ system over time did not seem to induce changes to the cellcultures, as the mucus production and TEER were compared similar to controls.Using continuous imaging, movements were seen within the cell culture and themigration could be analysed.
Images obtained during cell migration of scratch wounded cell cultures were anal-ysed with the Cell-IQ analyser software. The analysis can be seen in figure 17where a red mask was applied to the cell layer of each image. Figure 17 demon-strate three analysed images, at time point 0 hours post scratch wound, 28 hourspost scratch wound where the cells had begun covering the nude membrane and43 hours post scratch wound where the cell culture was fully healed.

6.1 Method evaluation 44
(a) t=0h (b) t=28h (c) t=43h
(d) t=0h (e) t=28h (f) t=43h
Figure 17: Top row (figures a, b and c) represent three images captured duringwound healing. Bottom row (figures d, e and f) represent the analysis performedby Cell-IQ analyser, where a red mask was applied to the images to measure thecell migration. The three donated time point represent fresh scratch wound (t=0h),cells migrating into the wound (t=28h) and healed wound (t=43h).
Images captured of non-wounded cell culture did show an intense cell migration. Anew type of image analysis5 demonstrated the possibility to visualize this migrationfrom one single image, as figure 18a, into a heat map structure, as seen in figure18b, or into a vector field, as seen in figure 18c, where red parts are donated forareas with high migration and blue or black parts to low or absent migration.
(a) Whole culture (b) Heat map (c) Vector field
Figure 18: Analysis of non-wounded cell culture through heat map and vectorfield, enabling migration analysis of individual areas within a cell culture.
5Performed by Alan Sabirsh, Image expert, CVMD, AstraZeneca R&D Molndal
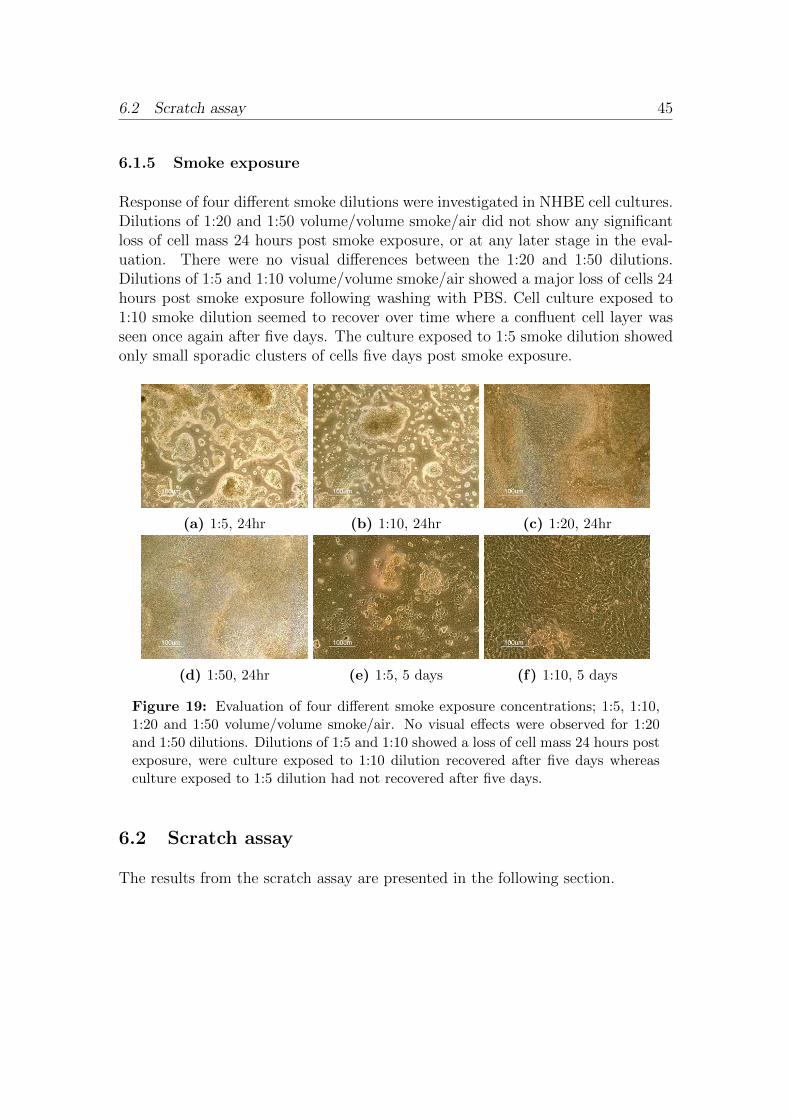
6.2 Scratch assay 45
6.1.5 Smoke exposure
Response of four different smoke dilutions were investigated in NHBE cell cultures.Dilutions of 1:20 and 1:50 volume/volume smoke/air did not show any significantloss of cell mass 24 hours post smoke exposure, or at any later stage in the eval-uation. There were no visual differences between the 1:20 and 1:50 dilutions.Dilutions of 1:5 and 1:10 volume/volume smoke/air showed a major loss of cells 24hours post smoke exposure following washing with PBS. Cell culture exposed to1:10 smoke dilution seemed to recover over time where a confluent cell layer wasseen once again after five days. The culture exposed to 1:5 smoke dilution showedonly small sporadic clusters of cells five days post smoke exposure.
(a) 1:5, 24hr (b) 1:10, 24hr (c) 1:20, 24hr
(d) 1:50, 24hr (e) 1:5, 5 days (f) 1:10, 5 days
Figure 19: Evaluation of four different smoke exposure concentrations; 1:5, 1:10,1:20 and 1:50 volume/volume smoke/air. No visual effects were observed for 1:20and 1:50 dilutions. Dilutions of 1:5 and 1:10 showed a loss of cell mass 24 hours postexposure, were culture exposed to 1:10 dilution recovered after five days whereasculture exposed to 1:5 dilution had not recovered after five days.
6.2 Scratch assay
The results from the scratch assay are presented in the following section.

6.2 Scratch assay 46
6.2.1 Cell culturing
During the cultivation of donor 1849 the incubator holding the cell cultures wereused by a number of other researchers which resulted in a frequent opening andclosing of the door. As a result of the frequent change in temperature, humidityand CO2 the cell cultures stopped to, visually, produce mucus and the TEER valuedropped below 400 Ω·cm2 at two time points, as seen in figure 20.
All three donors showed production of mucus to the naked eye around day 15 andciliated cells were seen around day 21. A visible difference in mucus productionbetween the three donors during cultivation was identified as donor 1849 had largermucus production compared to the other two donors. The mucus produced bydonor 1849 was less sticky and more watery. Donor 4449 had greater variationin mucus production, starting with watery and non sticky mucus which by timebecame more sticky and harder to remove. Donor 12240 produced rather early athin layer of mucus which was difficult to remove by vacuum suction or washing.
6.2.2 Physiological barriers
Investigation of the formation of physiological barriers through TEER measure-ments during the differentiation phase for the three cell donors can be seen in figure20. During evaluation of donor 1849 and donor 12240 the resistance was seen torapidly increased at day 4 to a value above 1000 Ω·cm2, while donor 4449 showed aslower increase in resistance and reached same TEER value at day 10. When fullymatured the cell cultures showed a TEER value between 500-1000 Ω·cm2, whichwas seen by all three donors. As a result of heavy work load on the incubatorduring cultivation of donor 1849, the TEER values dropped blow 400 Ω·cm2 atseveral time points during the differentiation phase as previous mentioned.

6.2 Scratch assay 47
Figure 20: Electrical resistance during cell differentiation followed through TEERmeasurments. Three different donors, each represented by three cultures, were in-vestigated. TEER values were collected in triplicates for each culture investigated.
As a result of introducing scratch wounds to the cell cultures, the TEER valuesinstantly dropped to approximately 35-40 Ω·cm2. The recovery phase from thescratch wound can be seen in figure 21, where the stars indicates the time wherethe scratch wound were visually closed. As seen, the TEER values were low whenscratch wounds were visually closed and continued to increase. After approxi-mately 100 hours, the TEER values were stabilized, measuring over 400 Ω·cm2 forall three donors.

6.2 Scratch assay 48
Figure 21: Electrical resistance during healing of scratch wounds. Stars represent-ing visual closure of scratch wounds.
Investigating the gene expression of tight junction protein ZO-1, no obvious changeduring the wound healing was seen, see figure 22a. Images captured of ZO-1immunofluorescent stained samples were difficult to analyse since the protein waslocated within a thin part of the apical layer. Image analysis of these imageswere hard to perform and were considered to be too time consuming and thereforedetermined not to be done. It was seen that the formation of ZO-1 adjacent to thewound edge were comparable to non-wounded cultures, compare figures 14a and22b.
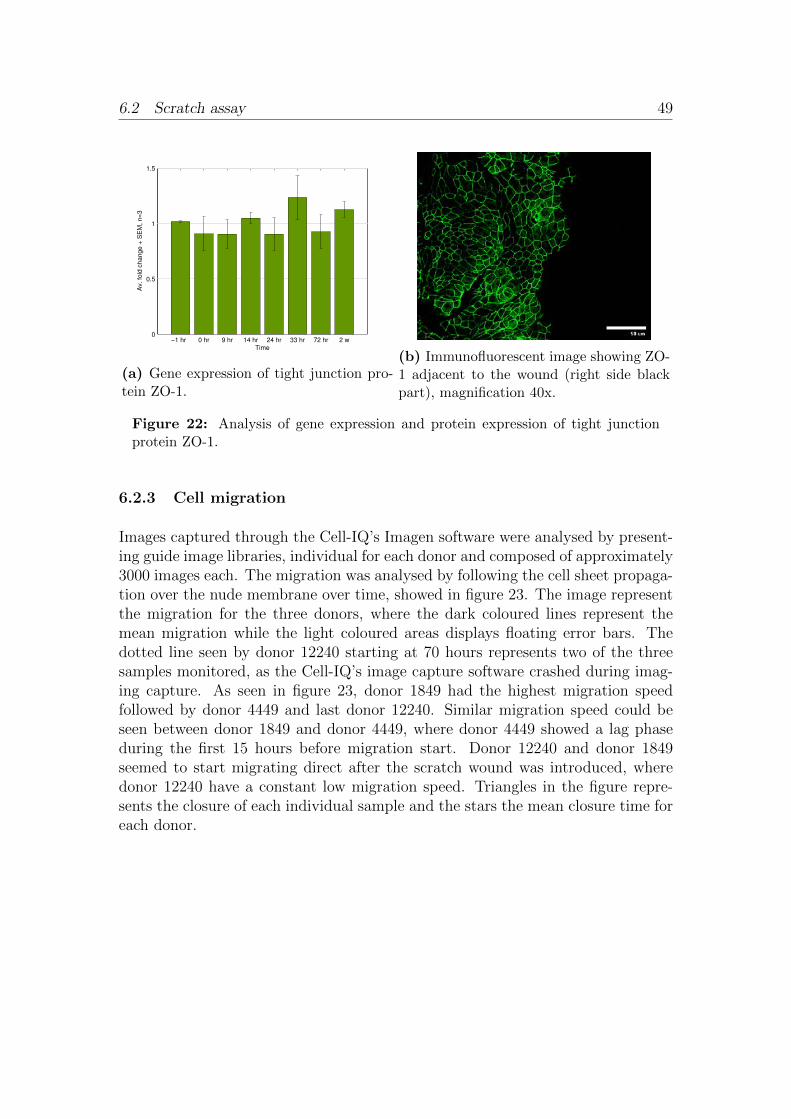
6.2 Scratch assay 49
−1 hr 0 hr 9 hr 14 hr 24 hr 33 hr 72 hr 2 w0
0.5
1
1.5
Time
Av. fo
ld c
han
ge
+ S
EM
, n
=3
(a) Gene expression of tight junction pro-tein ZO-1.
(b) Immunofluorescent image showing ZO-1 adjacent to the wound (right side blackpart), magnification 40x.
Figure 22: Analysis of gene expression and protein expression of tight junctionprotein ZO-1.
6.2.3 Cell migration
Images captured through the Cell-IQ’s Imagen software were analysed by present-ing guide image libraries, individual for each donor and composed of approximately3000 images each. The migration was analysed by following the cell sheet propaga-tion over the nude membrane over time, showed in figure 23. The image representthe migration for the three donors, where the dark coloured lines represent themean migration while the light coloured areas displays floating error bars. Thedotted line seen by donor 12240 starting at 70 hours represents two of the threesamples monitored, as the Cell-IQ’s image capture software crashed during imag-ing capture. As seen in figure 23, donor 1849 had the highest migration speedfollowed by donor 4449 and last donor 12240. Similar migration speed could beseen between donor 1849 and donor 4449, where donor 4449 showed a lag phaseduring the first 15 hours before migration start. Donor 12240 and donor 1849seemed to start migrating direct after the scratch wound was introduced, wheredonor 12240 have a constant low migration speed. Triangles in the figure repre-sents the closure of each individual sample and the stars the mean closure time foreach donor.

6.2 Scratch assay 50
Figure 23: Cell migration over denuded membrane simulating wound healing. Asthe graphs reaches 100% area, the cell cultures are fully healed and cells covers themembranes as it was prior to the scratch wound.
Average wound closure time determined through visual investigation and the av-erage closing area, determined by the Cell-IQ, can be seen in table 16.
Table 16: Average closure time, visual determined, for wound closure followed byits standard deviation and the average closure area.
Donor Average closure time Std. Average closure area
1849 36h 28min 6h 41min 97.3%
4449 43h 50min 6h 44min 92.7%
12240 61h 7min 5h 35min 96.7%
The cell migration was also analysed through the gene expression of MMP-9. Anup regulation of MMP-9 was seen over time, with a clear variation within thesamples as seen in figure 24.

6.2 Scratch assay 51
−1 hr 0 hr 9 hr 14 hr 24 hr 33 hr 72 hr 2 w0
2
4
6
8
10
12
Time
Av. fo
ld c
han
ge
+ S
EM
, n
=3
Figure 24: Gene expression of MMP-9, a matrix metalloproteinase linked to cellularmigration in bronchial epithelial cells, during wound healing represented by the threedonors.
In connection to the migration, gene expression of squamous markers were inves-tigated through squamous metaplasia marker cornifin A and involucrine. An upregulation of cornifin A between 0 hours and 14 hours was seen followed by a dropin expression back to normal levels. Involucrine had a similar pattern the 14 firsthours, but the later time points showed large variance, as seen in figure 25.
−1 hr 0 hr 9 hr 14 hr 24 hr 33 hr 72 hr 2 w0
0.5
1
1.5
2
2.5
3
3.5
4
4.5
5
Time
Av.
fold
cha
nge
+ S
EM
, n
=3
(a) Cornifin A
−1 hr 0 hr 9 hr 14 hr 24 hr 33 hr 72 hr 2 w0
1
2
3
4
5
6
Time
Av.
fold
cha
nge
+ S
EM
, n
=3
(b) Involucrine
Figure 25: Gene expression of squamous metaplasia markers during wound healing,represented by the three donors.

6.2 Scratch assay 52
6.2.4 Cell proliferation
The proliferation within the cell cultures were investigated through gene and pro-tein expression of proliferation marker KI-67. Analysing the gene expression data,the proliferation showed constant expression until 24 hours, where an up regulationcould be seen with an increase in expression 33 hours and 72 hours post scratchwound. After 2 weeks, the expression levels were back to normal again, see figure26a. Protein expression of KI-67 did in contrast to gene expression not show anyclear tendency except a decrease at 2 weeks, see figure 26b.
−1 hr 0 hr 9 hr 14 hr 24 hr 33 hr 72 hr 2 w0
0.5
1
1.5
2
2.5
3
3.5
4
Time
Av.
fold
cha
nge
+ S
EM
, n
=3
(a) Gene expression of KI-67.
−1 hr 0 hr 9 hr 14 hr 24 hr 33 hr 72 hr 2 w0
1
2
3
4
5
6
7
8
9
Time
Sta
ine
d a
rea
[%
] +
SE
M,
n=
3
(b) Protein expression of KI-67.
Figure 26: Analysis of gene and protein expression of proliferation marker KI-67.Gene expression is visualized through average fold change while protein expressionis visualized by image analysis of percent stained area. The graphs are representedby the three different donors.
Compared to KI-67, another proliferation protein, PCNA, did not show any majorchange in gene expression over time, see figure 27.

6.2 Scratch assay 53
−1 hr 0 hr 9 hr 14 hr 24 hr 33 hr 72 hr 2 w0
0.2
0.4
0.6
0.8
1
1.2
1.4
1.6
Time
Av. fo
ld c
han
ge
+ S
EM
, n
=3
Figure 27: Gene expression of proliferation marker PCNA during wound healing,represented by the three donors.
6.2.5 Cell populations
Analysis of the three major cell populations; basal cells, ciliated cells and gobletcells were performed both through gene expression and protein expression.
Gene expression of basal cell marker p63 was up regulated over time, see figure 28a.Protein expression investigated through image analysis showed, on the contrary togene expression, a down regulation in p63 over time, see figure 28b.
−1 hr 0 hr 9 hr 14 hr 24 hr 33 hr 72 hr 2 w0
0.5
1
1.5
2
2.5
3
3.5
Time
Av.
fold
cha
nge
+ S
EM
, n
=3
(a) Gene expression of p63.
−1 hr 0 hr 9 hr 14 hr 24 hr 33 hr 72 hr 2 w0
3
6
9
12
15
Time
Sta
ine
d a
rea
[%
] +
SE
M,
n=
3
(b) Protein expression of p63.
Figure 28: Analysis of gene and protein expression of basal cell protein p63. Geneexpression is visualized through average fold change while protein expression is vi-sualized by image analysis of percent stained area. The graphs are represented bythe three different donors.

6.2 Scratch assay 54
Visual investigation of samples stained for p63 showed positive stained cells ad-jacent to the wound edge. Further investigation showed basal cells covering largeparts of the healed wound area, see figure 29a and figure 29b.
(a) Basal cells adjacent to wound edge. (b) Basal cells covering healed area.
Figure 29: Immunofluorescent staining of basal cells showed in green. Open woundareas are marked by a purple mask. In figure (a) DAPI was used to stain all cellnucleus in the cell culture, shown in blue.
The expression of mucin MUC5AC was investigated both through gene expressionand protein expression. Gene expression showed an increase in expression during 9hours and 14 hours post wounding followed by stabilized expression comparable tonormal levels, see figure 30a. Protein expression was investigated through imageanalysis of immunofluorescent stained samples showing comparable result to thegene expression, with an increase of protein expression at 9 hours and 14 hours,followed by a decrease and stabilized normal expression levels again, see figure 30b.

6.2 Scratch assay 55
−1 hr 0 hr 9 hr 14 hr 24 hr 33 hr 72 hr 2 w0
0.5
1
1.5
2
2.5
3
3.5
Time
Av. fo
ld c
han
ge
+ S
EM
, n
=3
(a) Gene expression of MUC5AC.
−1 hr 0 hr 9 hr 14 hr 24 hr 33 hr 72 hr 2 w0
1
2
3
4
5
6
7
8
9
10
Time
Sta
ine
d a
rea
[%
] +
SE
M,
n=
3
(b) Protein expression of MUC5AC.
Figure 30: Analysis of gene and protein expression of goblet cell MUC5AC mucin.Gene expression is visualized through average fold change while protein expressionis visualized by image analysis of percent stained area. The graphs are representedby the three different donors.
Ciliated cells were investigated by analysis of gene expression of FOXJ1, SP17 andTUBB4. FOXJ1 and SP17 showed stable expressions over time with an increasein expression at two weeks. TUBB4 showed an increase in expression at 14 hoursfollowed by a stable and slightly decreased gene expression, see figures 31a, 31band 31c. Protein expression of both FOXJ1 and TUBB4 showed small differencesover time with an up regulation at 2 weeks, see figure 31d.

6.3 Smoke assay 56
−1 hr 0 hr 9 hr 14 hr 24 hr 33 hr 72 hr 2 w0
0.5
1
1.5
2
2.5
Time
Av. fo
ld c
han
ge
+ S
EM
, n
=3
(a) Gene expression of FOXJ1.
−1 hr 0 hr 9 hr 14 hr 24 hr 33 hr 72 hr 2 w0
0.2
0.4
0.6
0.8
1
1.2
1.4
1.6
1.8
Time
Av. fo
ld c
ha
ng
e +
SE
M,
n=
3
(b) Gene expression of SP17.
−1 hr 0 hr 9 hr 14 hr 24 hr 33 hr 72 hr 2 w0
0.5
1
1.5
2
2.5
3
3.5
4
Time
Av.
fold
cha
nge
+ S
EM
, n
=3
(c) Gene expression of TUBB4.
−1 hr 0 hr 9 hr 14 hr 24 hr 33 hr 72 hr 2 w0
1
2
3
4
5
6
7
8
9
Time
Sta
ine
d a
rea
[%
] +
SE
M,
n=
3
TUBB4
FOXJ1
(d) Protein expression FOXJ1/TUBB4.
Figure 31: Analysis of gene and protein expression of ciliated cells. Gene expressionis visualized through average fold change while protein expression is visualized byimage analysis of percent stained area. The graphs are represented by the threedifferent donors.
6.3 Smoke assay
NHBE cell cultures exposed to 1:50 volume/volume smoke/air dilution were inves-tigated according to readouts previously described. Following results were collectedfrom the smoke assay.

6.3 Smoke assay 57
6.3.1 Physiological barriers
Smoke exposed NHBE cell cultures showed lower TEER values compared to non-treated control cultures. At starting point, all samples showed an equal meanTEER value, see figure 32. After smoke exposure an instant and dramatic drop inTEER was seen.
Figure 32: TEER measurement, comparing smoke exposed NHBE cell cultures tonon-treated cell cultures.
In connection to obtained TEER results, gene expression of tight junction proteinZO-1 and gene expression of cell-cell adhesion protein CDH1 (E-Cadherin) wereinvestigated, see figures 33a and 33b. Gene expression of ZO-1 was not seeninfluenced by the smoke, investigating both smoked samples and smoke woundedsamples. CDH1 was seen negatively influenced by the smoke, as a down regulationwas seen in both smoked samples and smoke wounded samples.

6.3 Smoke assay 58
−1 4 8 24 48 720
0.2
0.4
0.6
0.8
1
1.2
1.4
1.6
1.8
2
2.2
Time [hr]
Av. fo
ld c
han
ge
+ S
EM
, n
=1
Control
Smoke
Smoke + wound
(a) ZO-1
−1 4 8 24 48 720
0.2
0.4
0.6
0.8
1
1.2
1.4
1.6
1.8
2
2.2
Time [hr]
Av. fo
ld c
han
ge
+ S
EM
, n
=1
Control
Smoke
Smoke + wound
(b) CDH1
Figure 33: Gene expression of tight junction protein ZO-1 and cell-cell adhesionprotein CDH1 comparing smoked samples and smoke wounded samples to controlsamples.
6.3.2 Cell migration
Results obtained using the Cell-IQ system showed a delayed migration by smokewounded cell cultures with several hours compared to wounded controls, see figure34. Mean values for wound closure, donated with stars in figure 34 showed delayedwound closure with almost 41 hours.
Figure 34: Cell migration of smoked samples versus controls. Stars represents themean closure time and triangles individual closing of each sample.

6.3 Smoke assay 59
Gene expression of MMP-9, connected to migration, showed a down regulation insmoked samples whereas the smoke wounded samples showed a slight up regulationat 48 and 72 hours which corresponded to the migration seen by the Cell-IQanalysis, compare figure 34 with figure 35.
−1 4 8 24 48 720
0.2
0.4
0.6
0.8
1
1.2
1.4
1.6
1.8
2
2.2
Time [hr]
Av.
fold
ch
ang
e +
SE
M,
n=
1
Control
Smoke
Smoke + wound
Figure 35: Gene expression of MMP-9, a matrix metalloproteinase linked to cel-lular migration in bronchial epithelial cells, comparing smoked samples and smokewounded samples to control samples.
6.3.3 Cell proliferation
Gene expression of KI-67 showed an instant down regulation of proliferation insmoked samples during the whole experimental time, while the smoke woundedsamples showed a down regulation to 24 hours followed by an upregulation, seefigure 36.
−1 4 8 24 48 720
0.2
0.4
0.6
0.8
1
1.2
1.4
1.6
1.8
2
2.2
2.4
2.6
2.8
Time [hr]
Av. fo
ld c
hang
e +
SE
M,
n=
1
Control
Smoke
Smoke + wound
Figure 36: Gene expression of proliferation protein KI-67, comparing smoked sam-ples and smoke wounded samples to control samples.

6.3 Smoke assay 60
6.3.4 Cellular stress response
Gene expression of three different stress relate genes; DDIT3, HSPA6 and TXNRD1showed the common feature of smoke wounded samples expressing a higher stressresponse compared to smoked samples. Smoked samples showed stress responsewith upregulation of TXNRD1 and HSPA6, while DDIT3 showed a slight downregulation over time.
−1 4 8 24 48 720
1
2
3
4
5
6
7
8
9
10
11
12
13
Time [hr]
Av.
fold
ch
an
ge +
SE
M,
n=
1
Control
Smoke
Smoke + wound
(a) DDIT3
−1 4 8 24 48 720
200
400
600
800
1000
1200
1400
1600
1800
2000
Time [hr]
Av.
fold
ch
an
ge +
SE
M,
n=
1
Control
Smoke
Smoke + wound
(b) HSPA6
−1 4 8 24 48 720
1
2
3
4
5
6
7
8
9
10
11
12
Time [hr]
Av.
fold
cha
nge
+ S
EM
, n
=1
Control
Smoke
Smoke + wound
(c) TXNRD1
Figure 37: Gene expression of stress related proteins, comparing smoked samplesand smoke wounded samples to control samples.
Cell apoptosis investigated through gene expression of caspase-3 showed a drasticdown regulation in smoked samples and a slight down regulation in smoke woundedsamples, see figure 38a. The quick and dramatic decrease in gene expression, wasnot seen in smoked wounded cultures, which showed a delayed response seen at 48and 72 hours. Investigating gene expression of IL-8, a down regulation in smoked

6.3 Smoke assay 61
samples and a tendency of up regulation in smoke wounded samples was seen, seefigure 38b.
−1 4 8 24 48 720
0.2
0.4
0.6
0.8
1
1.2
1.4
1.6
1.8
Time [hr]
Av. fo
ld c
han
ge
+ S
EM
, n
=1
Control
Smoke
Smoke + wound
(a) Caspase-3
−1 4 8 24 48 720
1
2
3
4
5
6
7
8
9
Time [hr]
Av.
fold
ch
ang
e +
SE
M,
n=
1
Control
Smoke
Smoke + wound
(b) IL-8
Figure 38: Gene expression of apoptosis protein Caspase-3 and chemokine IL-8,comparing smoked samples and smoke wounded samples to control samples.
6.3.5 Cell populations
Gene expression of the three different cell types; goblet cells (MUC5AC), ciliatedcells (FOXJ1) and basal cells (p63) are seen in figure 39a-39c. FOXJ1 was seen tohave a drastic down regulation in smoked samples and a slight down regulation insmoke wounded samples. Expression of p63 showed not any clear tendency at theinvestigated time periods and seemed stable over time. The MUC5AC showed adown regulation in all smoked samples as well as in the control sample.

6.4 Compound treatment 62
−1 4 8 24 48 720
0.2
0.4
0.6
0.8
1
1.2
1.4
1.6
1.8
2
2.2
Time [hr]
Av. fo
ld c
han
ge
+ S
EM
, n
=1
Control
Smoke
Smoke + wound
(a) FOXJ1
−1 4 8 24 48 720
0.2
0.4
0.6
0.8
1
1.2
1.4
1.6
1.8
Time [hr]
Av. fo
ld c
ha
ng
e +
SE
M,
n=
1
Control
Smoke
Smoke + wound
(b) p63
−1 4 8 24 48 720
0.2
0.4
0.6
0.8
1
1.2
1.4
1.6
1.8
Time [hr]
Av.
fold
cha
ng
e +
SE
M, n
=1
Control
Smoke
Smoke + wound
(c) MUC5AC
Figure 39: Gene expression investigating the behaviour of the three major celltypes; ciliated cells (FOXJ1), basal cells (p63) and goblet cells (MUC5AC), compar-ing smoked samples and smoke wounded samples to control samples.
6.4 Compound treatment
The effect of the three different concentrations, 0.1 µM, 4 µM and 10 µM ofcompound A together with DMSO control to migration can be seen in figure 40.No large differences between the three concentrations as well as to DMSO treatedsamples was seen. DMSO is represented with floating error bars with a mean curvebased on a triplicate.

6.4 Compound treatment 63
Figure 40: Cell migration of cell cultures treated with compound A, stars repre-senting mean closure time and triangles each individual closing.
Differences between wounded cultures treated with DMSO and non treated woundedcultures could not be determined, see figure 41.

6.4 Compound treatment 64
Figure 41: Cell migration of non treated cultures versus DMSO treated.
Migration speed for compound B and positive control compound C did, similarto compound A, not show any major difference from DMSO control and no cleardifference between the three individual dilutions. No major difference betweenthe three compounds could be determined. Figures representing the migration forcompound B and positive control compound C can be seen in Appendix F, figureF1 and figure F2.

7 Discussion 65
7 Discussion
Following section will cover the discussion and interpretation of the results obtainedfrom the method evaluation, scratch assay, smoke assay and compound treatment.
7.1 Method evaluation
The discussion of the method evaluation will be divided into smaller parts to easilyinterpret the results from the different methods.
7.1.1 Scratch wounds
Initial objective of this project was to investigate possibilities to perform a cleanand reproducible wound to the NHBE cell cultures cultivated on Transwell insertsin ALI. Implant of small obstacles such as plastic blocks, or small strips of materi-als to be ripped away and thereby tear away the cells above it, were rejected. Thecell culturing can be seen as a slow process and needs approximately 28 days ofcultivation until fully differentiated and ready for experiments and the implant ofobstacles or strips would exclude the cultures to be used for any other experimentsexcept wound and migration assays. Using a strip would also add more complexityto the model as the cells need to have contact with the basolateral medium in orderto live, causing the strip to be made of a permeable material. From these argu-ments, the wound had to be performed in conjunction to the experiment to allowlarger flexible decisions. Ideas of performing wounds through freezing or burningoff the cells were neglected with aspects of risk of destroying the membrane as wellas not simulating in vivo like damage based on the disease area. Performance ofscratch wounds, a common used technique [52, 57–61], were investigated by differ-ent tools. At an early stage it was concluded that Pasteur pipettes were able toproduce a continuously scratch wound with distinct wound edges in combinationwith the removal of eliminated cells by vacuum suction. The utilization of thescratch technique eliminated all cells in the wound area, a stage different from invivo report of wounds found in asthmatics where the superficial cell layer has seendisrupt, suggesting presence of basal cells in the wound area [38]. An ideal scratchtechnique would be able to use a reproducible technique, leaving clusters of basalcells in the wound area, to even further mimic the in vivo condition seen. Althoughthe removal of all cells is a drawback by the technique used, the scratching tech-nique would in contrast to the usage of obstacles have the advantage of damagingthe cells adjacent to the wound edge. Mechanical stimulation have been shown topropagate signals, such as Ca2+ waves [32], from stimulated cells to adjacent cells,

7.1 Method evaluation 66
where the propagation of signalling could influence a large amount of cells in theculture. This signalling has not been further investigated in this project, but atheory is that the scratch simulates a greater stress compared to the removal of anobstacle. The glass pipette was however seen to damaged the membrane (figure9) as a result of the scratching. The damage was after visual investigation notconsidered large enough to exclude the proposed scratch method from the project.
7.1.2 Antibody evaluation
In order to analyse changes in protein expression over time immunocytochemistrytechniques were used. Antibodies were evaluated for their specificity and it wasearly discovered how a majority of the antibodies did not show any signal or ab-normal signal by non specific binding. Antibodies specific to cell types of ciliated(FOXJ1, TUBB4 and SP17), goblet (MUC5AC) and basal cells (p63) were iden-tified as well as marker for tight junction protein ZO-1 and proliferation markerKI-67. To evaluate any presence of Clara cells in the cell culture, an antibodyfor Clara cell secretory protein (CCSP) was used. As no signal was seen in theNHBE cell cultures, validation of the CCSP antibody was performed, resulting ina positive signal, in human alveolar tissue (figure 10f). The CCSP antibody wasevaluated on alveolar tissue to exclude any presence of Clara cells in the culturesas bronchial epithelium is composed of goblet, ciliated and basal cells [7, 8].
By the evaluation it was decided that different combination of markers (table 6)should be used to reduce the amount of culture samples needed to investigate theprotein expression. Proliferation marker KI-67 was used in combination with basalcell marker p63, to investigate any proliferation within the population of basalcells. FOXJ1 was used in combination with TUBB4 to investigate if all ciliatedcells expressed cilia, and MUC5AC in combination with TUBB4 to investigate ifany visible connection between goblet cells and ciliated cells could be made.
The combination of FOXJ1 and TUBB4 for visualization of ciliated cells throughimmunofluorescent staining showed FOXJ1 positive cells expressed cilia (figure12a). Immunofluorescent staining with SP17 (figure E1 in Appendix E) did, asseen by immunoperoxidase staining, show positive staining of cilia and the cyto-plasm of ciliated cells. The non-specificity binding excluded the SP17 antibodyfor further use in the project. However, as SP17 was found specific to ciliatedcells, the usage of SP17 could be adapted and evaluated in gene expression as-says. Immunofluorescent staining of basal cells showed a difference in expressionwhen comparing 7 day old culture compared to 39 day old culture (figure 13).The decreased expression of basal cells at day 39 compared to day 7 could be aresult of basal cells ability to differentiate into other cell types. Investigating im-

7.1 Method evaluation 67
munofluorescent images of tight junction protein ZO-1 in young cultures, at day7, showed small areas of tight junction formation compared to older cultures. Atday 30, staining showed a continuous expression seen in the whole culture (figure14). Using the proposed ICC technique, ZO-1 could potentially be used to followand determine the maturation of tight junctions over time.
The double-staining of proliferation marker KI67 and basal cell marker p63 showedproliferative cells positive stained for p63 (figure 15b), strengthen the theory ofbasal cells are responsible being the proliferation in bronchial epithelium [24, 25].
By comparing the location of goblet cells and ciliated cells, MUC5AC and TUBB4immunofluorescent staining, in several different donors (data not shown in thereport) no distinct correlation between the location of the two cell types could bedetermined. Visual inspection indicated goblet cells and ciliated cells to be locatedtogether in patches, often found closer to the wall of the well, whereas other donorshad an even distribution of the two cell types in the whole culture.
7.1.3 Trans epithelial electrical resistance
Evaluation of the two different electrode devices used to conduct TEER measure-ment indicated no distinct difference (figure 16). The Endohm 6mm Culture Cupwas easy manageable and was independent of the operator conducting the mea-surements, resulting in the choice to be used for oncoming measurements. TheSTX2 Chopstick Electrodes were on the contrary not easy manageable, the cellculture was easily scratched with the apical electrode and as the electrodes wereflexible, maintaining constant distance between the two during measurements waschallenging.
7.1.4 Cell-IQ
The Cell-IQ was early concluded to be a functional tool to analyse cell migrationin epithelial ALI cultures. As the cell sheet was transparent and the Transwellmembrane was seen through the cells, an issue was raised during the analysis inorder to distinguish the difference between the cell sheet and the membrane. Bybuilding larger sample libraries the sensitivity increased. Analysis of one woundclosure, composed of 423 images covering 48 hours image sampling, required ap-proximately 24 hours of analysis. The analysis was shown to be time consumingand could not be used as a high through put system and required large amount oftime in order to receive good results.

7.2 Scratch assay 68
During the evaluation, non-wounded cell cultures were investigated as well to in-vestigate the Cell-IQ’s potential to monitor regular cell cultures. The results weresurprisingly, revealing a constant cellular migration within the cell culture. Thismigration has, to the writer, not been previous reported. The underlying factorfor the migration was not further investigated in this project. Further experimentscould however investigate the impact of different coatings of the membrane, suchas other types of collagens, to the migration.
Analysis performed by Alan Sabirsh6 did show an alternative image analysis tobe used for non-wounded ALI cultures (figure 18). Using this analysis methodswould promote the possibility to track cell migrations in various assays and could,in future experiments, potentially be used to track responses of stimuli of differentirritants, such as smoke or other inhaled compounds.
7.1.5 Smoke exposure
The evaluation of smoke exposure to the ALI cultures, 1:50 volume/volume smoke/airdilution was chosen for oncoming experiments, as it did not show any severe celldeath compared to the 1:5 and 1:10 dilutions (figure 19). The setup of peristalticpumps for distribution of fresh medium and removal of old medium worked prop-erly (figure 6) and hopefully the same setup could be used, in future experiments,to perform chronic smoke exposure experiments. To mimic normal culturing con-ditions during chronic smoking the addition of switching the smoke inlet to aCO2/air mixture between smoke exposure would be necessary.
7.2 Scratch assay
The wound healing progression from the scratch assay was observed accordingto the stages presented in figure 3: dedifferentiation, migration, proliferation andredifferentiation. A healthy epithelium was wounded by mechanical scratchingusing the scratch method used in the method evaluation. The dedifferentiationwas not investigated in this project. Stainings of fixated cell cultures showedpositive staining of basal cells adjacent to the wound edge (figure 29a). As cellsclose to the wound edge dedifferentiate before migrating, the positive staining ofbasal cells could be the result of dedifferentiation of goblet and ciliated cells.
Migration, the second step in epithelial wound healing, was monitored throughthe Cell-IQ’s image analysis revealing a variation between the three donors as well
6Alan Sabirsh, Image expert, CVMD, AstraZeneca R&D Molndal

7.2 Scratch assay 69
as variation within the samples of each donor (figure 23). Visual video analysisrevealed a migration performed by the whole cell sheet rather than a few cells, aresult not comparable to previous reported results of scratch assay of monolayercultures where migration have been documented not to be seen at a distance furtherthan 1.6 mm from the wound edge [62].
By using the scratch assay, a limitation is raised in controlling the surface mem-brane composition. As the cells are removed through mechanical scratching, noth-ing is known about the surface membrane. Before culturing the cells, the membraneis incubated with collagen I and III in order to mimic the in vivo basement mem-brane. After scratching the collage and other ECM proteins, expressed by the cellculture during cultivation, could have been removed to an unknown extent. Thevariations in migration could potentially be linked to the cells ability to migrateonto the nude membrane and the rate of expressing new ECM proteins. Inves-tigations of the membrane composition could be done in future experiments toconclude potential effect to the migration speed. The cells left on the membrane,not removed by the scratching, should be connected to ECM proteins located onthe membrane surface by different adhesions. In order for a cell to start migratethe adhesion has to be disrupt. MMP-9, a matrix metalloproteinase, has beensuggested to be involved in the migration of airway epithelial cells [48]. Previ-ous studies, observed by monolayer cell cultures of HBEC and HNEC, has shownincreased levels of MMP-9 during wound healing. The upregulation of MMP-9has shown to be extensive in migrating cells adjacent to a wound edge and tobe expressed throughout the wound healing. These results suggested the abilityof MMP-9 to cleave contacts between lamellipodia and collagen IV and therebypromote migration through new contacts in the front of the direction of cell migra-tion. Blockage of MMP-9 has been shown to reduce the migration speed drastically[52, 53].
The gene expression of MMP-9, observed within the three donors, showed anupregulation between 9 hours and 72 hours post scratching (figure 24). By com-paring the expression of MMP-9 with the image analysis data, it was concludedthat MMP-9 was upregulated during the visual migration of the three donors. Asblockage of MMP-9 has shown reduction in migration speed in submerged HBECcultures, future experiments could investigate the effect of both blockage and in-duction of MMP-9 in ALI cultures.
As the cells starts to migrate, the pseudostratified cell composition is caused toadapt a more squamousness formation. This formation change was investigated bythe expression of cornifin A and involucrine (figure 25). Involucrin and cornifin Awas used as markers for squamous metaplasia, where involucrin has been found ex-pressed in stratified squamous epithelium [84, 85] and cornifin A in the suprabasal

7.2 Scratch assay 70
layer of epidermis [86]. The expression of involucrin and cornifin A showed an up-regulation the first 14 hours post scratch wound, followed by a decrease of cornifinA whereas involucrin showed large variation in the data. The decrease seen bycorifin A can be connected to the increase in proliferation (figure 26a). As anincrease of cells in the culture would result in less space for squamous cells, theproliferation could promote a change in cell phenotype to a pseudostratificationconfirmation.
Proliferation, the wound healing step following the migration, was investigatedby gene expression of KI-67 (figure 26a). The increased expression of proliferationseen by KI-67 correlates with the Cell-IQ data and occurs in close time to completemigration. Unfortunately, image analysis of ICC stained KI-67 samples (figure26b) showed fluctuations in the data, but could to some extent confirm the geneexpression data. Gene expression of KI-67 was also compared to gene expressionof PCNA (figure 27), which did not show any change in expression.
Comparing the increase in gene expression of KI-67 (figure 26a) over time to geneexpression of basal cells (figure 28a), a similar behaviour was seen. The increasein proliferation was consistent with an increase in gene expression of basal cells.The protein expression of basal cells, investigated by image analysis of ICC stainedsamples, showed a decrease in basal cells over time. It was also observed, examiningthe fixated samples, that large amounts of basal cells were located covering thehealed wound area (figure 29b). Visual comparison to ICC samples of goblet cellsand ciliated cells, data not shown, basal cells were seen predominant located innewly covered wound areas. This observation further strengthen the theory ofbasal cells acting as the progenitor cell type [87]. A potential difference betweenthe ICC data and gene expression data could be explained by the difference of thepresented data. One analysis representing the gene expression, the other proteinexpression. As not all mRNA need to be translated to proteins, it might be hardto truly link the two analysis data. The extent of mRNA actually translated intoprotein is unknown as well as the time from mRNA to fully functional protein.Another action to consider is the manual performed image analysis, where themisfit result could be explained by not representing the whole cell culture.
The last wound healing step, the redifferentiation, was investigated through a com-bination of readouts. Instigations of the two major cell types, goblet and ciliatedcells, revealed an upregulation of MUC5AC mucins during 9 hours and 14 hoursthrough increased levels of both gene and protein expression (figures 30a and 30b).This upregulation could be a response to the scratch wound, where an increasedamount of mucins and thicker mucus would trap foreign particles or intruders andby the entrapment transport it away from the epithelium minimizing the risk ofleaving the intruder entering the wound. The ciliated cells did not show any re-
7.2 Scratch assay 71
action to the scratch wound, showing similar profile patterns examining the geneexpression of FOXJ1 (figure 31a) and SP17 (figure 31b) as well as protein expres-sion of FOXJ1 and TUBB4 (figure 31d). An increase of the cilia markers was seenat 2 weeks post scratch wound, both through gene and protein expression of cili-ated cells. The increase could be explained by maturation of the cell cultures wherelong time cultivation has, through visual inspection, shown an increase of cilia overtime. The gene expression of TUBB4 (figure 31c) showed a non-similar behaviour,where an increased expression was seen 14 hours post scratching. Tubulin is knownto be expressed as a cytoskeletal protein [19], suggesting the result to representthe migration rather than the cilia formation as image analysis of TUBB4 stainedsamples revealed staining of the cytoskeleton (figure E3 in Appendix E).
TEER was regulary measured during the cultivation and wound healing of thecell cultures. The resistance could be seen located between 400-1000 Ω·cm2 duringdifferentiation (figure 20). Introducing a scratch wound caused a dramatically dropin resistance to approximately 40 Ω·cm2. Monitoring the wound healing, it wasseen that although the wounds were visually closed the resistance still increased,suggesting the physiological barriers not to be fully established at wound closure.The gene expression of tight junction protein ZO-1 showed no changes over time(figure 22a). ICC stained samples of ZO-1 showed strong signal close to the woundedge with a pattern comparable to a non-wounded culture, compare figures 14aand 22b. Even though the TEER measurements revealed a clear negative impacton the physiological barriers and thereby also the tight junctions, the tight junctionprotein ZO-1 seems to be mildly affected. Further experiments could be done toinvestigate if other tight junction protein are affected to a greater extent by thescratch wound. As no correlation could be made between the TEER and ZO-1 data in this project and the ZO-1 activity is presented to be associated withhigh resistance [30], further experiments could also include if any correlation canbe made between cell density and TEER. The TEER measured during woundhealing showed an increasing resistance after visual wound closure which could bea result of the cell proliferation. Examining any correlations between cell densityand TEER could reveal if the increase is caused by the cell proliferation or byformations of tight junctions.
Summarizing the results from the scratch assay, it could be seen that the cellcultures recovered and healed during the 2 week time period investigated. Basalcells were seen lining the border between cell culture and wound, comparable toprevious reported findings [53]. The migration was monitored through live imaging,revealing a migration caused by the whole cell sheet rather than by a few migratingcells. The removal of cells for creation of wounds were seen causing a squamous cellconfirmation which during healing decreased, after the migration and closure of the

7.3 Smoke assay 72
wound, with increased levels of proliferation. The proliferation could be connectedto increased levels of basal cells. Large amount of basal cells were found in thewound area, a result supported by theories of basal cells acting as the multipotentprogenitor cell type [87]. Ciliated cells seemed not to be affected over time by thescratch wound, where as goblet cell showed an upregulation of mucins during thewound healing.
7.3 Smoke assay
Compared to the scratch assay, the smoke assay was evaluated with some differ-ences. The migration, proliferation and dedifferentiation (figure 3) were investi-gated in similar manner as to the scratch assay. In the smoke assay additionalgene markers were investigated while the ICC was rejected as a result of the largetime frame required for analysis.
To mimic the behaviour of smoking, ISO standards for cigarette smoking was usedin combination with the Borgwald RM20S smoking robot, a machine documentedto generate accurate and reproducible smoke doses [72]. Cigarette smoke wasgenerated from Kentucky reference cigarettes, a common used cigarette type in invitro experiments [88]. Although the reference cigarette is not used by smokers invivo it offers the possibility to reproduce and compare experiments, performed bothin vitro and in vivo, by generating similar smoke from each cigarette used. Usingcommercial available cigarette, and thereby use the smokers choice of cigarette,could lead to an ethical dilemma for pharmaceutical companies. If purchasingcigarettes directly from the tobacco industry, it could be seen as a standpointand sponsorship of a certain company. The reference cigarettes offers a researchcigarette and are offered and sold solely for research purposes and are not forhuman consumption.
The smoke assay started with exposing scratch wounded cell cultures to a dilutionof 1:50 smoke/air. The migration was investigated through the Cell-IQ system,which revealed a major effect of the cigarette smoke to the cellular migration. Themigration of smoke wounded cell cultures showed a delayed wound healing withalmost 41 hours (figure 34). Although cigarette smoke delayed the migration, thecurve profile seen was similar to the control where the delay in migration couldbe seen as a lag phase. The Cell-IQ data was compared to the gene expressionof MMP-9, showing an upregulation at 48 hours and 72 hours (figure 35). Theupregulation was connected and identified with the increased migration from theCell-IQ data. MMP-9 has previous been suggested linked to cellular migrationin HBEC cultures [48]. The result of smoke affecting migration was confirmed

7.3 Smoke assay 73
by non-wounded cell cultures, where the expression of MMP-9 was sustained lowthroughout the experiment compared to control samples (figure 35).
The proliferation, the wound healing step following the migration, was investi-gated through gene expression of KI-67. The smoke showed a large down regula-tion in proliferation in smoked cell cultures, while smoke wounded samples showedless down regulation (figure 36). The higher proliferation expression by smokewounded samples could be explained due to proliferation occurring in conjunctionto the wound healing. The gene expression of basal cells, acting as the multi-potent progenitor cell type [87], did show a slight down regulation followed by anupregulation analysing both smoke wounded and smoked cell cultures (figure 39b).
The redifferentiation was assessed by investigation of the gene expression of gobletand ciliated cells. Ciliated cells were seen down regulated in both smoke woundedand smoked cell cultures (figure 39a) which coincides with in vivo observationsof cigarette smoke causing destruction of cilia [8]. The expression of goblet cellmucins showed a down regulation over time in both smoke wounded and smokedsamples (figure 39c). As the control sample suffered of a large down regulationand the result is in contradiction to previous reported data, presenting cigarettesmoke as a trigger for mucus production and release [8, 39, 40], the result from theMUC5AC experiment was seen as invalid.
The cellular stress response from cigarette smoke was assessed through investiga-tion of gene expression of heat shock protein 70 kDa (HSP70B or HSPA6), DNA-damage-inducible transcript 3 (DDIT3) and thioredoxin reductase 1 (TXNRD1).HSP70B has shown to be important for cell viability during accumulations ofdamaged proteins [89]. DDIT3 has shown to inhibit migration and proliferationdepending on location in the cell cytoplasm or nuclei [90], while the expressionof TXNRD1 has been linked to oxidative stress defence mechanisms [91]. Allthree genes were elevated in smoke wounded samples as well as in smoked sam-ples with exception of DDIT3 (figure 37). Expression of DDIT3 was seen stablefor smoked cultures, a result contradictory to previous reported data suggestingcigarette smoke causing elevated levels of stress related signals [43]. Interestinglya larger stress response could be seen to the smoke wounded cultures comparedto the smoked cultures. Expression levels of the cytokine interleukin-8 (IL-8) hasbeen reported to increase, caused by the inflammatory response, by cigarette smoke[44, 45]. The gene expression of IL-8 did unfortunately not support the theory,revealing a down regulation seen by smoked cultures (figure 38b). Smoke woundedsamples showed a fluctuating regulation of IL-8, perhaps as a inflammatory re-sponse to the mechanical scratching.
Potential cell death was initially planned to be monitored through cell apoptosis

7.4 Compound treatment 74
and the expression of caspase-3, a protease connected to activation of cell death.It was however discovered that caspase-3 levels were significant down regulatedin smoked cell cultures and slightly down regulated in smoke wounded cultures(figure 38a). Cigarette smoke was later discovered to have been reported not toinduce caspase-3 in bronchial epithelial cells [67]. Accordingly, the gene expressionof caspase-3 showed a down regulation in both smoked and smoke wounded cellculture (figure 38a).
The TEER was measured continuously to observe any changes to the physiolog-ical barriers caused by the smoke exposure. Instantly after smoke exposure theresistance decreased and sustained low over the time period investigated (figure32). As cigarette smoke has shown to decrease expression of both cell-cell adhesionprotein epithelial cadherin (CDH1) [41] and induce disassembly of tight junctionprotein ZO-1 [42], the gene expression of both ZO-1 and CDH1 was investigated.Expression of ZO-1 revealed a very small down regulation at 4 hours followed bya constant expression (figure 33a). The gene expression of CDH1 (figure 33b),showed a decrease expression in smoked samples, while the expression was seenhigher for smoke-wounded samples, suggesting a disintegration of cell-cell contacts.
Summarizing the smoke assay, the cigarette smoke was seen to negatively affectthe migration and proliferation. The TEER was instantly negatively affected, notfully recovering during the investigate time frame and a disintegration of cell-cellcontact was suggested. Several stress responses were identified in the cell cultures,both for smoked samples as well as for smoke wounded samples.
7.4 Compound treatment
Suggestions were made from toxicologists, at a department working with drugsafety issues at AstraZeneca R&D, to evaluate the scratch assay model combinedwith exposure of three different compounds. A first experiment was conductedby applying compounds apically to the wounded cell cultures and monitoring themigration using the Cell-IQ system. Analysing the migration profiles for compoundA (figure 40), B (figure F1 in Appendix E) and positive control C (figure F2 inAppendix E), no significant differences between the compounds or the differentconcentrations could be made. As DMSO is known to be toxic to cells [92], theeffect of the DMSO was compared to negative control (figure 41) revealing nodifference in time of wound closure. However, a difference in curve shape was seen,which could be a result of non sufficient image analysis by the Cell-IQ system.
As no impact was seen by the different compounds, further experiments need tobe performed. Suggestions from the toxicologist were made as the compound

7.4 Compound treatment 75
concentrations were concluded to be too low. Further experiment can be madewith concentrations up to 400 µM, compared to the used 10 µM maximum dose,in order to evaluate effects on cellular migration.

8 Conclusions 76
8 Conclusions
By this project a successful model for wound healing using primary NHBE cell cul-tures has been established. The cell cultures were concluded having a high recov-ery towards mechanical scratching and whole cigarette smoke exposure analysingphysiological barriers, re-establishment of cell populations, functional cellular mi-gration and proliferation. Through this project a combination of different readoutswere used to accurate follow the healing processes of the cell cultures. ThroughICC techniques, several antibodies were evaluated and identified for visualisationof different cell types as well as tight junctions and proliferative cells. Evaluatingmethods for live imaging of the NHBE cell cultures revealed a significant back-ground migration constantly occurring in fully differentiated cell cultures.
Basal cells, thought as the cell type responsible for proliferation and differentiationwithin the cultures, were noticed lining the wound edges of scratch wounded cellcultures. Furthermore, basal cells were seen to be the predominant cell type presentin healed wound areas up to 72 hours post scratching. Double-staining visualizedbasal cells as positive stained for proliferation marker KI-67, supporting the theoryof basal cells acting as the cell type responsible for proliferation and differentiationwithin the NHBE cell culture.
Through evaluation and development of a protocol to whole cigarette smoking, asuccessful set up was established for delivering cigarette smoke to the NHBE cellcultures in ALI, with a continuous medium fed to minimize effects of accumulationof cigarette smoke in the culture medium. The effects of an acute smoke exposurewere evaluated whereas the possibilities to perform chronic smoke exposure hasto be further evaluated. The cigarette smoke showed a major negative effect tothe migration, proliferation and physiological barriers. Through gene expressionanalysis a distinct stress response could be determined within both smoke exposedcell cultures as well as scratch wounded smoke exposed cultures. Following thecellular migration of scratch wounded cell cultures exposed to cigarette smoke, adistinct lag time was determined compared to scratch wounded cell cultures notexposed to cigarette smoke. This significant lag time could potentially be usedto investigate pharmaceutical compounds or cellular pathways response to cellularmigration.
The model used in this project should provide useful information for future devel-opment of wound healing assays performed through scratch assay, cigarette smokeexposure or a combination of the two. The analysis tools and results presented bythis project can serve as a base to future studies of NHBE cell cultures.

9 Future work 77
9 Future work
Visions of future work for this project could be proceeded through a number ofdifferent ideas. Following section will cover some ideas for refinement of the projectas well as new paths to discover.
As the evaluation of the model for compound treatment did not show any cleareffect, it would be interesting to do further experiments with higher compoundconcentrations in order to analyse potential effects to the cellular migration.
The upreuglation of MMP-9 seen during cellular migration could be used as ref-erence data to investigate changes in migration through inhibition or stimuli ofMMP-9 to scratch wounded cell cultures. By continuing development and refine-ment of the analysis method suggested by Alan Sabirsh presented in evaluation ofthe Cell-IQ system, the cellular migration could be analysed without introductionof scratch wounds to the cell cultures.
The wound healing model could be used to evaluate primary cells from asthmaticsand COPD donors and thereby compare differences between disease cultures tothe normal healthy cultures used in this project. The evaluation could reveal ifthe material collected from the disease donors is composed of a mixture of healthyand diseased cells as the cryopreservation of the cells could perhaps lead to thedeath of the disease cells, resulting in a culture with mixture of more healthy cells.To determine the state between disease and healthy cell material a first step couldbe to cultivate and investigate differences between cell populations, TEER, pro-tein and gene expression. If the results suggest differences between the diseaseand healthy donors the scratch assay could be used to investigate migration andproliferation in order to study effects of the disease connected to cellular function.However, the possibility of losing the disease phenotype in materials from diseasepatients should be considered during the cultivation. If there are no major differ-ences between the normal, asthmatic and COPD donors, different treatments ofhealthy cells could be evaluated in order to simulate of the disease states. Develop-ing methods for chronic smoking could be used to evaluate a disease response overtime comparable to COPD. Similar, disease relevant simulation of such as IL-13,an interleukin shown to be linked to allergen-induced and non allergen-inducedasthma [93], could be used to simulate and trigger the conditions of asthmatics.
To rationalize and automate the introduction of wounds to cell cultures, anotherbase for performing wounds could be investigated. By modifying a dispenser de-vice, such as a Multidrop, a defined small volume of a chemical, such as NaOH, fol-lowed with washing steps could be precision dispensed to each cell culture. NaOHhas been documented to successfully produce circular chemical wounds to NHBE

9 Future work 78
cultures [53, 62]. By using an automated device, the wound could be made in-dependent of performer and hopefully be made with high reproduction during ashort time interval. Although the NaOH exposure does not represent wounds seenin an in vivo disease state, it could be considered as an option when extensivewounds should be produced under a small time frame.
To develop further complexity to the existing NHBE ALI culture, development ofdifferent co-cultures could be studied to even further mimic the in vivo situation.Fibroblasts and immune cells could be cultivated together with NHBE cells wherethe scratch assay and smoke exposure could be used to investigate the effect ofco-cultures compared to NHBE cultures.

10 Acknowledgements 79
10 Acknowledgements
First, I would like to thank my supervisor Cecilia Forss for giving me the possibilityto perform my master thesis under her guidance at AstraZeneca. Your never endingenthusiasm and energy for science has really inspired and challenged me throughoutmy project. With all the fun we had I can say that I will look back at this timewith a big smile on my face, I never thought that it could be possible to have somuch fun. I would also like to thank Xioa-Hong Zhou for your expertise help withthe ICC. Your guidance and support led me to discover a completely new area forme. I am grateful for your never-ending patient, taking the time to answer all myquestions.
I would also like to thank everyone at AstraZeneca who has encouraged and helpedme throughout my project and the teams at RIA Bioscience for making me feelas a part of the section. With this, I would like to highlight my gratitude tofollowing persons, Lisa Jinton for all your help with the gene expression analysis,introducing me into the tremendous art of concentration needed to successfullymanually pipetting 384 well plates. Anna Forslow for your support and helpinghands with the Cell-IQ equipment. Sofia Lundin for introducing me to confocalmicroscopy. Maria Ahlefelt for teaching me the techniques of tissue embedding andsectioning. Alan Sabirsh for the help with analysing CellIQ videos. Kinga Balogh,Per Aberg, Ian Cotgreave and Hui Zhang for the help with choosing compoundsto test in my model.
To my mum and dad, Sinikka and Lars Carlsson, Therese Klang and all my friends,thank you for all your support.
I have had lots of fun during my time at AstraZeneca, everything from interactingwith scientists in the labs to be a part of the x-mas spex. It has been a wonderfultime where I have come in contact with lots of inspiring science and scientists,giving me a exciting time.
Last but not least, I would like to thank Melker Goransson and Eylem Gurcan forall the fun moments sharing office with you.
And Melker, it’ll all work out.

REFERENCES 80
References
[1] World health organization: Chronic obstructive pulmonary disease (copd),2012. URL http://www.who.int/mediacentre/factsheets/fs315/en/
index.html.
[2] World health organization: Chronic obstructive pulmonary disease (copd),2012. URL http://www.who.int/respiratory/copd/en/index.html.
[3] Barnes P., Drazen J., Stephen I. Rennard M. and Thomson N. Asthma andCOPD: Basic Mechanisms and Clinical Management. Academic Press, 2009.
[4] Huang S., Wiszniewski L. and Constant S. The use of in vitro 3d cell modelsin drug development for respiratory diseases. Tech December, 2011.
[5] Dvorak A., Tilley A.E., Shaykhiev R., Wang R. and Crystal R.G. Do airwayepithelium air–liquid cultures represent the in vivo airway epithelium tran-scriptome? American Journal of Respiratory Cell and Molecular Biology,2011. 44(4):465–473.
[6] Astrazeneca annual report 2012, 2012. URL http://www.astrazeneca-
annualreports.com/2012/documents/eng_download_centre/annual_
report.pdf.
[7] BeruBe K., Prytherch Z., Job C. and Hughes T. Human primary bronchiallung cell constructs: the new respiratory models. Toxicology, 2010.278(3):311–318.
[8] Tortora G.J. and Derrickson B. Essentials of anatomy and physiology: inter-national student version. Wiley, 2010.
[9] Gersh I. Epithelium, 2012. URL http://www.accessscience.com/content/
epithelium/238500.
[10] Kim K., McCracken K., Lee B., Shin C., Jo M., Lee C. et al. Airway gobletcell mucin: its structure and regulation of secretion. European RespiratoryJournal, 1997. 10(11):2644–2649.
[11] Fahy J.V. and Dickey B.F. Airway mucus function and dysfunction. NewEngland Journal of Medicine, 2010. 363(23):2233–2247.
[12] Rogers D.F. The airway goblet cell. The international journal of biochemistry& cell biology, 2003. 35(1):1–6.
[13] Alberts B. Molecular biology of the cell. Garland Science, 2000.

REFERENCES 81
[14] Jain R., Pan J., Driscoll J.A., Wisner J.W., Huang T., Gunsten S.P. et al.Temporal relationship between primary and motile ciliogenesis in airway ep-ithelial cells. American Journal of Respiratory Cell and Molecular Biology,2010. 43(6):731–739.
[15] Salathe M. Regulation of mammalian ciliary beating. Annual Review ofPhysiology, 2007. 69:401–422.
[16] Woo K., Jensen-Smith H.C., Luduena R.F. and Hallworth R. Differential syn-thesis of ß-tubulin isotypes in gerbil nasal epithelia. Cell and Tissue Research,2002. 309(2):331–335.
[17] Jensen-Smith H.C., Luduena R.F. and Hallworth R. Requirement for the ßiand ßiv tubulin isotypes in mammalian cilia. Cell Motility and the Cytoskele-ton, 2003. 55(3):213–220.
[18] Pedersen L.B. and Rosenbaum J.L. Chapter two intraflagellar transport (ift):role in ciliary assembly, resorption and signalling. Current topics in develop-mental biology, 2008. 85:23–61.
[19] Stewart C.E., Torr E.E., Mohd Jamili N.H., Bosquillon C. and Sayers I. Eval-uation of differentiated human bronchial epithelial cell culture systems forasthma research. Journal of allergy, 2012. 2012.
[20] Davenport J.R. and Yoder B.K. An incredible decade for the primary cilium:a look at a once-forgotten organelle. American Journal of Physiology-RenalPhysiology, 2005. 289(6):F1159–F1169.
[21] Yu X., Ng C.P., Habacher H. and Roy S. Foxj1 transcription factors aremaster regulators of the motile ciliogenic program. Nature genetics, 2008.40(12):1445–1453.
[22] Ostrowski L.E., Blackburn K., Radde K.M., Moyer M.B., Schlatzer D.M.,Moseley A. et al. A proteomic analysis of human cilia identification of novelcomponents. Molecular & Cellular Proteomics, 2002. 1(6):451–465.
[23] Grizzi F., Chiriva-Internati M., Franceschini B., Bumm K., Colombo P., Ci-ccarelli M. et al. Sperm protein 17 is expressed in human somatic ciliatedepithelia. Journal of Histochemistry & Cytochemistry, 2004. 52(4):549–554.
[24] Jones C.J. Epithelia: Advances in Cell Physiology and Cell Culture. KluwerAcademic Publishers, 1990.

REFERENCES 82
[25] Rock J.R., Onaitis M.W., Rawlins E.L., Lu Y., Clark C.P., Xue Y. et al.Basal cells as stem cells of the mouse trachea and human airway epithelium.Proceedings of the National Academy of Sciences, 2009. 106(31):12771–12775.
[26] Stripp B.R. and Reynolds S.D. Maintenance and repair of the bronchiolarepithelium. Proceedings of the American Thoracic Society, 2008. 5(3):328.
[27] Reynolds S.D. and Malkinson A.M. Clara cell: progenitor for the bronchiolarepithelium. The international journal of biochemistry & cell biology, 2010.42(1):1–4.
[28] Scholzen T. and Gerdes J. The ki-67 protein: from the known and the un-known. Journal of cellular physiology, 2000. 182(3):311–322.
[29] Rose D., Maddox P. and Brown D. Which proliferation markers for routineimmunohistology? a comparison of five antibodies. Journal of clinical pathol-ogy, 1994. 47(11):1010–1014.
[30] Nawijn M.C., Hackett T.L., Postma D.S., van Oosterhout A.J. and HeijinkI.H. E-cadherin: gatekeeper of airway mucosa and allergic sensitization.Trends in immunology, 2011. 32(6):248–255.
[31] Berx G., Becker K.F., Hofler H. and Van Roy F. Mutations of the humane-cadherin (cdh1) gene. Human mutation, 1998. 12(4):226–237.
[32] Boitano S., Sanderson M.J. and Dirksen E.R. A role for ca (2+)-conductingion channels in mechanically-induced signal transduction of airway epithelialcells. Journal of cell science, 1994. 107(11):3037–3044.
[33] Celli B., MacNee W., Agusti A., Anzueto A., Berg B., Buist A. et al. Stan-dards for the diagnosis and treatment of patients with copd: a summary of theats/ers position paper. European Respiratory Journal, 2004. 23(6):932–946.
[34] Chung K. Airway Smooth Muscle in Asthma and COPD: Biology and Phar-macology. Wiley, 2008.
[35] World health organization: Chronic obstructive pulmonary disease (copd),2012. URL http://www.who.int/respiratory/copd/en/.
[36] World health organization: Asthma, 2013. URL http://www.who.int/
mediacentre/factsheets/fs307/en/index.html.
[37] Coraux C., Hajj R., Lesimple P. and Puchelle E. In vivo models of humanairway epithelium repair and regeneration. European Respiratory Review,2005. 14(97):131–136.

REFERENCES 83
[38] Montefort S., Roberts J., Beasley R., Holgate S. and Roche W. The site of dis-ruption of the bronchial epithelium in asthmatic and non-asthmatic subjects.Thorax, 1992. 47(7):499–503.
[39] Yu H., Li Q., Kolosov V.P., Perelman J.M. and Zhou X. Regulation ofcigarette smoke-mediated mucin expression by hypoxia-inducible factor-1αvia epidermal growth factor receptor-mediated signaling pathways. Journalof Applied Toxicology, 2012. 32(4):282–292.
[40] Di Y.P., Zhao J. and Harper R. Cigarette smoke induces muc5ac proteinexpression through the activation of sp1. Journal of Biological Chemistry,2012. 287(33):27948–27958.
[41] Shaykhiev R., Otaki F., Bonsu P., Dang D.T., Teater M., Strulovici-BarelY. et al. Cigarette smoking reprograms apical junctional complex moleculararchitecture in the human airway epithelium in vivo. Cellular and MolecularLife Sciences, 2011. 68(5):877–892.
[42] Heijink I.H., Brandenburg S.M., Postma D.S. and van Oosterhout A.J.Cigarette smoke impairs airway epithelial barrier function and cell–cell con-tact recovery. European Respiratory Journal, 2012. 39(2):419–428.
[43] Maunders H., Patwardhan S., Phillips J., Clack A. and Richter A. Hu-man bronchial epithelial cell transcriptome: gene expression changes follow-ing acute exposure to whole cigarette smoke in vitro. American Journalof Physiology-Lung Cellular and Molecular Physiology, 2007. 292(5):L1248–L1256.
[44] Beisswenger C., Platz J., Seifart C., Vogelmeier C. and Bals R. Exposure ofdifferentiated airway epithelial cells to volatile smoke in vitro. Respiration,2004. 71(4):402–409.
[45] Mio T., Romberger D.J., Thompson A.B., Robbins R.A., Heires A. and Ren-nard S.I. Cigarette smoke induces interleukin-8 release from human bronchialepithelial cells. American journal of respiratory and critical care medicine,1997. 155(5):1770–1776.
[46] Baggiolini M. and Clark-Lewis I. Interleukin-8, a chemotactic and inflamma-tory cytokine. FEBS letters, 1992. 307(1):97–101.
[47] Wang H., Liu X., Umino T., Skold C.M., Zhu Y., Kohyama T. et al. Cigarettesmoke inhibits human bronchial epithelial cell repair processes. Americanjournal of respiratory cell and molecular biology, 2001. 25(6):772–779.

REFERENCES 84
[48] Coraux C., Martinella-Catusse C., Nawrocki-Raby B., Hajj R., Burlet H.,Escotte S. et al. Differential expression of matrix metalloproteinases andinterleukin-8 during regeneration of human airway epithelium in vivo. TheJournal of pathology, 2005. 206(2):160–169.
[49] Ganesan S. and Sajjan U.S. Repair and remodeling of airway epithelium afterinjury in chronic obstructive pulmonary disease. Current Respiratory CareReports, 2013. pages 1–10.
[50] Crosby L.M. and Waters C.M. Epithelial repair mechanisms in the lung.American Journal of Physiology-Lung Cellular and Molecular Physiology,2010. 298(6):L715–L731.
[51] Chen P. and Parks W.C. Role of matrix metalloproteinases in epithelial mi-gration. Journal of cellular biochemistry, 2009. 108(6):1233–1243.
[52] Legrand C., Gilles C., Zahm J.M., Polette M., Buisson A.C., Kaplan H. et al.Airway epithelial cell migration dynamics: Mmp-9 role in cell–extracellularmatrix remodeling. The Journal of cell biology, 1999. 146(2):517–529.
[53] Buisson A.C., Zahm J.M., Polette M., Pierrot D., Bellon G., Puchelle E. et al.Gelatinase b is involved in the in vitro wound repair of human respiratoryepithelium. Journal of cellular physiology, 1996. 166(2):413–426.
[54] BeruBe K., Aufderheide M., Breheny D., Clothier R., Combes R., DuffinR. et al. In vitro models of inhalation toxicity and disease. Alternatives toLaboratory Animals, 2009. 37(1):89–141.
[55] Lin H., Li H., Cho H.J., Bian S., Roh H.J., Lee M.K. et al. Air-liquid interface(ali) culture of human bronchial epithelial cell monolayers as an in vitro modelfor airway drug transport studies. Journal of pharmaceutical sciences, 2007.96(2):341–350.
[56] Dvorak A., Tilley A.E., Shaykhiev R., Wang R. and Crystal R.G. Do airwayepithelium air–liquid cultures represent the in vivo airway epithelium tran-scriptome? American journal of respiratory cell and molecular biology, 2011.44(4):465.
[57] White S.R., Dorscheid D.R., Rabe K.F., Wojcik K.R. and Hamann K.J. Roleof very late adhesion integrins in mediating repair of human airway epithelialcell monolayers after mechanical injury. American journal of respiratory celland molecular biology, 1999. 20(4):787–796.

REFERENCES 85
[58] Howat W.J., Holgate S.T. and Lackie P.M. Tgf-β isoform release and activa-tion during in vitro bronchial epithelial wound repair. American Journal ofPhysiology-Lung Cellular and Molecular Physiology, 2002. 282(1):L115–L123.
[59] Malavia N.K., Raub C.B., Mahon S.B., Brenner M., Panettieri Jr R.A. andGeorge S.C. Airway epithelium stimulates smooth muscle proliferation. Amer-ican journal of respiratory cell and molecular biology, 2009. 41(3):297.
[60] Planus E., Galiacy S., Matthay M., Laurent V., Gavrilovic J., Murphy G.et al. Role of collagenase in mediating in vitro alveolar epithelial woundrepair. Journal of Cell Science, 1999. 112(2):243–252.
[61] Lechapt-Zalcman E., Pruliere-Escabasse V., Advenier D., Galiacy S.,Charriere-Bertrand C., Coste A. et al. Transforming growth factor-β1 in-creases airway wound repair via mmp-2 upregulation: a new pathway forepithelial wound repair? American Journal of Physiology-Lung Cellular andMolecular Physiology, 2006. 290(6):L1277–L1282.
[62] Zahm J.M., Kaplan H., Herard A.L., Doriot F., Pierrot D., Somelette P.et al. Cell migration and proliferation during the in vitro wound repair of therespiratory epithelium. Cell motility and the cytoskeleton, 1997. 37(1):33–43.
[63] Crespin S., Bacchetta M., Huang S., Dudez T., Wiszniewski L. and ChansonM. Approaches to study differentiation and repair of human airway epithelialcells. In Cystic Fibrosis, pages 173–185. Springer, 2011.
[64] Rodgman A. and Perfetti T.A. The chemical components of tobacco andtobacco smoke. CRC press, 2013.
[65] Keith C. and Tesh P. Measurement of the total smoke issuing from a burningcigarette. Tobacco Science, 1965. 9:61–64.
[66] Liu X., Conner H., Kobayashi T., Kim H., Wen F., Abe S. et al. Cigarettesmoke extract induces dna damage but not apoptosis in human bronchialepithelial cells. American journal of respiratory cell and molecular biology,2005. 33(2):121–129.
[67] Chiappara G., Gjomarkaj M., Virzi A., Sciarrino S., Ferraro M., Bruno A.et al. The role of p21 waf1/cip1 in large airway epithelium in smokers withand without copd. Biochimica et Biophysica Acta (BBA)-Molecular Basis ofDisease, 2013.
[68] Hellermann G.R., Nagy S.B., Kong X., Lockey R.F. and Mohapatra S.S.Mechanism of cigarette smoke condensate-induced acute inflammatory re-sponse in human bronchial epithelial cells. Respiratory research, 2002. 3(1):22.

REFERENCES 86
[69] Lavigne M.C. and Eppihimer M.J. Cigarette smoke condensate induces mmp-12 gene expression in airway-like epithelia. Biochemical and biophysical re-search communications, 2005. 330(1):194–203.
[70] Mathis C., Poussin C., Weisensee D., Gebel S., Hengstermann A., Sewer A.et al. Human bronchial epithelial cells exposed in vitro to cigarette smokeat the air-liquid interface resemble bronchial epithelium from human smok-ers. American Journal of Physiology-Lung Cellular and Molecular Physiology,2013. 304(7):L489–L503.
[71] Phillips J., Kluss B., Richter A., Massey E. et al. Exposure of bronchialepithelial cells to whole cigarette smoke: assessment of cellular responses.Alternatives to Laboratory Animals, 2005. 33(3):239–48.
[72] Kaur N., Lacasse M., Roy J.P., Cabral J.L., Adamson J., Errington G. et al.Evaluation of precision and accuracy of the borgwaldt rm20s R© smoking ma-chine designed for in vitro exposure. Inhalation toxicology, 2010. 22(14):1174–1183.
[73] Lie Y.S. and Petropoulos C.J. Advances in quantitative pcr technology: 5’nuclease assays. Current opinion in biotechnology, 1998. 9(1):43–48.
[74] Heid C.A., Stevens J., Livak K.J. and Williams P.M. Real time quantitativepcr. Genome research, 1996. 6(10):986–994.
[75] Stevenson B.R., Anderson J.M. and Bullivant S. The epithelial tight junction:structure, function and preliminary biochemical characterization. Molecularand cellular biochemistry, 1988. 83(2):129–145.
[76] Balder R., Krunkosky T.M., Nguyen C.Q., Feezel L. and Lafontaine E.R. Hagmediates adherence of moraxella catarrhalis to ciliated human airway cells.Infection and Immunity, October 2009. 77(10):4597–4608.
[77] Pan J., You Y., Huang T. and Brody S.L. Rhoa-mediated apical actin en-richment is required for ciliogenesis and promoted by foxj1. Journal of CellScience, 2007. 120(11):1868–1876.
[78] Wong A.P., Bear C.E., Chin S., Pasceri P., Thompson T.O., Huan L.J. et al.Directed differentiation of human pluripotent stem cells into mature airwayepithelia expressing functional cftr protein. Nat Biotech, 2012. 30(9):876–882.
[79] Stewart C., Torr E., Jamili M., Nur H., Bosquillon C. and Sayers I. Evaluationof differentiated human bronchial epithelial cell culture systems for asthmaresearch. Journal of Allergy, 2012. 2012:1–11.
REFERENCES 87
[80] Turner J., Roger J., Fitau J., Combe D., Giddings J., Heeke G.V. et al.Goblet cells are derived from a foxj1-expressing progenitor in a human airwayepithelium. American Journal of Respiratory Cell and Molecular Biology,2011. 44(3):276–284.
[81] Delgado O., Kaisani A.A., Spinola M., Xie X.J., Batten K.G., Minna J.D.et al. Multipotent capacity of immortalized human bronchial epithelial cells.PLoS ONE, 2011. 6(7):e22023.
[82] Sajjan U., Wang Q., Zhao Y., Gruenert D.C. and Hershenson M.B. Rhinovirusdisrupts the barrier function of polarized airway epithelial cells. AmericanJournal of Respiratory and Critical Care Medicine, 2008. 178(12):1271–1281.
[83] Humlicek A.L., Manzel L.J., Chin C.L., Shi L., Excoffon K.J.D.A., WinterM.C. et al. Paracellular permeability restricts airway epithelial responsesto selectively allow activation by mediators at the basolateral surface. TheJournal of Immunology, 2007. 178(10):6395–6403.
[84] Banks-Schlegel S. and Green H. Involucrin synthesis and tissue assembly bykeratinocytes in natural and cultured human epithelia. The Journal of cellbiology, 1981. 90(3):732–737.
[85] Tanabe T., Kanoh S., Moskowitz W.B. and Rubin B.K. Cardiac asthmatrans-forming growth factor-03b2 and cardiac asthmatransforming growth factor-βfrom the failing heart leads to squamous metaplasia in human airway cellsand in the murine lung. CHEST Journal, 2012. 142(5):1274–1283.
[86] Lotan R. Squamous cell differentiation markers in normal, premalignant, andmalignant epithelium: effects of retinoids. Journal of Cellular Biochemistry,1993. 53(S17F):167–174.
[87] Hong K.U., Reynolds S.D., Watkins S., Fuchs E. and Stripp B.R. Basal cellsare a multipotent progenitor capable of renewing the bronchial epithelium.The American journal of pathology, 2004. 164(2):577–588.
[88] Chen P. and Moldoveanu S. Mainstream smoke chemical analyses for2r4f kentucky reference cigarette. Beitrage zur Tabakforshung Interna-tional/Contributions to Tobacco Research, 2003.
[89] Noonan E.J., Place R.F., Giardina C. and Hightower L.E. Hsp70b’ regulationand function. Cell stress & chaperones, 2007. 12(4):393.
[90] Jauhiainen A., Thomsen C., Strombom L., Grundevik P., Andersson C.,Danielsson A. et al. Distinct cytoplasmic and nuclear functions of the stressinduced protein ddit3/chop/gadd153. PloS one, 2012. 7(4):e33208.

REFERENCES 88
[91] Das S.K., Sharma N.K., Hasstedt S.J., Mondal A.K., Ma L., LangbergK.A. et al. An integrative genomics approach identifies activation of thiore-doxin/thioredoxin reductase-1-mediated oxidative stress defense pathway andinhibition of angiogenesis in obese nondiabetic human subjects. Journal ofClinical Endocrinology & Metabolism, 2011. 96(8):E1308–E1313.
[92] Minor L.K. Handbook of assay development in drug discovery. CRC Press,2010.
[93] Humbert M., Durham S.R., Kimmitt P., Powell N., Assoufi B., Pfister R.et al. Elevated expression of messenger ribonucleic acid encoding il-13 in thebronchial mucosa of atopic and nonatopic subjects with asthma. Journal ofAllergy and Clinical Immunology, 1997. 99(5):657–665.

89
Appendices
A Media
2x ALI medium
· Bronchial Epithelial cell Basal Medium (BEBM), 250 ml (Lonza, CC-3171)· Bronchial Epithelial cell Growth Medium (BEGM), Single quots (Lonza,
CC-4175), except Retionic acid (CC- 4085F)· BSA for 2x ALI (1.5 mg/ml), 500 µl
DMEM complete medium
· Dulbecco’s Modified Eagle Medium (DMEM), 500 ml (Gibco, 41965-039)· Minimum Essential Medium Non-Essential Amino Acids (MEM NEAA) 100X,
5 ml (Gibco, 11140-035)· Sodium Pyruvate (NaPyr) 100mM, 5 ml (Gibco, 11360-039)· L-Glutamine 200 mM, 5 ml (Gibco, 25030-024)
ALI medium ready-to-use
· x ml DMEM complete medium· x ml 2x ALI medium· x µl Retionic acid (0.1 mM)
NHBE medium
· Bronchial Epithelial cell Basal Medium (BEBM), 500 ml (Lonza, CC-3171)· Bronchial Epithelial cell Growth Medium (BEGM), Single quots (Lonza,
CC-4175)
Bronchial Epithelial cell Growth Medium (BEGM) (Lonza, CC-4175)
· Bovine Pituitary Extract 2 ml (Lonza, CC-4009F)· Insulin 0.5 ml (Lonza, CC-4021F)· Hydrocortisone 0.5 ml (Lonza, CC-4031F)· Gentamicin sulfate amphotericin-B -1000 0.5 ml (Lonza, CC-4081F)· Retionic acid 0.5 ml (Lonza, CC-4085F)· Transferrin 0.5 ml (Lonza, CC-4205F)· Triiodothyronine 0.5 ml (Lonza, CC-4211F)· Epinephrine 0.5 ml (Lonza, CC-4221F)· Human epidermal growth factor 0.5 ml (Lonza, CC-4230F)

A Media 90
BSA for 2x ALI (1.5 mg/ml)
· BSA (Sigma, A2153)· NHBE medium
Retinoic acid 0.1 mM
· Retinoic acid (Sigma, R2625)· DMSO (Sigma, D2438)
PureCol 3 µg/ml
· Purified bovine collagen solution 3 mg/ml (Advanced BioMatrix, 5005-B)· Steril dd-H20

B Dehydration of ALI cultures 91
B Dehydration of ALI cultures
Table B1: Dehydration of ALI cultures
Step Reagent Time
1 70% EtOH 30 min
2 80% EtOH 15 min
3 95% EtOH 30 min
4 95% EtOH 30 min
5 Abs 99% EtOH 30 min
6 Abs 99% EtOH 15 min
7 Abs 99% EtOH 15 min
8 Xylene 15 min
9 Xylene 15 min
10 Paraffin 45 min
11 Paraffin 45 min
12 Paraffin 30 min

C Mayers Htx/Eosin staining 92
C Mayers Htx/Eosin staining
Table C1: Mayers Htx/Eosin staining
Step Reagent Time
1 Xylene 5 min
2 Xylene 5 min
3 Abs 99% EtOH 5 min
4 Abs 99% EtOH 5 min
5 95% EtOH 5 min
6 95% EtOH 5 min
7 Mayers Htx 8 min
8 H2O 5 min
9 Eosin 5 min
10 70% EtOH 1 sec
11 95% EtOH 1 sec
12 95% EtOH 1 sec
13 Abs 99% EtOH 1 sec
14 Abs 99% EtOH 1 sec
15 Xylene 5 min
16 Xylene 5 min

D TaqMan 93
D TaqMan
D.1 RNA purification
Table D1: RNA purification
Step Description Volume [µl] Time [s] Vacuum [%]
- Pre-wet all wells withRNA Purification Washsolution 1
40 - -
1 Load samples 200 120 20
2 Add RNA PurificationWash Solution 1
500 120 20
3 Add RNA PurificationWash Solution 2
650 120 20
4 Add AbsoluteRNAWash Solution andincubate
50 900 -
5 Add RNA PurificationWash Solution 2 and in-cubate
400 300 -
6 Removal of solutions - 120 20
7 Add RNA PurificationWash Solution 2
300 120 20
8 Add RNA PurificationWash Solution 2
300 120 20
9 Pre-Elution Vacuum - 300 90
10 Add Nucleic Acid Pu-rification Elution Solu-tion
100 120 20
Reagents
RNA Purification Wash Solution 1 (Applied biosystems, 4305891)RNA Purification Wash Solution 2 (Applied biosystems, 4305890)AbsoluteRNA Wash Solution (Applied biosystems, 4305545)Nucleic Acid Purification Elution Solution (Applied biosystems, 4305893)

D.2 TaqMan assay mix 94
D.2 TaqMan assay mix
Table D2: TaqMan assay mix
Control genes [µl/rxn] Genes [µl/rxn]
Beta actin GAPDH 36B4 Gene Expression Assay
X2 Primers 5 5 5 5
FP 10 µM - 0.1 - -
RP 10 µM - 0.1 - -
Probe 20 µM - 0.1 - -
FP/RP mix 10 µM - - 0.4 -
Probe 5 µM - - 0.4 -
GE Assay Mix 0.5 - - 0.5
H2O 1.5 1.7 1.2 1.5
Total volume 7 7 7 7

E Antibody evaluation 95
E Antibody evaluation
Figure E1: Immunofluorescent staining of ciliated cells through staining by SP17(Sigma).
Figure E2: Immunofluorescent staining of basal cells through nuclear staining byp63 (Santa Cruz).

E Antibody evaluation 96
Figure E3: Immunofluorescent staining of cytoskeletal βIV -tubulin through stain-ing by TUBB4 (Novus).
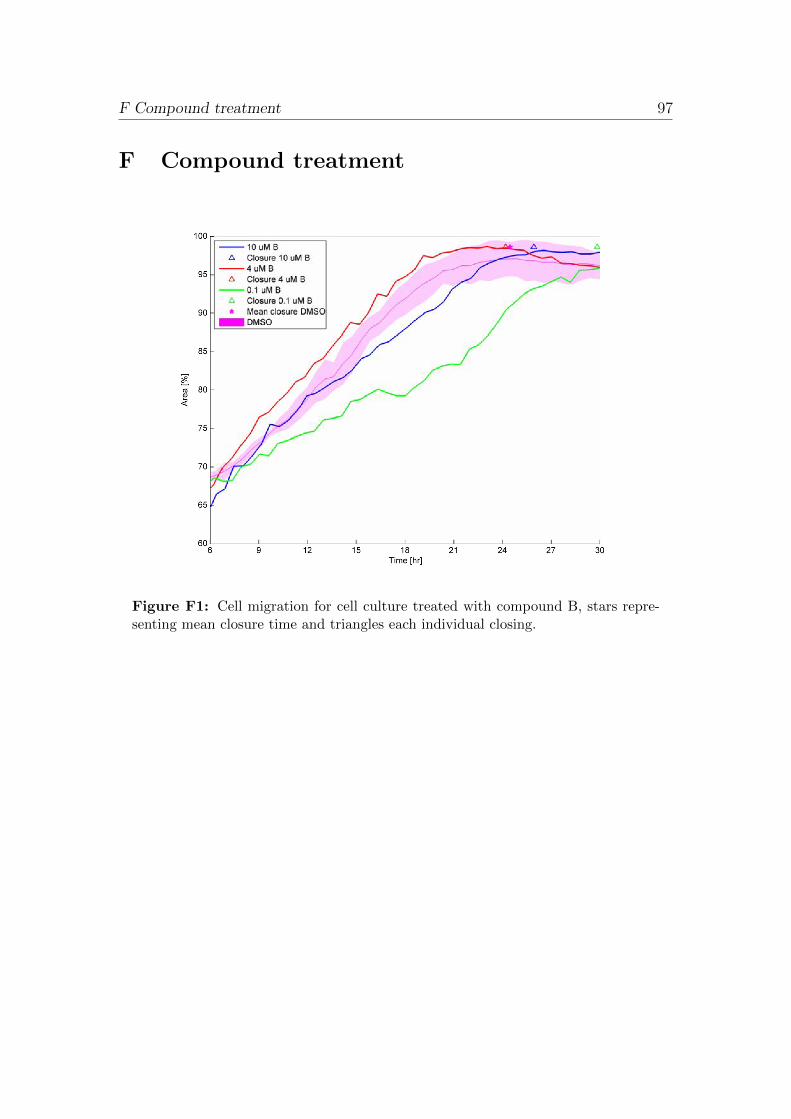
F Compound treatment 97
F Compound treatment
Figure F1: Cell migration for cell culture treated with compound B, stars repre-senting mean closure time and triangles each individual closing.

F Compound treatment 98
Figure F2: Cell migration for cell culture treated with positive control compoundC, stars representing mean closure time and triangles each individual closing.