boundary crossing in epithelial wound healingwound healing. conventional scratch-wound assays are of...
TRANSCRIPT
Boundary crossing in epithelial wound healingEileen Fonga,1, Shelly Tzlilb,1, and David A. Tirrellb,c,2
aDepartment of Bioengineering, bDivision of Chemistry and Chemical Engineering, and cJoseph J. Jacobs Institute for Molecular Engineering for Medicine,California Institute of Technology, Pasadena, CA 91125
Edited by Steven Boxer, Stanford University, Stanford, CA, and approved September 7, 2010 (received for review June 11, 2010)
The processes of wound healing and collective cell migration havebeen studied for decades. Intensive research has been devotedto understanding the mechanisms involved in wound healing,but the role of cell-substrate interactions is still not thoroughlyunderstood. Here we probe the role of cell-substrate interactionsby examining in vitro the healing of monolayers of human cornealepithelial (HCE) cells cultured on artificial extracellular matrix(aECM) proteins. We find that the rate of wound healing is depen-dent on the concentration of fibronectin-derived (RGD) cell-adhe-sion ligands in the aECM substrate. The wound closure rate variesnearly sixfold on the substrates examined, despite the fact that therates of migration and proliferation of individual cells show littlesensitivity to the RGD concentration (which varies 40-fold). Toexplain this apparent contradiction, we study collective migrationby means of a dynamic Monte Carlo simulation. The cells in thesimulation spread, retract, and proliferate with probabilities ob-tained from a simple phenomenological model. The results indicatethat the overall wound closure rate is determined primarily by therate at which cells cross the boundary between the aECM proteinand the matrix deposited under the cell sheet.
biomaterials ∣ integrins ∣ elastin
The collective migration of cells is fundamental to wound heal-ing, morphogenesis, and many bioengineering applications.
Wound healing in particular involves the migration of cell sheetsover adhesive surfaces. Two mechanisms of migration have beenidentified in wound healing (1). First is the “purse string” me-chanism in which a marginal actomyosin cable develops alongthe wound edge, and wound closure proceeds with contractionof the actin belt (2). The second mechanism involves activespreading and migration of cells at the wound edge, known com-monly as “lamellipodial crawling.” The latter mechanism is morefrequently observed in vitro and has been characterized by usingscratch-wound models. In these models, cells experience an in-jury, which triggers cell migration through various biochemicalsignaling events (3). It has also been argued that the availabilityof free space is sufficient to initiate cell migration in the absenceof mechanical injury (4–6). Upon wounding, proliferation isup-regulated (7).
Adhesive cell-substratum interactions are required for sus-tained migration into the wound area (8, 9). The rates of migra-tion of individual cells are governed by surface adhesivity in abiphasic fashion, at least under certain conditions (10). Surfacesmodified with adhesion ligands such as fibronectin (FN) (11–13)and Arg-Gly-Asp (RGD) peptides have been shown to facilitatewound healing, and it is reasonable to infer that the observedincreases in healing rates arise primarily from faster migrationof individual cells. We show here that other factors can be moreimportant.
The substrates used in this work were prepared from artificialextracellular matrix (aECM) proteins that combine domainsderived from fibronectin and elastin (Fig. S1). We and othershave shown that such aECM proteins can be cross-linked to yieldmaterials with elastic moduli similar to those of natural elastins(14, 15) and that presentation of the fibronectin-derived RGDsequence promotes cell spreading and adhesion (16–18).
Wound healing was examined in monolayers of human cornealepithelial cells (HCE) cultured on aECM protein substrates thatpresent controlled, varying densities of the RGD sequence. HCEcells undergo rapid reepithelization in vivo (19). Both the α5β1and αvβ3 integrins, which bind RGD, are up-regulated by wound-ing (20). Cross-linked films with estimated RGD surface densitiesvarying from 7.7 × 10³ to 3.1 × 10⁵ per μm2 were prepared bymixing aECM proteins containing RGD and “scrambled” (RDG)domains (see SI Text). Substrates are identified by specifying thepercentage of the RGD protein in the film (e.g., 100% RGD).
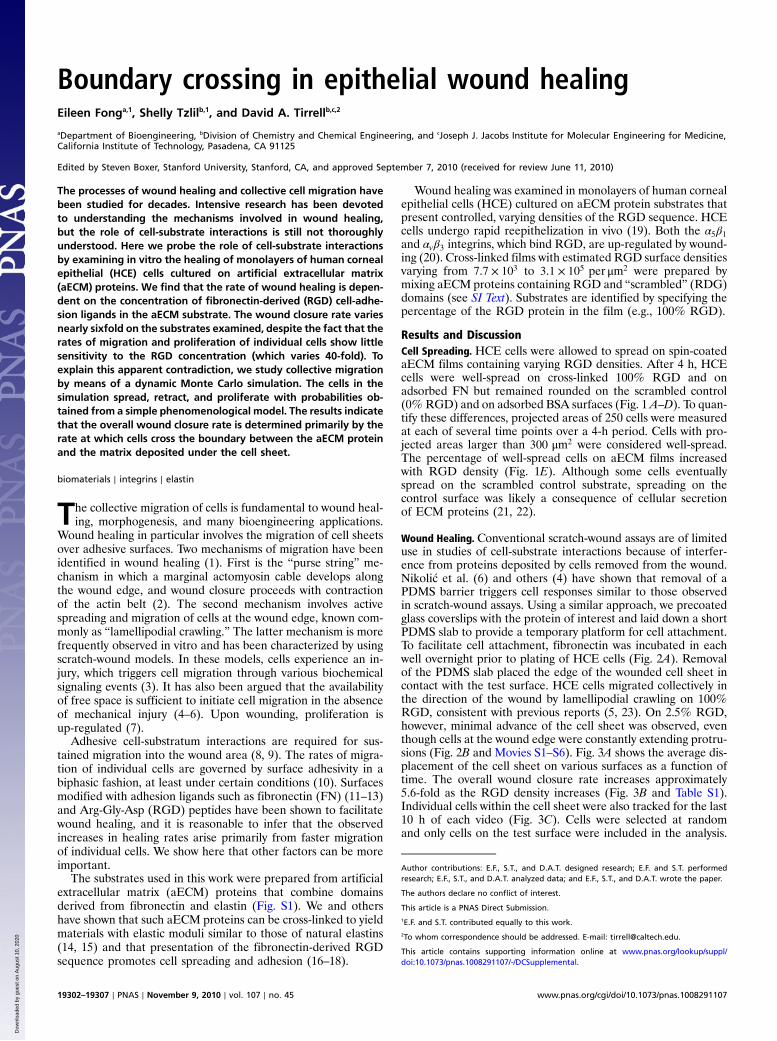
Results and DiscussionCell Spreading. HCE cells were allowed to spread on spin-coatedaECM films containing varying RGD densities. After 4 h, HCEcells were well-spread on cross-linked 100% RGD and onadsorbed FN but remained rounded on the scrambled control(0% RGD) and on adsorbed BSA surfaces (Fig. 1 A–D). To quan-tify these differences, projected areas of 250 cells were measuredat each of several time points over a 4-h period. Cells with pro-jected areas larger than 300 μm2 were considered well-spread.The percentage of well-spread cells on aECM films increasedwith RGD density (Fig. 1E). Although some cells eventuallyspread on the scrambled control substrate, spreading on thecontrol surface was likely a consequence of cellular secretionof ECM proteins (21, 22).
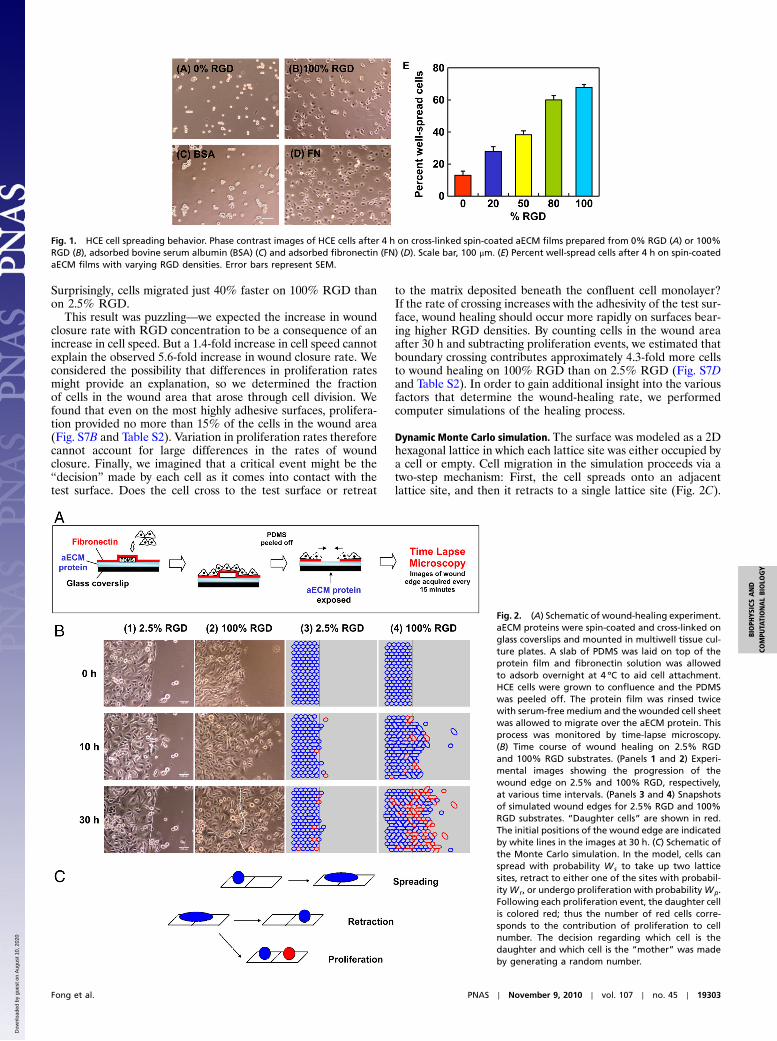
Wound Healing. Conventional scratch-wound assays are of limiteduse in studies of cell-substrate interactions because of interfer-ence from proteins deposited by cells removed from the wound.Nikolić et al. (6) and others (4) have shown that removal of aPDMS barrier triggers cell responses similar to those observedin scratch-wound assays. Using a similar approach, we precoatedglass coverslips with the protein of interest and laid down a shortPDMS slab to provide a temporary platform for cell attachment.To facilitate cell attachment, fibronectin was incubated in eachwell overnight prior to plating of HCE cells (Fig. 2A). Removalof the PDMS slab placed the edge of the wounded cell sheet incontact with the test surface. HCE cells migrated collectively inthe direction of the wound by lamellipodial crawling on 100%RGD, consistent with previous reports (5, 23). On 2.5% RGD,however, minimal advance of the cell sheet was observed, eventhough cells at the wound edge were constantly extending protru-sions (Fig. 2B and Movies S1–S6). Fig. 3A shows the average dis-placement of the cell sheet on various surfaces as a function oftime. The overall wound closure rate increases approximately5.6-fold as the RGD density increases (Fig. 3B and Table S1).Individual cells within the cell sheet were also tracked for the last10 h of each video (Fig. 3C). Cells were selected at randomand only cells on the test surface were included in the analysis.
Author contributions: E.F., S.T., and D.A.T. designed research; E.F. and S.T. performedresearch; E.F., S.T., and D.A.T. analyzed data; and E.F., S.T., and D.A.T. wrote the paper.
The authors declare no conflict of interest.
This article is a PNAS Direct Submission.1E.F. and S.T. contributed equally to this work.2To whom correspondence should be addressed. E-mail: [email protected].
This article contains supporting information online at www.pnas.org/lookup/suppl/doi:10.1073/pnas.1008291107/-/DCSupplemental.
19302–19307 ∣ PNAS ∣ November 9, 2010 ∣ vol. 107 ∣ no. 45 www.pnas.org/cgi/doi/10.1073/pnas.1008291107
Dow
nloa
ded
by g
uest
on
Aug
ust 1
0, 2
020
Surprisingly, cells migrated just 40% faster on 100% RGD thanon 2.5% RGD.
This result was puzzling—we expected the increase in woundclosure rate with RGD concentration to be a consequence of anincrease in cell speed. But a 1.4-fold increase in cell speed cannotexplain the observed 5.6-fold increase in wound closure rate. Weconsidered the possibility that differences in proliferation ratesmight provide an explanation, so we determined the fractionof cells in the wound area that arose through cell division. Wefound that even on the most highly adhesive surfaces, prolifera-tion provided no more than 15% of the cells in the wound area(Fig. S7B and Table S2). Variation in proliferation rates thereforecannot account for large differences in the rates of woundclosure. Finally, we imagined that a critical event might be the“decision” made by each cell as it comes into contact with thetest surface. Does the cell cross to the test surface or retreat
to the matrix deposited beneath the confluent cell monolayer?If the rate of crossing increases with the adhesivity of the test sur-face, wound healing should occur more rapidly on surfaces bear-ing higher RGD densities. By counting cells in the wound areaafter 30 h and subtracting proliferation events, we estimated thatboundary crossing contributes approximately 4.3-fold more cellsto wound healing on 100% RGD than on 2.5% RGD (Fig. S7Dand Table S2). In order to gain additional insight into the variousfactors that determine the wound-healing rate, we performedcomputer simulations of the healing process.
Dynamic Monte Carlo simulation. The surface was modeled as a 2Dhexagonal lattice in which each lattice site was either occupied bya cell or empty. Cell migration in the simulation proceeds via atwo-step mechanism: First, the cell spreads onto an adjacentlattice site, and then it retracts to a single lattice site (Fig. 2C).
Fig. 1. HCE cell spreading behavior. Phase contrast images of HCE cells after 4 h on cross-linked spin-coated aECM films prepared from 0% RGD (A) or 100%RGD (B), adsorbed bovine serum albumin (BSA) (C) and adsorbed fibronectin (FN) (D). Scale bar, 100 μm. (E) Percent well-spread cells after 4 h on spin-coatedaECM films with varying RGD densities. Error bars represent SEM.
Fig. 2. (A) Schematic of wound-healing experiment.aECM proteins were spin-coated and cross-linked onglass coverslips and mounted in multiwell tissue cul-ture plates. A slab of PDMS was laid on top of theprotein film and fibronectin solution was allowedto adsorb overnight at 4 ºC to aid cell attachment.HCE cells were grown to confluence and the PDMSwas peeled off. The protein film was rinsed twicewith serum-free medium and the wounded cell sheetwas allowed to migrate over the aECM protein. Thisprocess was monitored by time-lapse microscopy.(B) Time course of wound healing on 2.5% RGDand 100% RGD substrates. (Panels 1 and 2) Experi-mental images showing the progression of thewound edge on 2.5% and 100% RGD, respectively,at various time intervals. (Panels 3 and 4) Snapshotsof simulated wound edges for 2.5% RGD and 100%RGD substrates. “Daughter cells” are shown in red.The initial positions of the wound edge are indicatedby white lines in the images at 30 h. (C) Schematic ofthe Monte Carlo simulation. In the model, cells canspread with probability Ws to take up two latticesites, retract to either one of the sites with probabil-ityWr, or undergo proliferation with probabilityWp.Following each proliferation event, the daughter cellis colored red; thus the number of red cells corre-sponds to the contribution of proliferation to cellnumber. The decision regarding which cell is thedaughter and which cell is the “mother” was madeby generating a random number.
Fong et al. PNAS ∣ November 9, 2010 ∣ vol. 107 ∣ no. 45 ∣ 19303
BIOPH
YSICSAND
COMPU
TATIONALBIOLO
GY
Dow
nloa
ded
by g
uest
on
Aug
ust 1
0, 2
020
If retraction vacates the site occupied by the cell before it spread,migration has occurred.
We define the x-axis as the axis perpendicular to the woundedge, and the initial position of the wound edge (the boundary)as x ¼ 0. Thus, in the initial configuration of the simulation, cellsoccupy all the lattice sites whose x positions are smaller than zero,and the rest of the sites are empty. As the simulation progresses,cells cross the boundary into the wound area, and the value of x atthe wound edge position increases. We denote the transitionprobabilities for spreading, retraction, and proliferation by Ws,Wr , and Wp, respectively. We use a simple model for spreadingand retraction behavior to estimate the values of Ws and Wr forthe different surfaces, based on experimental data. Because FN isa major component of the matrix deposited beneath the conflu-ent monolayer, the probabilities for spreading and retractionfor lattice sites with x < 0 were taken to be those for FN. We es-timated the proliferation rate (Wp) by constructing rate equationsaccording to the simulation rules and solving them in the lowcell concentration limit. The doubling time was then comparedto experimental data.
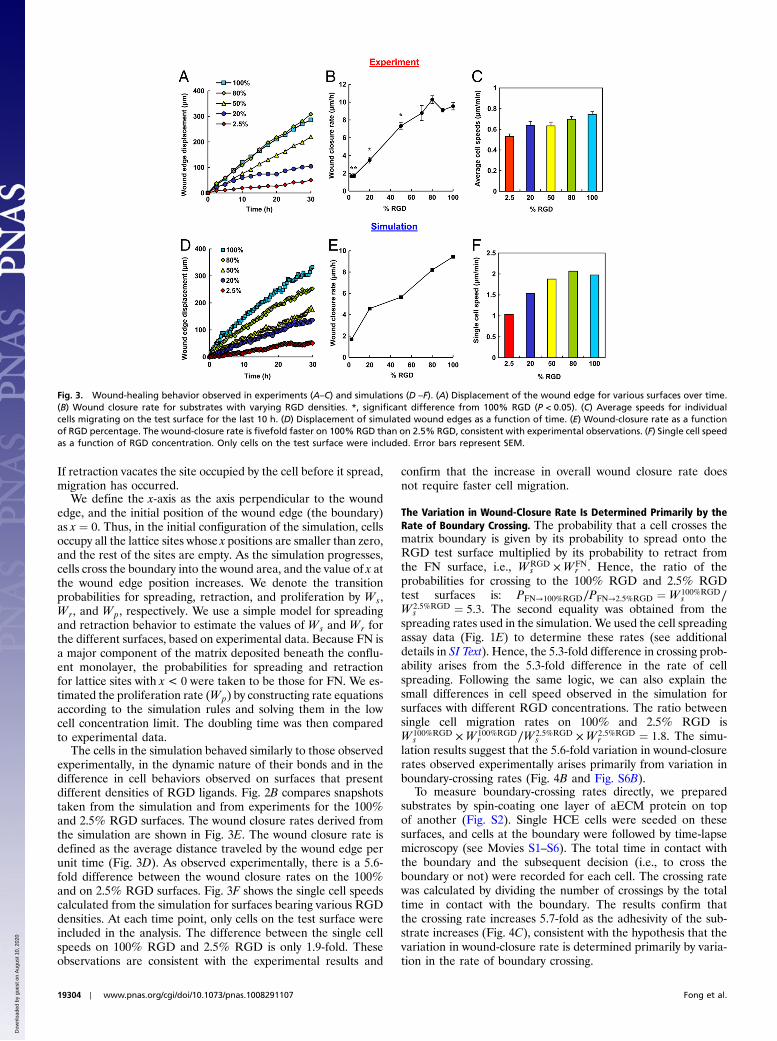
The cells in the simulation behaved similarly to those observedexperimentally, in the dynamic nature of their bonds and in thedifference in cell behaviors observed on surfaces that presentdifferent densities of RGD ligands. Fig. 2B compares snapshotstaken from the simulation and from experiments for the 100%and 2.5% RGD surfaces. The wound closure rates derived fromthe simulation are shown in Fig. 3E. The wound closure rate isdefined as the average distance traveled by the wound edge perunit time (Fig. 3D). As observed experimentally, there is a 5.6-fold difference between the wound closure rates on the 100%and on 2.5% RGD surfaces. Fig. 3F shows the single cell speedscalculated from the simulation for surfaces bearing various RGDdensities. At each time point, only cells on the test surface wereincluded in the analysis. The difference between the single cellspeeds on 100% RGD and 2.5% RGD is only 1.9-fold. Theseobservations are consistent with the experimental results and
confirm that the increase in overall wound closure rate doesnot require faster cell migration.
The Variation in Wound-Closure Rate Is Determined Primarily by theRate of Boundary Crossing. The probability that a cell crosses thematrix boundary is given by its probability to spread onto theRGD test surface multiplied by its probability to retract fromthe FN surface, i.e., WRGD
s ×WFNr . Hence, the ratio of the
probabilities for crossing to the 100% RGD and 2.5% RGDtest surfaces is: PFN→100%RGD∕PFN→2.5%RGD ¼ W 100%RGD
s ∕W 2.5%RGD
s ¼ 5.3. The second equality was obtained from thespreading rates used in the simulation. We used the cell spreadingassay data (Fig. 1E) to determine these rates (see additionaldetails in SI Text). Hence, the 5.3-fold difference in crossing prob-ability arises from the 5.3-fold difference in the rate of cellspreading. Following the same logic, we can also explain thesmall differences in cell speed observed in the simulation forsurfaces with different RGD concentrations. The ratio betweensingle cell migration rates on 100% and 2.5% RGD isW 100%RGD
s ×W 100%RGDr ∕W 2.5%RGD
s ×W 2.5%RGDr ¼ 1.8. The simu-
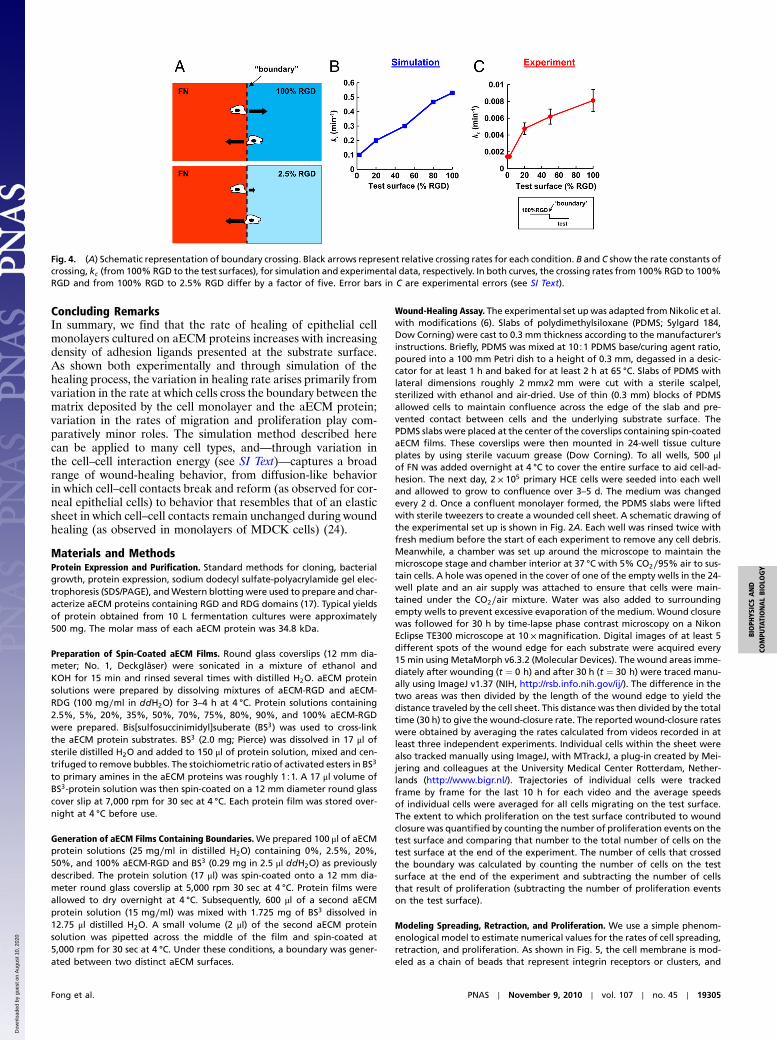
lation results suggest that the 5.6-fold variation in wound-closurerates observed experimentally arises primarily from variation inboundary-crossing rates (Fig. 4B and Fig. S6B).
To measure boundary-crossing rates directly, we preparedsubstrates by spin-coating one layer of aECM protein on topof another (Fig. S2). Single HCE cells were seeded on thesesurfaces, and cells at the boundary were followed by time-lapsemicroscopy (see Movies S1–S6). The total time in contact withthe boundary and the subsequent decision (i.e., to cross theboundary or not) were recorded for each cell. The crossing ratewas calculated by dividing the number of crossings by the totaltime in contact with the boundary. The results confirm thatthe crossing rate increases 5.7-fold as the adhesivity of the sub-strate increases (Fig. 4C), consistent with the hypothesis that thevariation in wound-closure rate is determined primarily by varia-tion in the rate of boundary crossing.
Fig. 3. Wound-healing behavior observed in experiments (A–C) and simulations (D –F). (A) Displacement of the wound edge for various surfaces over time.(B) Wound closure rate for substrates with varying RGD densities. *, significant difference from 100% RGD (P < 0.05). (C) Average speeds for individualcells migrating on the test surface for the last 10 h. (D) Displacement of simulated wound edges as a function of time. (E) Wound-closure rate as a functionof RGD percentage. The wound-closure rate is fivefold faster on 100% RGD than on 2.5% RGD, consistent with experimental observations. (F) Single cell speedas a function of RGD concentration. Only cells on the test surface were included. Error bars represent SEM.
19304 ∣ www.pnas.org/cgi/doi/10.1073/pnas.1008291107 Fong et al.
Dow
nloa
ded
by g
uest
on
Aug
ust 1
0, 2
020
Concluding RemarksIn summary, we find that the rate of healing of epithelial cellmonolayers cultured on aECM proteins increases with increasingdensity of adhesion ligands presented at the substrate surface.As shown both experimentally and through simulation of thehealing process, the variation in healing rate arises primarily fromvariation in the rate at which cells cross the boundary between thematrix deposited by the cell monolayer and the aECM protein;variation in the rates of migration and proliferation play com-paratively minor roles. The simulation method described herecan be applied to many cell types, and—through variation inthe cell–cell interaction energy (see SI Text)—captures a broadrange of wound-healing behavior, from diffusion-like behaviorin which cell–cell contacts break and reform (as observed for cor-neal epithelial cells) to behavior that resembles that of an elasticsheet in which cell–cell contacts remain unchanged during woundhealing (as observed in monolayers of MDCK cells) (24).
Materials and MethodsProtein Expression and Purification. Standard methods for cloning, bacterialgrowth, protein expression, sodium dodecyl sulfate-polyacrylamide gel elec-trophoresis (SDS/PAGE), andWestern blotting were used to prepare and char-acterize aECM proteins containing RGD and RDG domains (17). Typical yieldsof protein obtained from 10 L fermentation cultures were approximately500 mg. The molar mass of each aECM protein was 34.8 kDa.
Preparation of Spin-Coated aECM Films. Round glass coverslips (12 mm dia-meter; No. 1, Deckgläser) were sonicated in a mixture of ethanol andKOH for 15 min and rinsed several times with distilled H2O. aECM proteinsolutions were prepared by dissolving mixtures of aECM-RGD and aECM-RDG (100 mg∕ml in ddH2O) for 3–4 h at 4 °C. Protein solutions containing2.5%, 5%, 20%, 35%, 50%, 70%, 75%, 80%, 90%, and 100% aECM-RGDwere prepared. Bis[sulfosuccinimidyl]suberate (BS3) was used to cross-linkthe aECM protein substrates. BS3 (2.0 mg; Pierce) was dissolved in 17 μl ofsterile distilled H2O and added to 150 μl of protein solution, mixed and cen-trifuged to remove bubbles. The stoichiometric ratio of activated esters in BS3
to primary amines in the aECM proteins was roughly 1∶1. A 17 μl volume ofBS3-protein solution was then spin-coated on a 12 mm diameter round glasscover slip at 7,000 rpm for 30 sec at 4 °C. Each protein film was stored over-night at 4 °C before use.
Generation of aECM Films Containing Boundaries.We prepared 100 μl of aECMprotein solutions (25 mg∕ml in distilled H2O) containing 0%, 2.5%, 20%,50%, and 100% aECM-RGD and BS3 (0.29 mg in 2.5 μl ddH2O) as previouslydescribed. The protein solution (17 μl) was spin-coated onto a 12 mm dia-meter round glass coverslip at 5,000 rpm 30 sec at 4 °C. Protein films wereallowed to dry overnight at 4 °C. Subsequently, 600 μl of a second aECMprotein solution (15 mg∕ml) was mixed with 1.725 mg of BS3 dissolved in12.75 μl distilled H2O. A small volume (2 μl) of the second aECM proteinsolution was pipetted across the middle of the film and spin-coated at5,000 rpm for 30 sec at 4 °C. Under these conditions, a boundary was gener-ated between two distinct aECM surfaces.
Wound-Healing Assay. The experimental set upwas adapted fromNikolic et al.with modifications (6). Slabs of polydimethylsiloxane (PDMS; Sylgard 184,Dow Corning) were cast to 0.3 mm thickness according to the manufacturer’sinstructions. Briefly, PDMS was mixed at 10∶1 PDMS base/curing agent ratio,poured into a 100 mm Petri dish to a height of 0.3 mm, degassed in a desic-cator for at least 1 h and baked for at least 2 h at 65 °C. Slabs of PDMS withlateral dimensions roughly 2 mmx2 mm were cut with a sterile scalpel,sterilized with ethanol and air-dried. Use of thin (0.3 mm) blocks of PDMSallowed cells to maintain confluence across the edge of the slab and pre-vented contact between cells and the underlying substrate surface. ThePDMS slabs were placed at the center of the coverslips containing spin-coatedaECM films. These coverslips were then mounted in 24-well tissue cultureplates by using sterile vacuum grease (Dow Corning). To all wells, 500 μlof FN was added overnight at 4 °C to cover the entire surface to aid cell-ad-hesion. The next day, 2 × 10⁵ primary HCE cells were seeded into each welland allowed to grow to confluence over 3–5 d. The medium was changedevery 2 d. Once a confluent monolayer formed, the PDMS slabs were liftedwith sterile tweezers to create a wounded cell sheet. A schematic drawing ofthe experimental set up is shown in Fig. 2A. Each well was rinsed twice withfresh medium before the start of each experiment to remove any cell debris.Meanwhile, a chamber was set up around the microscope to maintain themicroscope stage and chamber interior at 37 °C with 5% CO2∕95% air to sus-tain cells. A hole was opened in the cover of one of the empty wells in the 24-well plate and an air supply was attached to ensure that cells were main-tained under the CO2∕air mixture. Water was also added to surroundingempty wells to prevent excessive evaporation of the medium. Wound closurewas followed for 30 h by time-lapse phase contrast microscopy on a NikonEclipse TE300 microscope at 10 ×magnification. Digital images of at least 5different spots of the wound edge for each substrate were acquired every15 min using MetaMorph v6.3.2 (Molecular Devices). The wound areas imme-diately after wounding (t ¼ 0 h) and after 30 h (t ¼ 30 h) were traced manu-ally using ImageJ v1.37 (NIH, http://rsb.info.nih.gov/ij/). The difference in thetwo areas was then divided by the length of the wound edge to yield thedistance traveled by the cell sheet. This distance was then divided by the totaltime (30 h) to give the wound-closure rate. The reported wound-closure rateswere obtained by averaging the rates calculated from videos recorded in atleast three independent experiments. Individual cells within the sheet werealso tracked manually using ImageJ, with MTrackJ, a plug-in created by Mei-jering and colleagues at the University Medical Center Rotterdam, Nether-lands (http://www.bigr.nl/). Trajectories of individual cells were trackedframe by frame for the last 10 h for each video and the average speedsof individual cells were averaged for all cells migrating on the test surface.The extent to which proliferation on the test surface contributed to woundclosure was quantified by counting the number of proliferation events on thetest surface and comparing that number to the total number of cells on thetest surface at the end of the experiment. The number of cells that crossedthe boundary was calculated by counting the number of cells on the testsurface at the end of the experiment and subtracting the number of cellsthat result of proliferation (subtracting the number of proliferation eventson the test surface).
Modeling Spreading, Retraction, and Proliferation. We use a simple phenom-enological model to estimate numerical values for the rates of cell spreading,retraction, and proliferation. As shown in Fig. 5, the cell membrane is mod-eled as a chain of beads that represent integrin receptors or clusters, and
Fig. 4. (A) Schematic representation of boundary crossing. Black arrows represent relative crossing rates for each condition. B and C show the rate constants ofcrossing, kc (from 100% RGD to the test surfaces), for simulation and experimental data, respectively. In both curves, the crossing rates from 100%RGD to 100%RGD and from 100% RGD to 2.5% RGD differ by a factor of five. Error bars in C are experimental errors (see SI Text).
Fong et al. PNAS ∣ November 9, 2010 ∣ vol. 107 ∣ no. 45 ∣ 19305
BIOPH
YSICSAND
COMPU
TATIONALBIOLO
GY
Dow
nloa
ded
by g
uest
on
Aug
ust 1
0, 2
020
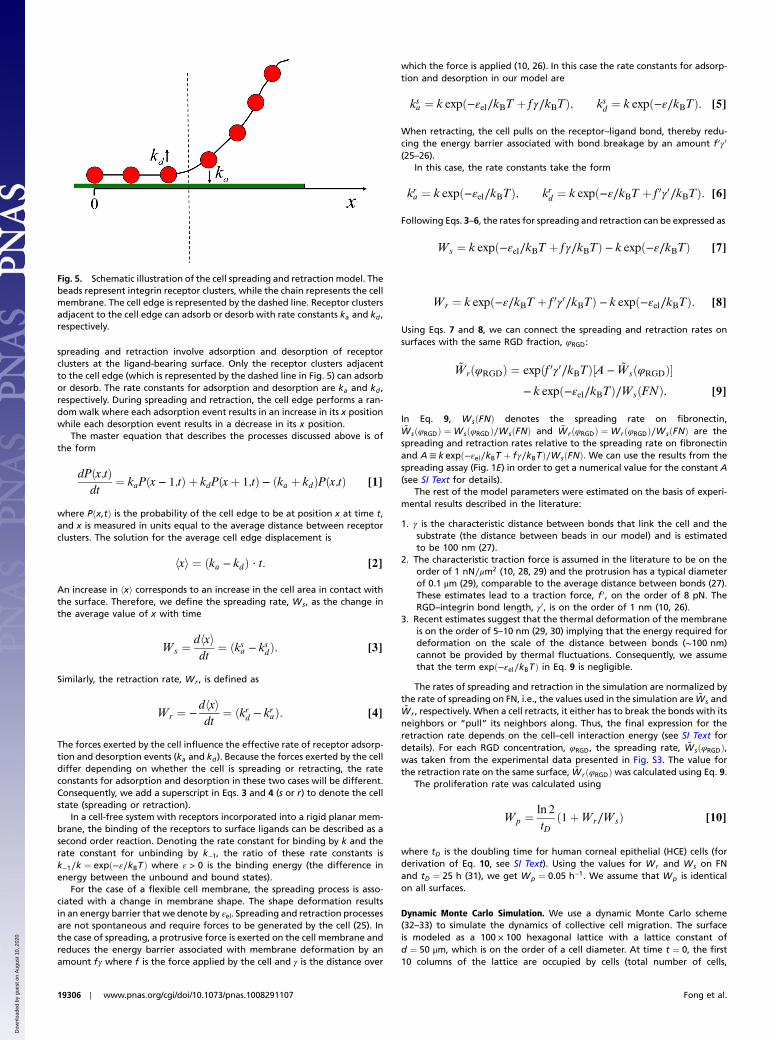
spreading and retraction involve adsorption and desorption of receptorclusters at the ligand-bearing surface. Only the receptor clusters adjacentto the cell edge (which is represented by the dashed line in Fig. 5) can adsorbor desorb. The rate constants for adsorption and desorption are ka and kd ,respectively. During spreading and retraction, the cell edge performs a ran-dom walk where each adsorption event results in an increase in its x positionwhile each desorption event results in a decrease in its x position.
The master equation that describes the processes discussed above is ofthe form
dPðx;tÞdt
¼ kaPðx − 1;tÞ þ kdPðxþ 1;tÞ − ðka þ kdÞPðx;tÞ [1]
where Pðx;tÞ is the probability of the cell edge to be at position x at time t,and x is measured in units equal to the average distance between receptorclusters. The solution for the average cell edge displacement is
hxi ¼ ðka − kdÞ · t: [2]
An increase in hxi corresponds to an increase in the cell area in contact withthe surface. Therefore, we define the spreading rate, Ws, as the change inthe average value of x with time
Ws ¼dhxidt
¼ ðksa − ksdÞ: [3]
Similarly, the retraction rate, Wr , is defined as
Wr ¼ −dhxidt
¼ ðkrd − kraÞ: [4]
The forces exerted by the cell influence the effective rate of receptor adsorp-tion and desorption events (ka and kd ). Because the forces exerted by the celldiffer depending on whether the cell is spreading or retracting, the rateconstants for adsorption and desorption in these two cases will be different.Consequently, we add a superscript in Eqs. 3 and 4 (s or r) to denote the cellstate (spreading or retraction).
In a cell-free system with receptors incorporated into a rigid planar mem-brane, the binding of the receptors to surface ligands can be described as asecond order reaction. Denoting the rate constant for binding by k and therate constant for unbinding by k−1, the ratio of these rate constants isk−1∕k ¼ expð−ε∕kBTÞ where ε > 0 is the binding energy (the difference inenergy between the unbound and bound states).
For the case of a flexible cell membrane, the spreading process is asso-ciated with a change in membrane shape. The shape deformation resultsin an energy barrier that we denote by εel. Spreading and retraction processesare not spontaneous and require forces to be generated by the cell (25). Inthe case of spreading, a protrusive force is exerted on the cell membrane andreduces the energy barrier associated with membrane deformation by anamount fγ where f is the force applied by the cell and γ is the distance over
which the force is applied (10, 26). In this case the rate constants for adsorp-tion and desorption in our model are
ksa ¼ k expð−εel∕kBT þ f γ∕kBTÞ; ksd ¼ k expð−ε∕kBTÞ: [5]
When retracting, the cell pulls on the receptor–ligand bond, thereby redu-cing the energy barrier associated with bond breakage by an amount f 0γ0
(25–26).In this case, the rate constants take the form
kra ¼ k expð−εel∕kBTÞ; krd ¼ k expð−ε∕kBT þ f 0γ0∕kBTÞ: [6]
Following Eqs. 3–6, the rates for spreading and retraction can be expressed as
Ws ¼ k expð−εel∕kBT þ f γ∕kBTÞ − k expð−ε∕kBTÞ [7]
Wr ¼ k expð−ε∕kBT þ f 0γ0∕kBTÞ − k expð−εel∕kBTÞ: [8]
Using Eqs. 7 and 8, we can connect the spreading and retraction rates onsurfaces with the same RGD fraction, φRGD:
~WrðφRGDÞ ¼ expðf 0γ0∕kBTÞ½A − ~WsðφRGDÞ�− k expð−εel∕kBTÞ∕WsðFNÞ: [9]
In Eq. 9, WsðFNÞ denotes the spreading rate on fibronectin,~WsðφRGDÞ ¼ WsðφRGDÞ∕WsðFNÞ and ~WrðφRGDÞ ¼ WrðφRGDÞ∕WsðFNÞ are thespreading and retraction rates relative to the spreading rate on fibronectinand A≡ k expð−εel∕kBT þ fγ∕kBTÞ∕WsðFNÞ. We can use the results from thespreading assay (Fig. 1E) in order to get a numerical value for the constant A(see SI Text for details).
The rest of the model parameters were estimated on the basis of experi-mental results described in the literature:
1. γ is the characteristic distance between bonds that link the cell and thesubstrate (the distance between beads in our model) and is estimatedto be 100 nm (27).
2. The characteristic traction force is assumed in the literature to be on theorder of 1 nN∕μm2 (10, 28, 29) and the protrusion has a typical diameterof 0.1 μm (29), comparable to the average distance between bonds (27).These estimates lead to a traction force, f 0, on the order of 8 pN. TheRGD–integrin bond length, γ0, is on the order of 1 nm (10, 26).
3. Recent estimates suggest that the thermal deformation of the membraneis on the order of 5–10 nm (29, 30) implying that the energy required fordeformation on the scale of the distance between bonds (∼100 nm)cannot be provided by thermal fluctuations. Consequently, we assumethat the term expð−εel∕kBTÞ in Eq. 9 is negligible.
The rates of spreading and retraction in the simulation are normalized bythe rate of spreading on FN, i.e., the values used in the simulation are ~Ws and~Wr , respectively. When a cell retracts, it either has to break the bonds with itsneighbors or “pull” its neighbors along. Thus, the final expression for theretraction rate depends on the cell–cell interaction energy (see SI Text fordetails). For each RGD concentration, φRGD, the spreading rate, ~WsðφRGDÞ,was taken from the experimental data presented in Fig. S3. The value forthe retraction rate on the same surface, ~WrðφRGDÞwas calculated using Eq. 9.
The proliferation rate was calculated using
Wp ¼ln 2tD
ð1þWr∕WsÞ [10]
where tD is the doubling time for human corneal epithelial (HCE) cells (forderivation of Eq. 10, see SI Text). Using the values for Wr and Ws on FNand tD ¼ 25 h (31), we get Wp ¼ 0.05 h−1. We assume that Wp is identicalon all surfaces.
Dynamic Monte Carlo Simulation. We use a dynamic Monte Carlo scheme(32–33) to simulate the dynamics of collective cell migration. The surfaceis modeled as a 100 × 100 hexagonal lattice with a lattice constant ofd ¼ 50 μm, which is on the order of a cell diameter. At time t ¼ 0, the first10 columns of the lattice are occupied by cells (total number of cells,
Fig. 5. Schematic illustration of the cell spreading and retraction model. Thebeads represent integrin receptor clusters, while the chain represents the cellmembrane. The cell edge is represented by the dashed line. Receptor clustersadjacent to the cell edge can adsorb or desorb with rate constants ka and kd ,respectively.
19306 ∣ www.pnas.org/cgi/doi/10.1073/pnas.1008291107 Fong et al.
Dow
nloa
ded
by g
uest
on
Aug
ust 1
0, 2
020

N ¼ 1;000), while the rest of the lattice sites are empty. Because proliferationis enabled, N increases with time. In every Monte Carlo step, N cells are cho-sen randomly and an attempt is made to change their state according to theappropriate rates for spreading, retraction, and proliferation ( ~Ws, ~Wr , andWp, respectively). All the rates in the simulation are scaled to ensure that thetime steps are small enough so that in any Monte Carlo (MC) step only oneevent can occur. The interaction energy between nearest neighbor cells in thesimulation is εcell-cell∕kBTeff ¼ 0.7 (for details see SI Text). The conversionbetween simulation time and experimental time was done by a one-timecalibration, equating the wound-closure rates obtained from simulationand experiment for the 2.5% RGD substrate. By using this approach, we findthat 1 MC step corresponds to 0.15 min and WsðFNÞ ¼ 0.54 min−1.
Boundary-Crossing Experiments. aECM surfaces containing substrate bound-aries were mounted into the wells of a 24-well tissue culture plate. HCE cells(1 × 10⁴) were added to each well and allowed to attach for 2 h at 37 °C under5% CO2∕95% air. Images of the boundary at several positions on the aECMfilm were acquired every 15 min for 24 h, by using phase contrast microscopyat 37 °C under 5% CO2∕95% air. Time-lapse videos were analyzed using Im-ageJ. We tracked cells that contacted the boundary and recorded the timespent at the boundary before a “decision”was made (i.e., the cell crossed theboundary or moved away). We considered each encounter a separate“event” (i.e., once the cell leaves the boundary and recontacts the boundaryagain, the timing restarts). The total amount of time spent at the boundary,ttotal, the total number of events, N, and the total number of cells that sub-
sequently decide to cross the boundary, Nc , were recorded for at least 150events for each condition. The rate constant of boundary crossing, kc , wascalculated using
kc ¼Nc
ttotal[11]
(see SI Text for a derivation of Eq. 11).The uncertainty in the rate constant for boundary crossing is kcΔt∕hti
where hti ¼ ttotal∕N is the average waiting time at the boundary and Δt isthe 15-min time interval between two consecutive time-lapse images.
Statistical Analysis. For all experimental data, the statistical significance ofdifferences was estimated by analysis of variance followed by the Tukey test.Differences were taken to be significant at P ≤ 0.05.
ACKNOWLEDGMENTS. We acknowledge Drs. Julie Liu, Paul Nowatzki, andStacey Maskarinec for help with protein expression and cell culture. We alsothank Dr. Zhen-Gang Wang for useful advice on the simulation model. E.F. issupported by the Nanyang Overseas Scholarship, Singapore; S.T. is supportedby the Human Frontier Science Program Cross-Disciplinary fellowship. Thiswork is funded by the National Science Foundation Center for the Scienceand Engineering of Materials at Caltech and by National Institutes of HealthGrant EB1971.
1. Martin P, Lewis J (1992) Actin cables and epidermal movement in embryonic woundhealing. Nature 360:179–183.
2. Bement WM, Forscher P, Mooseker MS (1993) A novel cytoskeletal structure involvedin purse string wound closure and cell polarity maintenance. J Cell Biol 121:565–578.
3. Sammak PJ, Hinman LE, Tran POT, SjaastadMD, Machen TE (1997) How do injured cellscommunicate with the surviving cell monolayer? J Cell Sci 110:465–475.
4. Poujade M, et al. (2007) Collective migration of an epithelial monolayer in response toa model wound. Proc Natl Acad Sci USA 104:15988–15993.
5. Block ER, Matela AR, SundarRaj N, Iszkula ER, Klarlund JK (2004) Woundinginduces motility in sheets of corneal epithelial cells through loss of spatial constraints.Roles of heparin-binding epidermal growth factor-like signaling. J Biol Chem279:24307–24312.
6. Nikolic DL, Boettiger AN, Bar-Sagi D, Carbeck JD, Shvartsman SY (2006) Role ofboundary conditions in an experimental model of epithelial wound healing. Am J Phy-siol-Cell Ph 291:C68–C75.
7. Todaro GJ, Lazar GK, Green H (1965) The initiation of cell division in a contact-inhibited mammalian cell line. J Cell Physiol 66:325–333.
8. Suzuki K, et al. (2003) Cell-matrix and cell-cell interactions during corneal epithelialwound healing. Prog Retin Eye Res 22:113–133.
9. Clark RAF (1990) Fibronectin matrix deposition and fibronectin receptor expression inhealing and normal skin. J Invest Dermatol 94:128s–134s.
10. Palecek SP, Horwitz AF, Lauffenburger DA (1999) Kinetic model for integrin-mediatedadhesion release during cell migration. Ann Biomed Eng 27:219–235.
11. Pettit DK, Hoffman AS, Horbett TA (1994) Correlation between corneal epithelial celloutgrowth and monoclonal antibody binding to the cell binding domain of adsorbedfibronectin. J Biomed Mater Res 28:685–691.
12. van Horssen R, Galjart N, Rens JAP, Eggermont AMM, ten Hagen TLM (2006) Differ-ential effects of matrix and growth factors on endothelial and fibroblast motility:Application of a modified cell migration assay. J Cell Biochem 99:1536–1552.
13. Aucoin L, Griffith CM, Pleizier G, Deslandes Y, Sheardown H (2002) Interactions ofcorneal epithelial cells and surfacesmodified with cell adhesion peptide combinations.J Biomat Sci-Polym E 13:447–462.
14. Nowatzki PJ, Tirrell DA (2003) Physical properties of artificial extracellular matrixprotein films prepared by isocyanate crosslinking. Biomaterials 25:1261–1267.
15. Di Zio K, Tirrell DA (2003) Mechanical properties of artificial protein matrices engi-neered for control of cell and tissue behavior. Macromolecules 36:1553–1558.
16. Heilshorn SC, Di Zio KA, Welsh ER, Tirrell DA (2003) Endothelial cell adhesion to thefibronectin CS5 domain in artificial extracellular matrix proteins. Biomaterials24:4245–4252.
17. Liu JC, Heilshorn SC, Tirrell DA (2004) Comparative cell response to artificial extracel-lular matrix proteins containing the RGD and CS5 cell-binding domains. Biomacromo-lecules 5:497–504.
18. Liu JC, Tirrell DA (2008) Cell response to RGD density in cross-linked artificial extracel-lular matrix protein films. Biomacromolecules 9:2984–2988.
19. Lu L, Reinach PS, Kao WWY (2001) Corneal epithelial wound healing. Exp Biol Med226:653–664.
20. Stepp MA (2006) Corneal integrins and their functions. Exp Eye Res 83:3–15.21. Evans MDM, Steele JG (1997) Multiple attachment mechanisms of corneal epithelial
cells to a polymer-cells can attach in the absence of exogenous adhesion proteinsthrough a mechanism that requires microtubules. Exp Cell Res 233:88–98.
22. Evans MDM, Steele JG (1998) Polymer surface chemistry and a novel attachment me-chanism in corneal epthelial cells. J Biomed Mater Res 40:621–630.
23. Chan KY, Patton DL, Cosgrove YT (1989) Time-lapse videomicroscopic study of in vitrowound closure in rabbit corneal cells. Invest Opthalmol Vis Sci 30:2488–2498.
24. Farooqui R, Fenteany G (2005) Multiple rows of cells behind an epithelial wound edgeextend cryptic lamellipodia to collectively drive cell sheet movement. J Cell Sci118:51–63.
25. Lauffenburger DA (1996) Cell Migration: A physically integrated molecular process.Cell 84:359–369.
26. Bell GI (1978) Models for specific adhesion of cells to cells. Science 200:618–627.27. Weikl TR, Asfaw M, Krobath H, Rozycki B, Lipowsky R (2009) Adhesion of membranes
via receptor-ligand complexes: Domain formation, binding cooperativity, and activeprocesses. Soft Matter 5:3213–3224.
28. Prass M, Jacobson K, Mogilner A, Radmacher M (2006) Direct measurement of thelamellipodial protrusive force in a migrating cell. J Cell Biol 174:767–772.
29. Pierres A, Monnet-Corti V, Benoliel AM, Bongrand P (2009) Do membrane undulationshelp cells probe the world? Trends Cell Biol 19:428–433.
30. Zidovska A, Sackmann E (2006) Brownian motion of nucleated cell envelopes impedesadhesion. Phys Rev Lett 96:048103–048101–048104.
31. Kahn CR, Young E, Lee IH, Rhim JS (1993) Human corneal epithelial primary culturesand cell-lines with extended life-span—in-vitro model for ocular studies. InvestOpthalmol Vis Sci 34:3429–3441.
32. Fichthorn KA, Weinberg WH (1991) Theoretical foundations of dynamic monte-carlosimulations. J Chem Phys 95:1090–1096.
33. Kang CH, Weinberg WH (1992) Dynamic monte-carlo simulations of surface-rateprocesses. Accounts Chem Res 25:253–259.
Fong et al. PNAS ∣ November 9, 2010 ∣ vol. 107 ∣ no. 45 ∣ 19307
BIOPH
YSICSAND
COMPU
TATIONALBIOLO
GY
Dow
nloa
ded
by g
uest
on
Aug
ust 1
0, 2
020