worldwide site comparison for submillimetre astronomy
TRANSCRIPT

A&A 548, A65 (2012)DOI: 10.1051/0004-6361/201220420c© ESO 2012
Astronomy&
Astrophysics
Worldwide site comparison for submillimetre astronomy
P. Tremblin1, N. Schneider1,2, V. Minier1, G. Al. Durand1, and J. Urban3
1 Laboratoire AIM Paris-Saclay, CEA/Irfu – Univ. Paris Diderot – CNRS/INSU, Centre d’études de Saclay, 91191 Gif-Sur-Yvette,Francee-mail: [email protected]
2 Université de Bordeaux1, LAB, UMR 5804, CNRS, 33270 Floirac, France3 Chalmers University of Technology, Department of Earth and Space Sciences, 41296 Göteborg, Sweden
Received 20 September 2012 / Accepted 16 October 2012
ABSTRACT
Aims. The most important limitation for ground-based submillimetre (submm) astronomy is the broad-band absorption of the totalwater vapour in the atmosphere above an observation site, often expressed as the precipitable water vapour (PWV). A long-termstatistic on the PWV is thus mandatory to characterize the quality of an existing or potential site for observational submm-astronomy.In this study we present a three-year statistic (2008–2010) of the PWV for ground-based telescope sites all around the world andfor stratospheric altitudes relevant for SOFIA (Stratospheric Observatory for Far-Infrared Astronomy). The submm-transmission iscalculated for typical PWVs using an atmospheric model.Methods. We used data from IASI (Infrared Atmospheric Sounding Interferometer) on the Metop-A satellite to retrieve wa-ter vapour profiles for each site (11 in total, comprising Antarctica, Chile, Mauna Kea, Greenland, Tibet). The use of a sin-gle instrument to make the comparison provides unbiased data with a common calibration method. The profiles are integratedabove the mountain/stratospheric altitude to get an estimation of the PWV. We then applied the atmospheric model MOLIERE(Microwave Observation and LIne Estimation and REtrieval) to compute the corresponding atmospheric absorption for wavelengthsbetween 150 μm and 3 mm.Results. We present the absolute PWV values for each site sorted by year and time percentage. The PWV corresponding to the firstdecile (10%) and the quartiles (25%, 50%, 75%) are calculated and transmission curves between 150 μm and 3 mm for these valuesare shown. The Antarctic and South-American sites present very good conditions for submillimetre astronomy. The 350 μm and450 μm atmospheric windows are open all year long, whereas the 200 μm atmospheric window opens reasonably for 25% of the timein Antarctica and the extremely high-altitude sites in Chile. Potential interesting new facilities are Macon in Argentina and Summitin Greenland, which show similar conditions to for example, Mauna Kea (Hawaii). For SOFIA, we present transmission curves fordifferent altitudes (11 to 14 km), PWV values, and higher frequencies (up to 5 THz) in more detail. Though the atmosphere at thesealtitude is generally very transparent, the absorption at very high frequencies becomes more important, partly caused by minor species.The method presented in this paper could identify sites on Earth, with great potential for submillimetre astronomy, and guide futuresite testing campaigns in situ.
Key words. site testing – submillimeter: general
1. Introduction
Despite its strong interest for astronomy, the submillimetre(submm) to far-infrared (FIR) wavelength range is mostly lim-ited by the pressure-broadened absorption of tropospheric watervapour present in the Earth’s atmosphere (see, e.g., Minier et al.2010, for a summary of astronomy projects). The water vapourprofile, and thus also the integrated column of water expressedin precipitable water vapour (PWV), depends on the geographi-cal location. The PWV generally decreases with altitude, so thathigh-lying sites are best suited to submm-astronomy. Airborneastronomy, now possible on a regular base using SOFIA, is muchless limited by water vapour, and thanks to the lower atmo-spheric pressure, spectral broadening is less important. However,there is still absorption close to major and minor species (e.g.,O3, N2O, CO), as well as collision-induced non-resonant contin-uum absorption. SOFIA can now access the very high-frequencyrange (>2 THz), definitely closed for ground-based sites, butthe line intensities and abundances of the major and minorspecies need to be known precisely. First spectroscopic obser-vations performed with SOFIA (see A&A special issue, 2012,vol. 542) show that small-scale atmospheric variations in the
troposphere/stratosphere layer are very difficult to assess (Guanet al. 2012).
For ground-based sites, previous studies (e.g. Schneider et al.2009; Tremblin et al. 2011; Matsushita et al. 1999; Petersonet al. 2003) have already shown that a few sites are well-suitedto submm/mid-IR, and FIR-astronomy and their transmissionproperties are rather well determined (for example by Fouriertransform spectrometer obervations in the 0.5–1.6 THz rangeat Mauna Kea/Hawaii; Pardo et al. 2001). The high-altitude(>5000 m) Chilean sites are known for dry conditions (seeMatsushita et al. 1999; Peterson et al. 2003), and site testing isnow being carried out at the driest place on Earth, Antarctica (seeChamberlin et al. 1997; Yang et al. 2010; Tremblin et al. 2011).Comparisons between Antarctic and Chilean sites are difficultand uncertain since they rely on ground-based instruments thatuse different methods and calibration techniques (see Petersonet al. 2003, for example). The working conditions are also an im-portant concern, since a single instrument moved from Chile toAntarctica will behave differently in the harsh polar environment(–70 ◦C in winter at Dome C). A meaningful comparison is pos-sible if several independent instruments are used at each place.An example of such a study is the one of Tremblin et al. (2011)
Article published by EDP Sciences A65, page 1 of 10

A&A 548, A65 (2012)
that obtained transmission data at Dome C thanks to radio sound-ings and the radiometers HAMSTRAD (Ricaud et al. 2010) andSUMMIT08. However, it is rare to have many instruments atone site. The best solution is to use satellite data, which alsoenables any location on Earth to be investigated. Thanks to theIASI (Infrared Atmospheric Sounding Interferometer) on theMetop-A satellite, it is now possible to conduct such a com-parison over several years with no instrument bias and with thesame working conditions for the detectors. We present here athree-year study of the PWV of a selection of existing and up-coming submm-sites in Antarctica, Chile, Tibet, and Argentina,as well as for two SOFIA stations, Palmdale/California andChristchurch/New Zealand. The individual and cumulated quar-tiles of PWV for each site allow a direct comparison. The trans-mission corresponding to these PWV values of the quartilesis then calculated using the atmospheric model MOLIERE-5(Microwave Observation and LIne Estimation and REtrieval,Urban et al. 2004).
The paper is organized as follows. After introducing all thesites that are considered in the present study (Sect. 2), we firstshow the PWV extraction from the satellite data and the compar-ison of the PWV statistics between all the sites (Sect. 3). Thenwe present the method extracting transmission curves with theMOLIERE atmospheric model and perform a site comparisonfor the 250 μm and 350 μm transmission (Sect. 4). The ratioof the monthly-averaged transmission to its fluctuations is thenused to compare the stability of the transmission at 200 μm be-tween all the sites at the end of Sect. 4. Section 5 deals withthe results for SOFIA, and Sect. 6 discusses and summarizesthe results.
2. Sites of interest
We selected eleven representative sites around the world that canbe grouped as follows:
– Antarctic sites.Dome C: Concordia station with several telescopes, e.g.IRAIT (International Robotic Antarctic Infrared Telescope),http://arena.oca.eu;Dome A: new site in exploration,http://www.chinare.gov.cn;South Pole: SPT (South Pole Telescope),http://astro.uchicago.edu/research/south-pole-telescope.
– South-American sites.Chajnantor Plateau in Chile: ALMA (Atacama LargeMillimetre Array) site,http://www.almaobservatory.org;Cerro Chajnantor in Chile: CCAT (Cornell Caltech AtacamaTelescope), http://www.ccatobservatory.org;Cerro Macon in Argentinia.
– Northern-hemisphere sites.Mauna Kea in Hawaii: JCMT (James Clerk MaxwellTelescope), http://www.jach.hawaii.edu;Summit in Greenland: http://www.geosummit.org;Yangbajing in Tibet: KOSMA (Cologne Observatory forsubmm-astronomy),http://www.astro.uni-koeln.de/kosma.
– “Stratospheric” sites.SOFIA over Palmdale (USA) and Christchurch(New Zealand), http://www.sofia.usra.edu.
The location of the different sites are summarized in Fig. 1.Our selection inclues known sites in Antarctica and North/South
Fig. 1. Location of the different sites of interest.
Table 1. Location, altitude, and telescopes for the different sites withfuture telescopes indicated in parenthesis.
Site Latitude Longitude Alt. [m] Tel.
Dome C 75◦06′s 123◦23′e 3233 IRAITDome A 80◦22′s 77◦21′e 4083South Pole 90◦s 0◦e 2800 SPT
Cerro Chajnantor 22◦59′s 67◦45′w 5612 (CCAT)Cerro Macon 24◦31′s 67◦21′w 5032Chaj. Plateau 23◦00′s 67◦45′w 5100 ALMA
Mauna Kea 19◦45′n 155◦27′w 4207 JCMTSummit, Greenland 72◦35′n 38◦25′w 3210Yangbajing, Tibet 30◦05′n 90◦33′e 4300 KOSMA
Palmdale 34◦37′n 118◦05′w 12 000 SOFIAChristchurch 43◦31′s 172◦38′e 12 000 SOFIA
America plus northern hemispheric sites that could be of inter-est (Summit in Greenland, Yangbajing in Tibet) for complete skycoverage. The geographical location, altitude, and related exist-ing/planned telescopes are listed in Table 1.
3. PWV extraction from satellite data
3.1. Method and results
IASI (Infrared Atmospheric Sounding Interferometer) is an at-mospheric interferometer working in the infrared, launched in2006 on the METOP-A satellite (Phulpin et al. 2007; Pougatchevet al. 2008; Herbin et al. 2009; Clerbaux et al. 2009). The data areavailable at the website of the Centre for Atmospheric ChemistryProducts and Services1. IASI was developed by the FrenchSpace Agency CNES2 in collaboration with EUMETSAT3. Thesatellite is on a polar orbit so that each point on Earth is seenat least once per day by the detectors. IASI is a Fourier trans-form spectrometer (FTS) working between 3.7 and 15.5 μm. Itis associated with an infrared imager, operating between 10.3and 12.5 μm. Each pixel of the instrument corresponds to aspatial extent of 12 km at nadir, and vertical profiles of tropo-spheric humidity at ninety pressure levels are retrieved typicallywith 10% accuracy (Pougatchev et al. 2008). The amount of pre-cipitable water vapour is given by the integral of these verticalprofiles. We averaged, on a daily basis all measurements whosecentral position falls in a zone of 110 km2 around each site toderive PWV statistics between 2008 and 2010. This method was
1 http://ether.ipsl.jussieu.fr2 Centre National d’Études Spatiales.3 European organization for meteorological satelliteshttp://www.eumetsat.int
A65, page 2 of 10

P. Tremblin et al.: Worldwide site comparison
Fig. 2. Top: PWV content measured at Dome C, Antarctica over theFrench-Italian base Concordia between 2008 and 2010. The percentageindicates the fraction of days in the year when we were able to extractthe data from the satellite measurements. Bottom: distribution functionof the PWV for each year and for the whole period.
validated in Tremblin et al. (2011) where we compared IASIsatellite data with ground-based instruments (HAMSTRAD andSUMIT08) and radio-sounding data over the French-Italian baseConcordia at Dome C in Antarctica. All instruments have a goodcorrelation at low PWV, which is precisely the range we are in-terested in for submillimetre astronomy.
The use of vertical satellite profiles is slightly trickier fora mountain site. Since we take all measurements in a zone of110 km2, we sometimes get profiles that do not contain moun-tain altitude but include lower ones. This would bias the retrievedPWV to high values. To overcome this difficulty, we generallytruncated the profiles at the pressure level of the site of interest.This method has already been used by Ricaud et al. (2010) tocompare IASI measurements with the HAMSTRAD radiome-ter, over the Pyrenees mountains. They showed a very good cor-relation for the integrated PWV. We also determined the PWVcontent in this way at high altitudes (>11 km) over Palmdale,USA, and Christchurch, New Zealand, for the on-going and fu-ture flights of SOFIA. During a typical flight, SOFIA will rangehundreds of kilometres from its base and the water vapour de-pends on local weather conditions at the position of the plane.Since the profiles are averaged on a 110-km2 area and the timestatistics are done for three years, the results given here arethe representative conditions under which SOFIA is operating.Precise in-situ measurements of the PWV usable for calibrationare much more difficult to obtain (see Guan et al. 2012).
The water vapour profiles are measured as a function of pres-sure by IASI, therefore it is important to get the correct pressurelevel at the altitude of the sites. In-situ measurements were avail-able for most of the sites to get the local averaged pressure level.Only for Yangbajing, Cerro Macon, and SOFIA was it necessaryto use the pressure level of the standard US atmosphere (1976),computed at the altitude of the site. However, this method doesnot provide a precise pressure level, just a measured one, so thatthe retrieved PWVs are less reliable. By comparing both meth-ods for sites where measurements were available, we estimate anerror of around 25 % using the standard atmosphere.
Figure 2 presents the PWV measurements for the Antarcticsite of Dome C and Fig. 3 the measurements for the Chilean siteof Cerro Chajnantor. The corresponding figures for all other sites
Fig. 3. Same as Fig. 2 for Cerro Chajnantor in Chile. The satellite pro-files were truncated at the altitude of the mountain summit. Note thedifferent scale range of PWV compared to Fig. 2.
are found in the Appendix and on a dedicated website4. Since onAntarctic domes (expression for the mountains in Antarctica),the difference in height is small (over 100 km), we do not needto truncate the profiles, whereas it has to be done for a mountainsite like Cerro Chajnantor.
Some ground measurements are available for different sitesand can be compared to our results. Cerro Chajnantor andChajnantor Plateau were extensively studied (see Giovanelliet al. 2001) and the PWV quartiles between 2006 and 2010 canbe found in Radford (2011). The values deduced from opac-ity measurements at 225 GHz are 0.61 mm (25%), 1.08 mm(50%), and 2.01 mm (75%) for the plateau; and 0.33 mm (25%),0.61 mm (50%), and 1.36 mm (75%) for Cerro Chajnantor. Thequartiles for Cerro Chajnantor are in a good agreement withour satellite measurements (between 10 and 20% difference).The studied periods are not the same and can explain partlythe difference. Furthermore, a scale height of the water vapourprofiles on the Chajnantor area can be deduced from the quar-tiles of the plateau and the “Cerro”. With the satellite measure-ments, we computed a 1/e scale height he of the order of 1.1 kmthat is in a good agreement with measurements from Giovanelliet al. (2001). The PWV quartiles at the South Pole were com-puted at saturation from radio-sounding balloons over a period of40 years (see Chamberlin 2002). These authors estimate that thePWV should be 90% saturated, thus the saturation level can beused as a proxy for the real PWV. They find averaged quartiles of0.25 mm (25%), 0.33 mm (50%), and 0.44 mm (75%); the differ-ence with our satellite measurements is around 10%. A radiome-ter at 225 GHz is operating at the CSO5 on Mauna Kea. PWVquartiles between 1997 and 2001 can be found in Otárola et al.(2010) and Radford (2011), 1.08 mm (25%), 1.82 mm (50%),and 3.32 mm (75%). The difference with the satellite measure-ments is around 15–20% and can again be caused by variationsbetween the periods 1997–2001 and 2008–2010.
The effect of seasons are clearly visible in Figs. 2 and 3.Obviously, the PWV during winter is lower than in sum-mer, i.e., below 0.3 mm at Dome C and below 0.6 mm atCerro Chajnantor. The Chilean site presents a strong day-to-day
4 http://submm.eu5 Caltech Submillimeter Observatory.
A65, page 3 of 10

A&A 548, A65 (2012)
Fig. 4. Comparison of the distribution functions of the PWV for allsites between 2008 and 2010. The percentage of days over this periodon which we achieved the data extraction is indicated in parenthesis.The time percentage (x-axis) is taken over the total number of days onwhich we achieved the data extraction. In the upper panel, the curvesfor Palmdale (dark blue) and Christchurch (green) are blended and veryclose to the 0.0 mm level.
variation compared to the Antarctic site. This is caused by thedaily variation in the PWV that is not present in Antarctica withthe long polar night/winter. This may cause a slight bias in thenon-polar site data because only one or two measurements areavailable per day, thus we do not sample these day-night varia-tions very well. Nevertheless, we expect these statistics to rep-resent the trends over years. The distribution functions in Fig. 3are very similar from 2008 and 2010, therefore the year-to-yearstatistics are not too affected by the lack of the day-night vari-ation sampling. In 2008 the PWV was slightly lower than in2009–2010. This effect was also seen in Antarctica (see Fig. 2)with the in-situ measurements (radio-soundings, HAMSTRAD,SUMMIT08). Possible explanations were discussed in Tremblinet al. (2011) and should not be interpreted as a possible effect ofthe day-night variations.
3.2. Site comparison
Figure 4 shows the comparison between all sites as a distributionfunction of the PWV over the period 2008–2010. Obviously, theair-borne SOFIA stratospheric instrument encounters the lowest
PWV, lower than 0.01 mm most of the time and much lower thanany ground-based sites. The Antarctic sites follow then as thedriest places on Earth, with Dome A, and then Dome C and theSouth Pole. These sites have PWVs that are lower than 0.5 mmmost of the time (75% of the time between 2008 and 2010).Chilean and Argentinian sites are next with a PWV lower than1.5 mm most of the time, followed by Hawaii and Summit inGreenland with a PWV lower than 2 mm, and finally Yangbajingin Tibet, which presents a high level of water vapour. The satel-lite measurements saturate over the Tibet site with high values ofthe PWV (around 10 mm), which is clearly visible in the figurein the appendix.
These results are presented quantitatively in Table 2 withthe first decile and the quartiles for each site. The differencecaused by the truncation for mountain sites can be seen by com-paring Cerro Chajnantor to Chajnantor Plateau. The mountain(Cerro) is close to the ALMA site, therefore the profiles thatare extracted from the satellite are the same. The difference inthe PWV retrieved is mostly caused by the altitude truncationof the profiles. The first decile and the quartiles again clearlyshow that Antarctic sites are the driest sites followed by SouthAmerican sites and then northern hemisphere sites. It is remark-able that our long-term satellite statistics of PWV show that thesite of Summit in Greenland offers comparable observing con-ditions (PWV and altitude) like the ones on Mauna Kea, whichopens a new perspective for submm astronomy in the northernhemisphere.
4. Atmospheric transmission from PWVand MOLIERE
4.1. Method
For determining of the tropospheric transmission correspondingto the PWVs of the various deciles and quartiles for each site, weuse MOLIERE-5.7, a forward and inversion atmospheric model(Urban et al. 2004), developed for atmospheric science applica-tions. It has previously been used to calculate the atmospherictransmission up to 2000 GHz (∼150 μm) for a large number ofastronomical sites. The results are published in Schneider et al.(2009) and on a website6.
The code calculates the absorption of radiation in the mm-to far-IR wavelength range (equivalent from 0 to 10 THz infrequency) considering the wet- and dry-air components of at-mospheric absorption. Spectroscopic lines, such as those of at-mospheric water (H2O), oxygen (O2), and ozone (O3), absorbstrongly at short wavelengths, while collisions of H2O withO2 and nitrogen (N2) result in continuous absorption across allwavelengths. For the line absorption, a radiative transfer modelincluding refraction and absorption by major and minor atmo-spheric species is included (H2O, O2, O3, NO2, HNO3, CO andother lines up to 10 THz). Spectroscopic parameters are takenfrom HITRAN7 and the JPL8 database. The wet and dry air con-tinuum absorption is calculated as described in Schneider et al.(2009). Temperature and pressure profiles of the sites were deter-mined using the compilation described in Schneider et al. (2009)and given on the website. The colder Antarctic atmosphere tendsto populate the low-lying energy state of water, leading to agreater absorption for a given PWV than that of a non-polar site.This effect is included in the model.
6 http://submm.eu7 High Resolution Transmission molecular absorption database.8 Jet Propulsion Laboratory.
A65, page 4 of 10
P. Tremblin et al.: Worldwide site comparison
Table 2. First decile and quartiles of the PWV for all the studied sites.
Time fraction 2008–2010 SOFIA (Palm./Christ.) Dome A Dome C South Pole Cerro Chajnantor
0.10 0.006/0.004 0.11 0.17 0.15 0.270.25 0.006/0.005 0.16 0.22 0.21 0.370.50 0.007/0.006 0.21 0.28 0.30 0.610.75 0.009/0.007 0.26 0.39 0.49 1.11
Time fraction 2008–2010 Chajnantor Plateau Summit Cerro Macon Mauna Kea Yangbajing
0.10 0.39 0.36 0.47 0.62 1.210.25 0.53 0.51 0.66 0.91 2.470.50 0.86 0.94 1.02 1.44 inf0.75 1.63 1.96 1.66 2.57 inf
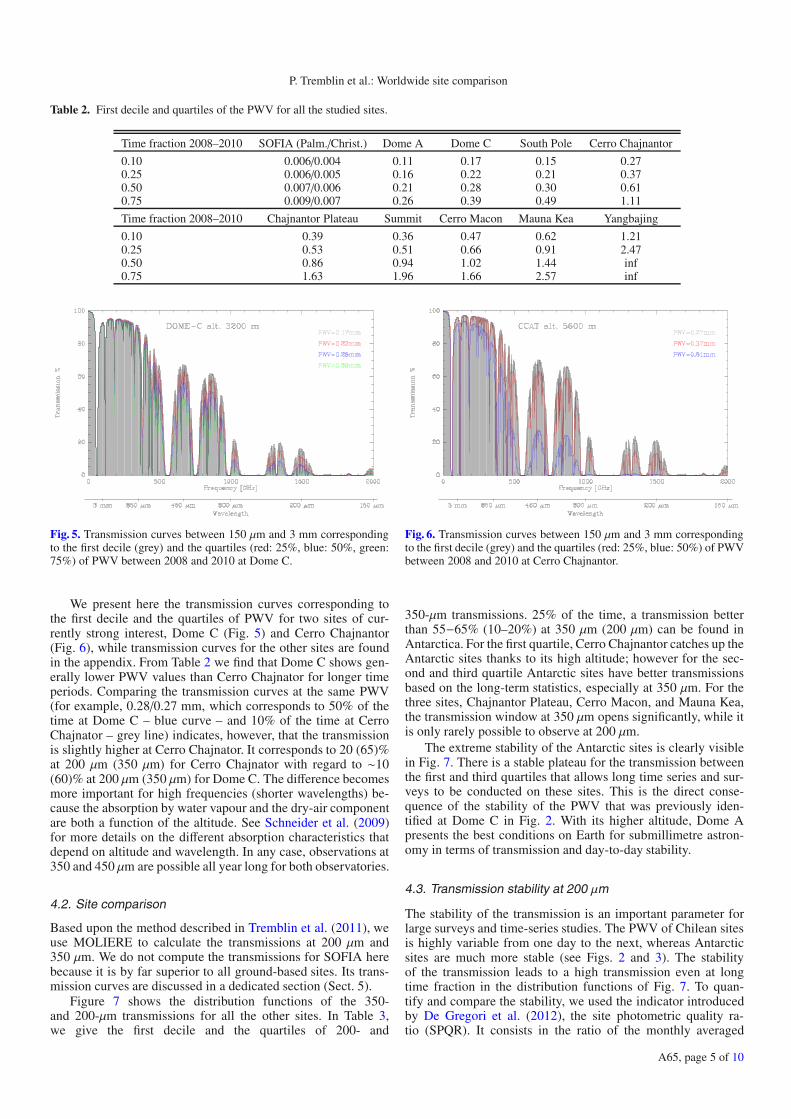
Fig. 5. Transmission curves between 150 μm and 3 mm correspondingto the first decile (grey) and the quartiles (red: 25%, blue: 50%, green:75%) of PWV between 2008 and 2010 at Dome C.
We present here the transmission curves corresponding tothe first decile and the quartiles of PWV for two sites of cur-rently strong interest, Dome C (Fig. 5) and Cerro Chajnantor(Fig. 6), while transmission curves for the other sites are foundin the appendix. From Table 2 we find that Dome C shows gen-erally lower PWV values than Cerro Chajnator for longer timeperiods. Comparing the transmission curves at the same PWV(for example, 0.28/0.27 mm, which corresponds to 50% of thetime at Dome C – blue curve – and 10% of the time at CerroChajnator – grey line) indicates, however, that the transmissionis slightly higher at Cerro Chajnator. It corresponds to 20 (65)%at 200 μm (350 μm) for Cerro Chajnator with regard to ∼10(60)% at 200 μm (350 μm) for Dome C. The difference becomesmore important for high frequencies (shorter wavelengths) be-cause the absorption by water vapour and the dry-air componentare both a function of the altitude. See Schneider et al. (2009)for more details on the different absorption characteristics thatdepend on altitude and wavelength. In any case, observations at350 and 450 μm are possible all year long for both observatories.
4.2. Site comparison
Based upon the method described in Tremblin et al. (2011), weuse MOLIERE to calculate the transmissions at 200 μm and350 μm. We do not compute the transmissions for SOFIA herebecause it is by far superior to all ground-based sites. Its trans-mission curves are discussed in a dedicated section (Sect. 5).
Figure 7 shows the distribution functions of the 350-and 200-μm transmissions for all the other sites. In Table 3,we give the first decile and the quartiles of 200- and
Fig. 6. Transmission curves between 150 μm and 3 mm correspondingto the first decile (grey) and the quartiles (red: 25%, blue: 50%) of PWVbetween 2008 and 2010 at Cerro Chajnantor.
350-μm transmissions. 25% of the time, a transmission betterthan 55−65% (10–20%) at 350 μm (200 μm) can be found inAntarctica. For the first quartile, Cerro Chajnantor catches up theAntarctic sites thanks to its high altitude; however for the sec-ond and third quartile Antarctic sites have better transmissionsbased on the long-term statistics, especially at 350 μm. For thethree sites, Chajnantor Plateau, Cerro Macon, and Mauna Kea,the transmission window at 350 μm opens significantly, while itis only rarely possible to observe at 200 μm.
The extreme stability of the Antarctic sites is clearly visiblein Fig. 7. There is a stable plateau for the transmission betweenthe first and third quartiles that allows long time series and sur-veys to be conducted on these sites. This is the direct conse-quence of the stability of the PWV that was previously iden-tified at Dome C in Fig. 2. With its higher altitude, Dome Apresents the best conditions on Earth for submillimetre astron-omy in terms of transmission and day-to-day stability.
4.3. Transmission stability at 200 μm
The stability of the transmission is an important parameter forlarge surveys and time-series studies. The PWV of Chilean sitesis highly variable from one day to the next, whereas Antarcticsites are much more stable (see Figs. 2 and 3). The stabilityof the transmission leads to a high transmission even at longtime fraction in the distribution functions of Fig. 7. To quan-tify and compare the stability, we used the indicator introducedby De Gregori et al. (2012), the site photometric quality ra-tio (SPQR). It consists in the ratio of the monthly averaged
A65, page 5 of 10

A&A 548, A65 (2012)
Table 3. First decile and quartiles of the 350-μm (top) and 200-μm (bottom) transmissions for all the studied sites.
Time fraction Dome C Dome A South Cerro Chaj. Cerro Mauna Summit Yangbajing2008–2010 Pole Chaj. Plat. Macon Kea
0.10 0.62 0.72 0.61 0.65 0.56 0.49 0.40 0.42 0.190.25 0.57 0.67 0.56 0.58 0.46 0.41 0.27 0.31 0.020.50 0.51 0.62 0.47 0.44 0.31 0.29 0.14 0.15 0.000.75 0.41 0.57 0.34 0.24 0.12 0.15 0.03 0.02 0.00
Time fraction Dome C Dome A South Cerro Chaj. Cerro Mauna Summit Yangbajing2008–2010 Pole Chaj. Plat. Macon Kea
0.10 0.17 0.32 0.16 0.20 0.09 0.05 0.03 0.03 0.000.25 0.11 0.22 0.11 0.12 0.04 0.02 0.01 0.01 0.000.50 0.07 0.16 0.05 0.04 0.01 0.00 0.00 0.00 0.000.75 0.03 0.11 0.01 0.00 0.00 0.00 0.00 0.00 0.00
Fig. 7. Comparison of the distribution functions of the 350-μm (top)and 200-μm (bottom) transmissions for all the sites between 2008 and2010. The x-axis time percentage is done over the period during whichthe data extraction for the sites was possible, the actual percentage ofdata we got is indicated for each site in parenthesis.
transmission to its monthly standard deviation, on a daily timescale
SPQR = 〈T 〉/σT . (1)
The variations in this ratio for the transmission at 200 μm be-tween 2008 and 2010 are plotted in Fig. 8, and they indicate
Fig. 8. SPQR ratio for the 200-μm transmission for all the sites be-tween 2008 and 2010. The mean values between 2008 and 2010 areDome A 3.6, Dome C 2.7, South Pole 1.3, Cerro Chajnantor 1.1,Chajnantor Plateau 0.7, Cerro Macon 0.7, Mauna Kea 0.6, Summit(Greenland) 0.6, and Yangbajing (Tibet) 0.3.
that all temperate sites have an SPQR ratio lower than 1, whileAntarctic sites have a ratio greater than 1. Therefore, the fluctu-ations of the transmission are greater than the averaged trans-mission, on temperate sites. This quantifies the high variabil-ity of the transmission at these sites. The Arctic site on theSummit mountain is also highly variable, so that Antarctica isreally unique even among polar environments. On the Antarcticplateau, Dome A has the best SPQR ratio with a monthly aver-aged transmission that is typically three to four times higher thanthe fluctuations. Dome C also achieves very good conditionswith a ratio of 2–3, while the South Pole has a monthly-averagedtransmission of the same order as the fluctuations, so comparableto the conditions reached at Cerro Chajnantor.
5. Atmospheric transmission for SOFIA
The first successful science flights with SOFIA were carried outin 2011 and are summarized in special issues of A&A (2012,
A65, page 6 of 10
P. Tremblin et al.: Worldwide site comparison
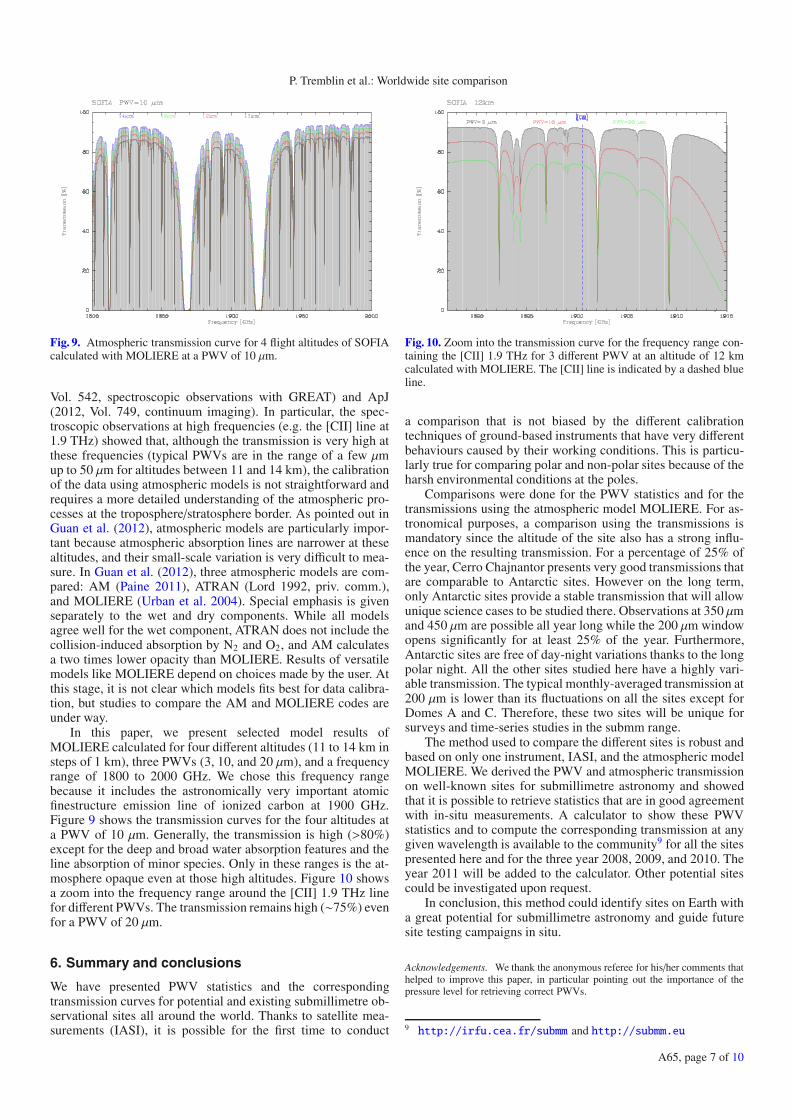
Fig. 9. Atmospheric transmission curve for 4 flight altitudes of SOFIAcalculated with MOLIERE at a PWV of 10 μm.
Vol. 542, spectroscopic observations with GREAT) and ApJ(2012, Vol. 749, continuum imaging). In particular, the spec-troscopic observations at high frequencies (e.g. the [CII] line at1.9 THz) showed that, although the transmission is very high atthese frequencies (typical PWVs are in the range of a few μmup to 50 μm for altitudes between 11 and 14 km), the calibrationof the data using atmospheric models is not straightforward andrequires a more detailed understanding of the atmospheric pro-cesses at the troposphere/stratosphere border. As pointed out inGuan et al. (2012), atmospheric models are particularly impor-tant because atmospheric absorption lines are narrower at thesealtitudes, and their small-scale variation is very difficult to mea-sure. In Guan et al. (2012), three atmospheric models are com-pared: AM (Paine 2011), ATRAN (Lord 1992, priv. comm.),and MOLIERE (Urban et al. 2004). Special emphasis is givenseparately to the wet and dry components. While all modelsagree well for the wet component, ATRAN does not include thecollision-induced absorption by N2 and O2, and AM calculatesa two times lower opacity than MOLIERE. Results of versatilemodels like MOLIERE depend on choices made by the user. Atthis stage, it is not clear which models fits best for data calibra-tion, but studies to compare the AM and MOLIERE codes areunder way.
In this paper, we present selected model results ofMOLIERE calculated for four different altitudes (11 to 14 km insteps of 1 km), three PWVs (3, 10, and 20 μm), and a frequencyrange of 1800 to 2000 GHz. We chose this frequency rangebecause it includes the astronomically very important atomicfinestructure emission line of ionized carbon at 1900 GHz.Figure 9 shows the transmission curves for the four altitudes ata PWV of 10 μm. Generally, the transmission is high (>80%)except for the deep and broad water absorption features and theline absorption of minor species. Only in these ranges is the at-mosphere opaque even at those high altitudes. Figure 10 showsa zoom into the frequency range around the [CII] 1.9 THz linefor different PWVs. The transmission remains high (∼75%) evenfor a PWV of 20 μm.
6. Summary and conclusions
We have presented PWV statistics and the correspondingtransmission curves for potential and existing submillimetre ob-servational sites all around the world. Thanks to satellite mea-surements (IASI), it is possible for the first time to conduct
Fig. 10. Zoom into the transmission curve for the frequency range con-taining the [CII] 1.9 THz for 3 different PWV at an altitude of 12 kmcalculated with MOLIERE. The [CII] line is indicated by a dashed blueline.
a comparison that is not biased by the different calibrationtechniques of ground-based instruments that have very differentbehaviours caused by their working conditions. This is particu-larly true for comparing polar and non-polar sites because of theharsh environmental conditions at the poles.
Comparisons were done for the PWV statistics and for thetransmissions using the atmospheric model MOLIERE. For as-tronomical purposes, a comparison using the transmissions ismandatory since the altitude of the site also has a strong influ-ence on the resulting transmission. For a percentage of 25% ofthe year, Cerro Chajnantor presents very good transmissions thatare comparable to Antarctic sites. However on the long term,only Antarctic sites provide a stable transmission that will allowunique science cases to be studied there. Observations at 350 μmand 450 μm are possible all year long while the 200 μm windowopens significantly for at least 25% of the year. Furthermore,Antarctic sites are free of day-night variations thanks to the longpolar night. All the other sites studied here have a highly vari-able transmission. The typical monthly-averaged transmission at200 μm is lower than its fluctuations on all the sites except forDomes A and C. Therefore, these two sites will be unique forsurveys and time-series studies in the submm range.
The method used to compare the different sites is robust andbased on only one instrument, IASI, and the atmospheric modelMOLIERE. We derived the PWV and atmospheric transmissionon well-known sites for submillimetre astronomy and showedthat it is possible to retrieve statistics that are in good agreementwith in-situ measurements. A calculator to show these PWVstatistics and to compute the corresponding transmission at anygiven wavelength is available to the community9 for all the sitespresented here and for the three year 2008, 2009, and 2010. Theyear 2011 will be added to the calculator. Other potential sitescould be investigated upon request.
In conclusion, this method could identify sites on Earth witha great potential for submillimetre astronomy and guide futuresite testing campaigns in situ.
Acknowledgements. We thank the anonymous referee for his/her comments thathelped to improve this paper, in particular pointing out the importance of thepressure level for retrieving correct PWVs.
9 http://irfu.cea.fr/submm and http://submm.eu
A65, page 7 of 10

A&A 548, A65 (2012)
Appendix A: PWV statistics and transmissioncurves
Fig. A.1. PWV statistics (top) and transmission curves (bottom) forDome A. The transmission curve for the first decile of PWV is in grey,and the quartiles of PWV are given by red: 25%, blue: 50%, green: 75%.
Fig. A.2. PWV statistics (top) and transmission curves (bottom) for theSouth Pole. The transmission curve for the first decile of PWV is ingrey, and the quartiles of PWV are given by red: 25%, blue: 50%,green: 75%.
Fig. A.3. PWV statistics (top) and transmission curves (bottom) forMauna Kea. The transmission curve for the first decile of PWV is ingrey, and the quartiles of PWV are given by red: 25%, blue: 50%.
Fig. A.4. PWV statistics (top) and transmission curves (bottom) forChajnantor Plateau. The transmission curve for the first decile of PWVis in grey, and the quartiles of PWV are given by red: 25%, blue: 50%.
A65, page 8 of 10

P. Tremblin et al.: Worldwide site comparison
Fig. A.5. PWV statistics (top) and transmission curves (bottom) forCerro Macon. The transmission curve for the first decile of PWV isin grey, and the quartiles of PWV are given by red: 25%, blue: 50%.
Fig. A.6. PWV statistics (top) and transmission curves (bottom) forSummit (Greenland). The transmission curve for the first decile of PWVis in grey, and the quartiles of PWV are given by red: 25%, blue: 50%,green: 75%.
Fig. A.7. PWV statistics (top) and transmission curves (bottom) forYangbajing (Tibet). The transmission curve for the first decile of PWVis in grey, and the quartiles of PWV are given by red: 25%, blue: 50%,green: 75%.
Fig. A.8. PWV statistics for Palmdale USA, at a stratospheric altitudeof 12 km.
Fig. A.9. PWV statistics for Christchurch New Zealand, at a strato-spheric altitude of 12 km.
A65, page 9 of 10
A&A 548, A65 (2012)
References
Chamberlin, R. 2002, in Astronomical Site Evaluation in the Visible and RadioRange. ASP Conf. Proc.,266, 172
Chamberlin, R. A., Lane, A. P., & Stark, A. A. 1997, ApJ, 476, 428Clerbaux, C., Boynard, A., Clarisse, L., et al. 2009, Atm. Chem. Phys., 9, 6041De Gregori, S., de Petris, M., Decina, B., et al. 2012, MNRAS, 425, 222Giovanelli, R., Darling, J., Sarazin, M., et al. 2001, PASP, 113, 789Guan, X., Stutzki, J., Graf, U. U., et al. 2012, A&A, 542, L4Herbin, H., Hurtmans, D., Clerbaux, C., Clarisse, L., & Coheur, P. F. 2009, Atm.
Chem. Phys., 9, 9433Matsushita, S., Matsuo, H., Pardo, J. R., & Radford, S. J. E. 1999, PASJ, 51,
603Minier, V., Olmi, L., Durand, G., et al. 2010, in EAS Publ. Ser., 40, 269Otárola, A., Travouillon, T., Schöck, M., et al. 2010, PASP, 122, 470Paine, S. 2011, SMA Tech. Memo, 152
Pardo, J. R., Cernicharo, J., & Serabyn, E. 2001, IEEE Trans. Antennas Prop.,49, 1683
Peterson, J. B., Radford, S. J. E., Ade, P., et al. 2003, PASP, 115, 383Phulpin, T., Blumstein, D., Prel, F., et al. 2007, in Atmospheric and
Environmental Remote Sensing Data Processing and Utilization III:Readiness for GEOSS, ed. Goldberg, 6684, 12
Pougatchev, N., August, T., Calbet, X., et al. 2008, in Earth ObservingSystems XIII, ed. Butler, 7081, 18
Radford, S. J. E. 2011, in Astronomical Site Testing Data in Chile, 41 ed. M.Curé, 87
Ricaud, P., Gabard, B., Derrien, S., et al. 2010, ITGRS, 48, 2189Schneider, N., Urban, J., & Baron, P. 2009, PSS, 57, 1419Tremblin, P., Minier, V., Schneider, N., et al. 2011, A&A, 535, A112Urban, J., Baron, P., Lautié, N., et al. 2004, J. Quant. Spectr. Radiat. Transf., 83,
529Yang, H., Kulesa, C. A., Walker, C. K., et al. 2010, PASP, 122, 490
A65, page 10 of 10