world shale gas resources: an initial assessment of … · world shale gas resources: an initial...
TRANSCRIPT

World Shale Gas Resources:An Initial Assessment of 14 RegionsOutside the United States
APRIL 2011
www.eia.gov
U.S. Department of EnergyWashington, DC 20585

The information presented in this overview is based on the report “World Shale Gas Resources: An Initial Assessment,” which was prepared by Advanced Resources International (ARI) for the U.S. Energy Information Administration (EIA), the statistical and analytical agency within the U.S. Department of Energy. The full report is attached. By law, EIA’s data, analyses, and forecasts are independent of approval by any other officer or employee of the United States Government. The views in this report therefore should not be construed as representing those of the Department of Energy or other Federal agencies.

U.S. Energy Information Administration | World Shale Gas Resources: An Initial Assessment 1
Background
The use of horizontal drilling in conjunction with hydraulic fracturing has greatly expanded the ability of producers to profitably produce natural gas from low permeability geologic formations, particularly shale formations. Application of fracturing techniques to stimulate oil and gas production began to grow rapidly in the 1950s, although experimentation dates back to the 19th century. Starting in the mid-1970s, a partnership of private operators, the U.S. Department of Energy (DOE) and the Gas Research Institute (GRI) endeavored to develop technologies for the commercial production of natural gas from the relatively shallow Devonian (Huron) shale in the Eastern United States. This partnership helped foster technologies that eventually became crucial to producing natural gas from shale rock, including horizontal wells, multi-stage fracturing, and slick-water fracturing.1 Practical application of horizontal drilling to oil production began in the early 1980s, by which time the advent of improved downhole drilling motors and the invention of other necessary supporting equipment, materials, and technologies, particularly downhole telemetry equipment, had brought some applications within the realm of commercial viability.2
The advent of large-scale shale gas production did not occur until Mitchell Energy and Development Corporation experimented during the 1980s and 1990s to make deep shale gas production a commercial reality in the Barnett Shale in North-Central Texas. As the success of Mitchell Energy and Development became apparent, other companies aggressively entered this play so that by 2005, the Barnett Shale alone was producing almost half a trillion cubic feet per year of natural gas. As natural gas producers gained confidence in the ability to profitably produce natural gas in the Barnett Shale and confirmation of this ability was provided by the results from the Fayetteville Shale in North Arkansas, they began pursuing other shale formations, including the Haynesville, Marcellus, Woodford, Eagle Ford and other shales. The development of shale gas plays has become a “game changer” for the U.S. natural gas market. The proliferation of activity into new shale plays has increased shale gas production in the United States from 0.39 trillion cubic feet in 2000 to 4.87 trillion cubic feet in 2010, or 23 percent of U.S. dry gas production. Shale gas reserves have increased to about 60.6 trillion cubic feet by year-end 2009, when they comprised about 21 percent of overall U.S. natural gas reserves, now at the highest level since 1971.3
The growing importance of U.S. shale gas resources is also reflected in EIA’s Annual Energy Outlook 2011 (AEO2011) energy projections, with technically recoverable U.S. shale gas resources now estimated at 862 trillion cubic feet. Given a total natural gas resource base of 2,543 trillion cubic feet in the AEO2011 Reference case, shale gas resources constitute 34 percent of the domestic natural gas resource base represented in the AEO2011 projections and 50 percent of lower 48 onshore resources. As a result, shale gas is the largest contributor to the projected growth in production, and by 2035 shale gas production accounts for 46 percent of U.S. natural gas production.
1 G.E. King, Apache Corporation, “Thirty Years of Gas Shale Fracturing: What Have We Learned?”, prepared for the SPE Annual Technic-al Conference and Exhibition (SPE 133456), Florence, Italy, (September 2010); and U.S. Department of Energy, DOE's Early Investment in Shale Gas Technology Producing Results Today, (February 2011), web site http://www.netl.doe.gov/publications/press/2011/11008-DOE_Shale_Gas_Research_Producing_R.html 2 See: U.S. Energy Information Administration, “Drilling Sideways: A Review of Horizontal Well Technology and Its Domestic Applica-tion”, DOE/EIA-TR-0565 (April 1993). 3 http://www.eia.doe.gov/oil_gas/natural_gas/data_publications/crude_oil_natural_gas_reserves/cr.html

2 U.S. Energy Information Administration | World Shale Gas Resources: An Initial Assessment
The successful investment of capital and diffusion of shale gas technologies has continued into Canadian shales as well. In response, several other countries have expressed interest in developing their own nascent shale gas resource base, which has lead to questions regarding the broader implications of shale gas for international natural gas markets. The U.S. Energy Information Administration (EIA) has received and responded to numerous requests over the past three years for information and analysis regarding domestic and international shale gas. EIA’s previous work on the topic has begun to identify the importance of shale gas on the outlook for natural gas.4
It appears evident from the significant investments in preliminary leasing activity in many parts of the world that there is significant international potential for shale gas that could play an increasingly important role in global natural gas markets.
To gain a better understanding of the potential of international shale gas resources, EIA commissioned an external consultant, Advanced Resources International, Inc. (ARI), to develop an initial set of shale gas resource assessments. This paper briefly describes key results, the report scope and methodology and discusses the key assumptions that underlie the results. The full consultant report prepared for EIA is in Attachment A. EIA anticipates using this work to inform other analysis and projections, and to provide a starting point for additional work on this and related topics.
Scope and ResultsIn total, the report assessed 48 shale gas basins in 32 countries, containing almost 70 shale gas
formations. These assessments cover the most prospective shale gas resources in a select group of
countries that demonstrate some level of relatively near-term promise and for basins that have a
sufficient amount of geologic data for resource analysis. Figure 1 shows the location of these basins and
the regions analyzed. The map legend indicates four different colors on the world map that correspond
to the geographic scope of this initial assessment:
� Red colored areas represent the location of assessed shale gas basins for which estimates of the ‘risked’ gas-in-place and technically recoverable resources were provided.
� Yellow colored area represents the location of shale gas basins that were reviewed, but for which estimates were not provided, mainly due to the lack of data necessary to conduct the assessment.
� White colored countries are those for which at least one shale gas basin was considered for this report.
� Gray colored countries are those for which no shale gas basins were considered for this report.
Although the shale gas resource estimates will likely change over time as additional information be-comes available, the report shows that the international shale gas resource base is vast. The initial estimate of technically recoverable shale gas resources in the 32 countries examined is 5,760 trillion
4 Examples of EIA work that has spurred or resulted from interest in this topic includes� U.S. Energy Information Administration, AEO2011 Early Release Overview (Dec 2010); R. Newell, U.S. Energy Information Administration, “Shale Gas, A Game Changer for U.S. and Global Gas Markets?”, presented at the Flame – European Gas Conference, Amsterdam, Netherlands (March 2, 2010); H. Gruens-pecht, U.S. Energy Information Administration, “International Energy Outlook 2010 With Projections to 2035”, presented at Center for Strategic and International Studies, Washington, D.C. (May 25, 2010); and R. Newell, U.S. Energy Information Administration, “The Long-term Outlook for Natural Gas”, presented to the Saudi Arabia - United States Energy Consultations, Washington, D.C. (February 2, 2011).

U.S. Energy Information Administration | World Shale Gas Resources: An Initial Assessment 3
Figure 1. Map of 48 major shale gas basins in 32 countries
cubic feet, as shown in Table 1. Adding the U.S. estimate of the shale gas technically recoverable resources of 862 trillion cubic feet results in a total shale resource base estimate of 6,622 trillion cubic feet for the United States and the other 32 countries assessed. To put this shale gas resource estimate in some perspective, world proven reserves5 of natural gas as of January 1, 2010 are about 6,609 trillion cubic feet,6 and world technically recoverable gas resources are roughly 16,000 trillion cubic feet,7
largely excluding shale gas. Thus, adding the identified shale gas resources to other gas resources increases total world technically recoverable gas resources by over 40 percent to 22,600 trillion cubic feet.
The estimates of technically recoverable shale gas resources for the 32 countries outside of the United States represents a moderately conservative ‘risked’ resource for the basins reviewed. These estimates are uncertain given the relatively sparse data that currently exist and the approach the consultant has employed would likely result in a higher estimate once better information is available. The methodology is outlined below and described in more detail within the attached report, and is not directly comparable to more detailed resource assessments that result in a probabilistic range of the technically
5 Reserves refer to gas that is known to exist and is readily producible, which is a subset of the technically recoverable resource base estimate for that source of supply. Those estimates encompass both reserves and that natural gas which is inferred to exist, as well as undiscovered, and can technically be produced using existing technology. For example, EIA’s estimate of all forms of technically reco-verable natural gas resources in the U.S. for the Annual Energy Outlook 2011 is 2,552 trillion cubic feet, of which 827 trillion cubic feet consists of unproved shale gas resources and 245 trillion cubic feet are proved reserves which consist of all forms of readily producible natural gas including 34 trillion cubic feet of shale gas. 6 “Total reserves, production climb on mixed results,” Oil and Gas Journal (December 6, 2010), pp. 46-49. 7 Includes 6,609 trillion cubic feet of world proven gas reserves (Oil and Gas Journal 2010); 3,305 trillion cubic feet of world mean esti-mates of inferred gas reserves, excluding the Unites States (USGS, World Petroleum Assessment 2000); 4,669 trillion cubic feet of world mean estimates of undiscovered natural gas, excluding the United States (USGS, World Petroleum Assessment 2000); and U.S. inferred reserves and undiscovered gas resources of 2,307 trillion cubic feet in the United States, including 827 trillion cubic feet of unproved shale gas (EIA, AEO2011).

4 U.S. Energy Information Administration | World Shale Gas Resources: An Initial Assessment
Table 1. Estimated shale gas technically recoverable resources for select basins in 32 countries, compared to existing reported reserves, production and consumption during 2009
2009 Natural Gas Market(1) (trillion cubic feet, dry basis)
Proved Natural Gas Reserves(2)
(trillion cubic feet)
Technically Recoverable Shale Gas Resources
(trillion cubic feet)
Production
Consump-tion
Imports(Exports)
Europe
FranceGermanyNetherlandsNorwayU.K.DenmarkSwedenPolandTurkeyUkraineLithuaniaOthers(3)
0.03 0.51 2.79 3.65 2.09 0.30 - 0.21 0.03 0.72 - 0.48
1.73 3.27 1.72 0.16 3.11 0.16 0.04 0.58 1.24 1.56 0.10 0.95
98%84%
(62%)(2,156%)
33%(91%)100%64%98%54%
100%50%
0.26.2
49.072.09.02.1
5.80.2
39.0
2.71
180
8 1783202341
1871542
4 19
North America
United States(4)
CanadaMexico
20.65.631.77
22.83.012.15
10%(87%)18%
272.562.012.0
862388681
Asia
ChinaIndiaPakistan
2.931.431.36
3.081.871.36
5%24%
-
107.037.929.7
1,2756351
Australia 1.67 1.09 (52%) 110.0 396 Africa
South AfricaLibyaTunisiaAlgeriaMoroccoWestern SaharaMauritania
0.07 0.56 0.13 2.88 0.00
- -
0.19 0.21 0.17 1.02 0.02
- -
63%
(165%)26%
(183%)90%
-
54.72.3
159.00.1
- 1.0
48529018
23111
7 0
South America
VenezuelaColombiaArgentina
0.65 0.37 1.46
0.71 0.31 1.52
9%(21%)
4%
178.94.0
13.4
1119
774 Brazil ChileUruguayParaguayBolivia
0.36 0.05 - - 0.45
0.66 0.10 0.00 - 0.10
45% 52%
100%
(346%)
12.9 3.5
26.5
226 64216248
Total of above areas Total world
53.1 106.5
55.0 106.7
(3%) 0%
1,001 6,609
6,622
Sources: 1Dry production and consumption: EIA, International Energy Statistics, as of March 8, 2011.2 Proved gas reserves: Oil and Gas Journal, Dec., 6, 2010, P. 46-49.3Romania, Hungary, Bulgaria.4 U.S. data are from various EIA sources.

U.S. Energy Information Administration | World Shale Gas Resources: An Initial Assessment 5
recoverable resource. At the current time, there are efforts underway to develop more detailed shale gas resource assessments by the countries themselves, with many of these assessments being assisted by a number of U.S. federal agencies under the auspices of the Global Shale Gas Initiative (GSGI) which was launched in April 2010.8
Delving deeper into the results at a country level, there are two country groupings that emerge where shale gas development may appear most attractive. The first group consists of countries that are currently highly dependent upon natural gas imports, have at least some gas production infrastructure, and their estimated shale gas resources are substantial relative to their current gas consumption. For these countries, shale gas development could significantly alter their future gas balance, which may motivate development. Examples of countries in this group include France, Poland, Turkey, Ukraine, South Africa, Morocco, and Chile. In addition, South Africa’s shale gas resource endowment is interesting as it may be attractive for use of that natural gas as a feedstock to their existing gas-to-liquids (GTL) and coal-to-liquids (CTL) plants. The second group consists of those countries where the shale gas resource estimate is large (e.g., above 200 trillion cubic feet) and there already exists a significant natural gas production infrastructure for internal use or for export. In addition to the United States, notable examples of this group include Canada, Mexico, China, Australia, Libya, Algeria, Argentina, and Brazil. Existing infrastructure would aide in the timely conversion of the resource into production, but could also lead to competition with other natural gas supply sources. For an individual country the situation could be more complex.
Methodology This report represents EIA’s initial effort to produce a systematic assessment of the international shale gas resource base and contains chapters on the 14 priority regions identified by EIA for initial study, including 32 countries. These priority regions were selected for a combination of factors that included potential availability of data, country-level natural gas import dependence, observed large shale basins, and observations of activities by companies and governments directed at shale gas development. The 14 regions and 32 countries covered in the report are:
� Canada � Mexico � Northern South America (Columbia, Venezuela) � Southern South America (Argentina, Chile, Uruguay, Paraguay, Bolivia, Brazil) � Central North Africa (Algeria, Tunisia, Libya) � Western North Africa (Morocco, Mauritania, Western Sahara) � Southern Africa (South Africa) � Western Europe (including, France, Germany, Netherlands, Norway, Denmark, Sweden, United
Kingdom) � Poland � Ukraine, Lithuania and other Eastern Europe countries
8 The Department of State is the lead agency for the GSGI, and the other U.S. government agencies that also participate include: the U.S. Agency for International Development (USAID); the Department of Interior’s U.S. Geological Survey (USGS); Department of Inte-rior’s Bureau of Ocean Energy Management, Regulation, and Enforcement (BOEMRE); the Department of Commerce’s Commercial Law Development Program (CLDP); the Environmental Protection Agency (EPA), and the Department of Energy’s Office of Fossil Energy (DOE/FE). See http://www.state.gov/s/ciea/gsgi/index.htm for more information.

6 U.S. Energy Information Administration | World Shale Gas Resources: An Initial Assessment
� China � India and Pakistan � Turkey � Australia
Russia and Central Asia, Middle East, South East Asia, and Central Africa were not addressed by the current report. This was primarily because there was either significant quantities of conventional natural gas reserves noted to be in place (i.e., Russia and the Middle East), or because of a general lack of information to carry out even an initial assessment. In addition, certain limitations in scope reflected funding constraints. The consultant’s approach relied upon publically available data from technical literature and studies on each of the selected international shale gas basins to first provide an estimate of the ‘risked gas in-place,’ and then to estimate the technically recoverable resource for that region. This methodology is intended to make the best use of sometimes scant data in order to perform initial assessments of this type.
Risked Gas In-Place
The risked gas in-place estimate is derived by first estimating the amount of ‘gas in-place’ resource for a prospective area within the basin, and then de-rating that gas in-place by factors that, in the consultant’s expert judgment, account for the current level of knowledge of the resource and the capability of the technology to eventually tap into the resource. The resulting estimate is referred to as the risked gas in-place. Determining the risked gas in-place consists of the following specific steps:
1. Conduct a preliminary review of the basin and select the shale gas formations to be assessed. 2. Determine the areal extent of the shale gas formations within the basin and estimate its overall
thickness, in addition to other parameters. 3. Determine the ‘prospective area’ deemed likely to be suitable for development based on a
number of criteria and application of expert judgment. 4. Estimate the gas in-place as a combination of ‘free gas’9 and ‘adsorbed gas’10
5. Establish and apply a composite ‘success factor’ made up of two parts. The first part is a ‘play success probability factor’ which takes into account the results from current shale gas activity as an indicator of how much is known or unknown about the shale formation. The second part is a ‘prospective area success factor’, which takes into account a set of factors (e.g., geologic complexity and lack of access) that could limit portions of the ‘prospective area’ from development.
that is contained within the prospective area.
Technically Recoverable Resource
The estimated technically recoverable resource base is one of the basic metrics for quantifying the total resource base that analysts would use to estimate future natural gas production. The technically
9 ‘Free gas’ is gas that is trapped in the pore spaces of the shale. Free gas can be the dominant source of natural gas for the deeper shales. 10 ‘Adsorbed gas’ is gas that adheres to the surface of the shale, primarily the organic matter of the shale, due to the forces of the chemical bonds in both the substrate and the gas that cause them to attract. Adsorbed gas can be the dominant source of natural gas for the shallower and higher organically rich shales.

U.S. Energy Information Administration | World Shale Gas Resources: An Initial Assessment 7
recoverable resource estimate for shale gas in this report is established by multiplying the risked gas-in-place by a shale gas recovery factor, which incorporates a number of geological inputs and analogs that are appropriate to each shale gas basin and formation. The basic recovery factors used in this report generally ranged from 20 percent to 30 percent, with some outliers of 15 percent and 35 percent being applied in exceptional cases. The consultant selected the recovery factor based on prior experience in how production occurs, on average, given a range of factors including mineralogy, geologic complexity, and a number of other factors that affect the response of the geologic formation to the application of best practice shale gas recovery technology.
Key Exclusions The information contained within this report represents an initial assessment of the shale gas resource base in 14 regions outside the United States. As such, there are a number of additional factors outside of the scope of this report that must be considered when attempting to incorporate the information into a forecast of future shale gas production. In addition, several other exclusions were made for this report to simplify how the assessments were made and to keep the work to a level consistent with the available resources. Some of the key exclusions for this report include the following:
� Assessed basins without a resource estimate, which resulted when data were judged to be inade-quate to provide a useful estimate. Including additional basins would, on average, likely result in an increase in the estimated resource base.
� Countries outside the scope of the report, the inclusion of which would also likely add to the esti-mated resource base – particularly since it is acknowledged that potentially productive shales exist in Russia and most of the countries in the Middle East. While expanding the scope would likely result in an increase in the estimated shale gas technically recoverable resources, this initial assessment did not focus on those regions due to their substantial conventional gas resources. In other cases, the in-frastructure or markets that would be a necessary precondition for gas production may not be built within a meaningful time frame.
� Offshore portions of assessed shale gas basins were excluded, as well as shale gas basins that exist entirely offshore.
� Coalbed methane, tight gas and other natural gas resources that may exist within these countries were also excluded from the assessment.
� Shale oil was excluded from the assessment, although the contractor noted for several basins that the limits of the assessed shale gas area were defined by the transition from higher maturity gas prone areas to the lower maturity ‘oil window’.
� Production costs were not estimated for any of the basins. The costs of production could be greatly impacted by a number of factors including the availability of existing infrastructure, availability and cost of adequately trained labor, availability and cost of equipment such as rigs and pumping equip-ment, the geologic features of the fields within the play such as depth and thickness, and a number of other factors that affect the direct costs of production. Estimated production costs for each of the basins would also need to be considered in order to estimate the potential future production of shale gas given a future price.
� Above ground issues were not considered, such as access to the resource, can greatly affect produc-tion costs and the timing of production.

World Shale Gas Resources: An Initial Assessment
February 17, 2011 1-1
1. EXECUTIVE SUMMARY AND STUDY RESULTS
INTRODUCTORY REMARKS
The “World Shale Gas Resources: An Initial Assessment”, conducted by Advanced
Resources International, Inc. (ARI) for the U.S. DOE’s Energy Information Administration (EIA),
evaluates the shale gas resource in 14 regions containing 32 countries, Table 1-1.
The information provided in the 14 regional reports (selected for assessment by EIA)
should be viewed as initial steps toward future, more comprehensive assessments of shale gas
resources. The study investigators would have, if allowed, devoted the entire study budget to
just one of the 14 regions and would have judged this more in-depth time and budget
investment “well spent”. Alas, that was not possible. As such, this shale gas resource
assessment captures our “first-order” view of the gas in-place and technically recoverable
resource for the 48 shale gas basins and 69 shale gas formations addressed by the study. As
additional exploration data are gathered, evaluated and incorporated, the assessment of shale
gas resources will become more rigorous.

World Shale Gas Resources: An Initial Assessment
February 17, 2011 1-2
Table 1-1. The Scope of the “World Shale Gas Resources: An Initial Assessment”
Continent Region/Country Number of Countries
Number of Basins
Number of Gas Shale
FormationsI. Canada 1 7 9II. Mexico 1 5 8Subtotal 2 12 17
III. Northern South America 2 2 3IV. Southern South America 6 4 7
Subtotal 8 6 10V. Poland 1 3 3
VI. Eastern Europe 3 3 3VII. Western Europe 7 6 9
Subtotal 11 12 15VIII. Central North Africa 3 2 4
IX. Morocco 3 2 2X. South Africa 1 1 3
Subtotal 7 5 9XI. China 1 2 4
XII. India/Pakistan 2 5 6XIII. Turkey 1 2 3
Subtotal 4 9 13
Australia XIV. Australia 1 4 532 48 69Total
North America
South America
Europe
Africa
Asia
Two points are important to keep in mind when viewing the individual shale gas basin-
and formation-level shale gas resource assessments:
� First, the resource assessments provided in the individual regional reports are only
for the higher quality, “prospective areas” of each shale gas basin and formation.
The lower quality and less defined shale gas resource areas in these basins, that
may hold additional shale gas resources, are not included in the quantitatively
assessed and reported values.
� Second, the in-place and recoverable resource values for each shale gas basin and
formation have been risked to incorporate: (1) the probability that the shale gas
formation will (or will not) have sufficiently attractive gas flow rates to become
developed; and (2) an expectation of how much of the prospective area set forth for
each shale gas basin and formation will be developed in the foreseeable future.

World Shale Gas Resources: An Initial Assessment
February 17, 2011 1-3
No doubt, future exploration drilling will lead to adjustments in these two risk factors and
thus the ultimate size of the developable international shale gas resource. We would urge the
U.S. Energy Information Administration, who commissioned this valuable, “cutting edge” shale
gas resource assessment, to capture and incorporate the significant volume of shale gas
exploration and resource information that will become available during the next several years,
helping keep this shale gas resource assessment “evergreen”.
SUMMARY OF STUDY FINDINGS
Although the exact resource numbers will change with time, our work shows that the
international shale gas resource is vast.
� Overall, we have identified and assessed a shale gas resource equal to 22,016 Tcf
of risked gas in-place, not including U.S. shale gas resources.
� Applying appropriate recovery factors, we estimate a technically recoverable shale
gas resource of 5,760 Tcf.
Importantly, much of this shale gas resource exists in countries with limited conventional
gas supplies or where the conventional gas resource has largely been depleted, such as in
China, South Africa and Europe.
The regional level tabulations of the risked in-place and technically recoverable shale
gas resource are provided in Table 1-2.
Table 1-2. Risked Gas In-Place and Technically Recoverable Shale Gas Resources: Six Continents
Continent Risked Gas In-Place (Tcf)
Risked Technically Recoverable
(Tcf)
North America 3,856 1,069South America 4,569 1,225
Europe 2,587 624Africa 3,962 1,042Asia 5,661 1,404
Australia 1,381 396Total 22,016 5,760
A more detailed tabulation of shale gas resources (risked gas in-place and risked

World Shale Gas Resources: An Initial Assessment
February 17, 2011 1-4
technically recoverable), at the country-level, is provided in Table 1-3.
Additional information on the size of the shale gas resource, at a detailed basin- and
formation-level, is provided in Appendix A.
Significant additional shale gas resources exist in the Middle East, in Russia, in
Indonesia, and numerous other regions and countries not yet included in our study. Hopefully,
future editions of this report will more fully incorporate these other important shale gas areas.

World Shale Gas Resources: An Initial Assessment
February 17, 2011 1-5
Table 1-3. Risked Gas In-Place and Technically Recoverable Shale Gas Resources: 32 Countries
Continent Region Country Risked Gas In-Place (Tcf)
Technically Recoverable
Resource (Tcf)1,490 3882,366 6813,856 1,069
Columbia 78 19Venezuela 42 11Subtotal 120 30Argentina 2,732 774
Bolivia 192 48Brazil 906 226Chile 287 64
Paraguay 249 62Uruguay 83 21Subtotal 4,449 1,195
4,569 1,225Poland 792 187
Lithuania 17 4Kaliningrad 76 19
Ukraine 197 421,082 252
France 720 180Germany 33 8
Netherlands 66 17Sweden 164 41Norway 333 83
Denmark 92 23U.K. 97 20
Subtotal 1,505 3722,587 624
Algeria 812 230Libya 1,147 290
Tunisia 61 18Morroco* 108 18Subtotal 2,128 557
1,834 4853,962 1,0425,101 1,275
India 290 63Pakistan 206 51
64 155,661 1,404
Australia 1,381 39622,016 5,760Grand Total
I. CanadaII. Mexico
X. South Africa
XI. China
XIII. Turkey
XIV. AustraliaTotal
* Includes Western Sahara & Mauritania
Total
Asia XII. India/Pakistan
Total
AfricaVIII. Central North Africa
Total
Europe
VI. Eastern Europe
VII. Western Europe
Total
South America
III. Northern South America
IV. Southern South America
North America

World Shale Gas Resources: An Initial Assessment
February 17, 2011 1-6
COMPARISON OF STUDY FINDINGS
Prior to this study - - “World Shale Gas Resources: An Initial Assessment” - - only one
other study is publically available that addresses the overall size of the shale gas resource.
This is the valuable work by H-H. Rogner.1
Our detailed basin-by-basin assessments of the shale gas resource, show that the shale
gas resource in-place is larger than estimated by Rogner, even accounting for the fact that a
number of the large shale gas resource areas (such as Russia and the Middle East) have not
yet been included in our study (but are included in Rogner’s shale gas resource numbers).
� Overall, our gas study established a risked shale gas in-place of 25,300 Tcf (when
we include our shale gas estimate for the U.S. of 3,284 Tcf) compared to Rogner’s
estimate of 13,897 Tcf of shale gas in-place when we exclude the areas of the world
not included in this study. (Rogner’s total shale gas in-place is 16,112 Tcf.)
� The largest and most notable areas of difference in the shale gas resource
assessments are for Europe, Africa and North America, Table 1-4.
Table 1-4. Comparison of Rogner’s and This Study Estimates of Shale Gas Resources In-Place
Continent H-H Rogner (Tcf)
EIA/ARI (Tcf)
1. North America* 3,842 7,140
2. South America 2,117 4,569
3. Europe 549 2,587
4. Africa** 1,548 3,962
5. Asia 3,528 5,661
6. Australia 2,313 1,381
7. Other*** 2,215 n/a
Total 16,112 25,300* Includes U.S. sha le gas in-place of 3,.824 Tcf, based on estimated (ARI) 820 Tcf of technica l ly recoverable sha le gas resources and a 25% recovery efficiency of sha le gas in-place.** Rogner estimate includes one-hal f of Middle East and North Africa (1,274) and Sub-Saharan Africa (274 Tcf).
*** Includes FSU (627 Tcf), Other As ia Paci fic (314 Tcf) and one-hal f of Middle East/North Africa (1,274) Tcf.
1 Rogner, H-H., “An Assessment of World Hydrocarbon Resources”, Annu. Rev. Energy Environ. 1997, 22:217-62.

World Shale Gas Resources: An Initial Assessment
February 17, 2011 1-7
FFig
ure
11--11
MMa
p o
f 4
8 M
ajo
r S
ha
le B
asi
ns
iin 33
2 CC
ou
ntr
ies

Assessment of International Shale Gas
February 17, 2011 2-1
2. SHALE GAS RESOURCE ASSESSMENT METHODOLOGY
INTRODUCTION
This Chapter sets forth our methodology for assessing the in-place and recoverable
shale gas resources for the 14 regions (encompassing 32 countries) addressed by this study.
The methodology relies on extensive geological information and reservoir properties assembled
from the technical literature and data from publically available company reports and
presentations. This publically available information has been augmented by internal (non-
confidential) prior work on U.S. and international shale gas by Advanced Resources
International.
The regional reports should be viewed as initial steps toward future, more
comprehensive assessments of shale gas resources. As additional exploration data are
gathered, evaluated and incorporated, these regional assessments of shale gas resources will
become more rigorous.
RESOURCE ASSESSMENT METHODOLOGY
The methodology for conducting the basin- and formation-level assessments of shale
gas resources includes the following five topics:
1. Conducting preliminary geologic and reservoir characterization of shale basins and formation(s).
2. Establishing the areal extent of the major shale gas formations.
3. Defining the prospective area for each shale gas formation.
4. Estimating the risked shale gas in-place.
5. Calculating the technically recoverable shale gas resource.
Each of these five shale gas resource assessment steps is further discussed below.
The shale gas resource assessment for Central North Africa and particularly the Ghadames
Basin is used to illustrate certain of these resource assessment steps.

Assessment of International Shale Gas
February 17, 2011 2-2
2.1. Conducting Pre liminary Geologic and Res ervo ir Charac te riza tion of Sha le Bas ins and Formation (s ).
The resource assessment begins with the compilation of data from multiple public and
private sources to define the shale gas basins and to select the major shale gas formations to
be assessed. The stratigraphic columns and well logs, showing the geologic age, the source
rocks and other data, are used to select the major shale formations for further study, as
illustrated in Figure 2.1 for the Ghadames Basin of southern Tunisia.
Preliminary geological and reservoir data are assembled for each major shale formation,
including the following key items:
� Depositional environnent of shale (marine vs non-marine)
� Depth (to top and base of shale interval)
� Structure, including major faults
� Gross shale interval
� Organically-rich gross and net shale thickness
� Total organic content (TOC, by wt.)
� Thermal maturity (Ro)
These geologic and reservoir properties are used to provide a first order overview of the
geologic characteristics of the major shale gas formations and to help select the shale gas
formations deemed worthy of more intensive assessment.

Assessment of International Shale Gas
February 17, 2011 2-3
Figure 2-1: Southern Tunisia, Ghadames Basin Stratigraphic Columni
(The two major shale gas formations, the Silurian Tannezuft and the Devonian Frasnian, are highlighted.)
Assessment of International Shale Gas
February 17, 2011 2-4
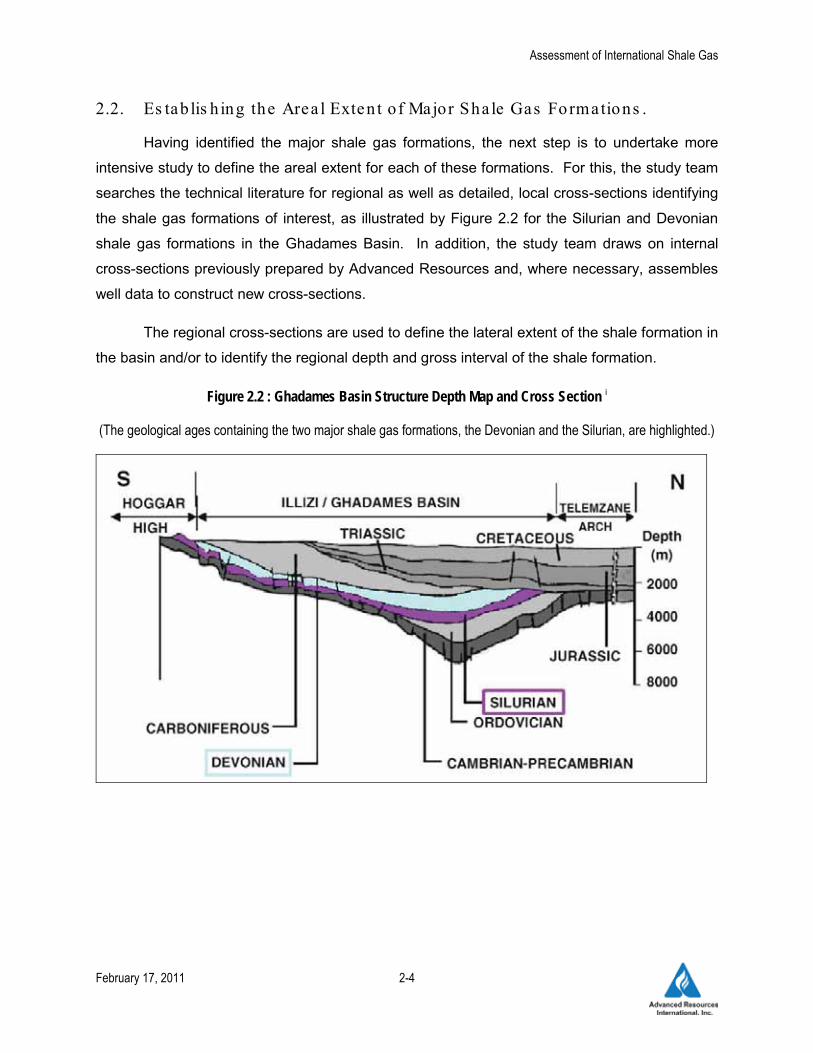
2.2. Es tab lis h ing the Area l Exten t o f Major Sha le Gas Formations .
Having identified the major shale gas formations, the next step is to undertake more
intensive study to define the areal extent for each of these formations. For this, the study team
searches the technical literature for regional as well as detailed, local cross-sections identifying
the shale gas formations of interest, as illustrated by Figure 2.2 for the Silurian and Devonian
shale gas formations in the Ghadames Basin. In addition, the study team draws on internal
cross-sections previously prepared by Advanced Resources and, where necessary, assembles
well data to construct new cross-sections.
The regional cross-sections are used to define the lateral extent of the shale formation in
the basin and/or to identify the regional depth and gross interval of the shale formation.
Figure 2.2 : Ghadames Basin Structure Depth Map and Cross Section i
(The geological ages containing the two major shale gas formations, the Devonian and the Silurian, are highlighted.)

Assessment of International Shale Gas
February 17, 2011 2-5
3. Defin ing the P ros pec tive Area for Each Sha le Gas Formation .
An important and challenging resource assessment step is to establish the portions of
the basin that, in our view, are deemed to be prospective for development of shale gas. The
criteria used for establishing the prospective area include:
� Depositional Environment.
Figure 2.3 provides a ternary diagram useful for classifying the mineral content of the
shale for the Marcellus Shale in Lincoln Co., West Virginia. Figure 2.4 illustrates the
relationship between shale formation mineralogy, shale brittleness and shale
response to hydraulic fracturing.
An important criterion is the depositional environment of
the shale, particularly whether it is marine or non-marine. Marine-deposited shales
tend to have lower clay content and tend to be high in brittle minerals such as quartz,
feldspar and carbonates. Brittle shales respond favorably to hydraulic stimulation.
Shales deposited in non-marine settings (lacustrine, fluvial) tend to be higher in clay,
more ductile and less responsive to hydraulic stimulation.
Figure 2.3. Ternary Diagram of Shale Mineralogy (Marcellus Shale).
Source: Modified from AAPG Bull. 4/2007, p. 494 & 495AAPG B ll 4/2007 494 & 495JAF028263.PPT
Calcite (C) Clay (Cly)
Quartz (Q)

Assessment of International Shale Gas
February 17, 2011 2-6
Figure 2.4. Relationship of Shale Mineralogy (Q, C and Cly) and Thermal Maturity to Gas Flow
Source: Modified from AAPG Bull. 4/2007, p. 494 & 495JAF028263.PPT
� Depth
�
. The depth criterion for the prospective area is greater than 1,000 meters, but
less than 5,000 meters (3,300 feet to 16,500 feet). Areas shallower than 1,000
meters have lower pressure and a lower gas concentration. In addition, shallow
shale gas formations have risks of higher water content in their natural fracture
systems. Areas deeper than 5,000 m have risks of reduced permeability and much
higher drilling and development costs.
Total Organic Content (TOC)
Organic materials such as microorganism fossils and plant matter provide the
requisite carbon, oxygen and hydrogen atoms needed to create natural gas and oil.
As such TOC is an important measure of the gas generation potential of a shale
formation.
. In general, the TOC of prospective area needs to be
equal to or greater than 2%. Figure 2.5 provides an example of using a gamma ray
log to identify the TOC content for the Marcellus Shale in the New York (Chenango
Co.) portion of the Appalachian Basin.

Assessment of International Shale Gas
February 17, 2011 2-7
Figure 2.5. Relationship of Gamma Ray and Total Organic Carbon
� Thermal Maturity
The thermal maturity of the prospective area needs to have a Ro greater than 1.0%,
with a second higher quality prospective area defined as having a Ro greater than
1.3%. Higher thermal maturity settings also lead to the presence of nanopores which
contribute to additional porosity in the shale matrix. Figure 2.7 provides an
illustration of the relationship between thermal maturity and the development of
nanopores in the shale matrix.
. Thermal maturity measures the degree to which a formation has
been exposed to high heat needed to break down organic matter into hydrocarbons.
The reflectance of certain types of minerals (Ro%) is used as an indication of
Thermal Maturity, Figure 2.6.
� Geographic Location. The prospective area is limited to the onshore portion of the
shale gas basin.

Assessment of International Shale Gas
February 17, 2011 2-8
Figure 2-6. Thermal Maturation Scale
Figure 2-7. Thermal Maturity and Gas Storage Capacity
Nanoporesin Maturing Kerogen
Source: Reed et al. Texas BEG
JAF028263.PPT

Assessment of International Shale Gas
February 17, 2011 2-9
The prospective area contains the higher quality portion of the shale gas resource and,
in general, covers less than half of the overall basin area. The prospective area will contain a
series of shale gas quality areas, typically including a geologically favorable, high resource
concentration “core area” and a series of lower quality and lower resource concentration
extension areas. However, the further delineation of the prospective area was beyond the
scope of this initial resource assessment study.
The U.S. Barnett Shale illustrates the presence of a high quality “core area”, two
extension areas (called Extension Area #I and Extension Area #2) and a lower thermally less
mature (combination of oil, condensate and natural gas) play along the northern edge of the
basin, Figure 2.8.
Figure 2-8. Barnett Shale Resource and Play Areas
Fort Worth BasinAll Barnett Wells
Extension Area #1
Core Area
Extension Area #2
JAF028263.PPT
• Core Area (1,548 mi2). High resource concentration area with EUR per well of 2.5 Bcf.
• Extension Area #1 (2,254 mi2).Area of emerging drilling and production with EUR per well of 1.5 Bcf.
• Extension Area #2 (4,122 mi2).Area of lower productivity with EUR per well of 0.8 Bcf .
The total Barnett Shale gas play covers 8,000 mi2, with about 4,000 mi2 of the area prospective for natural gas.
A more detailed resource assessment, including in-depth appraisal of newly drilled
exploration wells, with modern logs and rigorous core analyses, will be required to define these
next levels of resource quality and concentration for the major international shale gas plays.
4. Es timating the Ris ked Gas In-Place (GIP).

Assessment of International Shale Gas
February 17, 2011 2-10
Detailed geologic and reservoir data are assembled to establish the free as well as the
adsorbed gas in-place (GIP) for the prospective area. Adsorbed gas can be the dominant in-
place resource for shallow and highly organically rich shales. Free gas becomes the dominant
in-place resource for deeper, higher clastic content shales.
a. Free Gas In-Place. The calculation of free gas in-place for a given areal extent
(acre, square mile) is governed, to a large extent, by four characteristics of the shale formation
- - pressure, temperature, gas-filled porosity and net organically-rich shale thickness.
� Pressure
�
. The study methodology places particular emphasis on identifying areas
with overpressure, which enables a higher concentration of gas to be contained
within a fixed reservoir volume. A normal hydrostatic gradient of 0.433 psi per foot of
depth is used when actual pressure data is unavailable.
Temperature. The study assembles data on the temperature of the shale formation,
giving particular emphasis on identifying areas with higher than average temperature
gradients and surface temperatures. A normal temperature gradient of 1o F per foot
of depth plus a surface temperature of 60o
�
F are used when actual temperature data
is unavailable.
Gas-Filled Porosity
�
. The study assembles the porosity data from core or log
analyses available in the public literature. When porosity data are not available,
emphasis is placed on identifying the mineralogy of the shale and its maturity for
estimating porosity values from analogous U.S shale basins. Unless other evidence
is available, the study assumes the pores are filled with gas and residual water.
Net Organically-Rich Shale Thickness
The above data are combined using established PVT reservoir engineering equations
and conversion factors to calculate free GIP per square mile. The calculation of free GIP uses
the following standard reservoir engineering equation:
. The overall shale interval is obtained from
prior stratigraphic studies of the formations in the basin being appraised. The
organically-rich thickness of the shale interval is established from log data and cross
sections, where available. A net to gross ratio is used to estimate the net thickness
of the shale from the gross organically-rich shale interval.

Assessment of International Shale Gas
February 17, 2011 2-11
P0.02829zT
GIP =
Where: Bg =
A is area, in acres (with the conversion factors of 43,560 square feet per acre and 640 acres per square mile).
h is net shale thickness, in feet (a minimum TOC criterion of 2% (by wt.) is used to define the net organically-rich pay from the larger shale interval and the gross organically-rich shale thickness.)
� is porosity, a dimensionless fraction (the values for porosity are obtained from log or core information published in the technical literature or assigned by analogy from U.S. shale gas basins; the thermal maturity of the shale and its depth of burial can influence the porosity value used for the shale).
(1-SW) is the fraction of the porosity filled by gas (Sg) instead of water (SW), a dimensionless fraction (the established value for porosity (�) is multiplied by the term (1-SW) to establish gas-filled porosity; the value Sw defines the fraction of the pore space that is filled with water, often the residual or irreducible reservoir water saturation in the natural fracture and matrix porosity of the shale; liquids-rich shales may also contain condensate and/or oil (So) in the pore space, further reducing gas-filled porosity.
P is pressure, in psi (pressure data is obtained from well test information published in the literature, inferred from mud weights used to drill through the shale sequence, or assigned by analog from U.S. shale gas basins; basins with normal reservoir pressure are assigned a gradient of 0.433 psi per foot of depth; basins with indicated overpressure are assigned pressure gradients of 0.5 to 0.6 psi per foot of depth; basins with indicated underpressure are assigned pressure gradients of 0.3 to 0.4 psi per foot of depth).
T is temperature, in degrees Rankin (temperature data is obtained from well test information published in the literature or from regional temperature versus depth gradients; the factor 460 oF is added to the reservoir temperature (in oF) to provide the input value for the gas volume factor (Bg)equation).
Bg is the gas volume factor, in cubic feet per standard cubic feet and includes the gas deviation factor (z), a dimensionless fraction. (The gas deviation factor (z) adjusts the ideal compressibility (PVT) factor to account for non-ideal PVT behavior of the gas; gas deviation factors, complex functions of pressure, temperature and gas composition, are published in standard reservoir engineering text.)
g
w
BSh )-(1A*560,43 �

Assessment of International Shale Gas
February 17, 2011 2-12
b. Adsorbed Gas In-Place. In addition to free gas, shales can hold significant
quantities of gas adsorbed on the surface of the organics (and clays) in the shale formation.
A Langmuir isotherm is established for the prospective area of the basin using available
data on TOC and on thermal maturity to establish the Langmuir volume (VL) and the Langmuir
pressure (PL
Adsorbed gas in-place is then calculated using the formula below (where P is original
reservoir pressure).
).
GC = (VL * P) / (PL + P)
The above gas content (GC
The estimates of the Langmuir value (V
) (typically measured as cubic feet of gas per ton of net
shale) is converted to gas concentration (adsorbed GIP per square mile) using actual or typical
values for shale density. (Density values for shale are typically in the range of 2.65 to 2.8 gm/cc
and depend on the mineralogy and organic content of the shale.)
L) and pressure (PL
In general, the Langmuir volume (V
) for adsorbed gas in-place
calculations are based on either publically available data in the technical literature or internal
(proprietary) data developed by Advanced Resources from prior work on various U.S. and
international shale basins.
L) is a function of the organic richness and thermal
maturity of the shale, as illustrated in Figure 2.9. The Langmuir pressure (PL
The free gas in-place (GIP) and adsorbed GIP are combined to estimate the resource
concentration (Bcf/mi
) is a function of
how readily the adsorbed gas on the organics in the shale matrix is released as a function of a
finite decrease in pressure.
2) for the prospective area of the shale gas basin. Figure 2.10 illustrates
the relative contributions of free (porosity) gas and adsorbed (sorbed) gas to total gas in-place,
as a function of pressure.

Assessment of International Shale Gas
February 17, 2011 2-13
Figure 2-9. Marcellus Shale Adsorbed Gas Content
Adsorbed Gas Content: Lower TOC(Gas Content in scf/ton vs pressure)
Adsorbed Gas Content: Higher TOC(Gas Content in scf/ton vs pressure)
JAF028263.PPT
Figure 2-10. Combining Free and Adsorbed Gas for Total Gas In-Place
Adsorption Isotherm (Gas Content vs. Pressure)
Shallow Gas Shales Deep Gas Shales
TotalPorositySorbed
JAF028263.PPT

Assessment of International Shale Gas
February 17, 2011 2-14
c. Establishing the Success/Risk Factors. Two specific judgmentally established
success/risk factors are used to estimate risked GIP within the prospective area of the shale gas
formation. These two factors, are as follows:
� Play Success Probability Factor
As exploration wells are drilled, tested and produced and information on the viability
of the shale gas play is established, the play success probability factor will change.
. The shale gas play success probability factor
captures the likelihood that at least some significant portion of the shale gas
formation will provide gas at attractive flow rates and become developed. Certain
shale gas formations, such as the Muskwa Shale/Otter Park in the Horn River Basin
are already under development and thus would have a play probability factor of
100%. More speculative shale gas formations with limited geologic and reservoir
data, may only have a play success probability factor of 30% to 40%.
� Prospective Area Success (Risk) Factor:
The prospective area success (risk) factor also captures the amount of available
geologic/reservoir data and the extent of exploration that has occurred in the
prospective area of the basin to determine what portion of the prospective area has
been sufficiently “de-risked”. As exploration and delineation proceed, providing a
more rigorous definition of the prospective area, the prospective area success (risk)
factor will change.
The prospective area success (risk) factor
combines a series of concerns that could relegate a portion of the prospective area
to be unsuccessful or unproductive for gas production. These concerns include
areas with high structural complexity (e.g., deep faults, upthrust fault blocks); areas
with lower thermal maturity (Ro between 1.0 and 1.2); the outer edge areas of the
prospective area with lower net organic thickness; and other information appropriate
to include in the success (risk) factor.
These two success/risk factors are combined to derive a single composite success
factor with which to risk the GIP for the prospective area. Appendix B provides a tabulation of
the play success probability and prospective area success factors assigned to each of the major
shale gas basins included in this resource assessment.

Assessment of International Shale Gas
February 17, 2011 2-15
As introduced above, the history of shale gas exploration has shown that the
success/risk factors, particularly the prospective area success/risk factor, change over time. As
exploration wells are drilled and the favorable shale gas reservoir settings and prospective
areas are more fully established, it is likely that larger assessments of the gas in-place will
emerge.
6. Es timating the Technica lly Reco verab le Res ource .
The technically recoverable resource is established by multiplying the risked GIP by a
shale gas recovery factor, which incorporates a number of geological inputs and analogs
appropriate to each shale gas basin and formation. The recovery factor uses information on the
mineralogy of the shale to determine its favorability for applying hydraulic fracturing to “shatter”
the shale matrix. The recovery factor also considers other information that would impact gas
well productivity, such as: presence of favorable micro-scale natural fractures; the absence of
unfavorable deep cutting faults; the state of stress (compressibility) for the shale formations in
the prospective area; the relative volumes of free and adsorbed gas concentrations; and the
reservoir pressure in the prospective area.
Three basic gas recovery factors, incorporating shale mineralogy, reservoir properties
and geologic complexity, are used in the resource assessment.
� Favorable Gas Recovery
�
. A 30% recovery factor of the gas in-place is used for
shale gas basins and formations that have low clay content, low to moderate
geologic complexity and favorable reservoir properties such as an overpressured
shale formation and high gas-filled porosity.
Average Gas Recovery
�
. A 25% recovery factor of the gas in-place is used for shale
gas basins and formations that have a medium clay content, moderate geologic
complexity and average reservoir pressure and properties.
Less Favorable Gas Recovery
A recovery factor of 35% is applied in a few exceptional cases with established high
rates of well performance. A recovery factor of 15% is applied in exceptional cases of severe
under-pressure and reservoir complexity.
. A 20% recovery factor of the gas in-place is used for
shale gas basins and formations that have medium to high clay content, moderate to
high geologic complexity and below average reservoir properties.

Assessment of International Shale Gas
February 17, 2011 2-16
Finally, shale gas basins and formations that have very high clay content (e.g., non-
marine shales) and/or have very high geologic complexity (e.g., thrusted and high stress) are
categorized as non-prospective and excluded from this shale gas resource assessment.
Subsequent, more intensive and smaller-scale (rather than regional-scale) resource
assessments may identify the more favorable areas of a basin, enabling portions of the basin
currently deemed non-prospective to be added to the shale gas resource assessment.
Similarly, advances in well completion practices may enable more of the very high clay content
shale formations to be efficiently stimulated, also enabling these basins and formations to be
added to the resource assessment.
a. Two Key Gas Recovery Technologies. Because the native permeability of the
shale gas reservoir is extremely low, on the order of a few hundred nano-darcies (0.0001 md to
0.001 md), efficient recovery of the gas held in the shale matrix requires two key well drilling and
completion techniques, as illustrate by Figure 2.11:
Figure 2-11. Lower Damage, More Effective Horizontal Well Completions Provide Higher Reserves Per Well
Assessment of International Shale Gas
February 17, 2011 2-17
� Long Horizontal Wells
�
. Long horizontal wells (laterals) are designed to place the gas
production well in contact with as much of the shale matrix as technically and
economically feasible.
Intensive Well Stimulation
The efficiency of the hydraulic well stimulation depends greatly on the mineralogy of the
shale, as further discussed below.
. Large volume hydraulic stimulations, conducted in
multiple, closely spaced stages (up to 20), are used to “shatter” the shale matrix and
create a permeable reservoir. This intensive set of induced and propped hydraulic
fractures provided the critical flow paths from the shale matrix to the horizontal well.
Existing, small scale natural fractures (micro-fractures) will, if open, contribute
additional flow paths from the shale matrix to the wellbore.
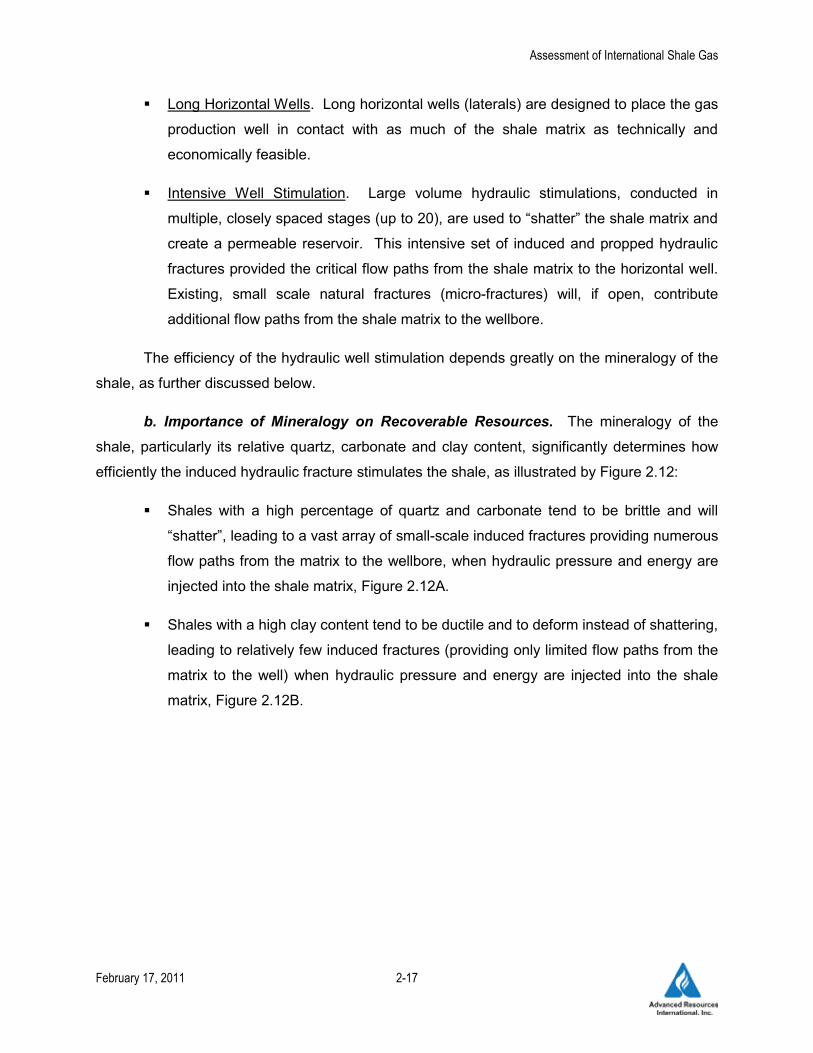
b. Importance of Mineralogy on Recoverable Resources. The mineralogy of the
shale, particularly its relative quartz, carbonate and clay content, significantly determines how
efficiently the induced hydraulic fracture stimulates the shale, as illustrated by Figure 2.12:
� Shales with a high percentage of quartz and carbonate tend to be brittle and will
“shatter”, leading to a vast array of small-scale induced fractures providing numerous
flow paths from the matrix to the wellbore, when hydraulic pressure and energy are
injected into the shale matrix, Figure 2.12A.
� Shales with a high clay content tend to be ductile and to deform instead of shattering,
leading to relatively few induced fractures (providing only limited flow paths from the
matrix to the well) when hydraulic pressure and energy are injected into the shale
matrix, Figure 2.12B.

Assessment of International Shale Gas
February 17, 2011 2-18
Figure 2-12. The Properties of the Reservoir Rock Greatly Influence the Effectiveness of Hydraulic Stimulations.
High clastic content shales are brittle and shatter, providing multiple dentrict fracture swarms. High clay content shales are plastic and absorb energy, providing single-planar fracs.
Source: CSUG, 2008
12A. Quartz-Rich (Brittle) 12B. Clay-Rich (Ductile)
Barnett Shale Cretaceous Shale
JAF028263.PPT
c. Significance of Geologic Complexity. A variety of complex geologic features can
reduce the gas recovery efficiency from a shale gas basin and formation:
� Extensive Fault Systems. Areas with extensive faults can hinder gas recovery by
limiting the productive length of the horizontal well, as illustrated by Figure 2.13.
� Deep Seated Fault System. Vertically extensive faults that cut through organically
rich shale intervals can introduce water into the shale matrix, reducing relative
permeability and gas flow capacity.
� Thrust Faults and Other High Stress Geological Features. Compressional tectonic
features, such as thrust faults and up thrusted fault blocks, are an indication of basin
areas with high lateral reservoir stress, reducing the permeability of the shale matrix
and its gas flow capacity.

Assessment of International Shale Gas
February 17, 2011 2-19
Figure 2-13. 3D Seismic Helps Design Extended vs. Limited Length Lateral Wells
Source: Newfield Exploration Company
640 Acre SectionWell #1 Well #2
Well #1Extended Lateral
Well #2Standard Lateral
1 Mile
1 Mile
Later
al
Later
al
80’ F
ault
260’ Fault
80’ Fault
260’
FaultD
U
D
UD
U
160’
160’
N S
U
D
JAF028263.PPT
SUMMARY
The step-by-step application of the above discussed shale gas resource assessment
methodology leads to three key assessment values for each major shale gas formation:
� Gas In-place Concentration, reported in terms of Bcf per square mile. This key
resource assessment value defines the richness of the shale gas resource and its
relative attractiveness compared to other gas development options.
� Risked Gas In-Place, reported in Tcf for each major shale gas formation.
� Risked Recoverable Gas, reported in Tcf for each major shale gas formation.
The risked gas in-place and recoverable gas provide the two “bottom line” values that
help the reader understand how large is the prospective shale gas resource and what impact
this resource may have on the energy, particularly the natural gas supply, options available in
each region and country.

Assessment of International Shale Gas
February 17, 2011 2-20
Table 2-1, constructed for two major shale gas basins and four shale gas formations,
provide a concise summary of the resource assessment conducted for Central North Africa.
Additional detail is provided in each of the 14 regional shale gas resource assessment reports.
These individual reports also allocate the risked shale gas in-place and recoverable
shale gas resource to the various countries holding the assessed shale gas basins. For
example, the assessment report for Central North Africa further details the shale gas resource
(reported at the basin- and formation-level in Table 2-1) to the three countries holding these
resources - - Algeria, Libya and Tunisia.
Table 2-1: Reservoir Properties and Resources of Central North Africa
Tannezuft Frasnian Sirt-Rachmat EtelSilurian Middle Devonian Upper Cretaceous Upper Cretaceous39,700 12,900 70,800 70,800
Interval 1,000 - 1,800 200 - 500 1,000 - 3,000 200 - 1,000Organically Rich 115 197 2,000 600Net 104 177 200 120Interval 9,000 - 16,500 8,200 - 10,500 9,000 - 11,000 11,000 - 13,000Average 12,900 9,350 10,000 12,000
Overpressured Overpressured Normal Normal5.7% 4.2% 2.8% 3.6%
1.15% 1.15% 1.10% 1.10%Medium Medium Medium/High Medium/High
44 65 61 42520 251 647 443156 75 162 111
Depth (ft)
Reservoir PressureAverage TOC (wt. %)
Thickness (ft)
Basin/Gross Area Ghadames Basin (121,000 mi2) Sirt Basin (177,000 mi2)Shale Formation
Geologic Age
Phys
ical
Ext
ent
Rese
rvoi
r Pr
oper
ties
Prospective Area (mi2)
Thermal Maturity (%Ro)Clay ContentGIP Concentration (Bcf/mi2)Risked GIP (Tcf)
Basi
c D
ata
Reso
urce
Risked Recoverable (Tcf)
REFERENCES
i Acheche, et al., 2001.

World Shale Gas Resources: An Initial Assessment
January 21, 2011 VII-1
VII. WESTERN EUROPE
INTRODUCTION
The gas-bearing shales of Western Europe are being actively explored and evaluated by
a host of small to large companies. Numerous shale gas basins exist in Western Europe,
containing Carboniferous, Permian, Jurassic and Ordovician-age shales, Figure VII-1.
Specifically, shale gas leasing is ongoing in France, Germany, the Netherlands, Sweden,
Denmark and Austria (See Chapters VI and V for discussion of Eastern European and Poland
shale gas).
Figure VII-1. Shale Gas Basins of Western Europe

Wor
ld S
hale
Gas
Res
ourc
es: A
n In
itial
Ass
essm
ent
Janu
ary 2
1, 20
11VI
I-2
We
estim
ate
a ris
ked
gas
in-p
lace
for t
he W
este
rn E
urop
ean
shal
es a
sses
sed
by th
is s
tudy
of 1
,505
Tcf
, of w
hich
372
Tcf
is
estim
ated
to b
e te
chni
cally
reco
vera
ble,
Tab
le V
II-1.
Be
caus
e of
its
larg
e ar
ea, t
he S
cand
inav
ian
Alum
Sha
le h
olds
the
larg
est s
hale
gas
reso
urce
. Sh
ales
of t
he P
aris
Sou
th-E
ast F
ranc
e an
d N
orth
Sea
-Ger
man
bas
ins
exhi
bit f
avor
able
cha
ract
eris
tics,
but
con
tain
com
para
tivel
y m
odes
t res
ourc
e du
e to
thei
r mod
erat
e th
ickn
ess
and/
or li
mite
d ar
ea.
Tabl
e VII-
1. S
hale
Gas R
eser
voir
Prop
ertie
s and
Res
ourc
es o
f Wes
tern
Euro
pe
Fran
ce P
aris
Basin
(61,4
54 m
i²)
Scan
dani
via
Regi
on (3
8,221
mi²)
U.K.
Nor
ther
n Pe
troleu
m
Syste
m (2
2,431
mi²)
U.K.
Sou
ther
n Pe
troleu
m
Syste
m (7
,644 m
i²)
Perm
ian-
Carb
onife
rous
"Ter
res
Noire
s"Li
assic
Sha
lesPo
sidon
ia Sh
aleNa
mur
ian
Shale
Weald
en
Shale
Alum
Sha
leBo
wlan
d Sh
aleLi
assic
Sha
les
Perm
ian
Carb
onife
rous
Uppe
r Jurr
asic
Lowe
r Jurr
asic
Juras
sicCa
rbon
ifero
usCr
etace
ous
Ordo
vician
Carb
onife
rous
Jurra
sic
17,94
216
,900
17,80
02,6
503,9
691,8
1038
,221
9,822
160
Inter
val
164 -
7,21
60 -
1,20
010
0 - 2,
000
25 -
350
249 -
6,93
725
- 32
50 -
459
0 - 4,
000
1,000
- 1,6
40Or
gani
cally
Rich
382
333
525
148
407
112
328
492
415
Net
115
100
158
100
122
7516
414
812
5In
terva
l8,5
28 -
13,12
03,2
80 -
6,560
8,200
- 16
,400
3,280
- 16
,400
8,200
- 16
,400
3,280
- 9,8
40 -
3,280
- 6,3
0011
,500 -
15,50
0Av
erag
e10
,824
4,920
12,30
09,8
4012
,300
6,560
3,280
4,800
13,50
0No
rmal
Norm
alNo
rmal
Norm
alOv
erpr
essu
red
Norm
alNo
rmal
Norm
al No
rmal
4.0%
3.5%
2.5%
5.7%
3.5%
4.5%
10.0%
5.8%
2.4%
1.65%
1.25%
1.45%
1.50%
2.50%
1.25%
1.85%
1.40%
1.15%
Mediu
mLo
wMe
dium
Low/
Mediu
mMe
dium
Mediu
mLo
wMe
dium/
High
Mediu
m47
2757
3354
2677
4845
303
112
305
2664
958
995
276
2876
716
214
719
1
Resource
GIP
Conc
entra
tion
(Bcf/
mi2 )
Risk
ed G
IP (T
cf)Ri
sked
Rec
over
able
(Tcf)
Basic Data
Basin
/Gro
ss A
rea
Geol
ogic
Age
Physical Extent
Pros
pecti
ve A
rea (
mi2 )
Thick
ness
(ft)
Dept
h (ft
)Shale
For
mati
on
Fran
ce S
outh
-Eas
t Bas
in (1
7,800
mi²)
North
Sea
-Ger
man
Bas
in (7
8,126
mi²)
Reservoir Properties
Rese
rvoi
r Pre
ssur
eAv
erag
e TOC
(wt.
%)
Ther
mal
Matu
rity (
%Ro
)Cl
ay C
onten
t

World Shale Gas Resources: An Initial Assessment
January 21, 2011 VII-3
PARIS BASIN
Geologic Charac te riza tion
The Paris Basin is a large 61,454 mi2
The Paris Basin contains two organically rich shale source rocks: the Toarcian “Schistes
Carton” black shale formation and the Permian-Carboniferous shales. The lower thermal
maturity “Schistes Carton” shales are the source rock for most of the oil produced in the Paris
Basin. These shale source rocks have high organic content, ranging from 1% to 10%
throughout the basin. With thermal maturity ranging between 0.5 to 0.9% Ro, the “Schistes
Carton” shales are still in the oil window and immature with respect to shale gas potential. A
number of firms, such as Toreador Resources, are investigating the shale oil potential of the
Liassic interval in the Paris Basin
intracratonic basin underlying most of North-
Central France. The basin is bounded on the east by the Vosques mountain range, on the
south by the Central Massif, on the west by the Armorican Massif and, for the purposes of this
study, by the English Channel on the north.
1
The deeper, more mature Permian-Carboniferous shales are less explored, but have
promising characteristics for shale gas development. These strata were formed by continental
deposits in the rift basins formed after the Hercynian orogeny and subsequent subsidence of the
basin’s granite basement. Based on available data, we have mapped a 17,942 mi
.
2
Res ervoir Propertie s (Pros pec tive Area)
prospective
area for the shales in the Paris Basin, Figure VII-2. The Northern boundary of the prospective
area follows the 50 meter gross shale isopach line, its southern and eastern border is formed by
the basin edge.
Permian-Carboniferous Shales. As shown in Figure VII-3, the Permian-Carboniferous
shales referred to in this report encompass a series of horizons ranging from the Pennsylvanian
(Carboniferous) to late Permian. Detailed geologic data on these shale formations is scarce.
Where information was lacking, we used data from regional analogue basins.
The Permian-Carboniferous shales range from 8,500 feet to 13,100 feet deep, averaging
10,824 feet deep over the prospective area. The shales thicken to the east, ranging from 160
feet thick in the central Paris Basin to over 7,200 feet in isolated sections of the basin’s eastern
margin, Figure VII-4. Average shale interval thickness in the prospective area is assumed to be

World Shale Gas Resources: An Initial Assessment
January 21, 2011 VII-4
1,150 feet. Due to a lack of well log or other net shale thickness data, we assume one-third of
the formation interval is organically rich, and apply a 30% net to gross factor, consistent with
similar age shales in Poland, to reach an organically rich net shale thickness of 115 feet. Data
on total organic content (TOC) in the prospective area was not available, so TOC data from the
Dniper-Donets Basin, an analogue of similar age and depositional environment was used.
Assumed TOC values range from 2% to 6% with an average of 4%. The Permian-
Carboniferous shales are in the gas window, with Ro ranging from 1.3% to over 2% across the
prospective area2
Figure VII-2. Prospective Area and Gross Isopach of Permian Carboniferous Shales, Paris Basin
.
Res ources
Our analysis suggests the Permian-Carboniferous shales of the Paris Basin contain a
moderate resource concentration of 47 Bcf/mi2. Risked gas in-place for the Paris Basin is 303
Tcf, The risked technically recoverable shale gas resource is estimated at 76 Tcf, Table VII-1.

World Shale Gas Resources: An Initial Assessment
January 21, 2011 VII-5
Figure VII-3. East Paris Basin Stratigraphic Column
Figure VII-4. Paris Basin Cross Section:
Permo-Carboniferous Shales

World Shale Gas Resources: An Initial Assessment
January 21, 2011 VII-6
Ac tivity
While most of the exploration activity in the Paris Basin is targeting the Liassic-age liquid
shale oil plays in the center of the basin, some firms are beginning to acquire acreage in the
eastern portions of the basin, where the Permian-Carboniferous shale gas formation is thickest.
The Moselle Permit (~$4 million dollars; 2,070 mi2), first granted to East Paris Petroleum
Development Corp, was acquired by Elixir Petroleum in February, Figure VII-5. While the terms
of the lease do not require the company to drill any wells, Elixr has publically stated that it
intends to investigate the unconventional gas potential (both CBM and shale gas) on its lease3
Figure VII-5. Moselle Permit, Paris Basin
.
World Shale Gas Resources: An Initial Assessment
January 21, 2011 VII-7
SOUTHEAST BASIN
Geologic Charac te riza tion
The Southeast Basin is the thickest sedimentary basin in France, containing up to 10km
of Mesozoic to Cenozoic sediments. The basin is bounded on the east and south by the Alpine
thrust belt and on the west by the Massif Central, an uplifted section of the Paleozoic basement,
Figure VII-6.
Local oil and gas seeps discovered in the 1940’s encouraged hydrocarbon exploration
early in the basin. However, despite the drilling of 150 wells in the onshore and offshore
portions of the basin, no significant oil and gas deposits have been found. Recent re-
evaluations of the basin’s potential by the French research institute IFP and others have peaked
interest once again. The deep Jurassic shales and marls present over much of the basin area
appear to have favorable characteristics for oil and gas source rocks. Some limited leasing is
ongoing to test this potential.
This study will focus on the shale gas potential of two formations in the Southeast Basin,
the Upper Jurassic “Terres Niores” black shales, and the Lower Jurassic Liassic black shales.
These shales are composed of Type II marine organic matter, and were deposited during a time
of subsidence and rifting, when the “Liguro-Piemontais” ocean covered portions of what is now
southern France4. These formations have been evaluated and mapped to establish their
respective prospective areas. The Lower Jurassic shale sequence is prospective throughout
the basin, while well data suggests the Upper Jurassic shales enter the oil window on their
western boundary. ARI calculates a 16,900 mi2 prospective area for the Upper Jurassic shale
sequence5
Res ervoir Propertie s (Pros pec tive Area)
.
Upper Jurassic “Terres Niores”. The “Terres Niores” black shales are marine shales
deposited throughout the Southeast Basin. They range from 3,300 feet to 6,600 feet deep over
the basin, averaging 4,900 feet, Figure VII-7. The gross interval of the shale reaches 1,200
feet, containing 333 feet of organically rich gross shale and 100 feet of net shale4, Figure VII-8.
Total organic content (TOC) in the prospective area ranges from 1% to 3% with an average of
2%. In the eastern portions of the basin, the “Terres Niores” shale is in the gas window, with Ro
of 1.5%. At the western edges, the shale enters the wet gas/oil window, with Ro of 1%.
Average vitrinite reflectance (Ro) over the prospective area is 1.25% Ro5.

World Shale Gas Resources: An Initial Assessment
January 21, 2011 VII-8
Lower Jurassic Liassic Shale. The Liassic Shale of the Southeast Basin is deeper,
thicker and generally more mature than the “Terres Niores” Shale, though it has a higher clay
content and is not as brittle. Uplifting along the western margin of the Southeast Basin has
brought the Liassic Shale to a more reasonable depth for exploration. Depth to the Liassic
Shale package ranges from 3,300 feet to 16,300 feet deep over the basin, with most of the
prospective area at an average depth of 9,800 feet. Figure VII-8. The gross interval of the
shale ranges from 100 to 2,000 feet with 525 feet of organically rich and 160 feet of net shale.
Total organic content (TOC) in the prospective area ranges from 1% to 6% with an average of
3.5%. Thermal maturity in the Liassic Shale increases with depth, ranging from 1.2% Ro in the
more shallow western areas to over 1.7% Ro in the deep eastern area. Average vitrinite
reflectance (Ro) over the prospective area is 1.45%.
Figure VII-6. Southeast Basin Prospective Area and Upper Jurassic Shale Isopach

World Shale Gas Resources: An Initial Assessment
January 21, 2011 VII-9
Figure VII-7. Southeast Basin Stratigraphic Column Figure VII-8. Generalized Southeast Basin Cross Section

World Shale Gas Resources: An Initial Assessment
January 21, 2011 VII-10
Res ources
Our analysis suggests the Upper Jurassic “Terres Niores” Shale of the Southeast Basin
contains a relatively low resource concentration of 27 Bcf/mi2
The Upper Liassic Shale contains a slightly higher, though still moderate, resource
concentration than the “Terres Niores” shales, averaging 57 Bcf/mi
, Table VII-1. Low average TOC
content and relatively thin net shale thickness are the main determinants of this low resource
concentration. Isolated areas throughout the basin with higher shale thickness or more organic
richness would contain higher gas in-place. The risked gas in-place for the “Terres Niores”
Shale is 112 Tcf, of which we estimate 28 Tcf will be technically recoverable.
2
Ac tivity
, Table VII-1. Risked shale
gas in-place over the prospective area is 305 Tcf, of which 76 Tcf is technically recoverable.
A number of firms are beginning to explore the shale gas potential of the Southeast
Basin; the initial permit award deadline was delayed due to the large numbers of applications.
In March of this year, the French Ministry of Energy and the Environment awarded several
exploration permits, worth over $115 million and covering over 4,000 mi2
� The Navacelle permit (~ $5 Million dollars; 84 mi
(~22% of the
prospective area), to companies interested in investing in the drilling and exploration of shale
formations in Southeast France. Where information was available, the leases are shown on
Figure VII-9.
2
� The Plaine d’Ales permit (~$2 million dollars; 194 mi
) was awarded to Egdon
resources (later acquired by eCORP), Eagle Energy and YCI Energy to allow for
seismic surveys and an exploration well over the next 5 years.
2
� The Montelimar permit (~$51 million dollars; 1,670 mi
) was awarded to Bridgeoil
Ltd and Diamoco Energy to perform seismic reprocessing and drill a new
exploration well or reenter a 1949 well with heavy crude shows.
2) was awarded to Total
E&P and Devon energy (Devon’s stake was subsequently bought by Total) to
perform geological and geochemical studies and, if warranted, exploratory drilling
over 5 years.

World Shale Gas Resources: An Initial Assessment
January 21, 2011 VII-11
� The Villeneuve-de-Berg permit (~$54 million dollars; 360 mi2
� The Nant permit (~$2.3 million dollars; 1,701 mi
) was awarded to
Schuepbach Energy LLC, Dallas, Dale Gas Partners LP of Texas, and Franco-
Belgian GDF Suez. The companies agreed to perform 19 miles of new seismic
surveys and drill two wells, one of which would hydraulically fracture the target
shale formation, over the next 3 years.
2
� The Bassin d’Ales permit (~$1.4 million dollars) was awarded to Mouvoil SA to
perform seismic studies and drill an exploration well.
) was awarded to these same
companies, on which they will also perform 19 miles of seismic surveys and drill
a shallow exploration well over the next 3 years.
Figure VII-9. Southeast Basin Leasing Map (Selected)