world insurance: the great pivot east continuesb8010432-3697-4a97-ad8b...swiss re institute sigma no...
TRANSCRIPT
No 3 2019
01 Executive summary03 Macroeconomic
environment for insurers
08 Trends in the global insurance markets
21 Regional review 2018 and outlook
32 Methodology and data34 Statistical appendix
World insurance the great pivot east continues
Swiss Re Institute sigma No 32019 1
Executive summary
Global economic growth supported the insurance sector in 2018 with real gross domestic product (GDP)1 up 32 We forecast that global growth will weaken to around 28 in 2020 as advanced markets and China slow while emerging economies strengthen China contributed the most to global growth last year and we expect this to hold true in 2019 and 2020 The still positive but slowing global economic environment and likewise wage and employment growth in advanced markets will continue to spur insurance demand in the next two years A slowdown in trade however will hurt associated lines of business
Over the longer term we expect the emerging markets to build up an ever-increasing share of global direct insurance premiums written rising from an estimated 21 in 2018 to 34 in 2029 This will come as emerging market premiums continue to grow at a faster pace than GDP Given their size however the advanced markets will still contribute close to half of additional premium volumes over the next decade in spite of registering lower growth rates As the pivot east continues we forecast that Asia-Pacific which includes China other emerging and also advanced markets in the region will account for 42 of global insurance premiums by 2029
Global direct premiums surpassed the USD 5 trillion mark for the first time ever in 2018 reaching USD 5 193 billion (61 of global GDP) Total premiums expanded in both nominal and real terms2 but overall growth was slower than in 2017 due to weakness in the life sector The latter was due to shrinking markets in Europe China and Latin America Non-life insurance premium growth was steady at 3 outpacing the historic average as advanced markets slowed and emerging markets improved
The future looks promising We forecast stronger growth in global life premiums in 201920 at a rate well above the annual average of the last 10 years This will be mostly driven by emerging markets in particular a bounce back in China In the advanced markets life premiums will grow slowly but also faster than the historical average The US and Canada will outperform other advanced markets in premium growth rate terms By line of business traditional savings business will remain unattractive for consumers particularly in advanced markets due to low interest rates While mortality protection gaps present significant growth opportunities mortality risk provide much smaller premium volumes than do savings policies
1 We use market exchange rates to aggregate global GDP growth rates Statistics using purchasing-power parity place more weight on emerging countries and thus show higher world GDP growth rates
2 All growth figures quoted in this study are in real terms ie adjusted for local consumer price inflation
The global economy will slow but we expect insurance demand to hold up over the next two years
The emerging markets are building an increasing share of global premiums Asia-Pacific will count for 42 of global premiums by 2029
Global premiums surpassed the USD 5 trillion mark in 2018 for the first time ever
Table 1 Real premium growth in 2018E vs average 2008‒17 and outlook (click to drill down into underlying data on sigma-explorer)
E = Estimate F = ForecastSource Swiss Re Institute
Life Non-life Total
Markets 2018E 2008‒2017 2019‒2020F 2018E 2008‒2017 2019‒2020F 2018E 2008‒2017 2019‒2020F
Advanced 08 ‒07 12 19 11 18 13 01 15
Emerging ‒20 81 87 71 77 70 21 79 79
World 02 06 29 30 22 30 15 12 29
China will be the main driver of life sector growth in 201920 With low interest rates traditional saving business will continue to struggle
2 Swiss Re Institute sigma No 32019
Executive summary
In non-life global premiums will likewise grow faster than the historical average Advanced markets will outpace the average with premium growth tracking overall economic growth led by the US Canada and advanced Asia-Pacific while advanced EMEA (Europe Middle East Africa) continues to lag Growth in the emerging markets will remain robust but undershoot the 10-year average given moderation in China and other emerging Asian markets Premium growth in other emerging markets however will improve considerably Motor is the dominant line of business in non-life accounting for a third of global sector premiums in 2018 We believe this key source of premiums will come under mounting pressure over the longer term with increased application of advanced driver-assistance systems and the transition to self-driving cars The transition will be long-running and difficult to predict but we think the technological innovations will over time likely lead to lower claims and hence also lower premium rates and volumes in motor insurance
Insurers will continue to operate in a low interest rate environment for the next two years at least meaning that industry profitability will remain under pressure In life low interest rates continue to depress profitability especially in Europe and advanced Asia-Pacific In non-life return on equity (ROE) remained roughly stable at 6‒65 in 2018 Technical results have turned slightly positive as the improvement in underwriting conditions that began at the end of 2017 carried on into 2018 However stabilisation of the soft market trend has not been sufficient to notably narrow the profitability gap that still besets the non-life insurance sector
This sigma study contains the latest market data available at the time of going to press The final figures for 2018 are not available for most insurance markets As such the sigma also contains Swiss Re Institute estimates and provisional data released by supervisory authorities and insurance associations
Non-life growth will be broad based Longer term innovation will likely reduce claims and premium volumes in motor a staple of the sector
Low interest rates continue to weigh on insurance industry profitability results in non-life underwriting have improved slightly
The data in this study are the latest available at the time of going to press
Figure 1 Total real premium growth 2018E (click chart to open in sigma explorer)
Source Swiss Re Institute
No data lt ndash100 ndash100 to ndash50 ndash50 to ndash25 ndash25 to 00 00 to 25 25 to 50 50 to 100 gt 100
Swiss Re Institute sigma No 32019 3
Macroeconomic environment for insurers
Global economic growth and inflation outlookWe forecast that global economic growth will slow to 28 in 2020 after remaining broadly steady in 2018 (32 after 33 in 2017) China contributed the most (1 percentage point (ppt)) to global growth last year and we forecast that it will continue to contribute a third of global growth in spite of a gradual slowdown in the economy to 61 in 2020 This contribution is a steep increase from only 05 ppt per year on average in the decade before the financial crisis In the US growth will slow to 16 in 2020 as the effects of fiscal stimulus fade Lower taxes and higher public spending boosted the US economy last year
Economic activity in Europe slowed in 2018 (GDP down 07 ppt to 18) and likewise in Japan (down 11 ppt to 08) We expect that headwinds from a slowdown in global trade will weigh on the manufacturing sector in Europe in 2019 with overall GDP growth at 11 in the euro area That said many countries in the region will have the loosest budgets in a decade which should offset some of the slowdown impetus In the UK Brexit uncertainty will continue to limit investment activity and growth (forecast at 13) In Japan a large fiscal stimulus package should support activity temporarily with growth slowing thereafter to 05 in 2020
In China a weakening in global demand and the trade dispute with the US will weigh on exports in 201920 GDP growth was 03 ppt lower at 66 in 2018 but fiscal stimulus and looser monetary policy should cushion the slowdown Excluding China we expect stable GDP growth in the emerging markets over the coming years with the economies in Latin America (mainly Brazil) and Africa strengthening slightly and growth in emerging Europe slowing to trend
The global economic environment remained conducive for insurers in 2018 with GDP growth only marginally weaker than the year before We forecast that global growth will weaken to around 28 in 2020 as advanced markets slow and growth among emerging markets improves Still solid employment and wage growth in advanced markets will continue to benefit insurance demand while the slowdown in trade will hurt associated lines of business Insurers will continue to operate in a low interest rate environment for the next two years at least
We expect global growth to weaken to 28 over the next two years
hellipwith a slowdown in the advanced marketshellip
hellipand also in China although fiscal and monetary policy will cushion the slowdown there
Figure 2 Real GDP growth by region
Monthly updated economic outlooks for key markets are available on the Swiss Re Institute websiteSource Swiss Re Institute
Outlook annual average growth 2019ndash2020FAnnual average growth rate 2008ndash2017 Growth rate 2018E
MiddleEast and
Africa
Europe andCentral Asia
LatinAmerica
Asiaexcl China
ChinaExcl ChinaAllAsia-Pacific
EMEAUS andCanada
AllAll
Advanced markets Emerging marketsWorld
0
1
2
3
4
5
6
7
8
4 Swiss Re Institute sigma No 32019
Macroeconomic environment for insurers
Weaker trade was a key driver of slowing growth momentum across the world in 2018 Analysis by the Institute for International Finance (IIF) suggests that the tariffs imposed by the US and China in the second half of the year played a significant role and will continue to weigh on global trade volumes given a recent flare-up of US-Sino tensions3 Structurally trade has been a primary growth engine for emerging economies for a long time We believe that maturation of global manufacturing value chains is a main reason behind slowing trade4 The decline in global trade will dampen insurance premium growth particularly for marine and trade credit However the rise of services trade and digitisation provides opportunity for insurers to cover new risks such as intangible earnings risks on companiesrsquo balance sheets
Another macroeconomic development with important implications for insurance markets is the spectre of slowing employment growth over the next two years Labour markets among advanced markets held up well in 2018 and we expect employment growth to continue in 201920 but at a slower pace This is in line with a forecast slowdown in economic activity this and next year In the US non-farm payrolls increased by 223 000 per month on average in 2018 and slowed to a still healthy 180 000 per month in the first quarter of 2019 In the euro area employment grew by 15 or 23 million persons in 2018 comparable to the previous year While there is spare capacity in the labour market in the euro area some member states like Germany are already experiencing shortages which is limiting further job creation In the UK despite Brexit uncertainty the labour market remained healthy last year with notably slower but still positive employment growth Strong labour markets support demand for group life covers but this positive impetus will moderate in line with our expectation of slower employment growth over the next two years Among emerging regions the trends are more divergent In China last year nationwide employment contracted for the first time in 30 years but in urban areas it continued to grow solidly (24) Labour markets in the EU member states of emerging Europe are relatively tight but there is slack in other regions such as Latin America the Middle East and Africa and in some emerging Asian countries
Inflation and wage development are important drivers of claims development particularly in long-tail insurance business such as casualty Tightness in the US labour market has led to mounting upward pressure on wages but this has yet to translate into consumer price inflation US average hourly earnings were up 34 year-on-year (yy) in February the highest increase in almost 10 years Yet the core PCE deflator the Fedrsquos preferred measure of inflation slowed to 13 yy in the first quarter of 2019 Inflationary pressures remain moderate in the euro area Wage inflation did increase in a number of member states in 2018 but there is more labour market slack in Europe than in the US Core inflation has been steady at around 1 over the past few years and given the moderate growth outlook we expect it to move up at a very slow pace only Inflation in the UK was pushed up by sterling weakness in 2018 but that impact will fade this year and we expect inflation to be near the Bank of Englandrsquos (BoE) target rate of 2
Among emerging markets inflation remains largely in check with the exception of countries mired in domestic crises (eg Argentina Venezuela Turkey Nigeria or Egypt to name a few) Elsewhere the absence of inflationary pressure could create manoeuvring space for central banks to lower interest rates later in the year Key to watch for oil importers will be the impact of rising oil prices The subdued inflation outlook should exert only limited pressure on claims inflation over 201920 Yet a pickup in nominal wages may prove to be more important as claims are likely to rise on the back of higher pay-outs on casualty lines of business or on disability covers On the positive side life insurersrsquo premium growth should be boosted by higher wages particularly in the group life segment
3 Economic Views ndash Are Tariffs on China working Institute of International Finance 5 February 2019 4 Economic Insights Slowdown in emerging market trade a supply-chain perspective Swiss Re Institute
February 2019
Tensions between the US and China will continue to weigh on global trade
Labour markets held up well in 2018 Further out slowing jobs growth will likely reduce demand for group life cover
A subdued inflation outlookhellip
hellipwill like exert only limited pressure on claims inflation
Swiss Re Institute sigma No 32019 5
Interest rates and risky assetsThe global insurance industry will continue to operate in a low interest rate environment for the next two years at least A precautionary rate cut by the US Federal Reserve (Fed) is likely Other central banks are also shifting to easing mode amid elevated uncertainty around the trade conflict and slowing growth In Europe given the moderate growth and inflation outlook we expect the European Central Banks (ECB) deposit rate to remain in negative territory through 2021 The new ldquotargeted longer-term refinancing operationsrdquo (TLTRO-III) announced in June 2019 will help prevent unwarranted tightening in financial conditions Meanwhile the BoE is likely to remain on hold in 2019 and 2020 given ongoing uncertainty around Brexit and associated negative impact on growth February 2019 marked the 20th anniversary of Japanrsquos zero interest rate policy and there is currently no end in sight With inflation remaining very low and growth risks skewed to the downside we do not expect the Bank of Japan (BoJ) to shift to a tighter monetary policy stance anytime soon And in China the central bank is likely to continue to ease monetary policy to cushion the adverse impact from slower trade
In our baseline scenario we expect long-term bond yields to increase only modestly over the coming few years Yields in the US are around 100 basis points (bp) off their late-2018 peak and with the end of the hiking cycle are unlikely to return to those levels in the next years In Germany and Japan yields remain close to zero with little upside momentum UK yields will likely pick up slightly in 201920
The main central banks turned dovish in 2019
We expect long-term bond yields to remain very low
Figure 3 Long-term government bond yields data and forecasts (end of period)
Source Swiss Re Institute
ndash1
0
1
2
3
4
5
JP
GB
DE
US
UKJapanGermanyUS
200
8
200
9
2010
2011
2012
2013
2014
2015
2016
2017
2018
2019
2020
F
6 Swiss Re Institute sigma No 32019
Macroeconomic environment for insurers
On aggregate total central bank asset purchases turned slightly negative in the first half of 2019 after years of expansion5 The Fed has been shrinking its balance sheet since the start of 2018 and the ECB halted its purchases at the end of last year The BoJ and Peoplersquos Bank of China (PBoC) will continue to expand their balance sheets but not enough to offset the reduction by the Fed However when the Fed halts its balance sheet run-down as of October this year we expect central bank asset purchases to turn marginally positive again In our view central banks such as the Fed stand ready to act should economic and financial conditions deteriorate significantly This ldquocentral bank put optionrdquo is likely to remain in place and should continue to support risky assets albeit less effectively than in the past
Key risks to the outlookThe biggest threat to the global economy is a sharp re-escalation of trade tensions underlined by the recent flare up of the US-Sino trade dispute involving a new round of tariffs While trade negotiations may potentially lead to a resolution of the conflict later this year medium- and long-term concerns such as technology transfer and intellectual property rights will prevail Escalation to a global trade war (probability 30 increasing) for example through new US auto tariffs against the EU is another risk Moreover concerns that the US Congress will stall on ratification of the US-Canada-Mexico agreement this year persist
An abrupt hard landing in China is another risk with global ramifications A sharp slowdown in Chinese growth would be highly disruptive for the global economy For instance in a scenario where Chinarsquos GDP growth decelerates to 3 global growth could be slowed by 2 ppt6
Beyond the risk of a disorderly Brexit longer-term concerns about the stability of the EU and the monetary union remain In addition to the north-south rifts on fiscal grounds fault lines have opened up between east and west particularly on the issue of migration The currently increasing power of populist and nationalist parties is likely to make it more difficult to reach compromises in the future which could turn out to be a destabilising force in the long run
Further out inflationary overheating remains a possibility notably in the US although the risk should abate with slowing growth For now the US labour market is strong and wages are rising keeping inflationary risks up Should prices rise faster the Fed may need to tighten policy unexpectedly There could be a boom-and-bust cycle with a period of stronger growth and high inflation followed by sharp slowdownrecession US overheating risks could spread with a spike in bond yields and a stronger US dollar the catalysts for contagion globally Monetary policy errors elsewhere could also have severe consequences for growth and financial markets
5 The 6-month rolling central bank asset purchases averaged about negative USD 80 billion a month in the first half of 2019 We expect this monthly average to be roughly USD 40 billion a month for the fourth quarter of 2019 The central banks in our analysis include the Fed ECB BoE BoJ and PBoC
6 If the Crosscurrents Strengthen How far Could Global Growth Fall Deutsche Bank 6 February 2019
The ˝central bank put option˝ will continue to support risky assets
We see some upside from supportive fiscal policies and a potential de-escalation of trade conflicts but overall risks are skewed to the downside
A hard landing in China would have serious global ramifications 15 probability increasing
The stability of the EU remains a longer-term concern 15 probability constant
An inflation spike in the US remains a risk 15 probability constant
Swiss Re Institute sigma No 32019 7
Figure 4 Global Risk Monitor (click on chart to access latest economic and financial risk insights)
Source Swiss Re Institute
Trade war
Inflation risksCentral bankpolicy error
Destabilisationof the EUEuro areaEmerging
marketcontagion
China hardlanding
Upside Risk
Sharp GlobalGrowth Slowdown
Higher
Lower HigherImpact on global economic growth
Like
lihoo
d of
eve
nt
8emsp Swiss Re InstituteemspsigmaemspNoemsp32019
Trends in the global insurance markets
SizeemspofemspglobalemspinsuranceemspmarketsemspandemspgrowthemsptrendsInemsp2018emsptotalemsppremiumsemspwrittenemspinemsptheemspglobalemspprimaryemspinsuranceemspmarketsemspsurpassedemsptheemspUSDemsp5emsptrillionemspmarkemsp(USDemsp5emsp193emspbillion)emspforemsptheemspfirstemsptimeemspeveremspequivalentemsptoemsparoundemsp6emspofemspglobalemspGDPemspPremiumsemspexpandedemspbothemspinemspnominalemspUSDemsp(48)emspandemsprealemsp(15)emsptermsemspGrowthemspwasemspsloweremspthanemspinemsp2017emspdueemsptoemspweaknessemspinemsptheemsplifeemspsectoremspparticularlyemspinemspChina7emspWeemspexpectemspanemspimprovementemspinemsplifeemspinemsp201920emspbasedemsponemsprecoveryemspthereemspGrowthemspinemspnon-lifeemspwasemspstableemspinemsp2018emspandemspthisemspshouldemspcontinue
Long-term growth trends the great pivot east TheemspshiftemspinemspglobalemspinsuranceemsptoemspAsiaemspremainsemspongoingemspFigureemsp5emspdepictsemsppremiumemspgrowthemspsmoothedemspusingemsp7-yearemspaveragesemsprevealingemspthatemsptheemsptrendsemspofemsppreviousemspyearsemspcontinueemsptoemspimpactemsptheemspglobalemspinsuranceemspindustryemsptodayemsp(1)emspinemspadvancedemspmarketsemspnon-lifeemsppremiumemspgrowthemspcontinuesemsptoemspcloselyemsptrackemsptheemspmacroeconomicemspgrowthemsptrajectoryemspLifeemspsectoremsppremiumemspgrowthemspmeanwhileemsplagsemspInterestemspratesemspwillemspremainemsplowemspforemsptheemspforeseeableemspfutureemspmeaningemsptraditionalemsplifeemspsavingsemspproductsemspwithemspguaranteedemspinterestemspratesemspwillemspremainemspunattractiveemspunderemspcurrentemspregulatoryemspsettingsemspThisemspcanemsphoweveremspchangeemspwhenemspinterestemspratesemspbeginemsptoemspriseemspregulationemspisemspadaptedemspandemspinsurersemspintroduceemspinnovativeemspsavingsemspproductsemspthatemsphaveemspgreateremspappealemsptoemspcustomersemsp(2)emspinemsptheemspemergingemspmarketsemspinsuranceemsppremiumsemspcontinueemsptoemspoutperformemspeconomicemspgrowthemspoverallemspevenemspthoughemspsomeemspmarketsemspinemspLatinemspAmericaemspAfricaemspandemspChinarsquosemsplifeemspsectoremspinemspparticularemspfacedemspsignificantemspheadwindsemspinemsp2018emsp(seeemspregionalemspsectionsemspforemspmoreemspbackground)
7emsp Revisedemspfiguresemspforemsp2017emspshowemspthatemspgrowthemspwasemspstrongeremspthanemspestimatedemspinemsplastemspyearrsquosemspsigmaemspTheemspmainemspreasonsemspforemsptheemsprevisionsemspwereemspaemsplessemspsevereemspdeclineemspinemsptheemspUSemspandemspaemspsurgeemspinemsptheemspUKemspdrivenemspbyemsplargeemspone-offemsptransactions
Global insurance premiums written reached USD 52 trillion in 2018 Life premium growth was weak but there was solid performance in non-life We forecast around 3 growth in global premiums this year and next with a recovery in life based on a strong rebound in China and ongoing steady performance in non-life Premiums in emerging markets will outperform GDP and their share of the global total will increase from 21 in 2018 to 34 in 2029 As the shift from west to east continues we forecast that the Asia-Pacific region as a whole will count for 42 of global premiums by 2029 Profitability remains under pressure in both the life and non-life sectors Due to low interest rates traditional life savings business will continue to drag on sector growth
Inemsp2018emspglobalemspinsuranceemsppremiumsemspexceededemsptheemspUSDemsp5emsptrillionemspmarkemspforemsptheemspfirstemsptimeemspever
Emergingemspmarketemsppremiumemspgrowthemspwillemspcontinueemsptoemspourperformemsptheemspadvanced
Figure 5 Life and non-life premium growth vs GDP growth in real terms (7 year moving average)
SourceemspSwissemspReemspInstitute
ndash25
00
25
50
75
100
125
150
Life
Advanced markets Emerging markets
Non-life Real GDP Life Non-life Real GDP
ndash25
00
25
50
75
100
125
15020
20F
2018
E
2016
2014
2012
2010
200
8
200
6
200
4
200
2
200
0
199
8
199
6
199
4
1992
199
0
2020
F
2018
E
2016
2014
2012
2010
200
8
200
6
200
4
200
2
200
0
199
8
199
6
199
4
1992
199
0
Swiss Re Institute sigma No 32019 9
We believe that life premium growth in China will rebound this year and next (average growth of around 11 during 201920) and that the non-life market will slow alongside moderation in economy growth (+9 during 201920 down from +12 in 2018) However premium growth in both life and non-life will significantly outpace the overall economy and insurance penetration will continue to increase Recovery in other emerging economies in Latin America the Middle East and Africa will strengthen the respective insurance markets At the same time among the advanced markets the decline of traditional savings business will limit growth in life insurance and the moderating economic environment will cap both life and non-life sector growth This will reinforce the ongoing overall shift from advanced to emerging insurance markets particularly in Asia
Figure 6 visualises the great pivot east Chinarsquos share of the global insurance market went from 0 in 1980 to 11 in 2018 and is forecast to reach 20 in 10 yearsrsquo time almost as high as the share projected for the whole of advanced EMEA We forecast that the insurance markets in all of Asia-Pacific will count for 42 of the global premiums by 2029 China consolidated its position as the second largest insurance market globally in 2018 with total premiums written of USD 575 billion in 2018 Currently the Chinese market is still less than 40 the size of the US market (USD 1 469 billion) and is also smaller than the three largest market in Europe combined (the UK Germany France USD 836 billion) These gaps only serve to demonstrate the catch-up potential which we expect China will fill very rapidly According to our forecasts the Chinese insurance market will be bigger than the three named market by 2022 and it is on track to surpass the US as the largest insurance market in the world by the mid-2030s
China will continue to be the key driver of the pivot in global insurance markets to the east
We forecast that China will account for 20 of global insurance premiums by 2029 and be the largest market by the mid-2030s
Figure 6 Market shares for total direct premiums written by main markets and by region 1980‒2029F
Source Swiss Re Institute
Global market share
1980 2018E 2029F
1 US 42 28 25
2 China 00 11 20
3 Japan 16 85 71
4 UK 74 65 47
5 France 55 50 35
6 Germany 86 47 35
7 South Korea 04 19 33
8 Italy 03 34 32
9 Canada 18 33 27
10 Taiwan 27 25 24 0
20
40
60
80
100
Other emerging marketsEmerging Asia excl ChinaAdvanced Asia-Pacific
ChinaAdvanced EMEAUS and Canada
2029F2018E1980
44
33
18
31
30
11
18
37
28
22
20
16
681 4
10 Swiss Re Institute sigma No 32019
Trends in the global insurance markets
Further we expect the insurance market in China to grow faster than those in other emerging markets China already accounts for more than 50 of total emerging market premiums and the share will increase The other markets in emerging Asia will also grow as GDP per capita continues to increase rapidly fuelling insurance demand Its number of large markets makes emerging Asia attractive access to only a handful of markets offers exposure to most of the region Herfindahl indices8 show that the concentration on a few large markets is high in emerging Asia The share of the three largest markets in emerging Asia is 93 substantially higher than in other emerging regions Also there are less small markets in emerging Asia than elsewhere This composition facilitates international expansion with fewer regulatory frameworks to adapt to In contrast for example while Africa is also concentrated on Herfindahl index basis this due to South Africa having a 71 market share The remainder of the region is spread over 53 relatively small markets
Life and non-life sub-lines of business split in 2018In this sigma allocation of lines of business is harmonised to facilitate comparability across regions This means that accident amp health business is allocated to non-life insurance independent of whether it is written by life non-life or composite insurers (see Methodology section) With this allocation practice in non-life insurance motor and accident amp health business each contributed about a third to global premiums in 2018 The next biggest contribution came from property (see Figure 7) Among emerging markets the share of motor insurance is significantly higher (~44 of non-life) Property and liability are also large segments while specialty lines are much smaller The ldquoOthersrdquo category is large as the national statistics from both advanced and emerging markets often do not detail premiums in a way that allows allocation to a specific category
In life we show a split into savings premiums vs risk premiums (ie biometic risk9) Risk premiums exclude accident amp health (which we allocate to non-life in this sigma) With this split as Figure 7 shows about 88 of global life insurance premiums were related to savings type business in 2018 Only a small part came from biometric risk covers (USD 330 billion)
8 Herfindahl indices measure to what extent a market is dominated by large companies We apply them here to different regions and the countries within each region The normalised Herfindahl index ranges between 0 (all market of equal size) to 1 (complete concentration in one market)
9 The term ldquobiometric riskrdquo covers all exposures related to human life conditions
The emerging Asia region as a whole is an attractive growth proposition
Table 2 Concentration measures by region for total insurance premiums 2018E
Source Swiss Re Institute
Herfindahl Market share of the top countries
No of countries index normalised Top 3 Top 5 Top 10
Emerging Asia 20 060 058 93 98 100Africa 54 051 050 80 84 91Latin America 39 025 023 70 83 93Emerging Middle East 14 019 013 72 85 99Emerging Europe and Central Asia 29 016 013 63 77 91Advanced EMEA 26 012 009 54 70 88
Motor is the largest line of business in non-life more so in emerging markets
We split life business into savings and (biometric) risks
Swiss Re Institute sigma No 32019 11
With the existing main lines of business in the non-life (motor) and life (savings) sectors the insurance sector overall faces two key vulnerabilities
On the non-life side innovation in advanced driver-assistance systems (ADAS) and a transition to self-driving cars over the next decades have the potential to reduce motor premiums should new technologies reduce frequency and severity of accidents and hence claims costs
On the life side due to low interest rates and the move to risk-based solvency frameworks the dominant savings business is under pressure particularly traditional life savings products with fixed guarantees For example in advanced Europe life insurance premiums have declined by 11 annually over the past 10 years We expect aging populations and a cut in public pensions will fuel demand for private-sector old age provision such as provided through life insurers but life insurers will need to innovate to offer attractive products to satisfy this demand In many markets life insurers are currently focusing more on mortality products but the potential premium volume of this segment will not substitute the volumes provided by savings business Closing the mortality protection gap can help to compensate the downturn of traditional savings business However Swiss Re Institute estimates that the premium potential of this segment is around USD 270 billion only slightly more than 10 of total savings business in 201810
10 See sigma 52018 Global economic and insurance outlook 2020 Swiss Re Institute
This breakdown exposes two key vulnerabilities for insurance
A permanent reduction in motor premiums from motor andhellip
hellipshortfall in the life sector as low interest rates and regulation continue to undermine sales of savings-type products
Figure 7 Line business split in global life and non-life premiums (in USD billions and ) 2018E
Includes workers compensation medical insurance and accident amp health written by life insurersSource Swiss Re Institute
Non-life insurance premiums USD 2 373 billionLife insurance premiums USD 2 820 billion
Other 142 6Engineering 23 1Credit 25 1Agriculture 34 1Marine 34 1Liability 180 8Property 400 17
Risk business 330 12 Accident amp 760 32Health
Motor 775 33Saving business 2 490 88
12emsp Swiss Re InstituteemspsigmaemspNoemsp32019
Trends in the global insurance markets
Size and regional structure of the global reinsurance marketsSwissemspReemspInstituteemspestimatesemspthatemspprimaryemspinsurersemspcededemspaboutemspUSDemsp260emspbillionemsporemsp5emspofemspdirectemsppremiumsemspwrittenemspinemsp2018emsptoemsptheemspglobalemspreinsuranceemspmarketsemspTheemspcessionemspratesemsp(cededemsppremiumsemspemspdirectemsppremiums)emspwereemsphigheremspinemspnon-lifeemsp(84emspUSDemsp200emspbillion)emspthanemspinemsplifeemsp(2emspUSDemsp60emspbillion)emspThisemspisemspdueemsptoemsptheemspdominanceemspofemspsavingsemsppremiumsemspinemsplifeemspwhichemspareemsptypicallyemspnotemspreinsuredemspInemspnon-lifeemspcessionemspratesemspamongemspemergingemspregionsemspparticularlyemspemergingemspAsiaemspexcludingemspChinaemsptheemspMiddleemspEastemspAfricaemspandemspLatinemspAmericaemspareemsphigheremspthanemspoverallemspindicatingemspthatemsptheseemspcountriesemspareemspofemsphigheremspimportanceemspinemsptheemspreinsuranceemspsectoremspthanemspinemsptheemspprimaryemspindustryemsp
LikeemspinemsptheemspprimaryemspindustryemsptheemspUSemspandemspCanadaemspareemsptheemspdominantemspmarketsemspinemspreinsuranceemsp(aemspthirdemspofemspglobalemsppremiumsemspinemspnon-lifeemspandemsp53emspinemsplife)emspCessionemspratesemspbyemsplineemspofemspbusinessemspvaryemspconsiderablyemspInemspnon-lifeemspcessionemspratesemspinemspmotoremspareemspveryemsplowemsp(~4)emspbutemsphigheremspinemsppropertyemsp(16)emspliabilityemsp(14)emspandemspspecialemsplinesemsp(gt30)emspsuchemspasemspaviationemspmarineemsporemspengineeringemspAmongemspemergingemspmarketsemspChinaemspinemspparticularemspmotoremspcessionemspratesemspareemspalsoemsplowemspwhileemspinemsppropertyemspliabilityemspandemspspecialemsplinesemsptheyemspareemsphigheremspthanemspamongemspadvancedemspmarketsemspTheemspreinsuranceemspsectoremspisemspbetteremsppositionedemspwithemsprespectemsptoemsptheemsptwoemspbigemspvulnerabilitiesemspfacingemspprimaryemspinsurersemspstatedemspaboveemspFirstemspasemspcessionemspratesemspdemonstrateemspmotoremspdoesemspnotemspdominateemspAndemspinemsplifeemspreinsurersemspprincipallyemspcoveremspbiometricemspriskemspsoemsptheyemspareemsplessemspaffectedemspbyemsptheemspdownturnemspinemsptraditionalemspsavingsemspbusiness
Aroundemsp5emspofemspglobalemspinsuranceemsppremiumsemspwereemspcededemsptoemsptheemspreinsuranceemspmarketemspinemsp2018
TheemspUSemspandemspCanadaemspareemsptheemspworldsemsplargestemspreinsuranceemspmarkets
Figure 8 Premium volumes in the global reinsurance industry by region (in USD billion) 2018E
SourceemspSwissemspReemspInstitute
Global reinsurance market (premiums ceded by primary insurers)
Other 30Emerging Asia excl China 13Advanced Asia-Pacific 39China 22Advanced EMEA 58US and Canada 99 Emerging Europe and Central Asia 4
Middle East and Africa 14
Latin America and the Caribbean 12
Swiss Re Institute sigma No 32019 13
Life insurance review 2018 and outlookGlobal life insurance premiums grew by just 02 in real terms to USD 2 820 billion in 2018 This was a significant deceleration from 2017 mainly due to contraction in China It was also below the already-weak annual average of the previous 10 years (06) The outlook is more promising we expect global life premiums to grow by around 3 annually over the next two years Most of the improvement will come from emerging markets in particular China where we expect a recovery in demand for savings products In advanced markets growth will remain low but positive
Aggregate advanced market life premium growth slowed to 08 in 2018 from 12 in 2017 largely due to contraction in the largest markets of advanced EMEA Growth in other advanced regions improved US premiums rose notably (by 24) after slipping in the previous year driven largely by savings products and a supportive economic environment Premiums in advanced Asia-Pacific grew by 14 reversing the contraction of the same magnitude in 2017 boosted by recovery in Japan
Life premiums in emerging markets fell by 20 in 2018 after increasing by 13 in 2017 The sharp turnaround was mainly driven by China with premiums contracting by 54 due to a tightening of regulatory supervision on the distribution of savings policies (see China section in next chapter) Elsewhere in emerging Asia life premiums increased by 70 with robust growth in key markets Growth slowed considerably in emerging Europe and Central Asia mainly due to a sharp contraction in Poland as sales of unit linked products dropped In Latin America premiums contracted for a second consecutive year due to weak demand for savings products in Brazil Chile and Columbia Growth in the Middle East and Africa remained weak
China was the largest contributor for global life premium growth in 2017 but this position was reversed in 2018 To the extent that its negative contribution (‒06 ppt) neutralised most of the positive contributions by North America (05 ppt) advanced Asia-Pacific (03ppt) and emerging Asia excluding China (03 ppt)
We forecast that life premiums will grow by around 3 in 201920 well above the historic average
Figure 9 Life real premium growth 2018E (click chart to open in sigma explorer)
Source Swiss Re Institute
No data lt ndash100 ndash100 to ndash50 ndash50 to ndash25 ndash25 to 00 00 to 25 25 to 50 50 to 100 gt 100
Advanced market life premium growth slowed in 2018 but there were mixed outcomes across nations
Premiums in emerging markets declined due to a slump in sales of saving products in China
China neutralised much of the positive contribution from other regions
14 Swiss Re Institute sigma No 32019
Trends in the global insurance markets
OutlookWe expect global life insurance premiums to grow by around 3 in real terms in each of the next two years stronger than the flat performance of 2018 and also the average of the last 10 years (06) Among the advanced markets the US and Canada will lead although at a more moderate pace than in 2018 In advanced Asia-Pacific long-term growth drivers such as ageing populations and rising affluence will support premium growth In advanced EMEA however we expect premiums to stagnate as low interest rates continue to hinder sales of savings products
Emerging market premiums will rebound over the next two years with China returning as the growth engine However insurers in China will face some short-term challenges as competition intensifies and measures to push protection products and tax-deferred pension insurance take time to materialise Elsewhere favourable polices such as tax benefits (eg Argentina) and promotion of financial inclusion schemes in some Asian markets should support demand for life covers So too will growing economic momentum favourable demographics and increasing incomes In many emerging markets low interest rates are driving a focus on protection products away from savings-type products
We forecast that China will contribute almost half (14 ppt) of global life premium growth over next two years (Figure 11) This is more than twice the contribution of the US and Canada (06 ppt) Emerging Asia excluding China will contribute 04 ppt and advanced Asia-Pacific 03 ppt
Figure 10 Life premium growth by region in real terms
Source Swiss Re Institute
MiddleEast and
Africa
Europe andCentral Asia
LatinAmerica
Asiaexcl China
ChinaExcl ChinaAllAsia-Pacific
EMEAUS andCanada
AllAll
Advanced markets Emerging marketsWorld
ndash6
ndash3
0
3
6
9
12
15
Outlook annual average growth 2019ndash2020FAnnual average growth rate 2008ndash2017 Growth rate 2018E
North America will lead advanced market life sector premium growth over the next two years
China will return as the growth engine for emerging markethellip
hellipand also global life sector growth over next two years
Swiss Re Institute sigma No 32019 15
ProfitabilityLow interest rates continue to depress profitability in life insurance especially in Europe and in advanced Asia-Pacific Savings-type business in particular is under stress as insurers are unable to provide attractive returns fund guarantees future claims and benefits while at the same time offer attractive prices On a positive note profitability has begun to improve gradually in North America due to a slow increase in interest rates although a sharp jump in surrender benefits and reserves had some negative impact last year The shareholder-equity weighted average ROE for a sample of 23 US composite and life insurance companies was at 113 in 2018 an improvement of 24 ppt from 2017 This ratio improved by 10 ppt to 104 for 32 companies in Asia-Pacific but declined by 10 ppt to 85 for 18 insurers in Europe
Figure 11 Contribution to annual real life premium growth (in ppt) by region until 2020F
Source Swiss Re Institute
29
003
005
01
01
03
04
06
14
World
Advanced EMEA
Middle East and Africa
Emerging Europe and Central Asia
Latin America and the Caribbean
Advanced Asia-Pacific
Emerging Asia excl China
US and Canada
China
Advanced markets
Percentage points
Emerging markets
Low interest rates remain a major concern for life insurershellip
Figure 12 ROE of 73 global composite and life insurance companies
Source Bloomberg Swiss Re Institute
113 85 104
ndash5
0
5
10
15
20
25
20
09
20
10
20
11
20
12
20
13
20
14
20
15
20
16
20
17
20
18
20
09
20
10
20
11
20
12
20
13
20
14
20
15
20
16
20
17
20
18
20
09
20
10
20
11
20
12
20
13
20
14
20
15
20
16
20
17
20
18
Middle 50 Shareholder-equity weighted average Linear trend since 2010
North America (23 insurers) Europe (19 insurers) Asia-Pacific (32 insurers)
16 Swiss Re Institute sigma No 32019
Trends in the global insurance markets
Overall profitability in the life insurance sector will remain under pressure due to the low interest rate environment that will continue for longer given the recent change in monetary policy stance Although profitability improved in North America we expect it to remain stable at that level for the next two years In advanced EMEA in addition to low interest rates new regulations such as the General Data Protection Regulation (GDPR) poses additional challenges In advanced Asia-Pacific too profitability is expected to remain subdued as interest rates remain low In emerging markets particularly China the rebound in the equities in the current year indicates that profitability should improve
Non-life insurance review 2018 and outlookLast year global non-life premiums written were USD 2 373 billion up 3 in real terms from the previous year We expect global premium growth to maintain the healthy pace of around 3 in 201920 above the 10-year average of around 2 We forecast that premiums in advanced markets will grow by around 18 with most regions following their respective long-term trends Emerging market premiums will grow by around 7 about the same as in 2018 but below the long-term average of 77 Premium growth in emerging Asia will remain solid but we see notable slowdown on the back of slower economic growth and weaker demand for motor insurance Growth rates in other emerging markets will mostly improve
hellipand will continue to pressure sector profitability
We forecast that global non-life premiums will grow by 3 in real terms this year and next
Figure 13 Non-life real premium growth 2018E (click chart to open in sigma explorer)
Source Swiss Re Institute
No data lt ndash100 ndash100 to ndash50 ndash50 to ndash25 ndash25 to 00 00 to 25 25 to 50 50 to 100 gt 100
Swiss Re Institute sigma No 32019 17
Advanced market non-life premium growth moderated slightly to 19 last year with slower growth in the US Canada and advanced Europe (partly due the impact of rising inflation on real growth) There was significant improvement in Asia-Pacific given a stable showing in Japan after an 86 decline in premiums in 2017 Premiums in the emerging economies grew by 71 in 2018 an improvement over the previous year but lower than the 10-year average (77) Emerging Asia continued to expand rapidly with premiums up more than 11 and by 12 in China Emerging Europe grew strongly also with premiums up 42 supported by a solid economic environment and rate advances in EU-member countries The only region where premiums contracted was the Middle East and Africa (down 13)
China and North America were the biggest drivers of global non-life market growth in 2018 with 12 ppt and 11 ppt contributions respectively Advanced EMEA and other emerging Asian countries made a similar contribution of around 025 ppt each The contributions of other regions were relatively low
OutlookWe forecast that non-life premiums will grow by around 3 annually over the next two years above the 10-year average The advanced markets will grow by 18 slower than in 2018 but also above historic average Our forecast is based on still solid premium growth expectations in the US and Canada with premium rate increases lending support amid a slowing economy We expect that the other advanced regions will follow long-term average growth trends In advanced Asia-Pacific growth will move close to 3 as the impact of motor rate reductions and the removal of long-term fire contracts in Japan subside
Last yearrsquos growth was derived mostly from the emerging markets
China was the biggest contributor
We expect there to be strong performance in the US and Canada based on solid economic growth and still firming premium rates
Figure 14 Non-life premium growth in real terms
Source Swiss Re Institute
MiddleEast and
Africa
Europe andCentral Asia
LatinAmerica
Asiaexcl China
ChinaExcl ChinaAllAsia-Pacific
EMEAUS andCanada
AllAll
Advanced markets Emerging marketsWorld
ndash2
0
2
4
6
8
10
12
14
16
Outlook annual average growth 2019ndash2020FAnnual average growth rate 2008ndash2017 Growth rate 2018E
18emsp Swiss Re InstituteemspsigmaemspNoemsp32019
Trends in the global insurance markets
Weemspprojectemspthatemspemergingemspmarketsemsppremiumsemspwillemspgrowemspbyemsparoundemsp7emspinemsp201920emspWeemspexpectemspsignificantlyemspsloweremspgrowthemsp(9)emspinemspChinaemspthanemspoveremsptheemsppastemsp10emspyearsemsp(16)emspreflectingemspmoreemspmoderateemspeconomicemspgrowthemspAlsoemspwhileemspmotoremspwillemspremainemsptheemspbiggestemspcontributoremsptoemspoverallemspnon-lifeemsppremiumsemsptheemspgrowthemsprateemspwillemspmoveemsploweremspbecauseemspofemspde-tarifficationemspandemspreducedemspsubsidiesemsponemspnewemspenergyemspvehiclesemspElsewhereemspinemspemergingemspAsiaemsptheemspfastestemspgrowingemspregionemspweemspseeemspgrowthemspinemsphealthemspliabilityemspandemspagricultureemspbusinessemsplinesemspWeemspexpectemspgradualemsprecoveryemspinemsptheemspnon-lifeemspsectoremspinemsptheemspMiddleemspEastemspAfricaemspandemspLatinemspAmericaemspasemspeconomiesemspcontinueemsptoemspstrengthenemspHoweveremsppremiumemspgrowthemspratesemspwillemspremainemspshortemspofemsphistoricemspaveragesemsp
Chinaemspwillemspbeemsptheemspmainemspcontributoremsptoemspglobalemspnon-lifeemsppremiumemspgrowthemspoveremsptheemspnextemsptwoemspyearsemsp(11emsppptemspseeemspFigureemsp15emspbelow)emspsurpassingemsptheemspcontributionemspfromemspNorthemspAmericaemspAdvancedemspandemspemergingemspAsiaemspandemspalsoemspadvancedemspEMEAemspwillemspeachemspcontributeemsparoundemsp02‒03emsppptemsptoemspglobalemspnon-lifeemsppremiumemspgrowthemspinemsp201920emspNoteemspalthoughemspadvancedemspmarketsemspwillemspgrowemspatemspaemspmuchemspsloweremsppaceemspthanemspChinaemsptheyemspwillemspstillemspcontributeemspalmostemsphalfemsptoemsptheemspprojectedemspglobalemspgrowthemsp(14emspppt)emspCurrentlyemspaccordingemsptoemspsigmaemspdataemsptogetheremsptheemspadvancedemspmarketsemspaccountemspforemsp78emspofemspglobalemspnon-lifeemsppremiumemspvolumesemspinemspabsoluteemsptermsemsp
Natural catastrophe and overall non-life claims paymentsTotalemspeconomicemsplossesemspfromemspnaturalemspandemspman-madeemspcatastrophesemspinemsp2018emspwereemspemspUSDemsp161emspbillionemspRoughlyemsphalfemsp(USDemsp81emspbillion)emspwereemspcoveredemspbyemsptheemspinsuranceemspsectoremsptheemspfourthemsphighestemspone-yearemspaggregateemspindustryemsppayemspoutemspeveremspandemspaboveemsptheemsppreviousemsp10-yearemspannualemspaverageemspofemspUSDemsp71emspbillionemspLossesemspfromemspnaturalemspcatastrophesemspdominateemsptheemspheadlinesemspbutemsptheemspinsuranceemspsectorrsquosemspcontributionemsptoemspresilienceemspgoesemspwellemspbeyondemspcompensationemspforemspdisasteremspeventsemspThisemspisemspdemonstratedemspbyemspouremspestimateemspthatemspinemsptotalemspUSDemsp17emsptrillionemspnon-lifeemspsectoremspclaimsemspwereemsppaidemspoutemsptoemsppolicyholdersemsplastemspyearemspAtemspUSDemsp81emspbillionemsponlyemsp5emspofemsptotalemspnon-lifeemspinsuranceemspandemsproughlyemspaemspthirdemspofemspglobalemsppropertyemspinsuranceemspclaimsemspwereemsponemspaccountemspofemspnaturalemspcatastrophesemsp
TheemspemergingemspmarketsemspledemspbyemspemergingemspAsiaemspwillemspleademspnon-lifeemspsectoremspgrowthemspinemsp201920
EvenemspthoughemspweemspseeemspsomeemspmoderationemspinemspChinaemspitemspwillemspremainemsptheemspmainemspcontributoremsptoemspglobalemspnon-lifeemsppremiumemspgrowth
Figure 15 Contribution to annual real non-life premium growth (in ppt) by region until 2020F
emsp SourceemspSwissemspReemspInstitute
Advanced markets
Percentage points
Emerging markets
30
01
01
01
02
02
03
08
11
World
Advanced EMEA
Middle East and Africa
Emerging Europe and Central Asia
Latin America and the Caribbean
Advanced Asia-Pacific
Emerging Asia excl China
US and Canada
China
Theemspinsuranceemspindustryrsquosemspcontributionemsptoemspresilienceemspgoesemspwellemspbeyondemsppay-outsemspresultingemspfromemspnaturalemspcatastrophes
Swiss Re Institute sigma No 32019 19
Profitability and industry capitalisation11
Underwriting conditions started to improve towards the end of 2017 and this continued into 2018 as property prices in the US began to rise after the large hurricane losses of 2017 The positive trend in property was supported by some hardening in continental Europe and a stabilisation of rates in Latin America and the UK Rates for Financial and Professional Lines (FampPL) also developed a positive trend across the regions Most notably rates in the UK and Latin America hardened while Australia saw double digit-rate improvements for the second year in a row Rates in casualty on the other hand remained soft across all regions (excluding the Pacific) in 2018 continuing a trend of year-over-year declines stretching back to 2014
Nevertheless the underwriting cycle has only partially improved and profitability in PampC remained muted in 2018 Stabilisation of the soft market trend of recent years has not been sufficient to notably narrow the profitability gap that still besets the non-life insurance sector We estimate a slightly positive underwriting result for the global non-life sector in 2018 Overall profitability of global PampC remains at 6‒65 which barely covers industry cost of capital Continuing low interest rates ndash mainly in Europe and Japan but also in the US ndash led to investment returns of between 21 in Japan and 36 in the US and Australia Returns in Europe were between these two extremes
For the years 2019‒2020 we forecast average ROE of 7‒8 based on slightly positive underwriting results barring any impact from large natural catastrophes and on still subdued investment returns From current dynamics we see two probable scenarios either recent improvements in property and FampPL fade soon or rates and underwriting terms in casualty improve based on already soft underwriting conditions and a slight upward movement in claims inflation That said any improvement in underwriting conditions will only be moderate and not close the sector profit gap identified in sigma 4201812
11 This section is based on an analysis of the propertycasualty business of eight major mature markets (the US Canada Germany France Italy the UK Japan and Australia) There is very little data availability on insurance sector profitability in emerging markets
12 See sigma 42018 Profitability in non-life insurance ndash mind the gap Swiss Re Institute
Commercial rates improved in 2018 except for casualty covers
Stabilisation of the soft market trend has not led to notable improvement in profitability
Figure 16 Profitability of the eight major non-life markets 1999ndash2020F in of net premiums earned (except for ROE)
Source Swiss Re Institute
ndash15
ndash10
ndash5
0
5
10
15
20
2020
F
2019
F
2018
E
2017
2016
2015
2014
2013
2012
2011
2010
200
9
200
8
2007
200
6
200
5
200
4
200
3
200
2
2001
200
0
199
9
After tax return on equity ()Investment resultUnderwriting result
Aggregate of the US Canada the UK Germany France Italy Japan and Australia
We see only moderate (if any) underwriting improvements and expect the profitability gap in non-life insurance to remain
20 Swiss Re Institute sigma No 32019
Trends in the global insurance markets
Impact of a global recession on profitability in the PampC industryIf global economic slowdown in 2019 and 2020 turns into a recession we think it will be more moderate and protracted than after the financial crisis of 2008 We assume that economic growth will slow by roughly 2 and that headline inflation cools by 1 annually over a three-year period Consistent with past recessions risky assets will underperform markedly over the period as government bonds especially in the US and for core euro area countries benefit from ldquoflight-to-qualityrdquo
Underwriting performance tends to deteriorate in the run-up to a recession and typically improves after onset In our view the weakening reflects the build-up of inflationary pressures when the economy is performing well As recession takes hold the claims burden for new business declines due to disinflation and the resulting reserve releases
Lines of business respond differently to changes in general inflation Where claims are driven largely by healthcare inflation (eg casualty and health) these lines exhibit a higher sensitivity to changes in general inflation and so benefit most from disinflation Some lines of business have no sensitivity to inflation (eg life and credit insurance) The worst-case economic scenario for an insurer is stagflation this leads to higher claims inflation without a compensating rise in investment returns
In our recession scenario we assume global growth slows by 2
As recession takes hold the claims burden for new business declines
Figure 17 Average US PampC combined ratio cat-adjusted US primary insurersrsquo estimated over the last three recessions exposure to inflation
Source Swiss Re Institute Source IBNR weekly
0 20 40 60 80 100
Total
Product Liabilty
Professional Liability
General Liability
Special Liability
Medical malpractise
Commercial Multi Peril
Workers Comp
Commercial Auto Liability
Personal Auto Liability
Auto Property Damage
Homeowners
90
92
94
96
98
100
102
+ 5
yea
rs
+ 4
yea
rs
+ 3
yea
rs
+ 2
yea
rs
+ 1
yea
r
Rec
essi
onbe
gins
ndash1
yea
r
ndash2
yea
rs
OtherSocialConsumer price inflationWagesMedical
Many lines of business benefit from disinflation
Swiss Re Institute sigma No 32019 21
Regional review 2018 and outlook
IntroductionOver the past five years the emerging market share of global premiums has increased rising by 45 ppt to 213 in 2018 This is well below the share of emerging markets in global GDP (up 08 ppt to 408 over the same period) The much lower share in insurance relative to share of global output gives indication of the extent of insurance catch-up potential in the emerging markets It also indicates that low income countries spend a smaller share of their GDP on insurance than high income ones (the so-called S-Curve relationship)13 The increase in the global market share of emerging markets in insurance has been mainly due to Chinarsquos strong growth (see Figure 18) Key markets in Latin America Africa and emerging Europe have struggled in recent years and other emerging markets have also lost ground However over the coming years we expect premium growth among the other emerging markets to also grow faster alongside moderation in advanced markets
13 R EnzrdquoThe S-Curve Relation Between Per-Capita Income and Insurance Penetration The Geneva Papers on Risk and Insurance ndash Issues and Practice vol 25 no 3 July 2000
This chapter provides an overview of growth and profitability trends by region There has been a clear upward trend in insurance penetration among the emerging markets and we expect this to continue China will remain the main driver of emerging market premium growth over the next two years but there will also be strong performance in emerging Asia overall emerging Europe and recovery in Latin America In advanced markets there has been a trend decrease in insurance penetration on the life side with non-life penetration holding steady We forecast just moderate overall premium growth in North America and advanced Asia-Pacific and in non-life in advanced EMEA in 201920
In line with the S-curve we expect the emerging markets will increase their spending as a share of GDP on insurance
Figure 18 Share of emerging markets in global premiums written and GDP (1980‒2029F)
Source Swiss Re Institute
GDP
GDP
Total
Total
GDP Excl ChinaPremiums written
2018E 408
2018E 213
2018E 252
2018E 103
2025F2020F20152010200520001995199019851980
0
10
20
30
40
50
22 Swiss Re Institute sigma No 32019
Regional review 2018 and outlook
Advanced marketsInsurance penetration and densityOver the past decade overall insurance penetration in the advanced markets defined as insurance premiumsGDP has decreased due to a contraction in life insurance business In non-life insurance penetration has remained fairly stable as would be expected in saturated markets Average per capita spending on insurance (density) in advanced markets was USD 3737 in 2018 and insurance penetration (premiums GDP) was 78 (see Figure 19)
Figure 19 Insurance density (USD) and penetration () in advanced markets 2018E
Source Swiss Re Institute
GreeceCyprus
MaltaPortugal
SpainIceland
New ZealandIsrael
AustriaBelgium
ItalyGermanyAustralia
EU 15 countriesCanada
South KoreaJapan
NorwaySweden
FranceAverage
G7United States
United KingdomNetherlands
FinlandSingapore
LuxembourgTaiwanIreland
DenmarkSwitzerlandHong Kong
Premiums in USD
0 5 10 15 20 25
Premiums as a of GDP
0 1000 2000 3000 4000 5000 6000 7000 8000 9000
Premiums in USD
Life premiums per capita Total insurance penetration (lower axis)Non-life premiums per capita
0123456
2018E2010200019901980
Insurance penetration
Non-lifeLife
Swiss Re Institute sigma No 32019 23
US and Canada mostly moderate premium growth in 201920LifeLife premiums in the US and Canada increased by 23 in 2018 a recovery from a dip in the prior year In the US a rebound to 24 was driven by savings products particularly annuities after courts struck down the Department of Laborrsquos fiduciary rule which had significantly hampered sales in 2017 Modestly increasing interest rates buoyant equity markets and benign credit market conditions throughout most of the year also contributed Meanwhile growth in protection products was weighed down by the volatile group life segment We forecast growth in annuities will slow but remain relatively robust in 2019 and 2020 while other segments will grow at trend In Canada we estimate that real life premium growth almost halved in 2018 to 14 Individual life sales were still finding equilibrium after the reduction of tax benefits in 2017 group life business remained relatively subdued and annuity premium growth was unchanged Firming inflation impacted the comparison in real terms For 2019 and 2020 we expect a recovery toward trend growth
Despite solid premium growth a sharp increase in surrender benefits and reserves in 2018 negatively affected US life insurersrsquo operating income By contrast investment income benefitted from a steady increase in interest rates Overall we estimate that US life insurers achieved solid ROE of 11 in 2018 and we expect profitability to remain stable at that level in 2019 and 2020 In Canada life insurer profitability improved to around 10 and is also forecast to remain steady
Non-lifeNon-life premium growth in North America moderated slightly to a still-strong 27 in 2018 A firming inflation profile masked a sturdier nominal upswing In the US premium growth was supported by strong underlying exposure growth and modest rate increases The motor segment continued to power the advance particularly on the commercial side with robust rate increases to catch up with rising claims costs The property and liability segments also accelerated the former seeing somewhat better pricing after 2017rsquos record cat losses though the rate increases fell short of initial expectations We expect US non-life premium growth to moderate in 2019 and 2020 along with slowing economic growth particularly as price increases are projected to slow across most segments that saw an uptick in 2018 In Canada property lines were the main growth driver in 2018 as price adjustments continued though motor and liability premium growth also accelerated Similar to the US slower economic growth and slowing price increases are projected to lead to more subdued premium growth until 2020 across all business lines
In the US PampC insurersrsquo overall profitability is estimated to have improved in 2018 over the prior year with ROE of roughly 8 In the wake of US tax reform provisions for base erosion and anti-abuse tax (BEAT) effective 1 January 2018 more business stayed onshore particularly in the commercial segment However this has an impact only on a net basis on solvency ratios that dropped compared to the previous year Catastrophe losses remained elevated ndash with large losses from Hurricanes Michael and Harvey and the wildfires in California ndash but this was an improvement on 2017rsquos near-record loss year and not enough to tip the underwriting result into red In Canada the PampC segment (excluding government auto writers) is similarly estimated to have eked out a modest underwriting profit in 2018 despite an elevated frequency of both cat and non-cat losses Along with a largely unchanged investment result the sector achieved ROE of around 6 For the next two years we project a roughly stable industry ROE in both the US and Canada based on a continuation of modestly positive underwriting results (barring any impact from large natural catastrophes) and subdued but steady investment returns
Life insurance premium growth in the US was driven by strong growth in annuities in 2018 we expect moderation in 201920
Non-life premium growth in North America was also relatively strong in 2018
US and Canada premiums 2018E
USD bnWorld
market shareLife 647 23Non-life 950 40
ndash2
ndash1
0
1
2
3
Non-lifeLife
Real premiums growth
Growth rate 2018EAnnual average growth rate 2008ndash2017
Outlook annual average growth 2019ndash2020F
0123456
Non-LifeLife
2018E2010200019901980
Insurance penetration
Non-lifeLife
24 Swiss Re Institute sigma No 32019
Regional review 2018 and outlook
Advanced EMEA life sector to stagnate moderate growth in non-lifeLifeLife insurance premiums in advanced EMEA contracted by an estimated 06 in 2018 compared to 44 growth in 2017 The biggest declines after adjusting for inflation were in Spain (‒34) and the Netherlands (‒41) mostly on account of weak sales of savings-type business Premiums in the UK France and Germany fell by around 15‒2 in real terms In nominal terms however premium income remained roughly flat Overall profitability (ROE) of life insurers in the region was around 85 in 201814 Interest rates will remain low for longer negatively impacting sector in-force profitability In addition regulators continue to lower the levels of allowed guarantees reducing the attractiveness of traditional savings business even further The shift to unit-linked contracts where benefits are based on the developments of a mutual fund continues New laws such as the General Data Protection Regulation (GDPR) pose additional challenges GDPR requires costly updates of legacy IT systems to ensure compliance and increases the risk of using innovative technologies15
We forecast premium income in advanced EMEA to stagnate until 2020 The promotion of unit-linked savings products to compensate losses in the traditional savings business with investment guarantees will continue Regulators are likely to continue to lower guarantee levels allowed lowering the value proposition On the flipside we expect biometric protection business to continue to grow as our mortality protection gap figures show still large catch-up potential in the region (premium potential USD 43 billion about 50 of current life risk business in EMEA)
Non-life Premium growth in advanced EMEA slowed to 11 in 2018 (2017 27) but was still above the 10-year average of 07 The major markets were in a range of 01 and 14 growth Premiums in Germany were up 11 mainly on the back of solid motor and property lines while accident and health stagnated Premiums were flat in France across the main lines of business In the UK premiums rose marginally driven by an expansion of international business while domestic personal lines (motor and household) covers were weak The Nordics were mixed with premiums in Denmark and Sweden rising by more than 3 and declining by 10 in Finland Among the southern EU countries premiums grew solidly in Portugal and Greece but Spain was up just 08 Market expansion continued in Italy (14) following marginal growth in 2017 (03) and declining premiums since 2007 Except for the dominating compulsory segment of motor liability growth was broad-based and supported by price increases Underwriting profitability has remained largely stable in the European Economic Area Loss ratios declined from 609 in 2017 to 603 for the three quarters of 2018 also because of below average natural catastrophe losses Overall profitability for the large European markets was around 6‒7 ROE
We forecast a moderate increase of non-life premiums in 201920 reflecting a temporarily weaker macro-economic environment with low inflation also tempering claims development for long-tail lines of business (eg general and motor liability) We expect largely a stable price environment with commercial insurance rates showing some upward movement Underwriting profitability is not expected to improve significantly and will remain below target16 Investment returns will also remain subdued due to low investment yields even though recent re-investment yields have slightly improved last year
14 Shareholder-equity weighted ROE based on a sample of 18 European life insurers15 ldquoInsurers highlight challenges of applying GDPRrdquo Insurance Europe April 2019
httpswwwinsuranceeuropeeuinsurers-highlight-challenges-applying-gdpr16 See also sigma 42018 op cit
We forecast that life premiums in advanced EMEA will stagnate over the next two years after declining by 06 in 2018
Non-life growth will moderate but remain above the historic average underwriting profitability remains below target
Advanced EMEA premiums 2018E
USD bnWorld
market shareLife 934 33Non-life 627 26
ndash2
ndash1
0
1
2
Non-lifeLife
Real premiums growth
Growth rate 2018EAnnual average growth rate 2008ndash2017
Outlook annual average growth 2019ndash2020F
0123456
Non-LifeLife
2018E2010200019901980
Insurance penetration
Non-lifeLife
Swiss Re Institute sigma No 32019 25
Advanced Asia-Pacific favourable outlook after recent weaknessLife Life insurance premiums in advanced Asia-Pacific increased by 14 in 2018 after shrinking by on average 29 in the preceding two years However in South Korea and Australia premiums contracted by around 6 in 2018 In the former the decline was driven by savings products with insurers less keen on these under IFRS 17 In Australia continued low interest rates and allegations of mis-selling weighed In Japan we estimate that premium growth turned positive but was constrained by lower rates after the adoption of new mortality tables17 Premium growth in Taiwan and Singapore slowed with sales of Central Provident Fund schemes (CPF) in Singapore down due to changes in agent fees Meanwhile sector growth in Hong Kong was affected by continued controls on capital outflows from mainland China
We forecast robust growth in mortality business in Japan and Australia in 201920 However in Japan given tax changes related to Corporate-Owned Life Insurance (COLI) products insurers have temporarily paused their sales of COLI products which could weigh on market growth this year And in Australia growth could be impacted by the Royal Commissions report resulting in higher regulatory costs and more cautious sales practices In Taiwan newly-introduced group annuity products could boost life premiums Unit-linked and other investment-type products will remain vulnerable to financial market volatility even though the strong equity market recovery in early 2019 is re-fuelling interest Overall growth in 2019 and 2020 will continue with demand drivers like rising affluence and an ageing population still in place We expect profitability to remain subdued as interest rates remain low
Non-lifeIn 2018 non-life premiums in advanced Asia-Pacific grew by 12 having declined by 2 in 2017 The improvement was driven mainly by less severe contraction in Japan where the premium decline slowed to 03 from almost 86 in 2017 This was on account of the largest insurers having reduced motor rates by up to 5 since the beginning of 2017 The profitability of Japanese non-life insurers is expected to have declined significantly with the three largest Japanese non-life insurers reported to have incurred record insurance pay-outs in the fiscal year 2018 due to natural catastrophe losses Premium growth in the other markets was robust ranging from around 2 in South Korea and Australia to 6 in Singapore In Australia strong rate increases in commercial lines lent support Growth in personal lines was more muted given economic uncertainty rising concerns about the housing market and lower rates and refunds in compulsory third-party motor18
The outlook in advanced Asia-Pacific is positive We expect premiums in Japan to rise modestly in 2019 after upward adjustments to official GIRO rates in property and personal accident lines19 There will likely be rate increases in property and commercial lines given last yearrsquos heavy natural catastrophe losses In Australia the decline in compulsory third party (CTP) motor premiums is expected to be less of a drag while property is expected to continue its robust growth Singapore and Taiwan are already looking ahead releasing a Transformation Map and master plan for the reinsurance industry based on InsurTech and other innovations such as parametric solutions20 Hong Kong is planning to position itself as the risk management hub for Belt amp Road projects Profitability will remain an issue due to strong competition and continuing low interest rates these continuing to hurt investment returns
17 For implications see sigma No 32018 World insurance in 2017 Swiss Re Institute p 2518 See New South Wales CTP reform NSW Government State Insurance Regulatory Authority19 Homeownerrsquos comprehensive insurance and personal accident insurance guiding rates were revised by
the General Insurance Rating Organization of Japan (GIRO) in July 201820 Roadmap for a Leading Global Financial Centre in Asia Monetary Authority of Singapore 30 October
2017
Life premium growth in advanced Asia-Pacific will slow to trend in 201920 Sales of protection products should lend support
Non-life markets returned to growth last year and we expect this to continue in 2019 Profitability remains subdued
Advanced Asia-Pacific premiums 2018E
USD bnWorld
market shareLife 650 23Non-life 278 12
0
1
2
3
4
Non-lifeLife
Real premiums growth
Growth rate 2018EAnnual average growth rate 2008ndash2017
Outlook annual average growth 2019ndash2020F
00153045607590
Non-LifeLife
2018E2010200019901980
Insurance penetration
Non-lifeLife
26 Swiss Re Institute sigma No 32019
Regional review 2018 and outlook
Emerging marketsInsurance penetration and densityIn 2018 total insurance penetration in emerging markets declined because of contraction in the life sector mainly in China Over the longer-term however penetration in both life and non-life has been on solid upward trend mostly notably in emerging Asia An uptrend can be seen in most regions except in the life sectors of emerging Europe and the Middle East and Africa In the latter falling penetration reflects an aggregation effect where South Africa with very high insurance penetration loses market share to the less developed low-penetration countries in the region Average per capita spending on insurance (density) in emerging markets was USD 169 in 2018 and insurance penetration (premiumsGDP) was 32
Figure 20 Insurance density (USD) and penetration (amp) in emerging markets 2018E
Source Swiss Re Institute
0 500 1000 1500 2000
Life premiums per capita
NigeriaBangladesh
PakistanEgypt
AlgeriaUkraine
KenyaZimbabwe
Sri LankaKazakhstanGuatemalaPhilippines
VietnamIndia
TunisiaIndonesia
JordanIran
EcuadorDominican Republic
El SalvadorPeru
MoroccoTurkey
RomaniaSerbiaRussia
AverageColombia
MexicoBulgaria
OmanVenezuela
JamaicaLebanon
ArgentinaCosta Rica
Saudi ArabiaKuwait
BrazilPanamaCroatia
ThailandHungaryNamibia
PR ChinaUruguay
PolandSlovakia
MalaysiaBahrain
Czech RepublicChile
South AfricaTrinidad and Tobago
United Arab EmiratesSlovenia
Bahamas
Premiums in USD
0 3 6 9 12 15
Premiums as a of GDP
Premiums as a of GDP
Life premiums per capita Total insurance penetration (lower axis)Non-life premiums per capita
0
1
2Non-LifeLife
2018E2010200019901980
Insurance penetration
Non-lifeLife
Swiss Re Institute sigma No 32019 27
China robust growth expected but slower than in the recent pastLifeLife premiums contracted by 54 in 2018 after increasing by an average of 14 over past 10 years The dwindling sales of short-term universal life policies resulted from a tightening of regulatory supervision The crackdown reflects the authoritiesrsquo goal to steer the market towards protection-type products and to better manage the financial risks associated with wealth management insurance offerings Sector profitability deteriorated in 2018 due to investment yields falling to 43 the lowest since 2012 reflecting the fall of equity markets (the Shanghai Composite Index was down 25 yy in 2018)
We forecast a solid recovery in 201920 with premiums up more than 10 although this is still below the historic average The impact of the regulatory measures is expected to dissipate but competition will become more intense also among protection products which the regulator is promoting The launch of personal tax-deferred pension insurance as well as Chinarsquos commitment to completely remove the cap on foreign ownership of Chinese life insurers in 2021 are favourable developments but it will take time before the impact shows Digitisation continues to transform Chinarsquos insurance sector but the channel mix remains dominated by agents With a relaxation of qualification and certification requirements sales through agents grew strongly in 2018 while online sales fell by 13 Sector profitability is expected to improve in 201920 The strong rebound of the equity market by 34 as of mid-April 2019 will boost insurersrsquo investment returns
Non-lifeNon-life premiums rose by 12 in 2018 driven by strong increases in personal accident and health insurance We expect growth to remain robust this year and next driven mainly by non-motor lines Motor grew only slowly (3) as a result of pricing reform and slower new car sales but it remains the biggest segment (724 of non-life premiums in 2018) Non-motor lines including agriculture credit amp surety and liability insurance saw robust growth last year However sector profitability deteriorated with net income down 26 due to weaker investment returns and a higher loss ratio Of 88 non-life insurers 59 reported underwriting losses
We expect non-motor lines to remain the key drivers of growth while motor will continue to be negatively affected by de-tariffication as well as the reduction in government subsidies for purchases of new energy vehicles This could also lead to market consolidation given that larger non-life companies can better adjust to lower motor premium rates and leverage technologies to cut costs Meanwhile the Chinese authorities will continue to lend support to some non-motor lines One area of focus is health insurance given the ldquoHealthy Chinardquo initiative that was included in the governmentrsquos 13th Five-year Plan21 We think overall sector profitability could improve in 2019 given a stronger equity market stricter regulation on commission rates22 and positive impacts from tax reductions
21 The ldquoHealthy China 2030rdquo initiative involves reforming the countryrsquos healthcare system supporting health insurance improving risk awareness and encouraging cooperation among different stakeholders
22 Since 2017 the China Banking and Insurance Regulatory Commission (CBIRC) has monitored auto insurance pricing as well as commission rate paid to intermediaries In MayJune 2018 the regulator stipulated that all non-life insurers submit value ranges and usage rules for commission charges
We expect a strong rebound in 201920 after weak sales of short-term universal life policies led to a sharp contraction in sector premiums in 2018
Non-life premiums rose strongly in 2018 driven by accident and health lines Growth will remain solid but below historic averages driven by non-motor lines
China premiums 2018E
USD bnWorld
market shareLife 313 11Non-life 262 11
ndash10
ndash5
0
5
10
15
20
Non-lifeLife
Real premiums growth
Growth rate 2018EAnnual average growth rate 2008ndash2017
Outlook annual average growth 2019ndash2020F
0
1
2
3Non-LifeLife
2018E2010200019901980
Insurance penetration
Non-lifeLife
28 Swiss Re Institute sigma No 32019
Regional review 2018 and outlook
Other emerging Asia life and non-life growth expected to be strongLifeWe estimate that life premiums in emerging Asia (excluding China) increased by 7 in 2018 (2017 +58) Premiums in Vietnam surged 28 up from a low base and supported by strong promotion through the agency and bancassurance channels India the Philippines and Malaysia also reported stable premium growth of around 6‒8 In Thailand and Indonesia weaker equity markets weighed on performance
We expect life premiums will maintain strong growth momentum of around 6‒7 in each of the next two years The conclusion of elections in India Indonesia and Thailand should remove some of uncertainties around government policies and economic development We expect that insurance demand in emerging Asia will shift more towards protection-type products as low interest rates and volatile risky asset prices continue to undermine the attractiveness of investment products At the same time government promotion (eg in India Indonesia and Vietnam) of financial inclusive schemes will help insurers gain access to new customer segments including the low-income population In some markets like Thailand the population is aging rapidly This will support sales of private pension plans including annuities
Non-lifeNon-life premium growth improved to 11 in 2018 from 81 a year earlier This was based on recoveries in Indonesia and Malaysia and sustained strong growth in India and Vietnam Property and motor remain the two largest business lines in the region both having achieved trend growth in 2018 despite intense competition and soft rates In India agriculture insurance continued to be a major growth driver with double-digit increases as has been the case since the launch of a revised crop insurance scheme by the government in January 2016 Profitability in many markets remains closely tied to the performance in motor third-party liability (MTPL) In Malaysia poorer performance in MTPL due to de-tariffication had pushed up the loss ratio in 2017 but there was a slight improvement in 2018 In Indonesia on the other hand sector profitability improved due to a lower claims burden than in 2017 This excludes possible claims from the tsunami that struck Lampung and Banten in late December of last year According to sigma estimates total losses were USD 250 million but only 20 are estimated to be insured The impact on overall sector profitability therefore will likely be limited
We forecast that non-life premiums in emerging Asia will grow by around 9 annually in 201920 supported by ongoing urbanisation and a pipeline of large infrastructure projects Agriculture liability and health insurance lines are expected to outperform Liability insurance which currently has a low penetration rate is showing signs of faster growth on increasing demand for product liabilityrecall and professional liability covers (eg DampO and EampO) Meanwhile the introduction of universal healthcare schemes in India and Indonesia will offer opportunities to private insurers in the medical segment Downside risks for emerging Asia stem from possible escalation of US-China trade tensions which will impact mostly export and trade-dependent markets In Malaysia we expect that ongoing motor de-tariffication will cap growth and profitability over the next two years
Growth in life premiums in 2018 was almost double the historic average Strong momentum will continue supported by robust economic growth rising incomes and increased risk awareness
Non-life premiums growth was higher than the historic average last year and we expect the strong performance to continue
Other emerging Asia premiums 2018E
USD bnWorld
market shareLife 130 46Non-life 50 21
0
2
4
6
8
10
12
Non-lifeLife
Real premiums growth
Growth rate 2018EAnnual average growth rate 2008ndash2017
Outlook annual average growth 2019ndash2020F
0
1
2
3Non-LifeLife
2018E2010200019901980
Insurance penetration
Non-lifeLife
Swiss Re Institute sigma No 32019 29
Latin America amp Caribbean slow recovery aheadLifeIn 2018 life premiums in Latin American and the Caribbean contracted by 42 after a 01 decline in 2017 The sharp contraction was due to weak demand for savings-related products in Brazil and Colombia The Brazilian life insurance market accounts for 55 of the regional aggregate and the decline in demand for the unit-linked VGBL products more than offset positive growth in mortality-related products The overall premium contraction in Brazil was 75 In Mexico premiums grew by 35 despite the recent soft economic patch and the Argentine market contracted 11 due to the strong effects from high levels of inflation (up 19 in nominal terms)
We expect demand for mortality-related products to remain strong in 201920 as economies in the region continue to improve Growth in savings type-products will be hindered by historically low-interest rates in some countries but will be supported in certain pockets by specific fiscal policy changes For example in Argentina the government has unveiled tax deductions for both individuals and employers in an attempt to increase the savings rate and make insurance a bigger driver of the economy In Colombia on the other hand new taxes on life insurance from recently proposed legislation will likely do the opposite Meanwhile in Mexico life insurers stand to benefit from currently higher interest rates However President Andreacutes Manuel Loacutepez Obradorrsquos austerity measures will likely cut close to 2 of life market premiums as he scales back certain life cover benefits for federal employees
Non-lifeNon-life premiums were flat in real terms (05) in Latin America and the Caribbean due to weaker economic growth in Brazil Argentina and Mexico As a general trend demand for health and medex-related premiums is strengthening across the region while property casualty and specialty lines of business have moderated In Brazil robust growth in voluntary motor insurance was offset by a drop in mandatory motor premium volumes due to a decrease of the regulated rate In Mexico non-life premiums grew by 31 in 2018 with a 64 boost from accident amp health business Underwriting results in Mexico improved notably from the previous year due to the base effect of the large earthquakes in 2017 In Colombia premium growth accelerated in tandem with the economy We expect Colombia will continue to outperform regional peers Profitability however was hurt by claims related to the flooding at the Hidroituango dam the countrys largest hydroelectric project
We expect growth in the non-life premiums to return to historical levels (close to 35) by the end of 2020 depending on the pace of the economic recovery Demand for health insurance will remain strong in 2019 despite a return to more moderate growth rates in Chile and Peru (from double-digit growth rates last year) and we think the health segment will grow faster than most other non-life lines of business In Brazil growth will be driven by property and specialty while motor premiums will continue to be affected by cuts in the regulated rate In Mexico the still unratified US-Mexico-Canada (USMCA) trade deal23 continues to cloud the investment outlook which delays FDI inflows and large-scale projects The USMCA could weigh on specialty-related business like engineering and marine insurance In Argentina the high inflation environment is restricting premium growth
23 The USMCA is the revised version of the North America Free Trade Agreement (NAFTA)
We forecast a return to growth in the life sector in Latin America after weak demand for savings-related products in key markets led to contraction in 2018
Non-life premium growth remained flat in 2018 We forecast a return to trend over the next two years
Latin America amp Caribbean premiums 2018E
USD bnWorld
market shareLife 71 25Non-life 92 39
ndash6
ndash4
ndash2
0
2
4
6
8
Non-lifeLife
Real premiums growth
Growth rate 2018EAnnual average growth rate 2008ndash2017
Outlook annual average growth 2019ndash2020F
00
05
10
15
20Non-LifeLife
2018E2010200019901980
Insurance penetration
Non-lifeLife
30 Swiss Re Institute sigma No 32019
Regional review 2018 and outlook
Emerging Europe and Central Asia outlook positiveLifeLife premium growth in Emerging Europe and Central Asia slowed to 34 in 2018 after a strong expansion of 13 in the previous year The slowdown was due to disappointing performance in the European Union member countries of Central and Eastern Europe (EU-CEE) In Hungary premiums grew marginally (05) but in Czech Republic premiums contracted (‒39) and in Poland they slumped strongly (‒19) due to weakness in unit linked products Meanwhile premiums in Russia were up a strong 33 with high demand for loans and mortgages driving related life insurance products In Turkey life premiums fell 13 after two strong years of expansion (gt20) due to poor performance of credit-linked business which has traditionally been the key driver of life insurance there
The outlook for the region looks promising We expect life premium growth over next five years to be many fold higher than that seen over last 10 years A rebound in Poland will be the main driver The introduction of a voluntary retirement savings scheme the Employee Capital Plan will offer new business opportunities in the coming years for cross selling life insurance products Insurers will be eligible to manage the funds of such plans with first contracts to be signed by November 201924 We forecast that premiums in Russia will moderate as the market for investment linked products becomes saturated Moreover as of 1 April the Bank of Russia tightened rules on the sale of investment linked and universal life insurance products to bring more pricing transparency Similarly in Hungary new regulations on unit-linked products will increase insurersrsquo obligations to provide clearer information In Turkey the near-term outlook is clouded by expectations of economic weakness
Non-lifeNon-life premiums in Emerging Europe and Central Asia grew by 42 in 2018 more than double the 16 growth rate of 2017 PampC premium growth in 2018 was bolstered by more vibrant economic activity particularly in EU-CEE countries like Poland Hungary and the Czech Republic PampC insurers in Poland managed a bumper improvement in technical underwriting results (+43) as the improved pricing and risk management in motor of previous years began to pay off and because there were fewer natural catastrophes in 2018 In Russia last year saw the fastest expansion of non-life premiums in the last six years (54) as a rise in car sales and a drop in the average rate allowed for a 21 increase in the number of new contracts With paid claims remaining fairly stable profitability improved significantly In Turkey non-life premiums almost stagnated (07) as a significant drop in car sales dragged on motor premiums offsetting a strong expansion in other lines of business
We forecast non-life premium growth of around 4 over each of the next two years In EU-CEE countries we expect real premium growth to slow to trend in line with a gradual slowdown in economic activity In Poland slower yet still-strong GDP growth should support premium growth in 201920 In Russia we expect further expansion in premiums supported by MTPL liability and property lines In Hungary premiums are expected to continue to grow In Turkey we expect a contraction as the near- term economic backdrop is challenging In the long-run however the insurance sector remains attractive because of energy infrastructure and new projects undertaken or planned in line with the 2023 Vision
24 Companies with gt250 employees obliged to sign contracts by November 2019 subsequent phased inclusion companies with gt50 employees by May 2020 gt20 employees by November 2020 other enterprises and the public financial sector units by May 2021
A rebound in Poland will be the main driver of a return to positive life premium growth in Emerging Europe and Central Asia
Positive momentum in non-life premium growth is set to continue after a notable improvement in 2018
Emgerging Europe and Central Asia 2018E
USD bnWorld
market shareLife 22 08Non-life 59 25
0
1
2
3
4
5
6
7
8
9
Non-lifeLife
Real premiums growth
Growth rate 2018EAnnual average growth rate 2008ndash2017
Outlook annual average growth 2019ndash2020F
00
05
10
15
20Non-LifeLife
2018E2010200019901980
Insurance penetration
Non-lifeLife
Swiss Re Institute sigma No 32019 31
Emerging Middle East and Africa struggling to gain tractionLifePremium growth in the Middle East and Africa (MEA) remained weak in 2018 amid still challenging economic conditions and a competitive environment Even so the 15 growth was an improvement from the stagnation of the previous two years In the Middle East weak economic growth and a shrinking expat population led to slower premium growth in the UAE (43) the largest market and a decline in Saudi Arabia (‒20) In contrast growth improved in Pakistan with products distributed by banks performing well In Africa the largest market South Africa stagnated on the back of a weak macro environment and persistent high unemployment which impacted the middle-income segment in particular The strongest growth in Africa was led by Morocco where savings products boosted growth while protection products grew only moderately The Nigerian life market is estimated to have registered higher growth Several smaller countries also showed solid performance In Kenya however things came to a halt after a multi-year growth spell as traditional life products stalled Weaker sales in many markets weighed on sector profitability
With a weak economic environment in the Middle East and in South Africa the outlook for insurance markets looks clouded We expect life premium growth in 201920 to improve slightly from 2018 The weak outlook applies particularly to the oil exporting markets South Africa by far the most sophisticated and accounting for 70 of the region premium volume is also struggling with weak economic fundamentals and severe structural issues that will hold back growth opportunities even though there is large potential to expand life insurance up take among the low income population
Non-lifePremiums contracted by 13 in 2018 reflecting the still weak economic environment in many markets We expect premium growth will resume over the next two years but that it will fall short of the long-term average The two largest markets in the Middle East (Saudi Arabia and the UAE) contracted last year Health insurance still contributes positively but increased competition and liberalisation of motor rates led to declining premium volumes overall The South African market is estimated to have stagnated However growth was stronger in many smaller markets (eg Pakistan Cocircte drsquoIvoire or Uganda) In Nigeria early estimates indicate that the market has expanded for the first time since 2011 as the economy gradually gets up to speed
We expect market conditions to remain challenging over the next two years both in terms of top-line growth as well as profitability given economic weakness and strong competition In Africa non-resource intensive countries are expected to grow more strongly In many markets medical insurance infrastructure developments and low insurance penetration levels will provide stimulus over the longer term In Pakistan a national health insurance scheme is currently being implemented Following the example of other markets this will help develop the scope of insurance In the UAE an infrastructure spending plan will provide some support for the commercial lines On the other hand price pressure remains high in motor and in health lines of business across the MEA region
Growth was weak in key markets last year and we see little improvement in 201920
Non-life premium growth in the region will remain below trend
Emerging Middle East and Africa 2018E
USD bnWorld
market shareLife 54 19Non-life 56 24
ndash2
ndash1
0
1
2
3
4
5
6
Non-lifeLife
Growth rate 2018EAnnual average growth rate 2008ndash2017
Real premiums growth
Outlook annual average growth 2019ndash2020F
00
05
10
15
20Non-LifeLife
2018E2010200019901980
Insurance penetration
Non-lifeLife
32 Swiss Re Institute sigma No 32019
Methodology and data
This sigma study is based on the direct premium volumes of insurance companies regardless of whether they are privately or state owned Premiums paid to state social insurers are not included Life and non-life premium volume in 147 countries is examined Detailed information on the largest 88 countries in terms of total insurance premium volume can be found in the statistical appendix Additional country information is available online at wwwsigma-explorercom Where not indicated figures and chart information in this report are all sourced from Swiss Re Institute
Unless otherwise stated premium growth rates indicate changes in real terms These real growth rates are calculated using premiums in local currencies and are adjusted for inflation using the consumer price index for each country The statistical appendix also provides the nominal change in growth for each country Regional aggregated growth rates are calculated using the previous yearrsquos premium volumes and converted into US dollars at market exchange rates The same procedure applies to the economic aggregates of Table X where the previous yearrsquos nominal GDP figures in US dollars are used as weights Real growth rates are used to cancel out exchange rate movements while facilitating international comparisons particularly between high and low inflation countries
Using the average exchange rate for the financial year premium volumes are converted into US dollars to facilitate comparisons between markets and regions25 Where no premium data is available (indicated by ldquonardquo for the local currency value in the tables) the premium income in US dollars is estimated assuming a constant ratio of insurance premiums to GDP Regional growth rates are calculated using a weighted average of the real growth rates of the individual countries The weighting is based on the relevant premiums of the previous year in USD
The designation of the economies in this sigma as ldquoadvancedrdquo or ldquoemergingrdquo is generally in keeping with the conventions of the International Monetary Fund (IMF) Advanced economies include the US Canada Western Europe (excluding Turkey) Israel Oceania Japan and the other advanced Asian economies (Hong Kong Singapore South Korea and Taiwan) All other countries are classified as ldquoemergingrdquo and generally correspond to the IMFrsquos ldquoemerging and developingrdquo economies26
The insurance data and estimates contained in the study originate primarily from national supervisory authorities and in some cases from insurance associations Macroeconomic data was sourced from the International Financial Statistics of the IMF Oxford Economics and IHS Markit
Figures for past years are adjusted as new information becomes available Since the publication of last yearrsquos sigma global premium volume for 2017 has been revised up by 13 overall Life insurance premium volume was revised up by 25 while non-life premiums are unchanged
This report is based on information concerning the premiums written for direct business by all registered insurers This means
1 Direct insurance premiums including commissions and other charges are considered prior to cession to a reinsurance company
2 Domestic insurers ndash regardless of their ownership ndash and domestic branches of foreign insurers are regarded as domestically domiciled business units By contrast business undertaken by the foreign branches of domestic insurers is not regarded as domestic business
25 In Egypt India Iran Japan South Korea and Malaysia the financial year is not the same as the calendar year Precise details about the differences in dates are given in the notes to the statistical appendix
26 The only exceptions are the Czech Republic Estonia Latvia Lithuania Slovenia and Slovakia
This study looks at insurance premium volumes data from 147 countries
All quoted growth rates are in real terms ie adjusted for local inflation to facilitate international comparison
Figures are converted into US dollars at running annual average market exchange rates
Country classifications generally follow IMF conventions
Data sources
Data revisions
Definition of premium income
Swiss Re Institute sigma No 32019 33
3 Business that has been written in the domestic market includes premiums for cover of domestic risks as well as those covering foreign risks as long as they are written by domestic insurers (cross-border business)
Life and non-life business areas in this sigma study are categorised according to standard EU and OECD conventions health insurance is allocated to non-life insurance even if it is classified differently in the individual countries
Only premium income from domestic risks is used to calculate insurance penetration and density Cross-border business is not included This has a significant effect in Belgium France Liechtenstein Luxembourg Ireland Malta Norway Singapore or the UK
The statistical appendix contains additional calculations and the macroeconomic data used for currency conversions
The sigma editorial team would like to thank the supervisory authorities associations and companies that helped with data compilation
Health insurance is allocated to non-life business
Density and penetration do not include cross-border business
Statistical appendix
Acknowledgements
34 Swiss Re Institute sigma No 32019
Statistical appendix
1 Excluding cross-border business
2 Insurance penetration (premiums as a percentage of GDP) and density (premiums per capita) include cross-border business
3 US and Canada advanced EMEA advanced Asia-Pacific
4 Latin America and Caribbean Emerging Europe and Central Asia Emerging Middle East Africa Emerging Asia
5 34 member countries
6 The US Canada the UK Germany France Italy Japan
7 The US Canada Mexico
8 Singapore Malaysia Thailand Indonesia the Philippines Vietnam The four remaining member countries ndash Brunei Cambodia Laos and Myanmar ndash are not included
9 Life insurance premiums are supplemented by estimated premiums for group pension business which has not been included in the statistics for some regions since 2001 Non-life insurance includes state funds
10 Life insurance net premiums
11 Non-life insurance gross premiums including reinsurance premiums
12 Financial year 1 April 2018 ndash 31 March 2019
13 Financial year 21 March 2018 ndash 20 March 2019
14 Financial year 1 July 2017 ndash 30 June 2018
15 Inflation-adjusted premium growth rates in local currency see Tables II IV and VI
16 Including the remaining countries
17 Effective Inflation used for calculating real growth rates are estimated by the Institute for International Finance These are twice the official figures
18 Supervisory authority data for 2013 does no longer report premiums written by public insurers Retrospectively starting 2003 public insurer data has been removed from the sigma data set and the data has been changed to calendar year data Prior 2003 financial year is from 1 July ndash 30 June ie 2002 stands for data from 1 July 2002 ndash 30 June 2003
+ provisional estimated estimated USD value assuming constant insurance penetration
Swiss Re Institute sigma No 32019 35
Table I Premium volume by region and organisation
Premium volume Change (in ) Share of world Premiums1 Premiums1 per(in millions of USD) inflationndashadjusted market (in ) in of GDP capita (in USD)
Total business 2018E 2017 2018E 2017 2018E 2018E 2018E
America 1 759 800 1 688 467 21 15 3389 626 1 738US and Canada 1 597 278 1 520 403 26 16 3076 717 4 377Latin America and Caribbean 162 522 168 064 ‒17 02 313 279 251
Europe Middle East and Africa (EMEA) 1 750 915 1 653 824 02 35 3372 570 602Advanced EMEA 1 560 937 1 469 732 01 37 3006 761 3 276CEE Turkey and Central Asia 80 261 76 752 39 44 155 174 164Middle East and Africa 109 718 107 341 00 05 211 221 63
Emerging Middle East 41 335 42 176 ndash15 348 080 155 86Africa 68 383 65 165 09 ndash15 132 298 54
Asia-Pacific 1 682 510 1 615 216 21 47 3240 575 407Advanced Asia-Pacific 927 922 904 535 13 ndash16 1787 970 3 603Emerging Asia-Pacific 754 588 710 681 31 140 1453 383 195
China 574 877 541 446 18 164 1107 422 406Emerging Asia-Pacific excl China 179 711 169 235 82 64 346 296 73
World 2 5 193 225 4 957 507 15 32 10000 609 682Advanced markets 3 4 086 137 3 894 670 13 16 7868 781 3 737Emerging markets 4 1 107 088 1 062 838 21 96 2132 318 169
Emerging Markets excl China 532 211 521 391 27 29 1025 248 100OECD 5 3 940 342 3 757 656 13 12 7587 724 2 922G7 6 3 044 157 2 895 657 16 17 5862 770 3 897Eurozone 1 052 790 984 374 02 06 2027 699 2 798EU 1 495 793 1 405 664 00 39 2880 726 2 655NAFTA 7 1 624 622 1 546 072 26 16 3128 691 3 276ASEAN 8 106 551 99 482 48 78 205 352 159
Life business
America 718 003 695 120 16 ndash04 2546 255 709US and Canada 647 461 617 886 23 ndash04 2296 291 1 774Latin America and Caribbean 70 542 77 234 ndash42 ndash01 250 121 109
Europe Middle East and Africa (EMEA) 1 009 326 955 683 ‒04 42 3579 331 349Advanced EMEA 934 036 884 289 ndash06 44 3312 460 1 978CEE Turkey and Central Asia 21 686 20 652 34 130 077 047 44Middle East and Africa 53 604 50 742 15 ndash15 190 108 31
Emerging Middle East 7 296 7 240 31 637 026 027 15Africa 46 307 43 502 13 ndash29 164 202 36
Asia-Pacific 1 092 846 1 073 214 ‒01 53 3875 374 265Advanced Asia-Pacific 649 855 632 264 14 ndash14 2304 681 2 530Emerging Asia-Pacific 442 990 440 950 ndash23 166 1571 225 115
China 313 365 317 570 ndash54 211 1111 230 221Emerging Asia-Pacific excl China 129 625 123 380 70 58 460 214 53
World 2 2 820 175 2 724 017 02 34 10000 331 370Advanced markets 3 2 231 352 2 134 439 08 12 7912 427 2 042Emerging markets 4 588 822 589 578 ndash20 125 2088 169 90
Emerging Markets excl China 275 457 272 008 25 32 977 128 52OECD 5 2 073 543 1 985 361 06 04 7353 380 1 534G7 6 1 604 059 1 529 092 13 14 5688 411 2 080Eurozone 592 038 556 095 ndash05 ndash08 2099 379 1 518EU 891 026 843 451 ndash08 47 3159 436 1 592NAFTA 7 659 599 629 251 23 ndash04 2339 281 1 330ASEAN 8 75 776 71 201 42 98 269 256 116
Nonndashlife business
America 1 041 796 993 347 25 28 4390 371 1 029US and Canada 949 817 902 517 27 30 4003 426 2 603Latin America and Caribbean 91 979 90 830 05 05 388 158 142
Europe Middle East and Africa (EMEA) 741 589 698 142 11 24 3125 240 253Advanced EMEA 626 900 585 443 11 27 2642 302 1 298CEE Turkey and Central Asia 58 575 56 100 42 16 247 127 120Middle East and Africa 56 114 56 598 ndash13 07 236 113 32
Emerging Middle East 34 038 34 936 ndash20 038 143 127 71Africa 22 076 21 662 00 14 093 096 17
Asia-Pacific 589 665 542 001 64 36 2485 201 142Advanced Asia-Pacific 278 067 272 271 12 ndash20 1172 289 1 073Emerging Asia-Pacific 311 598 269 731 117 99 1313 158 81
China 261 512 223 876 120 102 1102 192 185Emerging Asia-Pacific excl China 50 086 45 855 106 81 211 083 20
World 2 2 373 050 2 233 490 30 29 10000 278 312Advanced markets 3 1 854 785 1 760 231 19 21 7816 354 1 694Emerging markets 4 518 266 473 260 71 59 2184 149 79
Emerging Markets excl China 256 754 249 384 28 21 1082 120 48OECD 5 1 866 799 1 772 295 20 21 7867 344 1 387G7 6 1 440 098 1 366 565 20 20 6069 359 1 817Eurozone 460 752 428 280 10 22 1942 320 1 281EU 604 767 562 213 12 27 2548 291 1 063NAFTA 7 965 023 916 821 27 31 4067 410 1 946ASEAN 8 30 775 28 281 63 31 130 096 43
36 Swiss Re Institute sigma No 32019
Table II Total premium volume in local currency
Premium volume Change (in ) Change (in )(in millions of local currency) nominal inflationndashadjusted
Country Currency 2018E 2017 2016 2018E 2017 2018E 2017North America United States 9 USD 1 469 375 1 399 222 1 349 938 50 37 25 15
Canada 10 CAD 165 773 157 286 150 229 54 47 31 30Total 26 16
Latin America and Caribbean Brazil BRL 266 123 266 047 253 517 00 49 ndash35 14Mexico MXN 525 752 485 361 446 955 83 86 33 24Chile CLP 8 724 619 8 385 636 8 301 193 40 10 13 ndash16Argentina 17 ARS 337 079 272 217 211 027 238 290 ndash79 36Colombia COP 27 268 340 26 003 160 23 849 420 49 90 16 45Venezuela VEF na 3 820 113 871 509 na 3383 na ndash682Peru PEN 12 869 11 327 11 256 136 06 121 ndash21Ecuador USD 1 693 2 046 1 618 ndash173 264 ndash171 259Panama PAB 1 570 1 444 1 359 87 62 79 53Uruguay UYU 45 787 45 207 38 531 13 173 ndash59 105Costa Rica CRC 771 902 749 330 654 715 30 145 08 126Dominican Republic DOP 59 562 49 354 40 589 207 216 164 177Trinidad and Tobago TTD 7 892 7 671 8 149 29 ndash59 18 ndash76Guatemala GTQ na 6 802 6 313 na 77 na 32Bahamas BSD na 754 728 na 36 na 22Jamaica JMD na na na na na na naCayman Islands KYD na 579 598 na ndash32 na ndash32Total 01 ndash04
Advanced EMEA United Kingdom GBP 251 943 248 251 213 103 15 165 ndash10 134France EUR 218 381 216 319 214 168 10 10 ndash09 00Germany EUR 204 431 201 104 194 114 17 36 ndash01 21Italy EUR 144 146 140 993 138 885 22 15 11 03Netherlands EUR 71 405 70 703 70 193 10 07 ndash07 ndash06Spain EUR 62 698 + 62 397 62 937 05 ndash09 ndash12 ndash28Ireland EUR na na 53 587 na na na naSwitzerland CHF 58 071 57 282 57 796 14 ndash09 04 ndash14Belgium EUR 31 536 29 847 29 759 57 03 35 ndash18Sweden SEK 322 570 312 858 287 866 31 87 11 68Denmark DKK 229 790 223 577 210 858 28 60 19 48Luxembourg EUR 27 820 26 738 24 738 40 81 25 59Finland EUR 23 021 22 640 22 335 17 14 06 06Norway NOK 171 366 163 361 162 264 49 07 21 ndash12Austria EUR 17 263 17 100 17 006 10 06 ndash10 ndash15Israel ILS 66 640 62 730 58 153 62 79 54 76Portugal EUR 13 144 11 724 10 981 121 68 110 53Liechtenstein CHF na 5 170 3 560 na 452 na 445Malta EUR na 4 153 3 844 na 80 na 67Greece EUR 4 049 3 965 3 887 21 20 15 09Cyprus EUR na 814 + 765 na 64 na 57Total 01 37
Emerging EMEA South Africa ZAR 639 051 609 559 602 332 48 12 02 ndash39Russia RUB 1 478 406 1 277 585 1 180 632 157 82 125 44Poland PLN 59 858 60 340 54 090 ndash08 116 ndash26 94United Arab Emirates 11 AED 45 770 44 824 40 009 21 120 ndash09 99Turkey TRY 50 415 43 978 39 496 146 113 ndash15 02Saudi Arabia SAR 35 487 36 503 36 855 ndash28 ndash10 ndash52 ndash01Iran 13 IRR 361 403 600 311 254 500 280 176 000 161 111 ndash50 13Czech Republic CZK 153 571 148 587 146 866 34 12 12 ndash12Morocco MAD 42 964 38 736 34 920 109 109 89 101Hungary HUF 1 024 089 956 006 875 065 71 92 42 68Qatar QAR na na na na na na naSlovenia EUR 2 341 2 179 2 033 74 72 56 57Pakistan PKR 320 907 275 607 258 281 164 67 108 25Slovakia EUR 2 204 2 134 1 903 33 121 08 107Romania RON 9 915 9 707 9 387 21 34 ndash24 20Kenya KES 216 016 + 207 587 195 230 41 63 ndash06 ndash15Ukraine UAH 48 283 43 432 35 170 112 235 02 79Lebanon LBP 2 417 985 2 294 103 2 368 686 54 ndash31 ndash06 ndash73Egypt 14 EGP 28 002 23 964 18 151 168 320 ndash33 69Croatia HRK 9 856 9 056 8 761 88 34 72 22Bulgaria BGN 2 472 + 2 141 2 005 154 68 123 46Kuwait KWD 394 339 265 161 279 154 259Nigeria NGN 423 844 355 294 308 062 193 153 64 ndash10Algeria DZD 138 258 135 760 130 973 18 37 ndash24 ndash18Oman OMR 429 409 412 50 ndash07 40 ndash23Kazakhstan KZT 350 482 332 012 323 176 56 27 ndash04 ndash44Namibia NAD 13 360 12 790 11 226 45 139 00 73Serbia RSD 97 958 93 094 89 138 52 44 32 13Jordan JOD 636 594 582 71 20 24 ndash13Tunisia TND na 2 072 1 840 na 126 na 69Zimbabwe USD 735 642 601 144 69 35 59Bahrain BHD 272 269 272 13 ndash12 ndash08 ndash26Total 16 21
Advanced Asia-Pacific Japan 12 JPY 48 628 770 47 037 670 48 905 440 34 ‒38 26 ‒45South Korea 12 KRW 198 970 000 201 254 900 203 250 300 ‒11 ‒10 ‒25 ‒26Taiwan TWD 3 677 170 3 576 944 3 279 319 28 91 14 84Australia 20 AUD 105 931 105 260 111 278 06 ‒54 ‒13 ‒72Hong Kong HKD 516 573 + 477 044 441 084 83 82 57 66Singapore SGD 41 286 + 39 952 34 199 33 168 29 162New Zealand 15 NZD 15 091 14 345 13 609 52 54 35 35Total 13 ndash16
Emerging Asia-Pacific PR China CNY 3 801 663 + 3 658 101 3 095 911 39 182 18 164India 12 INR 6 958 245 6 122 471 5 494 467 137 114 93 78Thailand THB na 812 194 780 065 na 41 na 34Indonesia IDR 290 061 300 273 085 800 252 511 000 62 81 29 42Malaysia 12 MYR 68 161 64 242 61 248 61 49 55 16Philippines PHP 316 915 282 386 253 301 122 115 67 84Vietnam VND 134 366 200 107 820 000 87 362 000 246 234 204 192Bangladesh BDT 128 565 113 425 102 972 133 102 73 42Sri Lanka LKR na na 137 458 na na na naTotal 31 140
World 15 32
Swiss Re Institute sigma No 32019 37
Table III Total premium volume in USD
Premium volume Change (in ) 2018 Share of (in millions of USD) nominal inflation- world market
Ranking Country 2018E 2017 (in USD) adjusted 2018E (in )North America 1 United States 10 1 469 375 1 399 222 50 25 2829
9 Canada 11 127 903 121 181 55 31 246Total 1 597 278 1 520 403 51 26 3076
Latin America and Caribbean 16 Brazil 72 840 83 351 ndash126 ndash35 14025 Mexico 27 344 25 669 65 33 05336 Chile 13 606 12 924 53 13 02638 Argentina 17 12 119 16 435 ndash263 ndash79 02342 Colombia 9 295 8 811 55 16 01843 Venezuela 7 764 1 709 3542 na 01552 Peru 3 916 3 474 127 121 00861 Ecuador 1 693 2 046 ndash173 ndash171 00365 Panama 1 570 1 444 87 79 00368 Uruguay 1 490 1 576 ndash55 ndash59 00369 Costa Rica 1 347 1 331 12 08 00372 Dominican Republic 1 204 1 038 160 164 00274 Trinidad and Tobago 1 169 1 132 33 18 00281 Guatemala 969 926 46 na 00284 Bahamas 783 754 38 na 00285 Jamaica 779 745 45 na 00187 Cayman Islands 725 695 44 na 001
Other countries 3 909 4 005 008Total 162 522 168 064 ndash33 ndash17 313
Advanced EMEA 4 United Kingdom 336 510 319 992 52 ndash10 6485 France 257 963 244 362 56 ndash09 4976 Germany 241 485 227 174 63 ndash01 4658 Italy 170 273 159 271 69 11 328
12 Netherlands 84 348 79 869 56 ndash07 16214 Spain 74 062 + 70 486 51 ndash12 14315 Ireland 73 162 64 812 129 na 14118 Switzerland 59 384 58 173 21 04 11420 Belgium 37 253 33 716 105 35 07221 Sweden 37 092 36 621 13 11 07122 Denmark 36 393 33 871 74 19 07023 Luxembourg 32 862 30 149 90 25 06326 Finland 27 194 25 575 63 06 05229 Norway 21 077 19 756 67 21 04130 Austria 20 392 19 317 56 ndash10 03932 Israel 18 662 17 427 71 54 03635 Portugal 15 527 13 243 172 110 03048 Liechtenstein 5 542 5 250 56 na 01149 Malta 5 344 4 691 139 na 01050 Greece 4 783 4 479 68 15 00978 Cyprus 1 015 920 + 103 na 002
Other countries 612 577 001Total 1 560 937 1 469 732 62 01 3006
Emerging EMEA 19 South Africa 48 269 45 770 55 02 09328 Russia 23 593 21 898 77 125 04534 Poland 16 574 15 970 38 ndash26 03237 United Arab Emirates 11 12 461 12 204 21 ndash09 02439 Turkey 10 452 12 054 ndash133 ndash15 02041 Saudi Arabia 9 463 9 734 ndash28 ndash52 01844 Iran 13 7 688 9 054 ndash151 ndash50 01545 Czech Republic 7 067 6 356 112 12 01451 Morocco 4 579 3 997 146 89 00953 Hungary 3 790 3 484 88 42 00754 Qatar 3 038 2 941 33 na 00655 Slovenia 2 765 2 462 123 56 00556 Pakistan 2 636 2 614 09 108 00557 Slovakia 2 603 2 410 80 08 00558 Romania 2 515 2 395 50 ndash24 00559 Kenya 2 134 + 2 007 63 ndash06 00460 Ukraine 1 774 1 633 87 02 00362 Lebanon 1 604 1 522 54 ndash06 00363 Egypt 14 1 579 1 618 ndash24 ndash33 00364 Croatia 1 570 1 367 148 72 00367 Bulgaria 1 492 + 1 234 209 123 00370 Kuwait 1 307 1 119 168 154 00371 Nigeria 1 220 1 162 50 64 00273 Algeria 1 189 1 223 ndash28 ndash24 00275 Oman 1 116 1 063 50 40 00277 Kazakhstan 1 018 1 018 00 ndash04 00279 Namibia 1 009 960 51 00 00280 Serbia 978 864 132 32 00282 Jordan 895 836 71 24 00283 Tunisia 870 856 16 na 00286 Zimbabwe 735 642 144 35 00188 Bahrain 724 715 13 ndash08 001
Other countries 11 269 10 910 022Total 189 978 184 093 32 16 366
Advanced Asia-Pacific 3 Japan 12 440 648 424 454 38 26 8497 South Korea 12 179 024 181 238 ndash12 ndash25 345
10 Taiwan 121 908 117 495 38 14 23513 Australia 18 79 098 80 688 ndash20 ndash13 15217 Hong Kong 65 912 + 61 220 77 57 12724 Singapore 30 609 + 28 931 58 29 05940 New Zealand 14 10 406 10 192 21 35 020
Other countries 318 317 001Total 927 922 904 535 26 13 1787
Emerging Asia-Pacific 2 PR China 574 877 + 541 446 62 18 110711 India 12 99 838 94 998 51 93 19227 Thailand 26 622 23 932 112 na 05131 Indonesia 20 383 20 411 ndash01 29 03933 Malaysia 12 16 634 15 408 80 55 03246 Philippines 6 018 5 602 74 67 01247 Vietnam 5 839 4 749 230 204 01166 Bangladesh 1 540 1 410 92 73 00376 Sri Lanka 1 026 1 008 18 na 002
Other countries 1 811 1 716 003Total 754 588 710 681 62 31 1453
World World 5 193 225 4 957 507 48 15 10000
38 Swiss Re Institute sigma No 32019
Table IV Life insurance premium volume in local currency
Premium volume(in millions of local currency)
Change (in )nominal
Change (in )inflation-adjusted
Country Currency 2018E 2017 2016 2018E 2017 2018E 2017North America United States 9 USD 593 391 565 822 557 604 49 15 24 ndash06
Canada 10 CAD 70 079 67 576 64 885 37 41 14 25Total 23 ndash04
Latin America and Caribbean Brazil BRL 143 405 149 617 142 887 ndash42 47 ndash75 12Mexico MXN 233 378 214 897 209 111 86 28 35 ndash31Chile CLP 5 268 460 5 085 597 5 263 465 36 ndash34 09 ndash59Colombia COP 8 584 598 8 473 745 7 493 560 13 131 ndash19 84Peru PEN 6 272 5 356 5 113 171 47 156 19Argentina 17 ARS 48 951 41 011 34 664 194 183 ndash112 ndash50Uruguay UYU 18 196 19 075 14 707 ndash46 297 ndash114 221Trinidad and Tobago TTD 3 543 3 477 3 867 19 ndash101 08 ndash117Ecuador USD 416 431 347 ndash35 244 ndash33 239Panama PAB 392 371 342 56 85 48 75Jamaica JMD na na na na na na naCosta Rica CRC 123 926 111 184 101 881 115 91 91 74Guatemala GTQ na 1 418 1 271 na 115 na 68Bahamas BSD na 189 204 na ndash75 na ndash87Dominican Republic DOP 9 513 8 480 7 453 122 138 82 102Venezuela VEF na 94 435 20 453 na 3617 na ndash665Cayman Islands KYD na 23 24 na ndash49 na ndash49Total ndash42 ndash01
Advanced EMEA United Kingdom GBP 176 318 174 829 144 386 09 211 ndash16 179France EUR 139 746 139 195 137 796 04 10 ndash14 00Italy EUR 106 108 103 919 102 353 21 15 10 03Germany EUR 81 641 81 705 81 978 ndash01 ndash03 ndash18 ndash18Ireland EUR na na 46 301 na na na naSpain EUR 28 883+ 29 407 31 136 ndash18 ndash56 ndash34 ndash74Switzerland CHF 29 771 29 591 30 667 06 ndash35 ndash03 ndash40Luxembourg EUR 23 779 23 276 21 412 22 87 06 65Sweden SEK 234 828 229 266 207 815 24 103 05 84Denmark DKK 167 716 164 207 153 101 21 73 13 60Finland EUR 18 783 18 403 18 004 21 22 10 15Belgium EUR 15 841 14 668 14 909 80 ndash16 58 ndash37Netherlands EUR 13 327 13 668 14 568 ndash25 ndash62 ndash41 ndash75Norway NOK 98 690 93 066 92 421 60 07 32 ndash12Israel ILS 35 963 33 722 30 670 66 100 58 97Portugal EUR 8 246 7 172 6 729 150 66 139 51Austria EUR 5 593 5 802 6 109 ndash36 ndash50 ndash55 ndash70Liechtenstein CHF 2 340 2 380 2 310 ndash17 30 ndash26 25Greece EUR 1 868 1 875 1 911 ndash04 ndash19 ndash10 ndash30Malta EUR na 1 366 1 265 na 80 na 67Cyprus EUR na 348+ 323 na 78 na 70Total ndash06 44
Emerging EMEA South Africa ZAR 509 384 485 128 485 611 50 ndash01 04 ndash51Russia RUB 452 400 331 537 215 740 365 537 326 482Poland PLN 15 786 19 028 18 394 ndash170 35 ndash185 14United Arab Emirates 11 AED 10 484 9 756 8 580 75 137 43 115Czech Republic CZK 56 231 57 261 59 240 ndash18 ndash33 ndash39 ndash57Morocco MAD 20 149 16 985 14 294 186 188 165 179Pakistan PKR 234 096 199 385 180 000 174 108 117 64Hungary HUF 474 075 458 448 436 986 34 49 05 25Turkey TRY 6 835 6 767 4 963 10 363 ndash132 227Iran (13) IRR 47 500 000 43 245 520 37 961 000 98 139 ndash101 39Slovakia EUR 830 846 712 ndash19 188 ndash43 173Kenya KES 87 168+ 82 808 73 519 53 126 05 43Slovenia EUR 717 654 576 97 135 78 119Namibia NAD 9 566 9 076 7 704 54 178 09 110Egypt 14 EGP 12 010 10 178 8 325 180 223 ndash24 ndash10Nigeria NGN 190 700 152 560 123 554 250 235 115 60Lebanon LBP 790 659 750 151 727 844 54 31 ndash06 ndash14Romania RON 1 986 1 937 1 592 25 217 ndash20 201Croatia HRK 3 134 2 940 2 918 66 07 50 ndash04Zimbabwe USD 459 406 385 130 54 22 45Saudi Arabia SAR 1 146 1 140 1 051 05 85 ndash20 94Kazakhstan KZT 89 207 66 199 55 735 348 188 271 105Serbia RSD 22 701 21 385 21 837 62 ndash21 41 ndash50Bulgaria BGN 341+ 370 362 ndash79 23 ndash104 03Tunisia TND na 443 375 na 181 na 121Kuwait KWD 49 44 48 113 ndash89 107 ndash103Oman OMR 60 56 63 69 ndash112 59 ndash126Ukraine UAH 3 951 2 914 2 756 356 57 222 ndash76Bahrain BHD 53 52 52 15 15 ndash06 02Jordan JOD 85 80 69 71 149 24 112Algeria DZD 12 213 13 649 11 533 ndash105 183 ndash142 121Qatar QAR na na na na na na naTotal 21 24
Advanced Asia-Pacific Japan 12 JPY 36 886 230 35 343 300 36 201 080 44 ndash24 36 ndash31Taiwan TWD 3 077 995 3 001 760 2 731 353 25 99 12 92South Korea 12 KRW 108 999 200 113 973 500 119 811 300 ndash44 ndash49 ndash57 ndash64Hong Kong HKD 478 175+ 440 915 406 204 85 85 59 70Australia 18 AUD 40 331 42 027 50 713 ndash40 ndash171 ndash58 ndash187Singapore SGD 30 289+ 29 572 24 251 24 219 20 212New Zealand 14 NZD 2 578 2 462 2 362 47 42 30 23Total 14 ndash14
Emerging Asia-Pacific PR China CNY 2 072 286+ 2 145 557 1 744 222 ndash34 230 ndash54 211India 12 INR 5 139 033 4 588 095 4 184 766 120 96 77 61Thailand THB na+ 554 952 532 745 na 42 na 35Indonesia IDR 220 862 800 212 426 900 195 398 000 40 87 07 47Malaysia 12 MYR 47 454 44 448 41 594 68 69 62 36Philippines PHP 219 688 195 111 176 770 126 104 70 73Vietnam VND 87 418 320 66 226 000 50 497 000 320 311 275 267Bangladesh BDT 91 227 81 513 75 063 119 86 59 27Sri Lanka LKR na na 63 715 na na na naTotal ndash23 166
World World 05 14
Swiss Re Institute sigma No 32019 39
Table V Life premium volume in USD
Premium volume Change (in ) 2018 Share of totalbusiness
2018E (in )
Share ofworld market2018E (in )
(in millions of USD) nominal(in USD)
inflation-adjustedRanking Country 2018E 2017
North America 1 United States 9 593 391 565 822 49 24 404 210413 Canada 10 54 070 52 064 39 14 423 192
Total 647 461 617 886 48 23 405 2296Latin America and Caribbean 14 Brazil 39 251 46 874 ndash163 ndash75 539 139
29 Mexico 12 138 11 365 68 35 444 04333 Chile 8 216 7 838 48 09 604 02939 Colombia 2 926 2 871 19 ndash19 315 01046 Peru 1 908 1 642 162 156 487 00748 Argentina 17 1 760 2 476 ndash289 ndash112 145 00659 Uruguay 592 665 ndash110 ndash114 397 00261 Trinidad and Tobago 525 513 23 08 449 00268 Ecuador 416 431 ndash35 ndash33 246 00169 Panama 392 371 56 48 250 00170 Jamaica 309 295 45 na 396 00174 Costa Rica 216 198 95 91 161 00176 Guatemala 202 193 46 na 208 00177 Bahamas 196 189 38 na 251 00178 Dominican Republic 192 178 78 82 160 00179 Venezuela 192 42 3542 na 25 00187 Cayman Islands 29 28 44 na 40 000
Other countries 1 081 1 063 277 004Total 70 542 77 234 ndash87 ndash42 434 250
Advanced EMEA 4 United Kingdom 235 501 225 351 45 ndash16 700 8355 France 165 075 157 239 50 ndash14 640 5856 Italy 125 341 117 391 68 10 736 4449 Germany 96 439 92 297 45 ndash18 399 342
11 Ireland 63 424 56 185 129 na 867 22516 Spain 34 118 + 33 219 27 ndash34 461 12117 Switzerland 30 444 30 052 13 ndash03 513 10819 Luxembourg 28 089 26 246 70 06 855 10020 Sweden 27 003 26 836 06 05 728 09621 Denmark 26 562 24 877 68 13 730 09423 Finland 22 187 20 789 67 10 816 07924 Belgium 18 712 16 569 129 58 502 06626 Netherlands 15 743 15 440 20 ndash41 187 05628 Norway 12 138 11 255 79 32 576 04331 Israel 10 071 9 368 75 58 540 03632 Portugal 9 741 8 101 202 139 627 03535 Austria 6 607 6 554 08 ndash55 324 02342 Liechtenstein 2 393 2 417 ndash10 ndash26 432 00843 Greece 2 206 2 119 42 ndash10 461 00849 Malta 1 758 1 544 139 na 329 00667 Cyprus 434 394 + 103 na 428 002
Other countries 50 47 81 000Total 934 036 884 289 56 ndash06 598 3312
Emerging EMEA 15 South Africa 38 475 36 427 56 04 797 13634 Russia 7 220 5 683 270 326 306 02636 Poland 4 371 5 036 ndash132 ndash185 264 01540 United Arab Emirates 11 2 854 2 656 75 43 229 01041 Czech Republic 2 588 2 450 56 ndash39 366 00944 Morocco 2 147 1 752 225 165 469 00845 Pakistan 1 923 1 891 17 117 729 00750 Hungary 1 754 1 671 50 05 463 00651 Turkey 1 417 1 855 ndash236 ndash132 136 00553 Iran 13 1 010 1 258 ndash197 ndash101 131 00454 Slovakia 981 956 26 ndash43 377 00355 Kenya 861 + 801 76 05 404 00356 Slovenia 847 738 147 78 306 00357 Namibia 723 681 60 09 716 00358 Egypt 14 677 687 ndash14 ndash24 429 00260 Nigeria 549 499 100 115 450 00262 Lebanon 524 498 54 ndash06 327 00263 Romania 504 478 54 ndash20 200 00264 Croatia 499 444 125 50 318 00266 Zimbabwe 459 406 130 22 624 00271 Saudi Arabia 306 304 05 ndash20 32 00172 Kazakhstan 259 203 276 271 255 00173 Serbia 227 198 142 41 232 00175 Bulgaria 206 + 213 ndash35 ndash104 138 00180 Tunisia 186 183 16 na 214 00181 Kuwait 163 145 121 107 124 00182 Oman 156 146 69 59 140 00183 Ukraine 145 110 325 222 82 00184 Bahrain 142 139 15 ndash06 196 00185 Jordan 120 112 71 24 134 00086 Algeria 105 123 ndash146 ndash142 88 00088 Qatar na na na na na na
Other countries 2 892 2 652 257 010Total 75 290 71 394 55 21 396 267
Advanced Asia-Pacific 2 Japan 12 334 243 318 928 48 36 759 11857 Taiwan 102 044 98 602 35 12 837 3628 South Korea 12 98 072 102 637 ndash44 ndash57 548 348
12 Hong Kong 61 013 + 56 583 78 59 926 21618 Australia 18 30 115 32 216 ndash65 ndash58 381 10722 Singapore 22 456 + 21 414 49 20 734 08047 New Zealand 14 1 777 1 749 16 30 171 006
Other countries 135 135 425 000Total 649 855 632 264 28 14 700 2304
Emerging Asia-Pacific 3 PR China 313 365 + 317 570 ndash13 ndash54 545 111110 India 12 73 735 71 191 36 77 739 26125 Thailand 18 136 + 16 352 109 na 681 06427 Indonesia 15 520 15 877 ndash22 07 761 05530 Malaysia 12 11 581 10 660 86 62 696 04137 Philippines 4 172 3 871 78 70 693 01538 Vietnam 3 799 2 917 302 275 651 01352 Bangladesh 1 093 1 013 79 59 710 00465 Sri Lanka 476 467 18 na 464 002
Other countries 1 113 1 032 615 004Total 442 990 440 950 05 ndash23 587 1571
World World 2 820 175 2 724 017 35 02 543 10000
40 Swiss Re Institute sigma No 32019
Table VI Nonndashlife insurance premium volume in local currency
Premium volume Change (in ) Change (in )(in millions of local currency) nominal inflation-adjusted
Country Currency 2018E 2017 2016 2018E 2017 2018E 2017North America United States 9 USD 875 984 + 833 400 792 334 51 52 26 30
Canada 10 CAD 95 694 + 89 710 85 344 67 51 43 35Total 27 30
Latin America and Caribbean Brazil BRL 122 718 116 430 110 630 54 52 17 17Mexico MXN 292 374 270 465 237 844 81 137 31 72Argentina 17 ARS 288 128 231 205 176 363 246 311 ndash73 53Venezuela VEF na 3 725 678 851 055 na 3378 na ndash682Colombia COP 18 683 740 17 529 420 16 355 860 66 72 32 27Chile CLP 3 456 159 3 300 039 3 037 728 47 86 20 58Peru PEN 6 597 5 972 6 143 105 ndash28 90 ndash54Ecuador USD 1 276 1 614 1 271 ndash209 270 ndash208 265Panama PAB 1 178 1 072 1 017 98 55 90 46Costa Rica CRC 647 977 638 146 552 835 15 154 ndash06 136Dominican Republic DOP 50 048 40 875 33 136 224 234 181 194Uruguay UYU 27 591 26 132 23 824 56 97 ndash19 33Guatemala GTQ na 5 384 5 042 na 68 na 23Cayman Islands KYD na 556 574 na ndash31 na ndash32Trinidad and Tobago TTD 4 349 4 194 4 282 37 ndash21 26 ndash39Bahamas BSD na 565 523 na 79 na 64Jamaica JMD na na na na na na naTotal 05 05
Advanced EMEA Germany EUR 122 790 + 119 399 112 136 28 65 11 49United Kingdom GBP 75 625 73 422 68 717 30 68 05 40France EUR 78 635 77 125 76 372 20 10 01 00Netherlands EUR 58 078 57 035 55 625 18 25 01 11Italy EUR 38 038 37 074 36 532 26 15 14 03Spain EUR 33 815 + 32 991 31 801 25 37 08 17Switzerland CHF 28 300 + 27 691 27 129 22 21 13 15Belgium EUR 15 695 15 179 14 850 34 22 13 01Austria EUR 11 670 11 298 10 897 33 37 13 16Sweden SEK 87 742 83 592 80 051 50 44 30 26Denmark DKK 62 075 59 370 57 757 46 28 37 16Ireland EUR na 7 650 7 286 na 50 na 47Norway NOK 72 676 70 295 69 843 34 06 06 ndash12Israel ILS 30 676 29 009 27 483 57 56 49 53Portugal EUR 4 898 4 552 4 252 76 71 65 56Finland EUR 4 239 4 237 4 331 00 ndash22 ndash10 ndash29Luxembourg EUR 4 041 3 462 3 325 167 41 150 20Malta EUR na 2 786 2 579 na 80 na 67Liechtenstein CHF 3 080 2 790 1 250 104 1232 94 1220Greece EUR 2 182 2 090 1 976 44 58 38 46Cyprus EUR na 466 + 442 na 54 na 47Total 11 27
Emerging EMEA Russia RUB 1 026 006 946 048 964 891 85 ndash20 54 ndash54Poland PLN 44 071 41 311 35 696 67 157 48 135South Africa ZAR 129 667 124 432 116 722 42 66 ndash04 13United Arab Emirates 11 AED 35 286 35 069 31 429 06 116 ndash24 94Saudi Arabia SAR 34 341 35 363 35 804 ndash29 ndash12 ndash53 ndash04Turkey TRY 43 580 37 212 34 533 171 78 07 ndash30Iran 13 IRR 313 903 600 268 009 000 242 215 000 171 106 ndash42 09Czech Republic CZK 97 340 91 326 87 625 66 42 43 17Qatar QAR 11 058 10 704 13 373 33 ndash200 31 ndash203Morocco MAD 22 815 21 751 20 626 49 55 30 47Hungary HUF 550 015 497 557 438 079 105 136 75 110Romania RON 7 928 7 770 7 795 20 ndash03 ndash25 ndash17Slovenia EUR 1 624 1 526 1 457 65 47 47 32Ukraine UAH 44 332 40 518 32 414 94 250 ndash14 92Slovakia EUR 1 374 1 288 1 191 67 81 41 67Bulgaria BGN 2 131 + 1 771 1 643 203 78 170 56Kenya KES 128 848 + 124 780 121 711 33 25 ndash14 ndash51Kuwait KWD 345 295 217 168 361 161 340Algeria DZD 126 046 122 111 119 440 32 22 ndash10 ndash32Lebanon LBP 1 627 325 1 543 952 1 640 842 54 ndash59 ndash06 ndash99Croatia HRK 6 721 6 116 5 843 99 47 83 35Oman OMR 369 353 348 46 12 37 ndash04Egypt 14 EGP 15 992 13 786 9 826 160 403 ndash40 136Jordan JOD 550 514 513 71 03 24 ndash29Kazakhstan KZT 261 275 265 813 267 441 ndash17 ndash06 ndash73 ndash75Serbia RSD 75 256 71 709 67 301 49 65 29 33Pakistan PKR 86 811 76 222 78 281 139 ndash26 84 ndash65Tunisia TND na 1 630 1 465 na 112 na 56Nigeria NGN 233 144 202 734 184 508 150 99 25 ndash57Bahrain BHD 219 216 220 12 ndash19 ndash09 ndash32Namibia NAD 3 794 3 714 3 522 21 55 ndash22 ndash07Zimbabwe USD 276 236 216 169 95 57 85Total 14 12
Advanced Asia-Pacific Japan 12 JPY 11 742 540 11 694 370 12 704 370 04 ndash80 ndash03 ndash86South Korea 12 KRW 89 970 760 87 281 470 83 439 040 31 46 17 29Australia 18 AUD 65 600 63 233 60 565 37 44 18 24Taiwan TWD 599 175 575 184 547 966 42 50 28 43New Zealand 14 NZD 12 514 11 883 11 247 53 57 37 37Singapore SGD 10 997 + 10 380 9 948 59 43 55 38Hong Kong HKD 38 398 + 36 130 34 880 63 36 38 21Total 12 ndash20
Emerging Asia-Pacific PR China CNY 1 729 376 + 1 512 544 1 351 689 143 119 120 102India 12 INR 1 819 212 1 534 376 1 309 700 186 172 140 134Thailand THB 274 168 257 242 247 319 66 40 55 33Malaysia 12 MYR 20 707 19 794 19 654 46 07 40 ndash24Indonesia IDR 69 198 490 60 658 890 57 113 020 141 62 105 23Vietnam VND 46 947 860 41 594 000 36 865 000 129 128 90 90Philippines PHP 97 227 87 274 76 531 114 140 59 109Sri Lanka LKR na na 73 743 na na na naBangladesh BDT 37 338 31 912 27 909 170 143 108 82Total 117 99
World World 30 29
Swiss Re Institute sigma No 32019 41
Table VII Non‒life premium volume in USD
Premium volume Change (in ) 2018 Share of total Share of(in millions of USD) nominal inflation- business world market
Ranking Country 2018E 2017 (in USD) adjusted 17 2018E (in ) 2018E (in )North America 1 United States 9 875 984 + 833 400 51 26 596 3691
8 Canada 10 73 833 + 69 117 68 43 577 311Total 949 817 902 517 52 27 595 4003
Latin America and Caribbean 13 Brazil 33 589 36 477 ndash79 17 461 14219 Mexico 15 206 14 304 63 31 556 06422 Argentina 17 10 359 13 959 ndash258 ndash73 855 04435 Venezuela 7 572 1 667 3542 na 975 03237 Colombia 6 369 5 939 72 32 685 02739 Chile 5 390 5 086 60 20 396 02354 Peru 2 007 1 831 96 90 513 00860 Ecuador 1 276 1 614 ndash209 ndash208 754 00562 Panama 1 178 1 072 98 90 750 00564 Costa Rica 1 131 1 134 ndash03 ndash06 839 00568 Dominican Republic 1 012 860 177 181 840 00471 Uruguay 898 911 ndash15 ndash19 603 00473 Guatemala 767 733 46 na 792 00377 Cayman Islands 697 667 44 na 960 00380 Trinidad and Tobago 644 619 41 26 551 00381 Bahamas 587 565 38 na 749 00285 Jamaica 470 450 45 na 604 002
Other countries 2 828 2 942 723 012Total 91 979 90 830 13 05 566 388
Advanced EMEA 3 Germany 145 046 + 134 877 75 11 601 6115 United Kingdom 101 009 94 640 67 05 300 4266 France 92 888 87 123 66 01 360 3919 Netherlands 68 605 64 429 65 01 813 289
11 Italy 44 933 41 881 73 14 264 18912 Spain 39 945 + 37 267 72 08 539 16814 Switzerland 28 940 + 28 121 29 13 487 12217 Belgium 18 540 17 147 81 13 498 07820 Austria 13 785 12 763 80 13 676 05823 Sweden 10 089 9 785 31 30 272 04324 Denmark 9 831 8 994 93 37 270 04126 Ireland 9 738 8 626 129 na 133 04130 Norway 8 939 8 501 51 06 424 03832 Israel 8 591 8 059 66 49 460 03638 Portugal 5 786 5 142 125 65 373 02441 Finland 5 007 4 786 46 ndash10 184 02144 Luxembourg 4 774 3 904 223 150 145 02046 Malta 3 586 3 147 139 na 671 01547 Liechtenstein 3 150 2 833 112 94 568 01349 Greece 2 577 2 360 92 38 539 01183 Cyprus 581 526 + 103 na 572 002
Other countries 562 529 918 002Total 626 900 585 443 71 11 402 2642
Emerging EMEA 18 Russia 16 374 16 215 10 54 694 06921 Poland 12 203 10 934 116 48 736 05125 South Africa 9 794 9 343 48 ndash04 203 04127 United Arab Emirates 11 9 607 9 548 06 ndash24 771 04028 Saudi Arabia 9 157 9 430 ndash29 ndash53 968 03929 Turkey 9 035 10 200 ndash114 07 864 03836 Iran 13 6 678 7 796 ndash143 ndash42 869 02845 Czech Republic 4 480 3 907 147 43 634 01948 Qatar 3 038 2 941 33 31 1000 01350 Morocco 2 432 2 244 83 30 531 01052 Hungary 2 035 1 813 123 75 537 00953 Romania 2 011 1 917 49 ndash25 800 00855 Slovenia 1 919 1 724 113 47 694 00857 Ukraine 1 629 1 523 69 ndash14 918 00758 Slovakia 1 623 1 455 116 41 623 00759 Bulgaria 1 286 + 1 020 260 170 862 00561 Kenya 1 273 + 1 207 55 ndash14 596 00563 Kuwait 1 145 974 175 161 876 00565 Algeria 1 084 1 100 ndash15 ndash10 912 00566 Lebanon 1 079 1 024 54 ndash06 673 00567 Croatia 1 071 923 160 83 682 00569 Oman 960 917 46 37 860 00470 Egypt 14 902 931 ndash31 ndash40 571 00472 Jordan 775 724 71 24 866 00374 Kazakhstan 759 815 ndash69 ndash73 745 00375 Serbia 751 665 129 29 768 00376 Pakistan 713 723 ndash13 84 271 00378 Tunisia 684 674 16 na 786 00379 Nigeria 671 663 12 25 550 00382 Bahrain 582 575 12 ndash09 804 00287 Namibia 287 279 28 ndash22 284 00188 Zimbabwe 276 236 169 57 376 001
Other countries 8 377 8 258 743 035Total 114 689 112 699 18 14 604 483
Advanced Asia-Pacific 4 Japan 12 106 405 105 527 08 ndash03 241 4487 South Korea 12 80 951 78 600 30 17 452 341
10 Australia 18 48 983 48 472 11 18 619 20616 Taiwan 19 864 18 894 51 28 163 08431 New Zealand 14 8 629 8 443 22 37 829 03634 Singapore 8 153 + 7 517 85 55 266 03442 Hong Kong 4 899 + 4 637 57 38 74 021
Other countries 183 182 575 001Total 278 067 272 271 21 12 300 1172
Emerging Asia-Pacific 2 PR China 261 512 + 223 876 168 120 455 110215 India 12 26 102 23 808 96 140 261 11033 Thailand 8 485 7 580 119 55 319 03640 Malaysia 12 5 053 4 747 64 40 304 02143 Indonesia 4 863 4 534 73 105 239 02051 Vietnam 2 040 1 832 114 90 349 00956 Philippines 1 846 1 732 66 59 307 00884 Sri Lanka 551 541 18 na 536 00286 Bangladesh 447 397 128 108 290 002
Other countries 698 685 385 003Total 311 598 269 731 155 117 413 1313
World World 2 373 050 2 233 490 62 30 457 10000
42 Swiss Re Institute sigma No 32019
Table VIII Insurance density premiums (1) per capita in USD
Ranking Country Total business Life business Non-life businessNorth America 12 United States 9 4 481 1 810 2 672 +
18 Canada 10 3 457 1 462 1 996 +Total 4 377 1 774 2 603
Latin America and Caribbean 1 Cayman Islands 11 642 462 11 179 26 Bahamas 1 963 492 1 471 33 Trinidad and Tobago 853 383 47035 Chile 747 451 296 43 Uruguay 429 171 25949 Panama 377 94 28350 Brazil 345 186 159 53 Costa Rica 272 44 228 54 Argentina 271 39 232 56 Jamaica 269 107 162 57 Venezuela 240 6 234 60 Mexico 209 93 116 61 Colombia 188 59 129 67 Peru 120 59 62 68 Dominican Republic 111 18 93 69 Ecuador 100 25 76 77 Guatemala 56 12 44
Total 251 109 142Advanced EMEA 3 Switzerland 6 934 3 555 3 379 +
4 Denmark 6 289 4 590 1 6995 Ireland 1 5 253 4 356 897 7 Luxembourg 1 5 001 2 995 2 006 9 Finland 4 926 4 019 907
10 Netherlands 4 890 913 3 977 11 United Kingdom 1 4 503 3 532 971 13 France 1 3 667 2 370 1 296 14 Sweden 3 644 2 653 99115 Norway 1 3 638 2 276 1 36120 Germany 1 2 908 1 161 1 747 +21 Italy 1 2 852 2 110 74222 Belgium 1 2 817 1 623 1 193 23 Austria 2 304 746 1 557 24 Israel 2 207 1 191 1 01627 Spain 1 588 + 732 + 857 +28 Portugal 1 490 934 556 31 Malta 1 293 916 376 32 Cyprus 1 168 500 669 37 Liechtenstein 642 614 28 41 Greece 448 207 241
Total 3 276 1 978 1 298Emerging EMEA 29 Slovenia 1 336 409 927
30 United Arab Emirates 11 1 305 299 1 006 34 South Africa 840 669 170 36 Czech Republic 666 244 42238 Bahrain 520 102 418 40 Slovakia 478 180 298 42 Poland 436 115 32145 Namibia 390 279 111 46 Hungary 388 180 20848 Croatia 383 122 26151 Kuwait 315 39 275 52 Saudi Arabia 283 9 274 55 Lebanon 269 88 181 58 Oman 234 33 201 59 Bulgaria 213 + 29 + 183 +62 Russia 164 50 11463 Serbia 140 32 108 64 Romania 129 26 104 65 Turkey 127 17 11066 Morocco 127 59 67 70 Iran 13 94 12 82 71 Jordan 91 12 79 73 Tunisia 75 16 59 78 Kazakhstan 55 14 4180 Zimbabwe 43 27 16 81 Kenya 42 + 17 + 25 +82 Ukraine 42 3 38 83 Algeria 28 3 2684 Egypt 14 16 7 9 85 Pakistan 13 10 4 87 Nigeria 6 3 3 88 Qatar 1 139
Total 85 34 51Advanced Asia-Pacific 2 Hong Kong 8 863 + 8 204 + 659 +
6 Taiwan 5 161 4 320 8418 Singapore 1 4 958 + 3 944 + 1 014 +
16 Japan 12 3 466 2 629 837 17 South Korea 12 3 465 1 898 1 56719 Australia 3 160 1 203 1 957 25 New Zealand 2 146 367 1 780
Total 3 603 2 530 1 073Emerging Asia-Pacific 39 Malaysia 12 518 361 157
44 PR China 406 + 221 + 185 +47 Thailand 385 262 + 123 72 Indonesia 76 58 18 74 India 12 74 54 1975 Vietnam 61 39 21 76 Philippines 56 39 17 79 Sri Lanka 49 23 26 86 Bangladesh 9 7 3
Total 195 115 81World World 3 682 370 312
Swiss Re Institute sigma No 32019 43
Table IX Insurance penetration premiums (1) as a of GDP
Ranking Country Total business Life business Non-life businessNorth America 15 Canada 10 748 316 432 +
17 United States 9 714 288 426 +Total 717 291 426
Latin America and Caribbean 3 Cayman Islands 1751 070 1682 21 Bahamas 620 155 465 28 Jamaica 513 203 309 32 Chile 460 278 182 35 Trinidad and Tobago 440 197 24241 Brazil 390 210 180 47 Colombia 279 088 191 50 Panama 252 063 18951 Uruguay 250 100 15155 Argentina 236 034 202 58 Costa Rica 225 036 188 59 Mexico 223 099 124 68 Peru 174 085 089 69 Ecuador 159 039 120 71 Dominican Republic 150 024 126 74 Venezuela 137 003 134 76 Guatemala 122 026 097
Total 279 121 158Advanced EMEA 6 United Kingdom 1 1061 832 229
7 Denmark 1037 757 2808 Finland 987 806 1829 Netherlands 924 172 751
10 France 1 889 575 314 12 Switzerland 842 432 410 +13 Italy 1 834 617 21718 Ireland 1 683 567 117 19 Sweden 675 491 18420 Portugal 642 403 240 22 Belgium 1 607 350 257 23 Germany 1 603 241 362 +26 Spain 520 + 239 + 280 +29 Israel 502 271 23133 Austria 446 145 302 34 Norway 1 445 278 16636 Luxembourg 1 427 256 171 37 Malta 425 301 124 39 Cyprus 416 178 238 60 Greece 220 101 119 86 Liechtenstein 038 036 002
Total 761 460 302Emerging EMEA 4 South Africa 1289 1027 262
16 Namibia 725 519 206 30 Slovenia 494 151 34340 Zimbabwe 391 244 147 42 Morocco 388 182 206 44 Lebanon 295 096 198 45 United Arab Emirates 11 292 067 225 46 Poland 281 074 20748 Czech Republic 277 102 17649 Croatia 259 082 17653 Hungary 242 112 13054 Kenya 237 + 096 + 142 +56 Slovakia 231 087 144 57 Bulgaria 229 + 032 + 198 +61 Tunisia 214 046 169 62 Jordan 206 028 178 63 Iran 13 201 026 175 65 Serbia 192 045 148 66 Bahrain 183 036 147 70 Russia 153 047 10672 Oman 147 021 127 73 Ukraine 143 012 131 75 Turkey 133 018 11577 Saudi Arabia 121 004 117 79 Romania 109 022 087 80 Kuwait 100 012 087 81 Pakistan 093 068 025 82 Algeria 068 006 06283 Egypt 14 063 027 036 84 Kazakhstan 063 016 04787 Nigeria 033 015 018 88 Qatar na na 161
Total 199 079 120Advanced Asia-Pacific 1 Taiwan 2088 1748 340
2 Hong Kong 1816 + 1681 + 135 +5 South Korea 12 1116 612 505
11 Japan 12 886 672 214 14 Singapore 1 782 + 622 + 160 +24 Australia 558 213 346 27 New Zealand 515 088 427
Total 970 681 289Emerging Asia-Pacific 25 Thailand 527 359 + 168
31 Malaysia 12 477 332 14538 PR China 422 + 230 + 192 +43 India 12 370 274 09752 Vietnam 242 158 085 64 Indonesia 195 149 047 67 Philippines 182 126 056 78 Sri Lanka 115 054 062 85 Bangladesh 057 041 017
Total 383 225 158World World 3 609 331 278
44 Swiss Re Institute sigma No 32019
Table X Macroeconomic indicators
Exchange ratePopulation Gross domestic product
Real change (in)local currency per USD
Ranking by GDP
(millions) USDbn Inflation rate (in ) 2018
2017
Change (in )Country 2018E 2018E 2018E 2017 2018E 2017
North America 1 United States 328 20 576 29 22 24 21 100 100 0010 Canada 37 1 711 18 30 22 16 130 130 ndash01
Total 365 22 287 28 23Latin America andCaribbean
9 Brazil 211 1 869 11 11 37 35 365 319 14515 Mexico 131 1 225 20 23 49 60 1923 1891 1723 Venezuela 32 566 ndash99 ndash92 142239 12771 6212500 223500 2679626 Argentina 17 45 513 ndash25 28 344 246 2781 1656 67940 Colombia 49 333 27 14 32 43 293370 295133 ndash0642 Chile 18 296 40 16 27 27 64122 64885 ndash1251 Peru 33 225 40 25 13 28 329 326 0862 Ecuador 17 106 10 24 ndash02 04 100 100 0065 Dominican Republic 11 80 65 46 37 33 4946 4753 4166 Guatemala 17 79 30 28 39 44 753 735 2570 Panama 4 62 34 57 08 09 100 100 0072 Costa Rica 5 60 26 33 22 16 57301 56287 1873 Uruguay 3 59 20 27 76 62 3073 2868 7280 Trinidad and Tobago 1 27 19 ndash31 11 19 675 678 ndash0483 Jamaica 3 15 18 11 39 44 13069 12796 2186 Bahamas 0 13 23 14 25 14 100 100 0088 Cayman Islands 0 4 26 23 32 00 083 083 00
Total 16 648 5 818 11 16Advanced EMEA 4 Germany 83 4 005 15 25 17 15 085 089 ndash44
5 United Kingdom 67 2 824 14 18 25 27 075 078 ndash356 France 67 2 777 15 23 19 10 085 089 ndash448 Italy 61 2 071 08 17 11 12 085 089 ndash44
13 Spain 47 1 426 25 30 17 20 085 089 ndash4417 Netherlands 17 913 25 30 17 14 085 089 ndash4420 Switzerland 9 705 25 16 09 05 098 098 ndash0724 Sweden 10 549 24 24 20 18 870 854 1825 Belgium 11 532 14 17 21 21 085 089 ndash4428 Austria 9 457 28 27 20 21 085 089 ndash4429 Norway 5 436 17 24 28 19 813 827 ndash1733 Ireland 5 374 66 73 07 03 085 089 ndash4534 Israel 8 372 33 34 08 02 357 360 ndash0838 Denmark 6 351 12 23 08 11 631 660 ndash4344 Finland 6 275 22 27 11 08 085 089 ndash4449 Portugal 10 238 21 28 10 14 085 089 ndash4452 Greece 11 217 19 14 06 11 085 089 ndash4468 Luxembourg 1 69 30 15 15 21 085 089 ndash4581 Cyprus 1 24 39 42 08 07 085 089 ndash4484 Malta 0 15 69 67 17 13 085 089 ndash4487 Liechtenstein 0 7 20 07 09 05 098 098 ndash07
Total 434 18 667 18 24Emerging EMEA 12 Russia 144 1 546 18 15 29 37 6266 5834 74
18 Turkey 82 787 31 73 163 111 482 365 32219 Saudi Arabia 33 782 21 ndash07 25 ndash08 375 375 0021 Poland 38 591 51 48 18 20 361 378 ndash4430 United Arab Emirates 10 427 27 08 31 20 367 367 0031 Iran 82 382 ndash02 37 222 96 4700915 3437843 36732 South Africa 57 374 08 14 46 53 1324 1332 ndash0635 Nigeria 196 372 19 08 121 165 34734 30579 13643 Pakistan 201 283 58 54 51 41 12173 10545 15446 Czech Republic 11 255 30 45 22 25 2173 2338 ndash7047 Egypt 99 250 53 41 209 235 1773 1481 19750 Romania 19 230 42 69 46 13 394 405 ndash2754 Qatar 3 188 21 16 02 04 364 364 0055 Algeria 42 176 23 14 43 56 11631 11097 4856 Kazakhstan 18 162 41 40 60 74 34425 32600 5657 Hungary 10 156 50 44 29 23 27021 27443 ndash1558 Kuwait 4 131 17 ndash35 06 16 030 030 ndash0759 Ukraine 42 124 29 25 109 144 2721 2660 2360 Morocco 36 118 28 41 18 08 938 969 ndash3261 Slovakia 5 113 41 32 25 13 085 089 ndash4463 Kenya 51 90 59 49 47 80 10121 10341 ndash2167 Oman 5 76 33 ndash09 09 16 038 038 0069 Bulgaria 7 65 33 38 28 21 166 174 ndash4571 Croatia 4 61 27 29 15 11 628 662 ndash5274 Slovenia 2 56 46 53 17 14 085 089 ndash4475 Lebanon 6 54 11 20 61 45 150750 150750 0076 Serbia 7 51 42 20 20 31 10018 10776 ndash7077 Jordan 10 44 20 21 45 33 071 071 0078 Tunisia 12 41 26 20 74 53 262 242 8379 Bahrain 1 39 19 37 21 14 038 038 0082 Zimbabwe 17 19 11 30 105 09 100 100 0085 Namibia 3 14 ndash04 ndash09 44 62 1324 1332 ndash06
Total 2 242 9 569 29 32Advanced Asia-Pacific
3 Japan 127 4 975 08 19 08 07 11036 11082 ndash0411 South Korea 52 1 604 27 31 14 17 111142 111045 0114 Australia 25 1 417 28 24 19 19 134 130 2722 Taiwan 24 584 25 29 14 06 3016 3044 ndash0936 Hong Kong 7 363 31 39 24 15 784 779 0637 Singapore 6 361 33 39 04 06 135 138 ndash2353 New Zealand 5 202 29 26 16 19 145 141 30
Total 257 9 539 17 24Emerging Asia-Pacific
2 PR China 1 416 13 613 66 68 21 15 661 676 ndash217 India 1 356 2 696 73 72 40 33 6970 6445 81
16 Indonesia 267 1 043 52 51 32 38 1423065 1337930 6427 Thailand 69 505 41 40 11 07 3231 3394 ndash4839 Malaysia 32 349 47 59 06 32 410 417 ndash1741 Philippines 107 331 62 67 52 29 5266 5040 4545 Bangladesh 166 270 79 73 56 57 8347 8044 3848 Vietnam 96 241 71 68 35 35 2301221 2270525 1464 Sri Lanka 21 89 39 33 32 77 16158 15245 60
Total 3 869 19 678 65 66World World 7 613 85 276 32 33
Swiss Re Institute sigma No 32019 45
Recent sigma publications
2019 No 1 Emerging markets the silver lining amid a challenging outlook No 2 Natural catastrophes and man-made disasters in 2018 ldquosecondaryrdquo perils on the frontline No 3 World insurance the great pivot east continues
2018 No 1 Natural catastrophes and man-made disasters in 2017 a year of record-breaking losses No 2 Constructing the future recent developments in engineering insurance No 3 World insurance in 2017 solid but mature life markets weigh on growth No 4 Profitability in non-life insurance mind the gap No 5 Global economic and insurance outlook 2020 No 6 Mortality improvement understanding the past and framing the future
2017 No 1 Cyber getting to grips with a complex risk No 2 Natural catastrophes and man-made disasters in 2016 a year of widespread damages No 3 World insurance in 2016 the China growth engine steams ahead No 4 Insurance adding value to development in emerging markets No 5 Commercial insurance expanding the scope of insurability No 6 Life in-force management improving consumer value and long-term profitability
2016 No 1 Natural catastrophes and man-made disasters in 2015 Asia suffers substantial losses No 2 Insuring the frontier markets No 3 World insurance 2015 steady growth amid regional disparities No 4 Mutual insurance in the 21st century back to the future No 5 Strategic reinsurance and insurance the increasing trend of customised solutions
2015 No 1 Keeping healthy in emerging markets insurance can help No 2 Natural catastrophes and man-made disasters in 2014 convective and winter storms generate most losses No 3 M amp A in insurance start of a new wave No 4 World insurance in 2014 back to life No 5 Underinsurance of property risks closing the gap No 6 Life insurance in the digital age fundamental transformation ahead
2014 No 1 Natural catastrophes and man-made disasters in 2013 large losses from floods and hail Haiyan hits the Philippines
No 2 Digital distribution in insurance a quiet revolution No 3 World insurance in 2013 steering towards recovery No 4 Liability claims trends emerging risks and rebounding economic drivers No 5 How will we care Finding sustainable long-term care solutions for an ageing world
2013 No 1 Partnering for food security in emerging markets No 2 Natural catastrophes and man-made disasters in 2012 A year of extreme weather events in the US No 3 World insurance 2012 Progressing on the long and winding road to recovery No 4 Navigating recent developments in marine and airline insurance No 5 Urbanisation in emerging markets boon and bane for insurers No 6 Life insurance focusing on the consumer
2012 No 1 Understanding profitability in life insurance No 2 Natural catastrophes and man-made disasters in 2011 historic losses surface from record earthquakes and floods No 3 World insurance in 2011 non-life ready for take-off No 4 Facing the interest rate challenge No 5 Insuring ever-evolving commercial risks No 6 Insurance accounting reform a glass half empty or half full
Explore and visualise sigma data on natural catastrophes and the world insurance markets at wwwsigma-explorercom
copy 2019 Swiss Re All rights reserved
The editorial deadline for this study was 5 June 2019
sigma is available in English (original language) German French Spanish Chinese and Japanese
sigma is available on Swiss Re Instituteʼs website httpswwwswissrecominstituteresearchsigma-research
The internet version may contain slightly updated information
TranslationsGerman Diction AGFrench ithaxa Communications SARLSpanish Traductores Asociados Valencia SL
Graphic design and productionCorporate Real Estate amp Logistics Media Production Zurich
Printing Multicolor Print AG Baar
copy 2019 Swiss Re All rights reserved
The entire content of this sigma edition is subject to copyright with all rights reserved The information may be used for private or internal purposes provided that any copyright or other proprietary notices are not removed Electronic reuse of the data published in sigma is prohibited
Reproduction in whole or in part or use for any public purpose is permitted only with the prior written approval of Swiss Re Institute and if the source reference ldquosigma 32019 - World insurance the great pivot east continuesrdquo is indicated Courtesy copies are appreciated
Although all the information used in this study was taken from reliable sources Swiss Re does not accept any responsibility for the accuracy or comprehensiveness of the information given or forward looking statements made The information provided and forward-looking statements made are for informational purposes only and in no way constitute or should be taken to reflect Swiss Rersquos position in particular in relation to any ongoing or future dispute In no event shall Swiss Re be liable for any loss or damage arising in connection with the use of this information and readers are cautioned not to place undue reliance on forward-looking statements Swiss Re undertakes no obligation to publicly revise or update any forward-looking statements whether as a result of new information future events or otherwise
Order no 270_0319_EN
Published by
Swiss Re Management LtdSwiss Re InstituteMythenquai 5060PO Box 8022 ZurichSwitzerland
Telephone +41 43 285 2551Email instituteswissrecom
Swiss Re Institute has a global presence with offices in New York London Bangalore Beijing Hong Kong and Singapore
AuthorsDaniel StaibDr Mahesh H PuttaiahOlga Tschekassin
sigma editorPaul Ronke
Managing editorsDr Jerome Jean HaegeliSwiss Re Group Chief Economist
Dan RyanHead Insurance Risk Research
Swiss Re Management LtdSwiss Re InstituteMythenquai 50 60 PO Box 8022 Zurich Switzerland
Telephone + 41 43 285 2551 httpswwwswissrecominstitute
- Executive summary
- Macroeconomic environment for insurers
-
- Global economic growth and inflation outlook
- Interest rates and risky assets
- Key risks to the outlook
-
- Trends in the global insurance markets
-
- Size of global insurance markets and growth trends
- Life insurance review 2018 and outlook
- Non-life insurance review 2018 and outlook
-
- Regional review 2018 and outlook
-
- Introduction
- Advanced markets
- Emerging markets
-
- Methodology and data
- Statistical appendix
-
- Table I Premium volume by region and organisation
- Table II Total premium volume in local currency
- Table III Total premium volume in USD
- Table IV Life insurance premium volume in local currency
- Table V Life premium volume in USD
- Table VI Nonndashlife insurance premium volume in local currency
- Table VII Non‒life premium volume in USD
- Table VIII Insurance density premiums (1) per capita in USD
- Table IXInsurance penetration premiums (1) as a of GDP
- Table IX Insurance penetration premiums (1) as a of GDP
- Table X Macroeconomic indicators
-
- Tables
-
- Table 1 Real premium growth in 2018E vs average 2008‒17 and outlook
- Table 2 Concentration measures by region for total insurance premiums 2018E
-
- Graphs
-
- Figure 1 Total real premium growth 2018E
- Figure 2 Real GDP growth by region
- Figure 3 Long-term government bond yieldsdata and forecasts (end of period)
- Figure 4 Global Risk Monitor(click on chart to accesslatest economic and financialrisk insights)
- Figure 5 Life and non-life premium growth vs GDP growth in real terms (7 year moving average)
- Figure 6 Market shares for total direct premiums written by main markets and by region 1980‒2029F
- Figure 7 Line business split in global life and non-life premiums (in USD billions and ) 2018E
- Figure 8 Premium volumes in the global reinsurance industry by region (in USD billion) 2018E
- Figure 9 Life real premium growth 2018E
- Figure 10 Life premium growth by region in real terms
- Figure 11 Contribution to annual real lifepremium growth (in ppt) by regionuntil 2020F
- Figure 12 ROE of 73 global composite and life insurance companies
- Figure 13 Non-life real premium growth 2018E
- Figure 14 Non-life premium growth in real terms
- Figure 15 Contribution to annual real non-lifepremium growth (in ppt) by regionuntil 2020F
- Figure 16 Profitability of the eight major non-life markets 1999ndash2020F in of net premiums earned (except for ROE)
- Figure 17 Average US PampC combined ratio cat-adjusted US primary insurersrsquo estimatedover the last three recessions
- Figure 18 Share of emerging markets in globalpremiums written and GDP (1980‒2029F)
- Figure 19 Insurance density (USD) and penetration () in advanced markets 2018E
- Figure 20 Insurance density (USD) and penetration (amp) in emerging markets 2018E
-
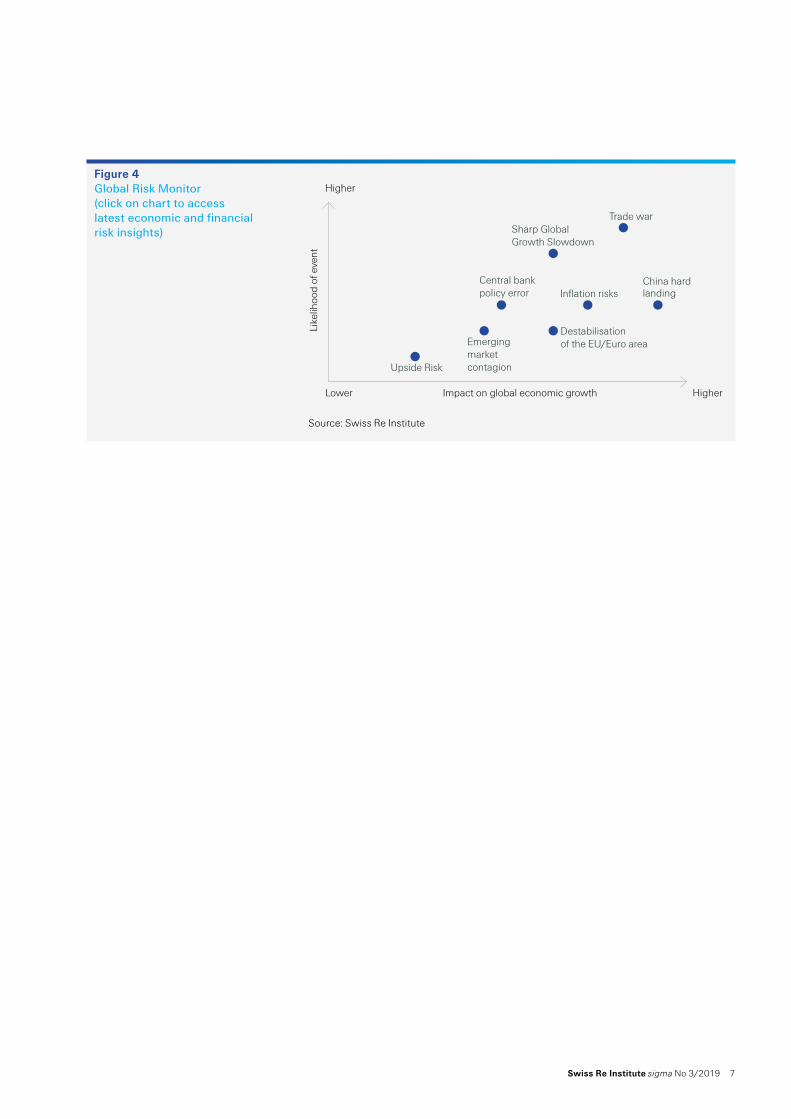
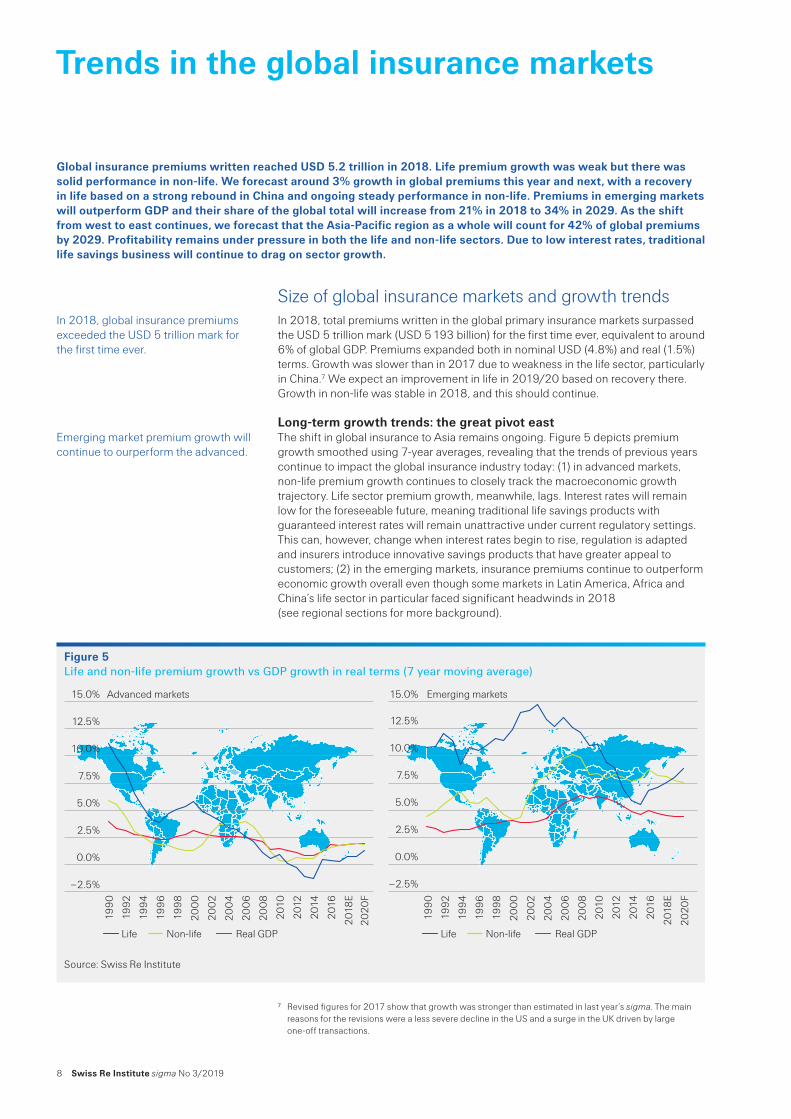
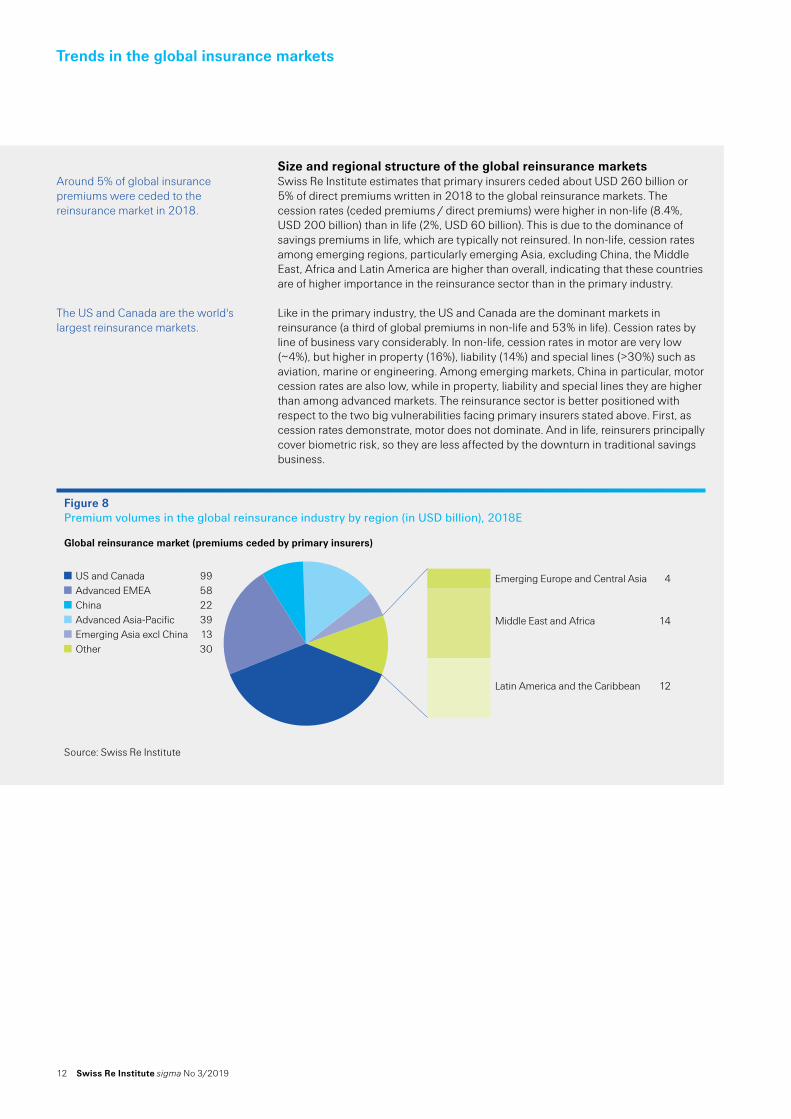
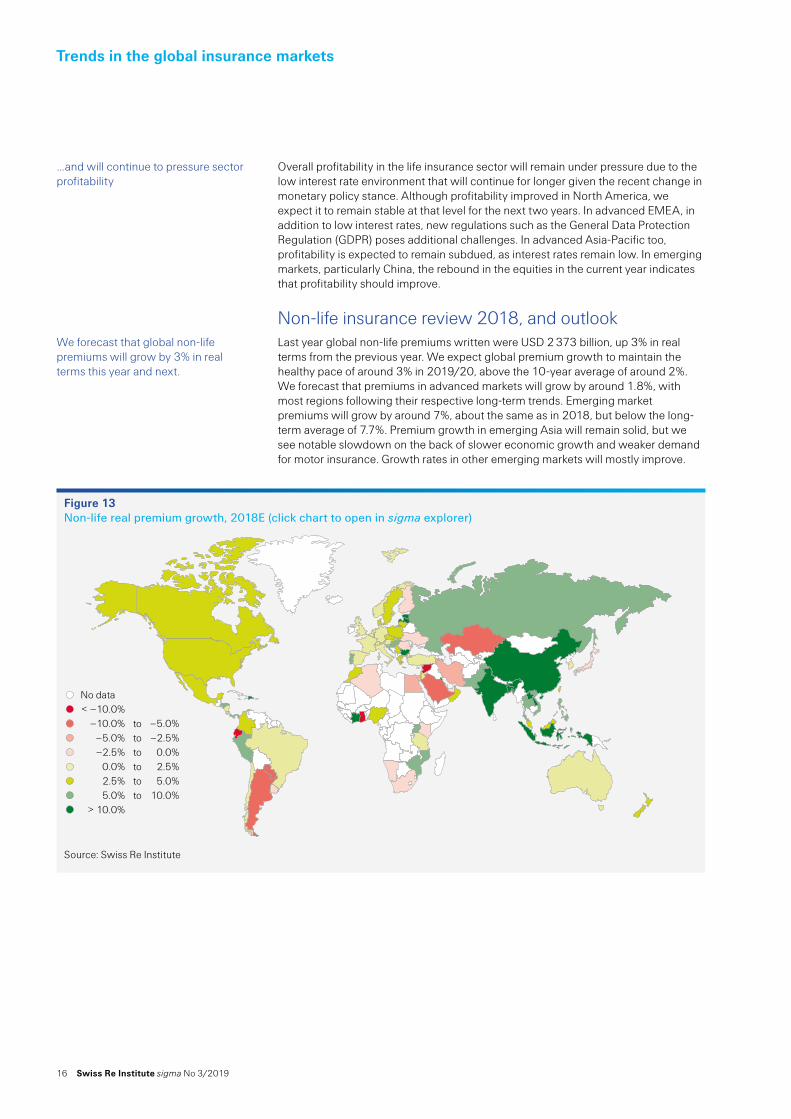
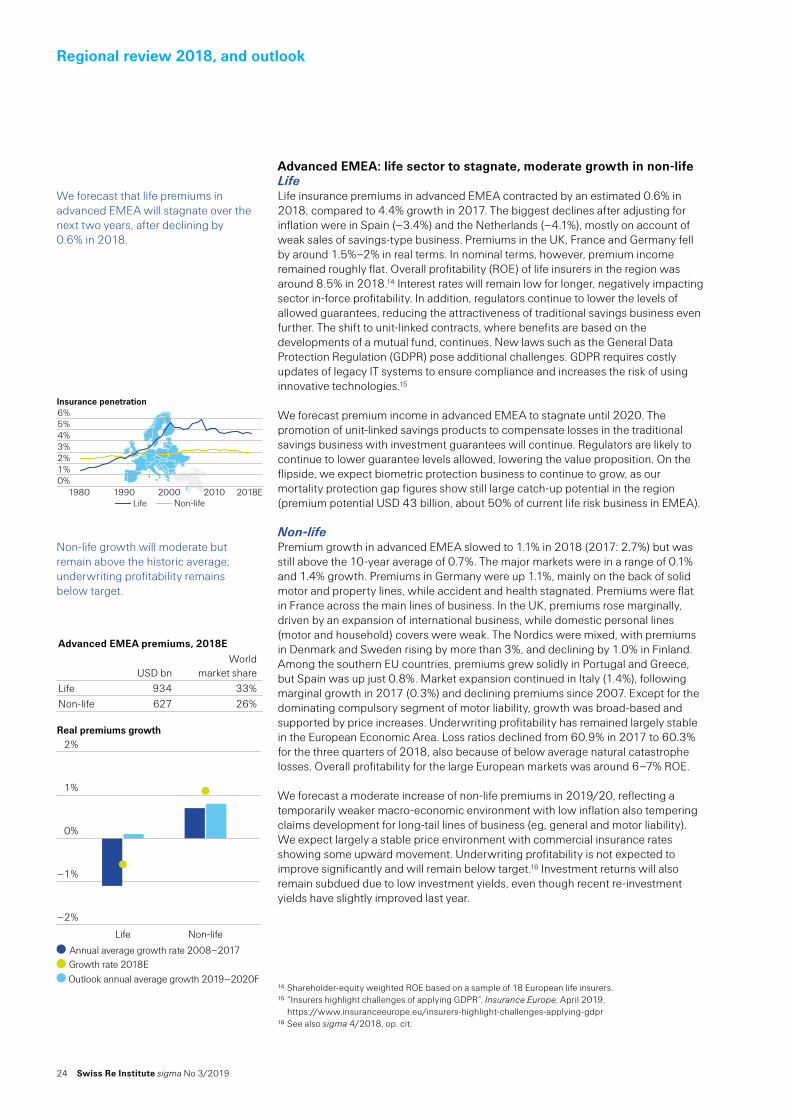
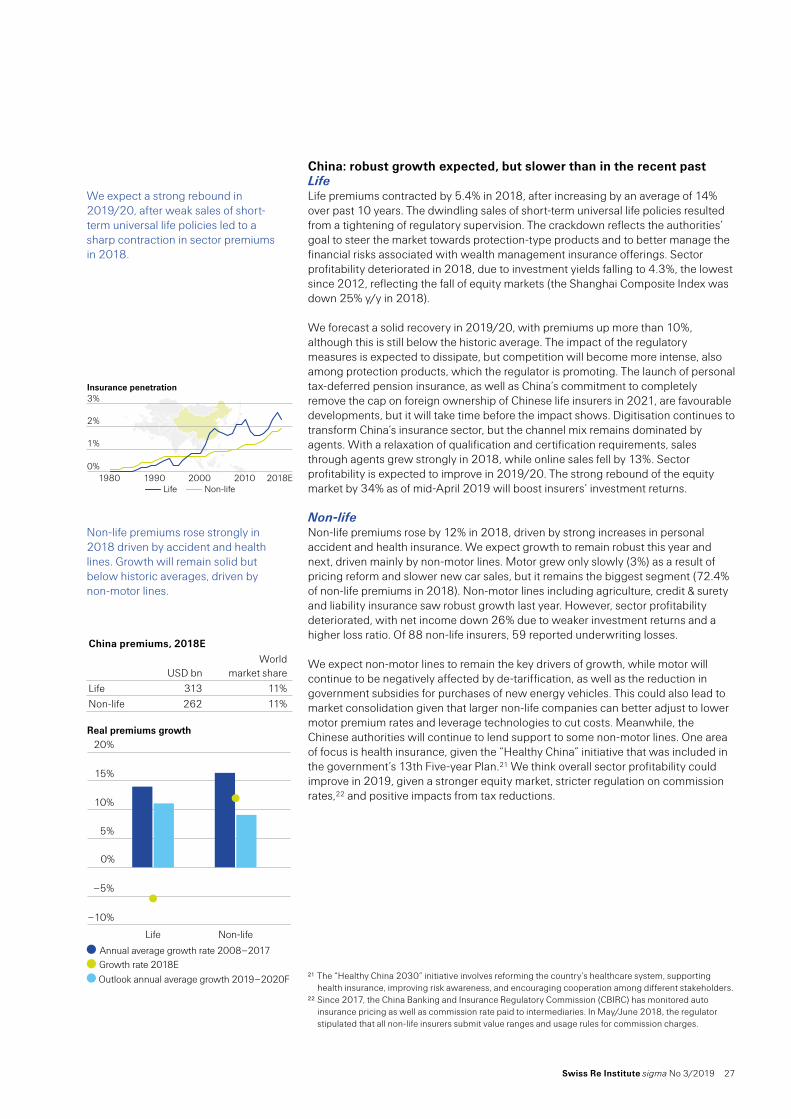
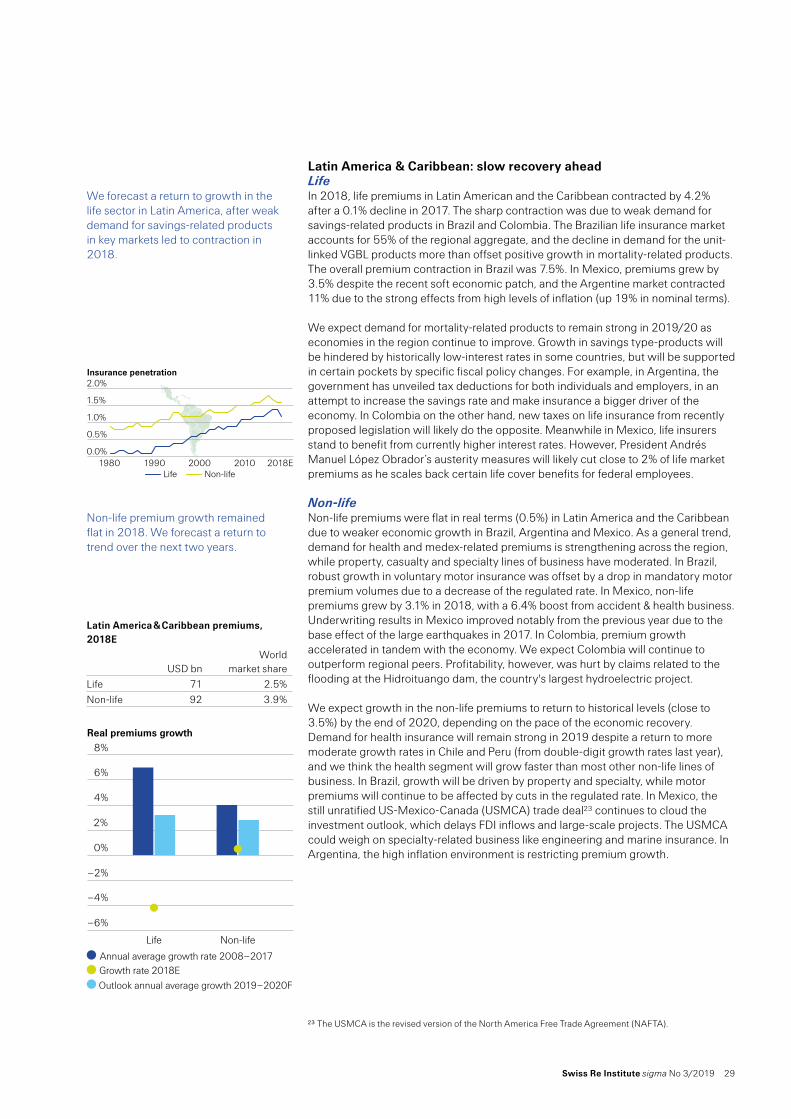
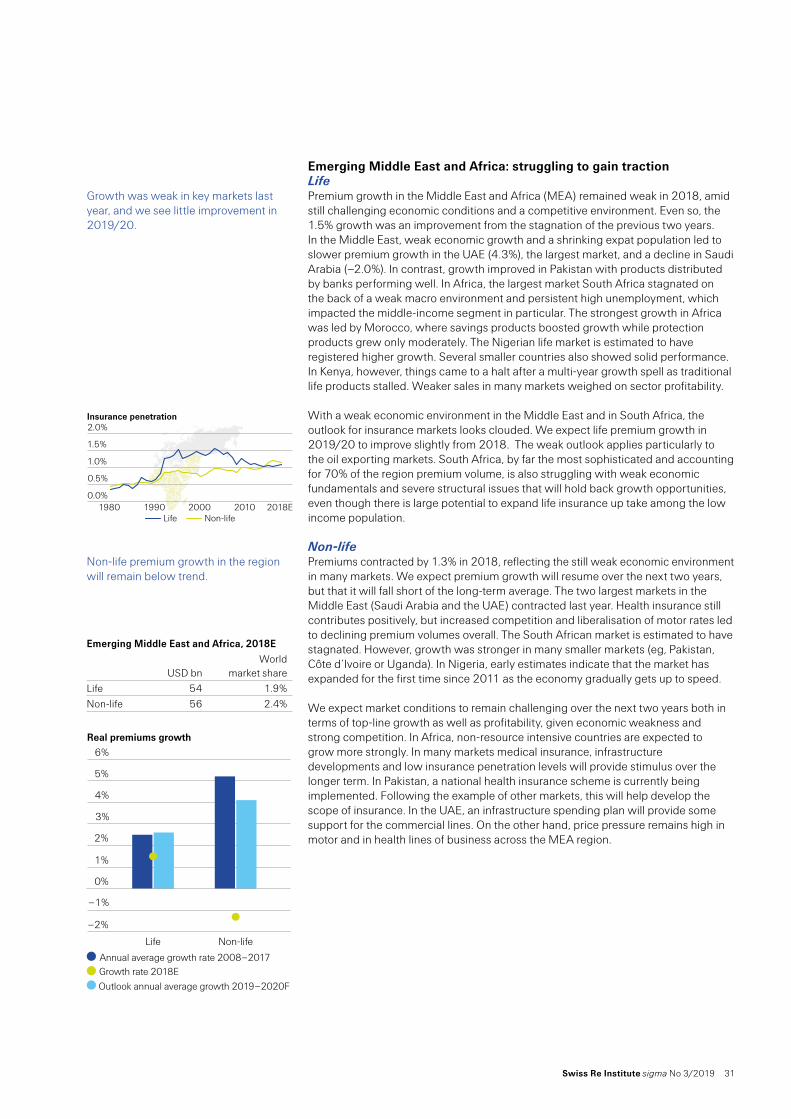
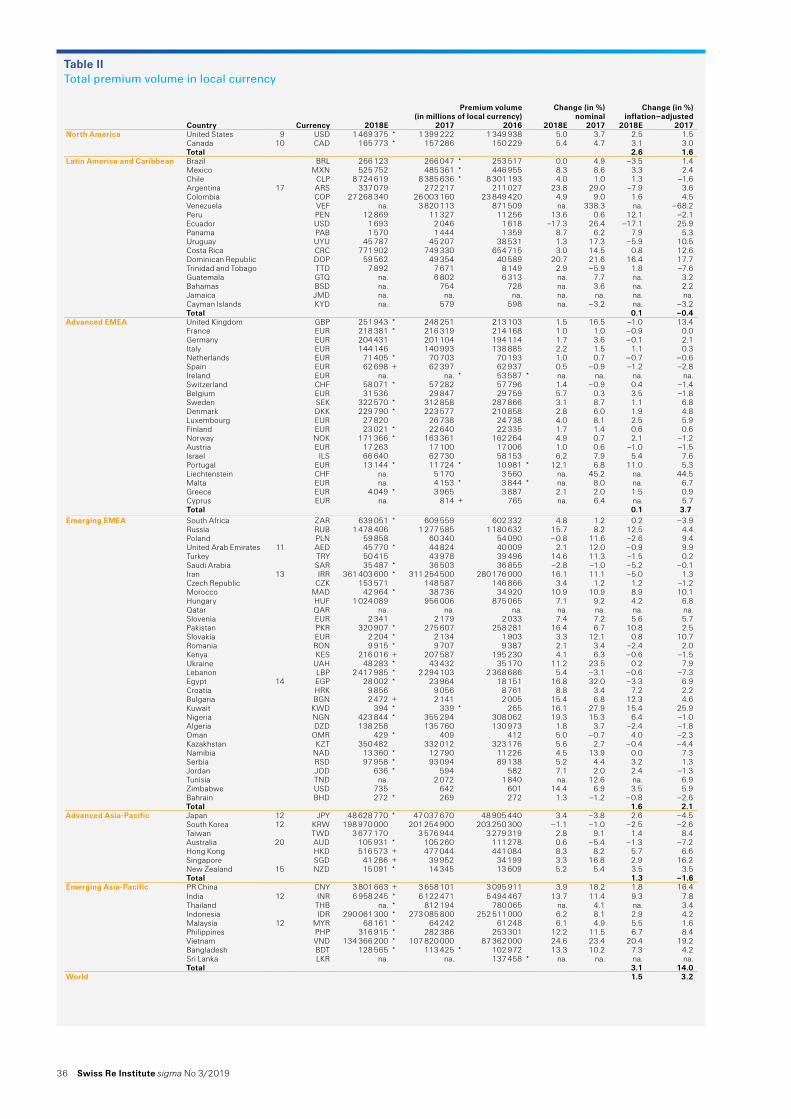