world fleet monitor - liberiancorporations.com
TRANSCRIPT

World Fleet MonitorVolume 10, No. 8 ISSN: 2042-0633
World Fleet Growth World Fleet Development This MonthFleet (up 2% this year) 2019 YTD Deliveries
(10% of the fleet) 2019 YTD Demolition
Flag State and Regional Fleets This MonthIACS Classed Fleet
Asia/Pacific Owned Fleet
August-2019
1374.5m GT 39.5m GT
Orderbook 138.3m GT 7.9m GT
Top 10 Flag States 1031.0m GT 1306.6m GT
European Owned Fleet 603.6m GT 568.4m GT
0%
1%
2%
3%
4%
5%
6%
7%
8%
9%
10%
Aug
-09
Aug
-10
Aug
-11
Aug
-12
Aug
-13
Aug
-14
Aug
-15
Aug
-16
Aug
-17
Aug
-18
Aug
-19
y-o-y 3mma
CONTENTS
Flag State Fleets
Top 30 p3
By Country/Region p4-5
By Class Society p6
Losses p7
By Vessel Type p8
Class Society Fleets
By Vessel Type p9
Classification Society Fleets p10
Owned Fleets
Top 30 p11
By Country/Region p12-15
By Region & Ship Type p16
New Orders p17
Deliveries & Demolition p18-19
Sale & Purchase p20-21
Commercial Data
Vessel Values & Earnings p22-23
Piracy by Vessel Type/Region p24-25
Trade Data
By Country/Region p26-27
Trade by Commodity p28
World Fleet
By Year of Build p29
By Ship Type & Owner p30-31
Analysis p32
Op
en
Nat
iona
l
Inte
rnat
iona
l
0
200
400
600
800
1,000m.GT
Flag Categories
0
50
100
150
200
250
Pan
ama
Libe
riaM
arsh
all I
s.H
ong
Kon
gS
'por
eM
alta
Chi
na P
.R.
Bah
amas
Gre
ece
Japa
n
m. GT Top 10 Flag States
Clarksons Research is respected worldwide as the most authoritative provider of intelligence for the global shipping industry. Clarksons Research is part of the Clarksons group, the world’s largest provider of shipbroking and integrated shipping services. For more detail about the Clarksons group visit www.clarksons.com.
Lice
nsed
to D
imitr
ios
Vou
tsar
as o
f LIS
CR
, LLC
. Dis
trib
utio
n is
res
tric
ted;
ple
ase
rem
embe
r to
ack
now
ledg
e th
e so
urce
. http
://w
ww
.cla
rkso
ns.n
et 1
2921
9 Licensed to Dim
itrios Voutsaras of LIS
CR
, LLC. D
istribution is restricted; please remem
ber to acknowledge the source. http://w
ww
.clarksons.net 129219
Clarksons Research Page 2
Regulatory News
Aug-19
SOx Emissions • The French Port of Cannes in the Mediterranean Sea will reportedly impose a 0.1% sulphur emissions limit for cruise ships entering its waters from 1st January 2020, the same date as the IMO’s forthcoming global 0.5% limit. Cruise lines that do not adhere to the limit will not be permitted to let their passengers disembark at the port, with Norwegian Cruise Line and Silversea Cruises both already having signed environmental charters agreeing to the new regulation. • The Maritime Safety Administration of China announced in a draft plan published on 22 July that it is planning to extend the ban on ships discharging open-loop scrubber waste water to include all waters within the Chinese coastal ECA, including around the island of Hainan. The new regulation will reportedly come into effect from January 1st 2020. Previously, the ban had only included port waters within the domestic ECA, as well as both inland river ECAs and the entire Bohai Bay area. Alternative Fuels • Belgian shipowner Compagnie Maritime Belge (CMB) has reportedly signed an agreement with Japanese small vessel builder Tsuneishi Facilities & Craft (TFC), a subsidiary of Tsuneishi Holdings, to construct a hydrogen-powered passenger ferry. Upon receiving approval from the necessary regulatory bodies, the vessel will be constructed at TFC’s facility in Onomichi, with delivery reportedly set to be scheduled in 2021. • A consortium of Japanese companies, consisting of Asahi Tanker, Exeno Yamamizu, Mitsui O.S.K. Lines and Mitsubishi Corporation, have reportedly announced a strategic partnership to establish a new company that will focus on developing and promoting clean modes of marine transport. The company will be called e5 Lab and its first objective is reportedly to construct a battery-powered zero-emissions tanker by mid-2021, to be used for coastal operations in Tokyo Bay. • Meanwhile, Mitsui O.S.K. Lines (MOL) has reportedly launched a new study group, which aims to reduce CO2 emissions in shipping by developing synthetic methane as an alternative bunker fuel. In addition, MOL has joined the Carbon Capture & Reuse Study Group, which is working on developing a new energy supply system by 2050 using alternative shipping fuels such as synthetic methane and methanol. • Norwegian yard Ulstein Verft delivered the “COLOR HYBRID” passenger/car
ferry in August to compatriot owner Color Line. The 2,000 pax unit is one the largest vessels to be equipped with battery/diesel hybrid technology, and its 65-tonne battery pack can reportedly be recharged in one hour using shore power available at Sandefjord. Low Sulphur Fuel • US oil major ExxonMobil has confirmed that its new Mobilgard 540 cylinder oil, designed for use with fuels that are compliant with the IMO’s incoming 2020 sulphur emissions regulation, will be available from 2 September 2019. The new lubricant will be available at major ports around the world, including Hong Kong, Singapore, Antwerp, Rotterdam and Amsterdam. Ship Technology • Classification society DNV GL has reportedly awarded a joint Approval in Principle (AIP) to Japanese shipowner K Line and builder Namura Shipbuilding for a new LNG-fuelled ore carrier design. The new design is based on Namura’s second generation ‘Wozmax’ ore carrier, designed for transporting iron ore from Western Australia, and will reportedly meet EEDI phase 3 requirements. • UK Maritime Minister Nusrat Ghani announced in July 2019 that all vessels ordered for domestic operations in UK waters from 2025 must be designed with zero-emission capable technologies. This commitment is set out in the government’s Clean Maritime Plan, which is part of the wider Clean Air Strategy which aims to deliver on the UK’s commitment of to ‘net-zero’ greenhouse gas emissions by 2050. • South Korean ‘big 3’ shipbuilding group Samsung HI announced that it has obtained a type approval certificate from classification society DNV GL for its new lithium ion battery system, developed jointly with battery manufacturer and fellow Samsung subsidiary Samsung SDI. The system reportedly reduces fuel consumption by controlling and managing the on-board generators and power load system. Vessel Speeds • The Panama Canal has reportedly announced that it is imposing a speed limit of ten knots in order to reduce the risk of vessels colliding with whales, dolphins and other large aquatic mammals during their seasonal migration period. The new limit will be in place in certain areas south of the canal between 1 August and 30 November 2019, with a similar limit likely to be imposed in future years.
• • • • • • • • • • • •
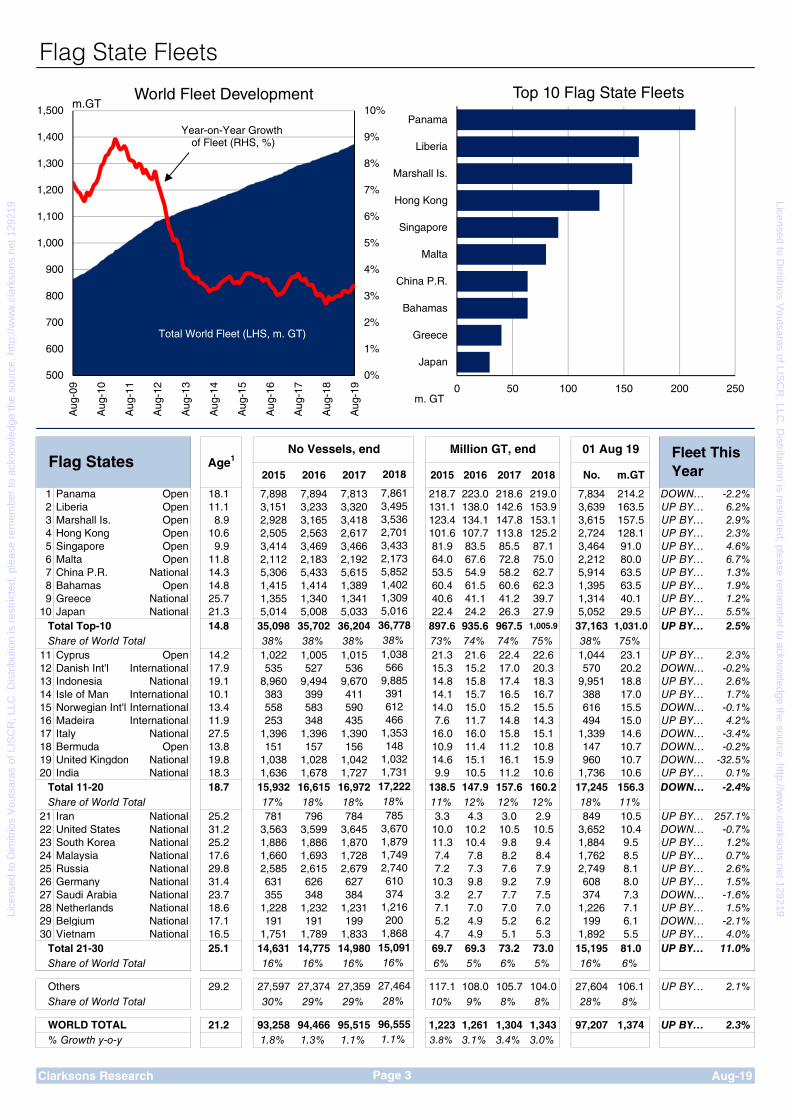
Fleet Highlights, August 2019 • The global fleet has grown by 2.3% in the year so far in GT terms, reaching 97,207 vessels of a combined 1.4bn GT at the start of August 2019. Meanwhile, the average age of vessels in the fleet currently stands at 21.2 years, up by 0.5 years compared to the same time last year. • Year to date contracting has reached 491 vessels of a combined 20.9m GT, with Chinese owners accounting for the largest share of contracts placed in GT terms, 29%. Meanwhile, delivery volumes have reached 1,059 ships of 39.5m GT, with Japanese owners accounting for the largest GT share (21%), while demolition has reached 392 vessels of 7.9m GT, with the largest share accounted for by Greek owners (15%). • The top 10 flag states, in terms of flagged GT at start August 2019, accounted a total fleet of 36,778 vessels of 1.0bn GT, 75% of the total fleet in GT terms. Meanwhile, IACS-member classification societies accounted for 95% of total start August fleet GT, with a fleet of 53,476 vessels of a combined 1.3bn GT.
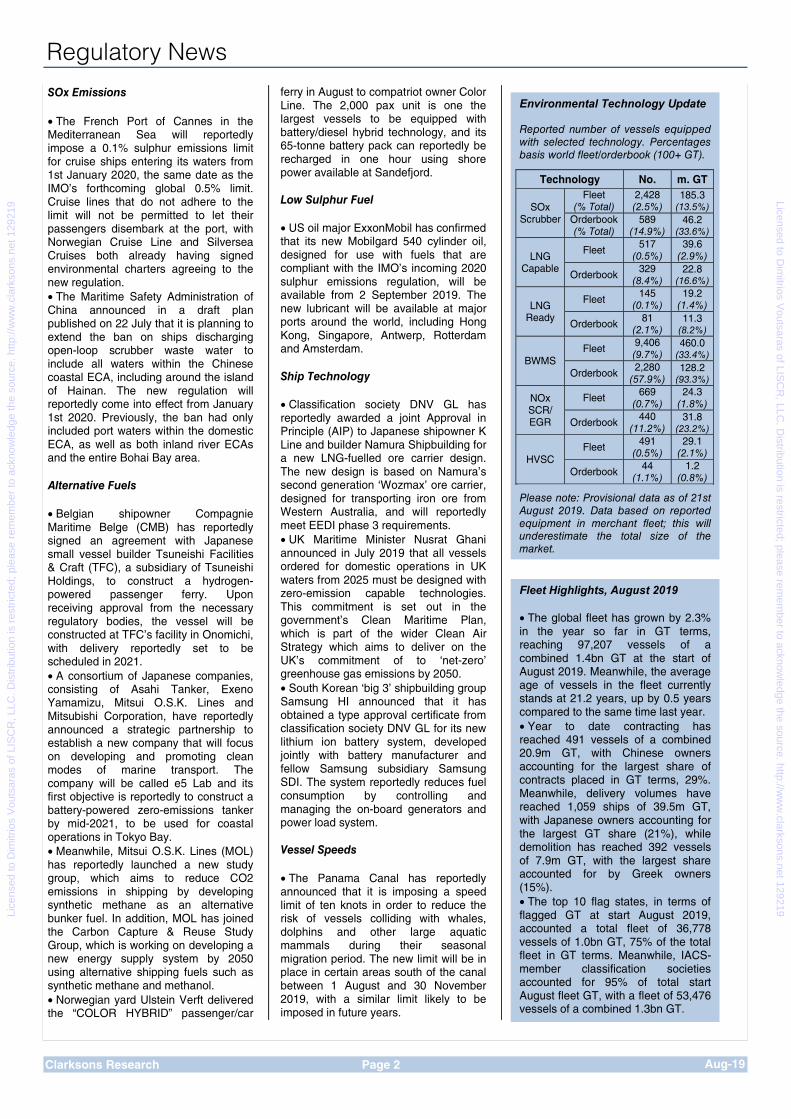
Environmental Technology Update Reported number of vessels equipped with selected technology. Percentages basis world fleet/orderbook (100+ GT).
Technology No. m. GT
SOx Scrubber
Fleet (% Total)
2,428 (2.5%)
185.3 (13.5%)
Orderbook (% Total)
589 (14.9%)
46.2 (33.6%)
LNG Capable
Fleet 517
(0.5%) 39.6
(2.9%)
Orderbook 329
(8.4%) 22.8
(16.6%)
LNG Ready
Fleet 145
(0.1%) 19.2
(1.4%)
Orderbook 81 (2.1%)
11.3 (8.2%)
BWMS Fleet
9,406 (9.7%)
460.0 (33.4%)
Orderbook 2,280 (57.9%)
128.2 (93.3%)
NOx SCR/ EGR
Fleet 669 (0.7%)
24.3 (1.8%)
Orderbook 440 (11.2%)
31.8 (23.2%)
HVSC Fleet 491
(0.5%) 29.1
(2.1%)
Orderbook 44 (1.1%)
1.2 (0.8%)
Please note: Provisional data as of 21st August 2019. Data based on reported equipment in merchant fleet; this will underestimate the total size of the market.
Lice
nsed
to D
imitr
ios
Vou
tsar
as o
f LIS
CR
, LLC
. Dis
trib
utio
n is
res
tric
ted;
ple
ase
rem
embe
r to
ack
now
ledg
e th
e so
urce
. http
://w
ww
.cla
rkso
ns.n
et 1
2921
9 Licensed to Dim
itrios Voutsaras of LIS
CR
, LLC. D
istribution is restricted; please remem
ber to acknowledge the source. http://w
ww
.clarksons.net 129219
2015 2016 2017 2015 2016 2017 2018 No. m.GT
1 Panama Open 18.1 7,898 7,894 7,813 218.7 223.0 218.6 219.0 7,834 214.2 DOWN… -2.2%2 Liberia Open 11.1 3,151 3,233 3,320 131.1 138.0 142.6 153.9 3,639 163.5 UP BY… 6.2%3 Marshall Is. Open 8.9 2,928 3,165 3,418 123.4 134.1 147.8 153.1 3,615 157.5 UP BY… 2.9%4 Hong Kong Open 10.6 2,505 2,563 2,617 101.6 107.7 113.8 125.2 2,724 128.1 UP BY… 2.3%5 Singapore Open 9.9 3,414 3,469 3,466 81.9 83.5 85.5 87.1 3,464 91.0 UP BY… 4.6%6 Malta Open 11.8 2,112 2,183 2,192 64.0 67.6 72.8 75.0 2,212 80.0 UP BY… 6.7%7 China P.R. National 14.3 5,306 5,433 5,615 53.5 54.9 58.2 62.7 5,914 63.5 UP BY… 1.3%8 Bahamas Open 14.8 1,415 1,414 1,389 60.4 61.5 60.6 62.3 1,395 63.5 UP BY… 1.9%9 Greece National 25.7 1,355 1,340 1,341 40.6 41.1 41.2 39.7 1,314 40.1 UP BY… 1.2%
10 Japan National 21.3 5,014 5,008 5,033 22.4 24.2 26.3 27.9 5,052 29.5 UP BY… 5.5%Total Top-10 14.8 35,098 35,702 36,204 897.6 935.6 967.5 1,005.9 37,163 1,031.0 UP BY… 2.5%Share of World Total 38% 38% 38% 73% 74% 74% 75% 38% 75%
11 Cyprus Open 14.2 1,022 1,005 1,015 21.3 21.6 22.4 22.6 1,044 23.1 UP BY… 2.3%12 Danish Int'l International 17.9 535 527 536 15.3 15.2 17.0 20.3 570 20.2 DOWN… -0.2%13 Indonesia National 19.1 8,960 9,494 9,670 14.8 15.8 17.4 18.3 9,951 18.8 UP BY… 2.6%14 Isle of Man International 10.1 383 399 411 14.1 15.7 16.5 16.7 388 17.0 UP BY… 1.7%15 Norwegian Int'l International 13.4 558 583 590 14.0 15.0 15.2 15.5 616 15.5 DOWN… -0.1%16 Madeira International 11.9 253 348 435 7.6 11.7 14.8 14.3 494 15.0 UP BY… 4.2%17 Italy National 27.5 1,396 1,396 1,390 16.0 16.0 15.8 15.1 1,339 14.6 DOWN… -3.4%18 Bermuda Open 13.8 151 157 156 10.9 11.4 11.2 10.8 147 10.7 DOWN… -0.2%19 United Kingdom National 19.8 1,038 1,028 1,042 14.6 15.1 16.1 15.9 960 10.7 DOWN… -32.5%20 India National 18.3 1,636 1,678 1,727 9.9 10.5 11.2 10.6 1,736 10.6 UP BY… 0.1%
Total 11-20 18.7 15,932 16,615 16,972 138.5 147.9 157.6 160.2 17,245 156.3 DOWN… -2.4%Share of World Total 17% 18% 18% 11% 12% 12% 12% 18% 11%
21 Iran National 25.2 781 796 784 3.3 4.3 3.0 2.9 849 10.5 UP BY… 257.1%22 United States National 31.2 3,563 3,599 3,645 10.0 10.2 10.5 10.5 3,652 10.4 DOWN… -0.7%23 South Korea National 25.2 1,886 1,886 1,870 11.3 10.4 9.8 9.4 1,884 9.5 UP BY… 1.2%24 Malaysia National 17.6 1,660 1,693 1,728 7.4 7.8 8.2 8.4 1,762 8.5 UP BY… 0.7%25 Russia National 29.8 2,585 2,615 2,679 7.2 7.3 7.6 7.9 2,749 8.1 UP BY… 2.6%26 Germany National 31.4 631 626 627 10.3 9.8 9.2 7.9 608 8.0 UP BY… 1.5%27 Saudi Arabia National 23.7 355 348 384 3.2 2.7 7.7 7.5 374 7.3 DOWN… -1.6%28 Netherlands National 18.6 1,228 1,232 1,231 7.1 7.0 7.0 7.0 1,226 7.1 UP BY… 1.5%29 Belgium National 17.1 191 191 199 5.2 4.9 5.2 6.2 199 6.1 DOWN… -2.1%30 Vietnam National 16.5 1,751 1,789 1,833 4.7 4.9 5.1 5.3 1,892 5.5 UP BY… 4.0%
Total 21-30 25.1 14,631 14,775 14,980 69.7 69.3 73.2 73.0 15,195 81.0 UP BY… 11.0%Share of World Total 16% 16% 16% 6% 5% 6% 5% 16% 6%
Others 29.2 27,597 27,374 27,359 117.1 108.0 105.7 104.0 27,604 106.1 UP BY… 2.1%Share of World Total 30% 29% 29% 10% 9% 8% 8% 28% 8%
WORLD TOTAL 21.2 93,258 94,466 95,515 1,223 1,261 1,304 1,343 97,207 1,374 UP BY… 2.3%% Growth y-o-y 1.8% 1.3% 1.1% 3.8% 3.1% 3.4% 3.0%
Clarksons Research Aug-19
96,5551.1%
Page 3
15,09116%
27,46428%
2,740610374
1,216200
1,868
17,22218%785
3,6701,8791,749
612466
1,353148
1,0321,731
36,77838%1,038566
9,885391
3,4332,1735,8521,4021,3095,016
2018
7,8613,4953,5362,701
Flag State Fleets
Flag States Age1No Vessels, end Million GT, end 01 Aug 19 Fleet This
Year
0 50 100 150 200 250
Japan
Greece
Bahamas
China P.R.
Malta
Singapore
Hong Kong
Marshall Is.
Liberia
Panama
m. GT
Top 10 Flag State Fleets
0%
1%
2%
3%
4%
5%
6%
7%
8%
9%
10%
500
600
700
800
900
1,000
1,100
1,200
1,300
1,400
1,500
Aug
-09
Aug
-10
Aug
-11
Aug
-12
Aug
-13
Aug
-14
Aug
-15
Aug
-16
Aug
-17
Aug
-18
Aug
-19
m.GTWorld Fleet Development
Total World Fleet (LHS, m. GT)
Year-on-Year Growth of Fleet (RHS, %)
Lice
nsed
to D
imitr
ios
Vou
tsar
as o
f LIS
CR
, LLC
. Dis
trib
utio
n is
res
tric
ted;
ple
ase
rem
embe
r to
ack
now
ledg
e th
e so
urce
. http
://w
ww
.cla
rkso
ns.n
et 1
2921
9 Licensed to Dim
itrios Voutsaras of LIS
CR
, LLC. D
istribution is restricted; please remem
ber to acknowledge the source. http://w
ww
.clarksons.net 129219

2015 2016 2017 2018 2015 2016 2017 2018 No. m.GT
Malta Open 11.8 2,112 2,183 2,192 2,173 64.0 67.6 72.8 75.0 2,212 80.0 UP BY… 6.7%Greece National 25.7 1,355 1,340 1,341 1,309 40.6 41.1 41.2 39.7 1,314 40.1 UP BY… 1.2%Cyprus Open 14.2 1,022 1,005 1,015 1,038 21.3 21.6 22.4 22.6 1,044 23.1 UP BY… 2.3%Danish Int'l International 17.9 535 527 536 566 15.3 15.2 17.0 20.3 570 20.2 DOWN… -0.2%Madeira International 11.9 253 348 435 466 7.6 11.7 14.8 14.3 494 15.0 UP BY… 4.2%Italy National 27.5 1,396 1,396 1,390 1,353 16.0 16.0 15.8 15.1 1,339 14.6 DOWN… -3.4%United Kingdom National 19.8 1,038 1,028 1,042 1,032 14.6 15.1 16.1 15.9 960 10.7 DOWN… -32.5%Germany National 31.4 631 626 627 610 10.3 9.8 9.2 7.9 608 8.0 UP BY… 1.5%Netherlands National 18.6 1,228 1,232 1,231 1,216 7.1 7.0 7.0 7.0 1,226 7.1 UP BY… 1.5%Belgium National 17.1 191 191 199 200 5.2 4.9 5.2 6.2 199 6.1 DOWN… -2.1%Reg Int. Francais International 11.2 94 99 95 94 4.3 4.5 4.3 4.6 94 4.5 DOWN… -1.4%Spain National 25.9 461 462 471 481 2.2 2.4 2.4 2.4 474 2.5 UP BY… 0.8%Sweden National 45.5 366 359 351 360 2.6 2.3 2.1 2.2 366 2.2 UP BY… 2.0%France National 27.2 435 435 440 445 1.5 1.5 1.5 1.6 453 1.9 UP BY… 19.3%Gibraltar Open 13.8 295 278 247 232 2.9 2.5 2.2 2.0 226 1.9 DOWN… -5.1%Finland National 38.9 262 266 263 269 1.7 1.8 1.6 1.7 272 1.7 UP BY… 2.6%Croatia National 28.7 287 314 327 336 1.3 1.3 1.3 1.3 337 1.2 DOWN… -5.2%Luxembourg Open 11.7 160 154 148 143 2.6 1.9 1.5 1.2 145 1.2 UP BY… 1.4%Portugal National 32.9 150 150 154 159 0.2 0.1 0.3 0.4 161 0.4 UP BY… 2.6%Estonia National 29.8 70 71 69 69 0.4 0.4 0.4 0.4 73 0.4 UP BY… 2.0%Lithuania National 28.9 65 60 63 58 0.4 0.3 0.4 0.3 60 0.4 UP BY… 16.2%Others (12) 35.9 611 612 622 624 0.8 0.8 0.8 0.8 626 0.9 UP BY… 0.9%Total EU - Europe 22.0 13,017 13,136 13,258 13,233 222.9 229.8 240.4 242.9 13,253 244.2 UP BY… 0.5%
2015 2016 2017 2018 2015 2016 2017 2018 No. m.GT
Isle of Man International 10.1 383 399 411 391 14.1 15.7 16.5 16.7 388 17.0 UP BY… 1.7%Norwegian Int'l International 13.4 558 583 590 612 14.0 15.0 15.2 15.5 616 15.5 DOWN… -0.1%Russia National 29.8 2,585 2,615 2,679 2,740 7.2 7.3 7.6 7.9 2,749 8.1 UP BY… 2.6%Turkey National 26.7 1,260 1,268 1,255 1,234 6.0 5.8 5.7 5.5 1,232 5.3 DOWN… -3.2%Norway National 33.2 971 967 965 964 2.6 2.7 2.7 2.7 981 2.9 UP BY… 5.0%Azerbaijan National 31.1 283 293 300 305 0.7 0.7 0.8 0.8 305 0.8 SAME 0.0%Switzerland National 11.9 49 52 37 32 0.9 1.1 0.9 0.7 32 0.7 SAME 0.0%Moldova National 37.7 180 166 143 143 0.5 0.5 0.4 0.4 138 0.4 UP BY… 6.3%Ukraine National 38.3 420 413 402 408 0.4 0.4 0.4 0.4 409 0.4 UP BY… 0.5%Faeroes National 26.7 100 102 104 107 0.3 0.3 0.4 0.4 107 0.4 DOWN… -1.9%Others (14) 36.9 290 291 297 299 0.6 0.6 0.6 0.6 301 0.6 DOWN… -2.5%Total Other Europe 28.1 7,079 7,149 7,183 7,235 47.5 50.0 51.1 51.7 7,258 52.1 UP BY… 0.9%
2015 2016 2017 2018 2015 2016 2017 2018 No. m.GT
Bermuda Open 13.8 151 157 156 148 10.9 11.4 11.2 10.8 147 10.7 DOWN… -0.2%United States National 31.2 3,563 3,599 3,645 3,670 10.0 10.2 10.5 10.5 3,652 10.4 DOWN… -0.7%Canada National 38.4 648 644 660 669 2.8 2.7 3.0 2.9 676 3.0 UP BY… 2.5%Total North America 31.7 4,362 4,400 4,461 4,487 23.7 24.3 24.7 24.1 4,475 24.1 DOWN… -0.1%Panama Open 18.1 7,898 7,894 7,813 7,861 218.7 223.0 218.6 219.0 7,834 214.2 DOWN… -2.2%Bahamas Open 14.8 1,415 1,414 1,389 1,402 60.4 61.5 60.6 62.3 1,395 63.5 UP BY… 1.9%Antigua & B. Open 15.1 1,045 956 845 780 8.7 7.8 6.5 5.7 762 5.5 DOWN… -3.5%Others (27) 29.2 3,657 3,696 3,732 3,771 13.5 14.3 14.6 14.6 3,814 14.4 DOWN… -1.1%Total Caribs 20.6 14,015 13,960 13,779 13,814 301.2 306.6 300.3 301.5 13,805 297.6 DOWN… -1.3%Brazil National 18.9 738 782 816 865 3.3 3.4 3.5 3.8 873 4.0 UP BY… 4.5%Venezuela National 31.7 285 292 298 290 1.3 1.2 1.2 1.1 287 1.0 DOWN… -10.3%Argentina National 33.5 171 185 189 192 0.4 0.4 0.4 0.4 197 0.5 UP BY… 24.6%Others (6) 41.9 229 241 238 235 0.2 0.2 0.2 0.2 235 0.2 UP BY… 1.3%Total ECSA 26.4 1,423 1,500 1,541 1,582 5.2 5.3 5.3 5.6 1,592 5.7 UP BY… 3.0%Chile National 23.5 203 219 221 222 0.7 0.8 0.9 0.8 223 0.8 DOWN… -1.4%Peru National 24.7 93 96 99 98 0.4 0.3 0.4 0.3 99 0.3 DOWN… -3.4%Ecuador National 26.0 136 139 136 136 0.3 0.3 0.3 0.2 137 0.2 UP BY… 2.7%Colombia National 27.1 108 108 111 115 0.1 0.1 0.1 0.1 116 0.1 UP BY… 3.5%Bolivia Open 27.1 54 47 43 43 0.1 0.1 0.1 0.1 43 0.1 DOWN… -1.9%Total WCSA 25.2 594 609 610 614 1.5 1.6 1.8 1.5 618 1.5 DOWN… -1.1%Total Americas 21.6 20,394 20,469 20,391 20,497 331.6 337.8 332.1 332.8 20,490 329.0 DOWN… -1.1%
Clarksons Research Page 4 Aug-19
Americas Age1No Vessels, end Million GT, end 01 Aug 19 Fleet This
Year
Other Europe Age1No Vessels, end Million GT, end 01 Aug 19 Fleet This
Year
Flag State Fleets - Europe/Americas
EU-Europe Age1No Vessels, end Million GT, end 01 Aug 19 Fleet This
Year
Lice
nsed
to D
imitr
ios
Vou
tsar
as o
f LIS
CR
, LLC
. Dis
trib
utio
n is
res
tric
ted;
ple
ase
rem
embe
r to
ack
now
ledg
e th
e so
urce
. http
://w
ww
.cla
rkso
ns.n
et 1
2921
9 Licensed to Dim
itrios Voutsaras of LIS
CR
, LLC. D
istribution is restricted; please remem
ber to acknowledge the source. http://w
ww
.clarksons.net 129219
2015 2016 2017 2018 2015 2016 2017 2018 No. m.GT
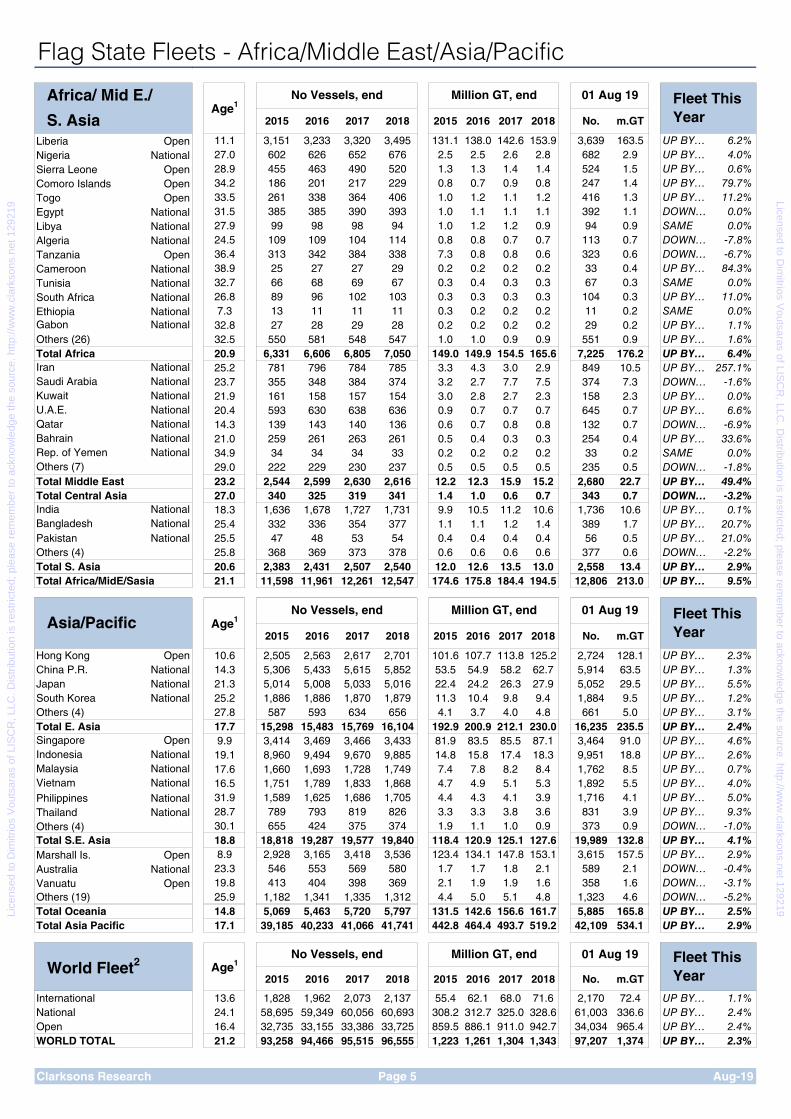
Liberia Open 11.1 3,151 3,233 3,320 3,495 131.1 138.0 142.6 153.9 3,639 163.5 UP BY… 6.2%Nigeria National 27.0 602 626 652 676 2.5 2.5 2.6 2.8 682 2.9 UP BY… 4.0%Sierra Leone Open 28.9 455 463 490 520 1.3 1.3 1.4 1.4 524 1.5 UP BY… 0.6%Comoro Islands Open 34.2 186 201 217 229 0.8 0.7 0.9 0.8 247 1.4 UP BY… 79.7%Togo Open 33.5 261 338 364 406 1.0 1.2 1.1 1.2 416 1.3 UP BY… 11.2%Egypt National 31.5 385 385 390 393 1.0 1.1 1.1 1.1 392 1.1 DOWN… 0.0%Libya National 27.9 99 98 98 94 1.0 1.2 1.2 0.9 94 0.9 SAME 0.0%Algeria National 24.5 109 109 104 114 0.8 0.8 0.7 0.7 113 0.7 DOWN… -7.8%Tanzania Open 36.4 313 342 384 338 7.3 0.8 0.8 0.6 323 0.6 DOWN… -6.7%Cameroon National 38.9 25 27 27 29 0.2 0.2 0.2 0.2 33 0.4 UP BY… 84.3%Tunisia National 32.7 66 68 69 67 0.3 0.4 0.3 0.3 67 0.3 SAME 0.0%South Africa National 26.8 89 96 102 103 0.3 0.3 0.3 0.3 104 0.3 UP BY… 11.0%Ethiopia National 7.3 13 11 11 11 0.3 0.2 0.2 0.2 11 0.2 SAME 0.0%Gabon National 32.8 27 28 29 28 0.2 0.2 0.2 0.2 29 0.2 UP BY… 1.1%Others (26) 32.5 550 581 548 547 1.0 1.0 0.9 0.9 551 0.9 UP BY… 1.6%Total Africa 20.9 6,331 6,606 6,805 7,050 149.0 149.9 154.5 165.6 7,225 176.2 UP BY… 6.4%Iran National 25.2 781 796 784 785 3.3 4.3 3.0 2.9 849 10.5 UP BY… 257.1%Saudi Arabia National 23.7 355 348 384 374 3.2 2.7 7.7 7.5 374 7.3 DOWN… -1.6%Kuwait National 21.9 161 158 157 154 3.0 2.8 2.7 2.3 158 2.3 UP BY… 0.0%U.A.E. National 20.4 593 630 638 636 0.9 0.7 0.7 0.7 645 0.7 UP BY… 6.6%Qatar National 14.3 139 143 140 136 0.6 0.7 0.8 0.8 132 0.7 DOWN… -6.9%Bahrain National 21.0 259 261 263 261 0.5 0.4 0.3 0.3 254 0.4 UP BY… 33.6%Rep. of Yemen National 34.9 34 34 34 33 0.2 0.2 0.2 0.2 33 0.2 SAME 0.0%Others (7) 29.0 222 229 230 237 0.5 0.5 0.5 0.5 235 0.5 DOWN… -1.8%Total Middle East 23.2 2,544 2,599 2,630 2,616 12.2 12.3 15.9 15.2 2,680 22.7 UP BY… 49.4%Total Central Asia 27.0 340 325 319 341 1.4 1.0 0.6 0.7 343 0.7 DOWN… -3.2%India National 18.3 1,636 1,678 1,727 1,731 9.9 10.5 11.2 10.6 1,736 10.6 UP BY… 0.1%Bangladesh National 25.4 332 336 354 377 1.1 1.1 1.2 1.4 389 1.7 UP BY… 20.7%Pakistan National 25.5 47 48 53 54 0.4 0.4 0.4 0.4 56 0.5 UP BY… 21.0%Others (4) 25.8 368 369 373 378 0.6 0.6 0.6 0.6 377 0.6 DOWN… -2.2%Total S. Asia 20.6 2,383 2,431 2,507 2,540 12.0 12.6 13.5 13.0 2,558 13.4 UP BY… 2.9%Total Africa/MidE/Sasia 21.1 11,598 11,961 12,261 12,547 174.6 175.8 184.4 194.5 12,806 213.0 UP BY… 9.5%
2015 2016 2017 2018 2015 2016 2017 2018 No. m.GT
Hong Kong Open 10.6 2,505 2,563 2,617 2,701 101.6 107.7 113.8 125.2 2,724 128.1 UP BY… 2.3%China P.R. National 14.3 5,306 5,433 5,615 5,852 53.5 54.9 58.2 62.7 5,914 63.5 UP BY… 1.3%Japan National 21.3 5,014 5,008 5,033 5,016 22.4 24.2 26.3 27.9 5,052 29.5 UP BY… 5.5%South Korea National 25.2 1,886 1,886 1,870 1,879 11.3 10.4 9.8 9.4 1,884 9.5 UP BY… 1.2%Others (4) 27.8 587 593 634 656 4.1 3.7 4.0 4.8 661 5.0 UP BY… 3.1%Total E. Asia 17.7 15,298 15,483 15,769 16,104 192.9 200.9 212.1 230.0 16,235 235.5 UP BY… 2.4%Singapore Open 9.9 3,414 3,469 3,466 3,433 81.9 83.5 85.5 87.1 3,464 91.0 UP BY… 4.6%Indonesia National 19.1 8,960 9,494 9,670 9,885 14.8 15.8 17.4 18.3 9,951 18.8 UP BY… 2.6%Malaysia National 17.6 1,660 1,693 1,728 1,749 7.4 7.8 8.2 8.4 1,762 8.5 UP BY… 0.7%Vietnam National 16.5 1,751 1,789 1,833 1,868 4.7 4.9 5.1 5.3 1,892 5.5 UP BY… 4.0%Philippines National 31.9 1,589 1,625 1,686 1,705 4.4 4.3 4.1 3.9 1,716 4.1 UP BY… 5.0%Thailand National 28.7 789 793 819 826 3.3 3.3 3.8 3.6 831 3.9 UP BY… 9.3%Others (4) 30.1 655 424 375 374 1.9 1.1 1.0 0.9 373 0.9 DOWN… -1.0%Total S.E. Asia 18.8 18,818 19,287 19,577 19,840 118.4 120.9 125.1 127.6 19,989 132.8 UP BY… 4.1%Marshall Is. Open 8.9 2,928 3,165 3,418 3,536 123.4 134.1 147.8 153.1 3,615 157.5 UP BY… 2.9%Australia National 23.3 546 553 569 580 1.7 1.7 1.8 2.1 589 2.1 DOWN… -0.4%Vanuatu Open 19.8 413 404 398 369 2.1 1.9 1.9 1.6 358 1.6 DOWN… -3.1%Others (19) 25.9 1,182 1,341 1,335 1,312 4.4 5.0 5.1 4.8 1,323 4.6 DOWN… -5.2%Total Oceania 14.8 5,069 5,463 5,720 5,797 131.5 142.6 156.6 161.7 5,885 165.8 UP BY… 2.5%Total Asia Pacific 17.1 39,185 40,233 41,066 41,741 442.8 464.4 493.7 519.2 42,109 534.1 UP BY… 2.9%
2015 2016 2017 2018 2015 2016 2017 2018 No. m.GT
International 13.6 1,828 1,962 2,073 2,137 55.4 62.1 68.0 71.6 2,170 72.4 UP BY… 1.1%National 24.1 58,695 59,349 60,056 60,693 308.2 312.7 325.0 328.6 61,003 336.6 UP BY… 2.4%Open 16.4 32,735 33,155 33,386 33,725 859.5 886.1 911.0 942.7 34,034 965.4 UP BY… 2.4%WORLD TOTAL 21.2 93,258 94,466 95,515 96,555 1,223 1,261 1,304 1,343 97,207 1,374 UP BY… 2.3%
Clarksons Research Page 5 Aug-19
World Fleet2 Age1No Vessels, end Million GT, end 01 Aug 19 Fleet This
Year
S. Asia
Asia/Pacific Age1No Vessels, end Million GT, end 01 Aug 19 Fleet This
Year
Flag State Fleets - Africa/Middle East/Asia/Pacific
Africa/ Mid E./ Age1
No Vessels, end Million GT, end 01 Aug 19 Fleet This Year
Lice
nsed
to D
imitr
ios
Vou
tsar
as o
f LIS
CR
, LLC
. Dis
trib
utio
n is
res
tric
ted;
ple
ase
rem
embe
r to
ack
now
ledg
e th
e so
urce
. http
://w
ww
.cla
rkso
ns.n
et 1
2921
9 Licensed to Dim
itrios Voutsaras of LIS
CR
, LLC. D
istribution is restricted; please remem
ber to acknowledge the source. http://w
ww
.clarksons.net 129219

IACS3 Membership, million GT Other
DNVGL NK ABS LR BV China Korea RI Russia India Polski CRS Total Socs
EU-Europe 61.9 11.7 52.0 51.4 37.9 5.4 1.7 23.5 1.6 0.3 0.6 1.2 241.1 0.3 244.2Other Europe 21.1 3.4 3.3 10.1 2.7 0.1 0.2 0.8 6.7 0.0 0.0 0.0 47.5 1.4 52.1North America 4.6 0.0 9.7 6.9 1.1 0.0 0.0 0.0 0.0 0.0 0.0 0.0 22.4 0.0 24.1Other America 52.1 120.5 39.0 31.4 19.8 5.2 25.4 5.5 1.5 0.8 1.6 0.2 293.3 8.4 304.9Africa 46.8 28.1 30.2 32.8 20.2 6.1 4.5 4.0 1.3 0.1 1.0 0.0 169.4 1.8 176.2Mid-East/S. Asia 5.1 2.3 5.3 7.6 1.7 2.8 1.1 0.9 0.1 10.2 2.3 0.0 31.2 0.9 36.7Asia/Pacific 80.7 88.9 100.2 82.0 34.2 106.3 31.2 5.3 0.4 0.1 0.1 0.2 500.8 23.4 534.1
TOTAL2 272.7 254.9 239.8 222.5 117.8 126.0 64.0 40.0 11.6 11.5 5.6 1.7 1,306.6 36.2 1,374.5
Top 20 IACS3 Membership, million GT Other
Flag States DNVGL NK ABS LR BV China Korea RI Russia India Polski CRS Total Socs
1 Panama 22.9 110.1 18.5 15.6 12.8 4.7 24.7 3.9 0.6 0.7 0.6 0.1 207.6 7.7 214.22 Liberia 46.0 27.4 29.4 30.7 18.0 6.0 4.4 3.8 1.2 0.1 0.4 0.0 161.7 0.1 163.53 Marshall Is. 34.8 21.3 37.8 29.4 17.7 2.4 17.6 2.2 0.0 0.0 0.0 0.0 155.7 0.1 157.54 Hong Kong 24.2 10.9 28.8 26.8 6.4 42.9 3.4 0.3 0.3 0.0 0.0 0.0 127.5 0.0 128.15 Singapore 17.3 20.9 25.8 17.8 3.6 6.8 0.9 0.4 0.0 0.0 0.0 0.0 90.6 0.1 91.06 Malta 20.1 5.9 16.3 13.2 18.1 3.4 0.7 4.2 0.5 0.3 0.2 0.0 79.6 0.1 80.07 China P.R. 0.7 0.1 0.2 0.1 0.4 53.7 0.0 0.0 0.0 0.0 0.0 0.0 54.4 5.0 63.58 Bahamas 22.0 6.6 16.7 11.9 4.3 0.2 0.4 0.7 0.6 0.0 0.8 0.1 62.6 0.0 63.59 Greece 8.0 0.6 14.2 11.1 2.9 1.6 0.7 0.9 0.0 0.0 0.0 0.0 39.5 0.1 40.1
10 Japan 0.0 26.4 0.2 0.6 0.0 0.0 0.0 0.0 0.0 0.0 0.0 0.0 26.9 0.0 29.5Total Top-10 196.1 230.2 188.0 157.2 84.2 121.7 52.8 16.4 3.2 1.1 2.0 0.3 1,006.1 13.3 1,031.0Share of World Total 72% 90% 78% 71% 72% 97% 82% 41% 27% 10% 36% 18% 77% 37% 75%
11 Cyprus 6.8 2.9 1.8 5.3 3.2 0.3 0.2 2.0 1.1 0.0 0.2 0.0 22.8 0.0 23.112 Danish Int'l 1.5 0.1 13.7 4.1 0.6 0.2 0.0 0.1 0.0 0.0 0.0 0.0 20.2 0.0 20.213 Indonesia 1.3 2.7 1.8 0.8 0.8 0.3 0.5 1.9 0.0 0.0 0.0 0.0 9.9 8.9 18.814 Isle of Man 5.4 1.7 1.5 7.1 1.1 0.0 0.1 0.0 0.0 0.0 0.0 0.0 17.0 0.0 17.015 Norwegian Int'l 11.5 0.6 0.9 1.7 0.7 0.1 0.0 0.1 0.0 0.0 0.0 0.0 15.3 0.0 15.516 Madeira 7.9 1.2 1.7 2.1 1.4 0.0 0.1 0.4 0.0 0.0 0.0 0.0 14.8 0.0 15.017 Italy 0.9 0.0 1.1 0.0 0.2 0.0 0.0 13.5 0.0 0.0 0.0 0.0 14.4 0.0 14.618 Bermuda 2.4 0.0 3.0 4.4 1.0 0.0 0.0 0.0 0.0 0.0 0.0 0.0 10.7 0.0 10.719 United Kingdom 1.6 0.9 1.2 5.8 1.0 0.0 0.0 0.5 0.0 0.0 0.0 0.0 10.5 0.0 10.720 India 1.4 0.6 2.5 2.4 0.4 0.0 0.1 0.0 0.0 10.1 0.0 0.0 10.2 0.1 10.6
Total 11-20 40.7 10.7 29.2 33.7 10.3 0.9 1.0 18.5 1.1 10.1 0.2 0.0 145.8 9.0 156.3Share of World Total 15% 4% 12% 15% 9% 1% 2% 46% 9% 88% 4% 0% 11% 25% 11%
Others 35.9 14.1 22.6 31.6 23.2 3.3 10.2 5.0 7.4 0.3 3.4 1.4 154.6 13.9 187.1Share of World Total 13% 6% 9% 14% 20% 3% 16% 12% 64% 2% 60% 82% 12% 38% 14%
WORLD TOTAL 272.7 254.9 239.8 222.5 117.8 126.0 64.0 40.0 11.6 11.5 5.6 1.7 1,306.6 36.2 1,374.5Note: Because some ships have multiple class, the sums of the individual classification societies do not always add up to the total of the Flag Fleet.
Clarksons Research Page 6 Aug-19
Flag State Fleets Classification
By RegionTotal Flag Fleet
Total Flag Fleet
EU-Europe18%
Other Europe4%
North America
2%Other
America22%
Africa13%
Mid-East/S. Asia2%
Asia/Pacific39%
World Fleet By Flag Region(by % of GT)
0 50 100 150 200 250
Panama
Liberia
Marshall Is.
Hong Kong
Singapore
Malta
China P.R.
Bahamas
Greece
Japan
m. GT
Top 10 Flag Fleets By Class
DNVGLNKABSLRBVChinaOther
Lice
nsed
to D
imitr
ios
Vou
tsar
as o
f LIS
CR
, LLC
. Dis
trib
utio
n is
res
tric
ted;
ple
ase
rem
embe
r to
ack
now
ledg
e th
e so
urce
. http
://w
ww
.cla
rkso
ns.n
et 1
2921
9 Licensed to Dim
itrios Voutsaras of LIS
CR
, LLC. D
istribution is restricted; please remem
ber to acknowledge the source. http://w
ww
.clarksons.net 129219

Region Name Age Location Date
EU-28 Grande America Ro-Ro/Cnt 21 140Nm Sw Of Penmarch Mar-19
Odysseas I Tug 39 Souda Bay Jul-18
Barlovento Primero TSH Dredger 56 Santander May-18
Britannica Hav General Cargo 33 Le Havre Mar-18
Other Europe Yusuf Celal General Cargo 41 Topagac Mar-19
Anatoliy Krasheninnikov General Cargo 29 Kambalny Bay Nov-18
Osfjord General Cargo 52 Afjord Sep-18
Heiko General Cargo 51 Flatoy Sep-18
Shkval Tug 60 Kerch Sep-18
Americas Volgo-Balt 214 General Cargo 41 Samsun 6 Jan-19
Maria Rosario RoPax 41 Puerto La Cruz Dec-18
Durban Queen Asp.& Bit. 35 Persian Gulf Nov-18
Fom General Cargo 37 East Of Sevastopol Oct-18
Unlimited 2 Misc. Bulk 32 Kaohsiung Aug-18
Tai Cang Hu 1 Container 22 Kaohsiung Aug-18
Raysut II Cement 34 Salalah Jul-18
Shine Luck Tanker 26 Kaohsiung Jun-18
Sheng Ming Bulk 23 Northern Namibian Coast May-18
Shahin Ro-Ro/Lo-Lo 34 Port Sudan Apr-18
Leigh River Supply 41 Gulf Of Mexico Mar-18
Flourishever Bulk 23 Shantou Mar-18
Af/MEG/S.As Sinpyaung Buoy/Light. T 60 Rakhine 2 Feb-19
Candy L.P.G. 27 Kerch Strait Jan-19
Maestro L.P.G. 29 Kerch Strait Jan-19
Kit 95 Chem & Oil 29 25Nm Se Of Con Dao Island Dec-18
Viking Tug 62 Matala Dec-18
Anthony Products 37 Tema Nov-18
Ying Hai General Cargo 37 Penghu Oct-18
SSL Kolkata Container 11 Haldia Jun-18
Asia/Pacific Tirta Amarta General Cargo 33 Tuban Sea Jun-19
Sarwaguna Lima Landing Craft 45 East Kalimantan Jun-19
Lintas Timur General Cargo 22 Banggai Jun-19
Sensho Maru General Cargo 8 Chiba 3 May-19
Phuong Nam 09 General Cargo 24 Haiphong May-19
Solomon Trader Bulk 24 Kangava Bay Mar-19
London General Cargo 19 170Km E Of Taizhou, Zhejiang 11 Jan-19
Amanda Air Cush F. 8 3Nm E Of Tanjung Sepang 3 Dec-18
Rui Xing Lun General Cargo 16 Weifang 1 Dec-18
Multi Prima I General Cargo 30 West Nusa Tenggara Nov-18
Bato Twin Landing Craft 37 Aklan Nov-18
Karya Cahaya Maulida Landing Craft 4 Numfor Island Oct-18
Sam Ratulangi PB 1600 Container 18 7Nm Off Thongwa Oct-18
Li Bai Da 5 General Cargo 9 2.6Nm Off Dongluo Island Of Changzhou Sep-18
Hao Xiang 19 MPP 15 Wenzhou Sep-18
Geos Geo. Survey 9 Kuala Baram 1 Sep-18
Bandeng Pass 27 Loloda 2 Aug-18
Hai Ha 38 General Cargo 10 Da Nang Aug-18
Bunga Melati 79 General Cargo 28 Wawoni Island 1 Jul-18
Shun Qiang 2 General Cargo 15 Shanghai 5 Jul-18
An Phu 868 General Cargo 14 10 Miles Off La Gi Jul-18
Tallas General Cargo 44 Istanbul May-18
Losses This Year
2017 2018 2019 2016 2017 2018 2017 2018 2019* Age
EU-Europe 7 5 1 33.6 2.8 56.6 21.3Other Europe 5 5 1 1 11 6.7 3.0 1.0 41.2North America 2 1 0.5 0.1Other Americas 13 14 1 14 34 46.9 195.9 2.5 41.0Africa/MEG/S. Asia 9 9 3 9 1 8 24.4 19.6 8.5 38.7Asia/Pacific 31 22 8 40 74 23 272.8 44.8 45.6 26.1TOTAL 70 56 14 50 100 65 392.3 266.3 114.3 30.6
^Last reported flag and class. Data is not intended to confirm or otherwise flag and class at the time of the incident.
Clarksons Research Aug-19Page 7
14 66.3 39.9%37292.9 100.0%2281
17 6 129.3 2.2%10 2 63.8 7.5%
10 20.8 0.9%1 0.3
2016 % total
5 11.4 49.6%
Cambodia 745 1974
By RegionShip Losses4 Loss of Life5 ,000 GT
2016 2019
P.R.C. 1,941 2003 ZC
Vietnam 999 2005 VR
Vietnam 999 2008
Indonesia 1,470 1990 BKI
Malaysia 1,069 2009 BV
Indonesia 401 1992 BKI
P.R.C. 2,972 2010
P.R.C. 2,970 2003 ZC
Indonesia 185 2015 BKI
Palau 18,161 2001
Indonesia 199 1989 BKI
Philipp. 120 1982
Palau 1,853 2010
P.R.C. 1,221 2002 ZC
H. Kong 38,779 1994 NKK
Palau 2,216 2000
Japan 499 2011
Vietnam 719 1995
Indonesia 237 1974
Indonesia 1,720 1997 BKI
India 9,956 2007 GL
Indonesia 764 1987 BKI
Tanzania 960 1982
S. Leone 498 1982
Mongolia 365 1990
Tunisia 115 1957 BV
Tanzania 3,693 1992
Tanzania 4,086 1990
Panama 39,027 1995 RINA
Myanmar 743 1959
Panama 4,759 1984 HRS
Mexico 681 1977 ABS
Panama 3,274 1992
Panama 38,265 1995 RINA
Panama 2,986 1997
Panama 10,998 1984 DNVGL
Panama 1,499 1981 PHRS
Panama 499 1986
Venezuela 6,507 1978
St. Kitts 998 1983 IROS
Russia 153 1959
Panama 2,516 1978 IROS
Norway 469 1967
Norway 769 1968
Turkey 994 1978 PHRS
Russia 375 1989 RMRS
Spain 260 1962
Malta 1,521 1985 DNVGL
Italy 56,642 1997 RINA
Greece 181 1980
Flag State Losses
Flag^ Vessel Details Loss4
Flag State Type GT Built Class^ of Life5
Lice
nsed
to D
imitr
ios
Vou
tsar
as o
f LIS
CR
, LLC
. Dis
trib
utio
n is
res
tric
ted;
ple
ase
rem
embe
r to
ack
now
ledg
e th
e so
urce
. http
://w
ww
.cla
rkso
ns.n
et 1
2921
9 Licensed to Dim
itrios Voutsaras of LIS
CR
, LLC. D
istribution is restricted; please remem
ber to acknowledge the source. http://w
ww
.clarksons.net 129219

Oil Tanker
Bulk- carrier
Gen. Cargo
Special-ised
TotalOil
TankerBulk-
carrierGen.
CargoSpecial-
isedNon
CargoTotal
1 Panama 762 2,574 1,943 1,154 7,834 30.4 105.4 40.8 27.3 10.4 214.22 Liberia 802 1,250 994 427 3,639 47.8 58.0 43.1 9.8 4.7 163.53 Marshall Is. 889 1,584 323 527 3,615 49.9 66.3 13.5 20.8 6.9 157.54 Hong Kong 379 1,179 743 197 2,724 23.0 60.5 38.1 5.7 0.8 128.15 Singapore 748 582 621 411 3,464 23.0 29.0 26.8 9.8 2.4 91.06 Malta 423 625 554 359 2,212 20.8 25.3 22.8 6.4 4.8 80.07 China P.R. 905 1,368 1,141 493 5,914 8.5 34.6 12.1 2.2 6.1 63.58 Bahamas 256 344 124 279 1,395 17.1 12.0 1.4 16.0 17.0 63.59 Greece 386 168 102 83 1,314 24.6 10.1 0.7 3.6 1.1 40.1
10 Japan 664 161 1,819 719 5,052 5.7 10.9 4.2 7.0 1.7 29.5Total Top-10 6,214 9,835 8,364 4,649 37,163 250.8 412.1 203.5 108.5 56.1 1,031.0Share of World Total 56% 84% 34% 55% 38% 77% 87% 67% 70% 48% 75%
11 Cyprus 44 290 380 71 1,044 1.7 12.4 5.6 1.6 1.9 23.112 Danish Int'l 80 5 196 96 570 2.4 0.1 15.9 1.1 0.7 20.213 Indonesia 630 121 2,415 272 9,951 4.6 3.0 5.1 1.6 4.5 18.814 Isle of Man 98 114 40 82 388 5.3 8.0 0.6 2.7 0.6 17.015 Norwegian Int'l 74 98 66 176 616 4.1 3.3 0.5 6.0 1.6 15.516 Madeira 21 69 341 46 494 1.2 3.3 9.9 0.5 0.1 15.017 Italy 109 44 123 121 1,339 2.3 2.0 3.3 1.4 5.5 14.618 Bermuda 17 2 11 76 147 0.8 0.2 0.5 6.3 3.0 10.719 United Kingdom 25 37 137 48 960 0.5 2.1 4.2 1.1 2.8 10.720 India 138 64 603 42 1,736 5.2 2.4 1.3 0.7 1.0 10.6Total 11-20 1,236 844 4,312 1,030 17,245 28.0 36.8 46.8 22.9 21.8 156.3Share of World Total 11% 7% 18% 12% 18% 9% 8% 15% 15% 19% 11%
21 Iran 74 32 387 12 849 7.6 1.1 1.4 0.1 0.2 10.522 United States 68 5 160 41 3,652 2.4 0.1 3.9 1.2 2.8 10.423 South Korea 186 87 447 385 1,884 0.4 3.6 2.1 2.6 0.8 9.524 Malaysia 142 17 195 93 1,762 1.7 0.5 0.4 3.2 2.8 8.525 Russia 406 14 915 378 2,749 2.3 0.3 2.9 1.3 1.3 8.126 Germany 36 1 173 13 608 0.3 0.2 6.8 0.3 0.5 8.027 Saudi Arabia 56 5 21 39 374 5.6 0.2 0.4 0.9 0.2 7.328 Netherlands 22 13 613 71 1,226 0.1 0.3 4.0 0.4 2.4 7.129 Belgium 26 17 16 33 199 3.2 1.3 0.1 1.3 0.2 6.130 Vietnam 122 94 1,247 73 1,892 1.0 1.5 2.0 0.4 0.5 5.5Total 21-30 1,138 285 4,174 1,138 15,195 24.6 9.0 24.0 11.6 11.7 81.0Share of World Total 10% 2% 17% 13% 16% 8% 2% 8% 8% 10% 6%
Others 2,465 714 7,452 1,643 27,604 21.0 18.0 29.2 11.5 26.5 106.1Share of World Total 22% 6% 31% 19% 28% 6% 4% 10% 7% 23% 8%
WORLD TOTAL 11,053 11,678 24,302 8,460 97,207 324.5 476.0 303.4 154.5 116.1 1,374.5
Clarksons Research Page 8 Aug-19
37%
41,714
507107356
8,46020%
15,330
3,378779
1,3151,036385253
41713889
9,82324%344
1936,513
5420217
942
392575
1,6898,10119%259
166292226
1,102251
2,007
Flag State Fleets by Vessel Type
Flag StatesCurrent Fleet, number Current Fleet, m.GT
Non Cargo1,401
0 50 100 150 200 250
Japan
Greece
Bahamas
China P.R.
Malta
Singapore
Hong Kong
Marshall Is.
Liberia
Panama
m. GT
Top Flags By Vessel Type
Oil Tanker
Bulkcarrier
Gen. Cargo
Specialised
Non Cargo
Panama16%
Liberia12%
Marshall Is.11%
Hong Kong9%
Singapore7%
Malta6%
Other39%
World Fleet By Flag State(by % of GT)
Lice
nsed
to D
imitr
ios
Vou
tsar
as o
f LIS
CR
, LLC
. Dis
trib
utio
n is
res
tric
ted;
ple
ase
rem
embe
r to
ack
now
ledg
e th
e so
urce
. http
://w
ww
.cla
rkso
ns.n
et 1
2921
9 Licensed to Dim
itrios Voutsaras of LIS
CR
, LLC. D
istribution is restricted; please remem
ber to acknowledge the source. http://w
ww
.clarksons.net 129219

Class
Societies Oil Tanker
Bulk- carrier
Gen. Cargo
Special-ised
TotalOil
TankerBulk-
carrierGen.
CargoSpecial-
isedNon
CargoTotal
IACS MembersDNV GL 1,141 1,119 3,144 999 8,777 62.1 47.9 103.9 31.6 27.3 272.7Nippon Kaiji Kyokai 831 4,059 1,440 1,511 8,417 29.6 159.7 30.0 34.9 0.7 254.9American Bureau 1,496 1,095 730 468 7,262 93.5 57.9 46.0 21.1 21.3 239.8Lloyd's Register 1,260 1,273 1,131 746 6,819 71.3 59.0 43.5 31.1 17.6 222.5China Class Society 857 1,567 857 425 5,239 26.3 64.3 24.2 5.2 6.0 126.0Bureau Veritas 662 1,101 1,594 931 7,729 20.5 44.2 24.2 15.4 13.4 117.8Korean Register 304 504 538 605 2,387 12.0 29.2 8.9 12.9 1.0 64.0Registro Italiano 419 336 731 254 3,527 7.4 11.9 9.6 2.4 8.6 40.0Russian Register 305 31 758 363 2,353 2.7 0.6 2.8 3.7 1.7 11.6Indian Register 145 74 432 46 1,372 5.5 2.6 1.3 1.1 1.0 11.5Polski Register 32 77 102 10 349 2.3 1.7 1.1 0.1 0.4 5.6Croatian Register 20 23 21 5 306 0.7 0.7 0.2 0.0 0.2 1.7Total IACS Member 7,177 11,028 11,304 6,215 53,476 312.9 465.4 281.0 150.1 97.2 1,306.6 Share of World Total 65% 94% 47% 73% 55% 96% 98% 93% 97% 84% 95%
Non - IACS MembersKlasifikasi Indonesia 395 39 1,425 134 6,912 1.8 0.7 3.2 0.5 2.9 9.1Phoenix Register 68 53 285 41 506 1.4 1.2 3.0 0.5 0.3 6.4Zhong Chuan 194 311 264 30 858 0.4 3.4 1.0 0.0 0.1 5.0Vietnam Register 96 87 589 62 1,117 0.9 1.4 1.4 0.3 0.8 4.9China Corp. (Taiwan) 17 39 47 15 155 0.2 2.1 1.7 0.1 0.1 4.2Turk Loydu 24 9 127 14 481 0.0 0.1 0.4 0.0 0.3 0.9Isthmus Bureau 24 13 91 12 182 0.1 0.2 0.4 0.1 0.1 0.7Hellenic Register 17 9 54 7 136 0.0 0.2 0.2 0.0 0.1 0.5OMCS 3 14 59 5 83 0.1 0.2 0.2 0.0 0.0 0.5Iranian Class Society 0 3 10 0 14 0.0 0.1 0.3 0.0 0.0 0.4Bulgarian Register 3 2 121 1 150 0.0 0.0 0.3 0.0 0.0 0.4Panama MDS 5 3 28 15 54 0.2 0.0 0.1 0.1 0.0 0.4Dromon Bureau 2 9 58 0 72 0.0 0.1 0.2 0.0 0.0 0.4Intermaritime 0 7 58 1 67 0.0 0.1 0.2 0.0 0.0 0.3Ukraine Register 6 1 78 10 173 0.0 0.0 0.2 0.0 0.1 0.3Sing-Lloyd 22 2 41 5 77 0.2 0.0 0.1 0.0 0.0 0.3Total Other 921 611 3,712 370 11,579 5.5 10.2 13.8 1.8 4.9 36.2
Not Classed / Unknown 3,080 209 9,650 1,980 33,289 9.2 5.2 13.8 3.7 15.7 47.6
WORLD TOTAL 11,053 11,678 24,302 8,460 97,207 324.5 476.0 303.4 154.5 116.1 1,374.5
Clarksons Research Page 9 Aug-19
18,370
41,714Note: Because some ships have multiple class, the sums of the numbers of vessels and GT of the individual classification societies do not always add up to the total of the World Fleet.
331787
5,965
30742492123
43%
4,9195959
28337
1,787896675128237
17,752
5763,4732,4091,5333,441436
Classification Society Fleets by Vessel Type
Current Fleet, number Current Fleet, m.GT
Non Cargo
2,374
0 50 100 150 200 250 300
Klasifikasi Indonesia
Indian Register
Russian Register
Registro Italiano
Korean Register
Bureau Veritas
China Class Society
Lloyd's Register
American Bureau
Nippon Kaiji Kyokai
DNV GL
m. GT
Class Society Fleets By Ship Type
Oil Tanker
BulkcarrierGen. Cargo
SpecialisedNon Cargo
Other23%
China Class Society
9%
Lloyd's Register
15%
American Bureau
16%Nippon Kaiji
Kyokai18%
DNV GL19%
World Fleet By Class(by % of GT)
Lice
nsed
to D
imitr
ios
Vou
tsar
as o
f LIS
CR
, LLC
. Dis
trib
utio
n is
res
tric
ted;
ple
ase
rem
embe
r to
ack
now
ledg
e th
e so
urce
. http
://w
ww
.cla
rkso
ns.n
et 1
2921
9 Licensed to Dim
itrios Voutsaras of LIS
CR
, LLC. D
istribution is restricted; please remem
ber to acknowledge the source. http://w
ww
.clarksons.net 129219

Classification Society Fleet Development
Class
Societies 2015 2016 2017 2018 2016 2017 2018 No. m.GT
IACS MembersDNV GL 13.5 9,786 9,624 9,443 8,949 275.4 280.8 274.4 8,777 272.7 DOWN… -2.3%Nippon Kaiji Kyokai 11.0 8,613 8,570 8,477 8,380 245.3 249.0 250.9 8,417 254.9 UP BY… 1.8%American Bureau 11.9 7,760 7,821 7,728 7,419 222.2 231.6 236.3 7,262 239.8 UP BY… 1.6%Lloyd's Register 12.5 6,769 6,829 6,822 6,798 208.4 213.2 217.1 6,819 222.5 UP BY… 2.8%China Class Society 9.9 4,738 4,900 5,081 5,234 102.9 111.1 122.8 5,239 126.0 UP BY… 7.1%Bureau Veritas 13.1 7,855 7,885 7,806 7,758 108.1 111.8 114.1 7,729 117.8 UP BY… 3.7%Korean Register 14.0 2,562 2,583 2,513 2,441 70.9 67.4 65.4 2,387 64.0 DOWN… -2.7%Registro Italiano 19.0 2,903 3,090 3,293 3,498 34.1 36.8 40.2 3,527 40.0 UP BY… 3.4%Russian Register 25.7 2,750 2,643 2,539 2,438 10.9 10.9 11.3 2,353 11.6 UP BY… 8.8%Indian Register 15.3 1,393 1,424 1,449 1,402 13.4 13.0 12.1 1,372 11.5 DOWN… -6.7%Polski Register 26.1 329 348 343 359 3.7 3.6 5.6 349 5.6 UP BY… 26.0%Croatian Register 24.3 297 309 312 312 1.8 1.8 1.8 306 1.7 DOWN… -2.8%Total IACS Member 13.5 53,345 53,589 53,822 53,711 1,208.7 1,250.5 1,284.5 53,476 1,306.6 UP BY… 2.6%Share of World Total 57% 57% 56% 56% 96% 96% 96% 55% 95%
Non - IACS MembersKlasifikasi Indonesia 15.9 6,693 6,753 6,643 6,841 10.0 9.5 9.5 6,912 9.1 DOWN… -4.7%Phoenix Register 27.1 531 553 552 519 8.9 8.3 6.8 506 6.4 DOWN… -12.2%Zhong Chuan 12.8 929 917 900 871 5.3 5.2 5.1 858 5.0 DOWN… -2.1%Vietnam Register 13.2 1,298 1,270 1,246 1,195 5.0 5.2 5.1 1,117 4.9 DOWN… -0.3%China Corp. (Taiwan) 15.8 215 183 191 169 4.6 5.1 4.4 155 4.2 DOWN… -11.3%Turk Loydu 22.5 473 501 488 478 1.0 0.8 0.8 481 0.9 UP BY… 5.3%Isthmus Bureau 22.7 198 190 188 183 0.8 0.8 0.7 182 0.7 DOWN… -3.3%Hellenic Register 33.3 164 154 147 139 0.6 0.5 0.5 136 0.5 DOWN… -1.4%OMCS 22.2 96 93 89 86 0.5 0.5 0.5 83 0.5 DOWN… -4.4%Iranian Class Society 17.5 15 15 14 14 0.5 0.4 0.4 14 0.4 SAME... 0.0%Bulgarian Register 34.9 190 182 162 155 0.6 0.5 0.4 150 0.4 DOWN… -11.4%Panama MDS 26.3 59 56 55 54 0.4 0.4 0.4 54 0.4 SAME... 0.0%Dromon Bureau 32.5 87 84 81 78 0.3 0.4 0.4 72 0.4 DOWN… -8.1%Intermaritime 21.2 68 69 67 67 0.3 0.3 0.3 67 0.3 UP BY… 1.6%Ukraine Register 33.9 259 230 209 183 0.5 0.4 0.3 173 0.3 DOWN… -10.8%Sing-Lloyd 19.5 98 93 82 80 0.4 0.4 0.3 77 0.3 DOWN… -17.6%Total Other 18.2 12,354 12,290 12,007 11,941 41.8 40.4 37.7 11,579 36.2 DOWN… -5.8%Unknown 34.4 29,639 30,433 31,312 32,371 31.1 32.5 37.8 33,289 47.6 UP BY… 37.2%
WORLD FLEET 21.2 93,258 94,466 95,515 96,555 1,260.8 1,303.9 1,343.0 97,207 1,374.5 UP BY… 3.4%
Clarksons Research Aug 19
28.6
1,223.0
Page 10
0.40.40.30.50.443.2
0.90.90.60.50.50.6
10.18.95.45.15.5
11.012.73.51.8
1,172.696%
210.6199.794.8
104.969.632.5
2015 Year-on-Year
267.2242.8
Age1Number, end Million GT, end 01 Aug 19 Fleet Growth
-8.0
-6.0
-4.0
-2.0
0.0
2.0
4.0
6.0
8.0
10.0
DN
V G
L
NK
K
AB
S
LR
CC
S
BV
KR RI
RR
Ind
PR
CR
S
m. GT IACS Fleet Growth Year-on-Year
Year-on-year change in fleet
0 50 100 150 200 250 300
Croatian Register
Polski Register
Indian Register
Russian Register
Registro Italiano
Korean Register
Bureau Veritas
China Class Society
Lloyd's Register
American Bureau
Nippon Kaiji Kyokai
DNV GL
m. GT
Class Society Fleets By Owner Region
EuropeAsia/PacificAmericasMid-East/S.AsiaAfrica
Lice
nsed
to D
imitr
ios
Vou
tsar
as o
f LIS
CR
, LLC
. Dis
trib
utio
n is
res
tric
ted;
ple
ase
rem
embe
r to
ack
now
ledg
e th
e so
urce
. http
://w
ww
.cla
rkso
ns.n
et 1
2921
9 Licensed to Dim
itrios Voutsaras of LIS
CR
, LLC. D
istribution is restricted; please remem
ber to acknowledge the source. http://w
ww
.clarksons.net 129219

Oil Tanker
Bulk- carrier
Gen. Cargo
Speci-alised
Non Cargo
Total $bn.6Oil
TankerBulk-
carrierGen.
CargoSpecia-lised
Non Cargo
Total m.GT $bn.7
1 Greece 1,417 2,307 680 466 672 5,542 106.0 69 61 24 55 3 212 15.8 17.32 China P.R. 1,242 2,530 2,326 748 2,236 9,082 110.7 50 164 98 48 132 492 20.2 21.53 Japan 904 1,851 2,323 1,581 1,695 8,354 108.9 48 371 115 110 36 680 29.0 25.14 Germany 143 384 1,971 215 474 3,187 39.5 4 29 42 10 18 103 2.6 5.45 United States 274 278 339 182 4,105 5,178 114.1 6 20 14 1 151 192 9.1 44.96 Norway 234 328 525 599 1,248 2,934 60.0 18 38 8 34 62 160 7.0 11.57 South Korea 329 378 662 607 809 2,785 27.9 22 54 38 12 12 138 12.9 10.58 Singapore 781 235 499 408 1,819 3,742 37.0 47 18 20 37 109 231 4.6 7.89 Italy 290 172 391 149 985 1,987 36.6 3 1 41 10 22 77 5.3 15.3
10 Denmark 193 68 466 117 662 1,506 23.8 23 4 4 5 19 55 2.2 2.8Total Top-10 5,807 8,531 10,182 5,072 14,705 44,297 664.4 290 760 404 322 564 2,340 108.6 162.3Share of World Total 53% 73% 42% 60% 35% 46% 68% 65% 82% 63% 75% 37% 59% 79% 73%11 Taiwan 130 403 413 100 188 1,234 14.2 4 37 51 0 17 109 4.1 3.512 United Kingdom 136 164 342 129 614 1,385 26.3 5 5 21 5 27 63 3.3 8.713 Canada 96 148 190 77 537 1,048 21.1 6 6 3 1 12 28 0.7 1.714 Hong Kong 237 421 383 89 233 1,363 11.2 5 8 2 2 17 34 0.6 0.615 Turkey 211 318 947 213 661 2,350 11.6 8 3 3 7 96 117 0.8 0.816 France 20 20 193 37 593 863 20.2 0 0 16 4 11 31 2.1 2.917 Indonesia 634 119 2,385 255 6,178 9,571 14.7 9 2 4 2 52 69 0.3 0.618 Belgium 85 53 65 50 194 447 10.8 6 5 1 2 7 21 1.0 1.019 Russia 466 61 939 382 934 2,782 10.2 12 0 24 8 28 72 1.4 5.320 India 170 134 534 65 892 1,795 8.4 0 4 12 0 16 32 0.4 1.4Total 11-20 2,185 1,841 6,391 1,397 11,024 22,838 148.8 55 70 137 31 283 576 14.6 26.6Share of World Total 20% 16% 26% 17% 26% 23% 15% 12% 8% 21% 7% 18% 14% 11% 12%21 Netherlands 45 55 652 174 1,186 2,112 26.0 0 1 5 0 97 103 0.9 5.522 Malaysia 188 16 271 89 1,331 1,895 17.3 7 0 4 2 72 85 1.3 5.923 U.A.E. 254 99 319 86 1,168 1,926 8.7 6 0 2 4 20 32 0.3 0.724 Iran 73 32 326 8 320 759 3.3 0 0 0 0 1 1 0.0 0.025 Saudi Arabia 88 5 23 37 425 578 4.9 0 4 0 0 4 8 0.2 0.126 Brazil 44 12 47 16 592 711 16.7 3 0 1 0 28 32 0.8 3.627 Sweden 80 8 87 121 275 571 7.1 1 0 2 13 12 28 0.8 1.628 Vietnam 125 122 1,252 118 361 1,978 5.0 0 0 3 0 8 11 0.0 0.029 Bermuda 0 69 0 0 13 82 2.7 0 5 0 0 0 5 0.5 0.230 Switzerland 106 63 26 34 43 272 7.1 4 2 0 0 5 11 0.8 0.5Total 21-30 1,003 481 3,003 683 5,714 10,884 98.9 21 12 17 19 247 316 5.5 18.2Share of World Total 9% 4% 12% 8% 14% 11% 10% 5% 1% 3% 4% 16% 8% 4% 8%
Others 2,058 825 4,726 1,308 10,271 19,188 69.2 80 89 83 55 448 755 9.6 15.5Share of World Total 19% 7% 19% 15% 25% 20% 7% 18% 10% 13% 13% 29% 19% 7% 7%
WORLD TOTAL 11,053 11,678 24,302 8,460 41,714 97,207 981.3 446 931 641 427 1,542 3,987 138.3 222.6Note that fleet values refer to current estimates, while orderbook values refer to contracted values.
Clarksons Research Page 11
7%
1,374.5
Aug-19
6.96.76.497.07%
94.6
14.212.310.510.17.57.0
17.716.715.9
217.616%15.4
27.827.323.019.418.518.2
45.142.338.3
965.370%33.0
186.5173.172.364.460.654.9
Owned Fleets by Country/Region
Country/ Region
Current Fleet, number Current Orderbook, number
m.GT
227.8
0
100
200
300
400
500
600
700
2012 2013 2014 2015 2016 2017 2018 2019 Aug-19
m.GTFleet Ownership By Region
Europe Asia/Pacific
Americas Others
0 50 100 150 200 250
Denmark
Italy
Singapore
South Korea
Norway
United States
Germany
Japan
China P.R.
Greece
m.GT
Owned Fleets By Vessel Type
Oil Tanker
Bulkcarrier
Gen. Cargo
Specialised
Non Cargo
Start Year/YTD
Lice
nsed
to D
imitr
ios
Vou
tsar
as o
f LIS
CR
, LLC
. Dis
trib
utio
n is
res
tric
ted;
ple
ase
rem
embe
r to
ack
now
ledg
e th
e so
urce
. http
://w
ww
.cla
rkso
ns.n
et 1
2921
9 Licensed to Dim
itrios Voutsaras of LIS
CR
, LLC. D
istribution is restricted; please remem
ber to acknowledge the source. http://w
ww
.clarksons.net 129219

Owned Fleets - Europe
Orderbook & Delivery Schedule
No. Age1 $bn6 2015 2016 2017 2018 No. m. GT No. m. GT % Fleet 2019 2020 2021 2022+
Greece 5,542 15.1 106.0 192.5 202.5 215.4 223.3 5,542 227.8 212 15.8 6.9% 2.5 7.8 5.0 0.4Germany 3,187 15.7 39.5 91.4 85.0 77.8 72.9 3,187 72.3 103 2.6 3.5% 0.6 1.4 0.1 0.5Italy 1,987 22.6 36.6 39.5 40.2 43.3 42.1 1,987 42.3 77 5.3 12.6% 1.8 1.5 1.0 1.0Denmark 1,506 17.8 23.8 31.0 30.5 36.3 38.8 1,506 38.3 55 2.2 5.6% 0.4 0.8 1.0 0.0United Kingdom 1,385 18.4 26.3 21.7 23.6 24.4 25.1 1,385 27.8 63 3.3 11.9% 0.9 1.3 0.8 0.3France 863 17.5 20.2 12.6 16.5 17.2 18.3 863 18.5 31 2.1 11.3% 0.1 1.5 0.5 0.0Belgium 447 14.7 10.8 13.3 14.0 14.4 17.7 447 17.7 21 1.0 5.4% 0.5 0.4 0.1 0.0Netherlands 2,112 17.6 26.0 14.5 14.9 15.2 15.2 2,112 15.4 103 0.9 5.8% 0.1 0.4 0.2 0.2Sweden 571 33.4 7.1 7.0 7.0 7.0 7.0 571 7.0 28 0.8 11.8% 0.2 0.1 0.3 0.1Cyprus 226 20.4 1.8 3.8 3.9 3.7 3.3 226 3.8 10 0.3 7.6% 0.0 0.1 0.1 0.0Spain 703 25.1 4.1 2.5 2.6 2.7 3.1 703 3.3 23 0.3 8.3% 0.2 0.1 0.0 0.0Finland 278 36.3 2.7 2.4 2.3 2.2 2.3 278 2.4 6 0.2 10.0% 0.0 0.1 0.1 0.1Poland 250 30.1 1.1 1.8 1.7 1.8 1.9 250 1.9 14 0.2 9.2% 0.0 0.1 0.0 0.0Croatia 339 27.5 1.1 1.6 1.7 1.6 1.6 339 1.6 5 0.0 1.1% 0.0 0.0 0.0 0.0Ireland 165 19.1 2.0 1.1 1.2 1.3 1.4 165 1.4 10 0.1 7.6% 0.0 0.1 0.0 0.0Bulgaria 141 28.1 0.6 0.9 1.0 1.1 1.1 141 1.1 7 0.2 16.9% 0.1 0.1 0.0 0.0Others (12) 152 30.2 0.5 0.6 0.6 0.8 0.8 812 3.8 13 0.2 6.0% 0.2 0.0 0.0 0.0TOTAL 20,514 19.0 312.4 441.2 452.2 468.8 478.4 20,514 486.4 781 35.4 7.3% 7.6 15.9 9.2 2.7
Other Orderbook & Delivery Schedule
Europe No. Age1 $bn6 2015 2016 2017 2018 No. m. GT No. m. GT % Fleet 2019 2020 2021 2022+
Norway 2,934 19.8 60.0 49.4 52.4 58.6 60.5 2,934 60.6 160 7.0 11.5% 2.6 3.2 1.1 0.1Turkey 2,350 23.4 11.6 19.2 19.5 19.1 19.4 2,350 19.4 117 0.8 4.0% 0.1 0.5 0.2 0.0Russia 2,782 29.5 10.2 15.6 16.0 16.3 16.6 2,782 16.7 72 1.4 8.3% 0.2 0.4 0.3 0.5Switzerland 272 12.3 7.1 5.7 6.3 6.4 6.1 272 6.4 11 0.8 12.3% 0.3 0.4 0.0 0.0Israel 159 17.0 3.1 5.6 5.7 5.5 5.7 159 5.6 8 0.1 2.7% 0.0 0.1 0.0 0.0Monaco 83 11.9 1.4 1.4 1.6 2.7 3.8 83 3.9 1 0.0 0.2% 0.0 0.0 0.0 0.0Ukraine 681 34.6 0.9 2.7 2.5 2.5 2.3 681 2.3 5 0.0 1.9% 0.0 0.0 0.0 0.0Azerbaijan 290 31.4 0.7 0.6 0.6 1.1 1.3 290 1.3 6 0.0 2.0% 0.0 0.0 0.0 0.0Others (28) 322 35.0 0.8 0.8 0.9 1.1 1.1 322 1.1 7 0.1 7.1% 0.1 0.0 0.0 0.0TOTAL 9,873 24.9 95.9 101.0 105.6 113.4 116.7 9,873 117.2 387 10.2 8.7% 3.2 4.9 1.5 0.6
Total Orderbook & Delivery Schedule
Europe No. Age1 $bn6 2015 2016 2017 2018 No. m. GT No. m. GT % Fleet 2019 2020 2021 2022+
All Countries/Regions 30,387 20.9 408.3 542.2 557.8 582.2 595.2 30,387 603.6 1,168 45.6 7.6% 10.9 20.7 10.7 3.3
Clarksons Research
01-Aug-19
Page 12 Aug-19
EU-Europe01-Aug-19 Fleet m. GT, end: 01-Aug-19
01-Aug-19 Fleet m. GT, end: 01-Aug-19
01-Aug-19 Fleet m. GT, end:
0%
2%
4%
6%
8%
100
150
200
250
300
350
400
450
500
550
600
650
700
Aug
-14
Dec
-14
Apr
-15
Aug
-15
Dec
-15
Apr
-16
Aug
-16
Dec
-16
Apr
-17
Aug
-17
Dec
-17
Apr
-18
Aug
-18
Dec
-18
Apr
-19
Aug
-19
m.GTEuropean Fleet Development
Total Fleet (LHS, m. GT)
Year-on-Year Growth of Fleet (RHS, %)
0 50 100 150 200 250
Russia
Belgium
Turkey
France
UnitedKingdom
Denmark
Italy
Norway
Germany
Greece
m.GT
Europe: Top Owner Countries/Regions
Fleet
Orderbook
Ranked by combined size of fleet and orderbook in GT
Lice
nsed
to D
imitr
ios
Vou
tsar
as o
f LIS
CR
, LLC
. Dis
trib
utio
n is
res
tric
ted;
ple
ase
rem
embe
r to
ack
now
ledg
e th
e so
urce
. http
://w
ww
.cla
rkso
ns.n
et 1
2921
9 Licensed to Dim
itrios Voutsaras of LIS
CR
, LLC. D
istribution is restricted; please remem
ber to acknowledge the source. http://w
ww
.clarksons.net 129219

Owned Fleets - Americas
North Orderbook & Delivery Schedule
America No. Age1 $bn6 2015 2016 2017 2018 No. m. GT No. m. GT % Fleet 2019 2020 2021 2022+
United States 5,178 26.7 114.1 60.5 64.7 66.6 63.7 5,178 64.4 192 9.1 14.2% 1.3 2.9 1.7 3.3
Canada 1,048 27.8 21.1 24.3 24.2 25.1 26.7 1,048 27.3 28 0.7 2.5% 0.2 0.4 0.1 0.0Bermuda 82 11.0 2.7 4.6 4.8 5.6 6.3 82 6.7 5 0.5 8.0% 0.1 0.4 0.0 0.0TOTAL 6,308 26.7 137.9 89.3 93.7 97.2 96.7 6,308 98.4 225 10.4 10.5% 1.6 3.7 1.8 3.3
Orderbook & Delivery Schedule
No. Age1 $bn6 2015 2016 2017 2018 No. m. GT No. m. GT % Fleet 2019 2020 2021 2022+
Mexico 530 28.0 2.2 1.3 1.6 1.6 1.7 530 1.7 12 0.0 1.1% 0.0 0.0 0.0 0.0Panama 404 36.7 0.4 0.6 0.7 0.7 0.7 404 0.8 0 0.0 0.0% 0.0 0.0 0.0 0.0Bahamas 39 19.8 0.3 0.6 0.5 0.5 0.5 39 0.5 0 0.0 0.0% 0.0 0.0 0.0 0.0Cuba 84 24.8 0.3 0.4 0.4 0.4 0.4 84 0.4 0 0.0 0.0% 0.0 0.0 0.0 0.0Others (33) 536 39.3 0.5 0.4 0.4 0.4 0.5 536 0.5 2 0.0 3.0% 0.0 0.0 0.0 0.0TOTAL 1,593 33.6 3.7 3.2 3.6 3.7 3.7 1,593 3.7 14 0.0 0.9% 0.0 0.0 0.0 0.0
EC South Orderbook & Delivery Schedule
America No. Age1 $bn6 2015 2016 2017 2018 No. m. GT No. m. GT % Fleet 2019 2020 2021 2022+
Brazil 711 21.2 16.7 8.3 7.3 6.3 7.4 711 7.5 32 0.8 10.1% 0.2 0.4 0.2 0.0Venezuela 275 30.3 0.9 1.5 1.5 1.6 1.6 275 1.6 2 0.0 0.0% 0.0 0.0 0.0 0.0Argentina 210 33.5 0.6 0.3 0.4 0.5 0.7 210 0.8 1 0.0 1.7% 0.0 0.0 0.0 0.0Others (6) 176 42.6 0.2 0.1 0.2 0.2 0.2 176 0.2 1 0.0 2.9% 0.0 0.0 0.0 0.0TOTAL 1,372 27.6 18.4 10.3 9.4 8.5 9.9 1,372 10.1 36 0.8 7.7% 0.2 0.4 0.2 0.0
WC South Orderbook & Delivery Schedule
America No. Age1 $bn6 2015 2016 2017 2018 No. m. GT No. m. GT % Fleet 2019 2020 2021 2022+
Chile 327 19.1 1.8 1.5 1.6 1.8 1.9 327 1.9 2 0.0 2.2% 0.0 0.0 0.0 0.0Peru 96 26.6 0.2 0.4 0.4 0.5 0.4 96 0.4 0 0.0 0.0% 0.0 0.0 0.0 0.0Ecuador 126 26.0 0.3 0.4 0.4 0.4 0.4 126 0.4 1 0.0 0.1% 0.0 0.0 0.0 0.0Others (3) 163 30.3 0.3 0.1 0.2 0.2 0.2 163 0.2 0 0.0 0.0% 0.0 0.0 0.0 0.0TOTAL 712 23.9 2.6 2.6 2.6 2.9 2.8 712 2.8 3 0.0 1.5% 0.0 0.0 0.0 0.0
Total Orderbook & Delivery Schedule
Americas No. Age1 $bn6 2015 2016 2017 2018 No. m. GT No. m. GT % Fleet 2019 2020 2021 2022+
All Countries/Regions 9,985 26.9 162.6 105.4 109.3 112.3 113.1 9,985 115.0 278 11.2 9.7% 1.9 4.1 1.9 3.3
Clarksons Research
01-Aug-19
01-Aug-19 Fleet m. GT, end: 01-Aug-19
Caribbean01-Aug-19 Fleet m. GT, end: 01-Aug-19
01-Aug-19 Fleet m. GT, end: 01-Aug-19
Page 13 Aug-19
01-Aug-19 Fleet m. GT, end: 01-Aug-19
01-Aug-19 Fleet m. GT, end:
-6%
-4%
-2%
0%
2%
4%
6%
8%
10%
12%
14%
50
60
70
80
90
100
110
120
Aug
-14
Dec
-14
Apr
-15
Aug
-15
Dec
-15
Apr
-16
Aug
-16
Dec
-16
Apr
-17
Aug
-17
Dec
-17
Apr
-18
Aug
-18
Dec
-18
Apr
-19
Aug
-19
m.GTAmericas Fleet Development
Total Fleet (LHS, m. GT)
Year-on-Year Growth of Fleet (RHS, %)
0 10 20 30 40 50 60 70 80
Bahamas
Panama
Argentina
Venezuela
Mexico
Chile
Bermuda
Brazil
Canada
United States
m.GT
FleetOrderbook
Ranked by combined size of fleet and orderbook in GT
Americas: Top Owner Countries/Regions
Lice
nsed
to D
imitr
ios
Vou
tsar
as o
f LIS
CR
, LLC
. Dis
trib
utio
n is
res
tric
ted;
ple
ase
rem
embe
r to
ack
now
ledg
e th
e so
urce
. http
://w
ww
.cla
rkso
ns.n
et 1
2921
9 Licensed to Dim
itrios Voutsaras of LIS
CR
, LLC. D
istribution is restricted; please remem
ber to acknowledge the source. http://w
ww
.clarksons.net 129219
Owned Fleets - Africa, Mid-East, S. Asia
Orderbook & Delivery Schedule
No. Age1 $bn6 2015 2016 2017 2018 No. m. GT No. m. GT % Fleet 2019 2020 2021 2022+
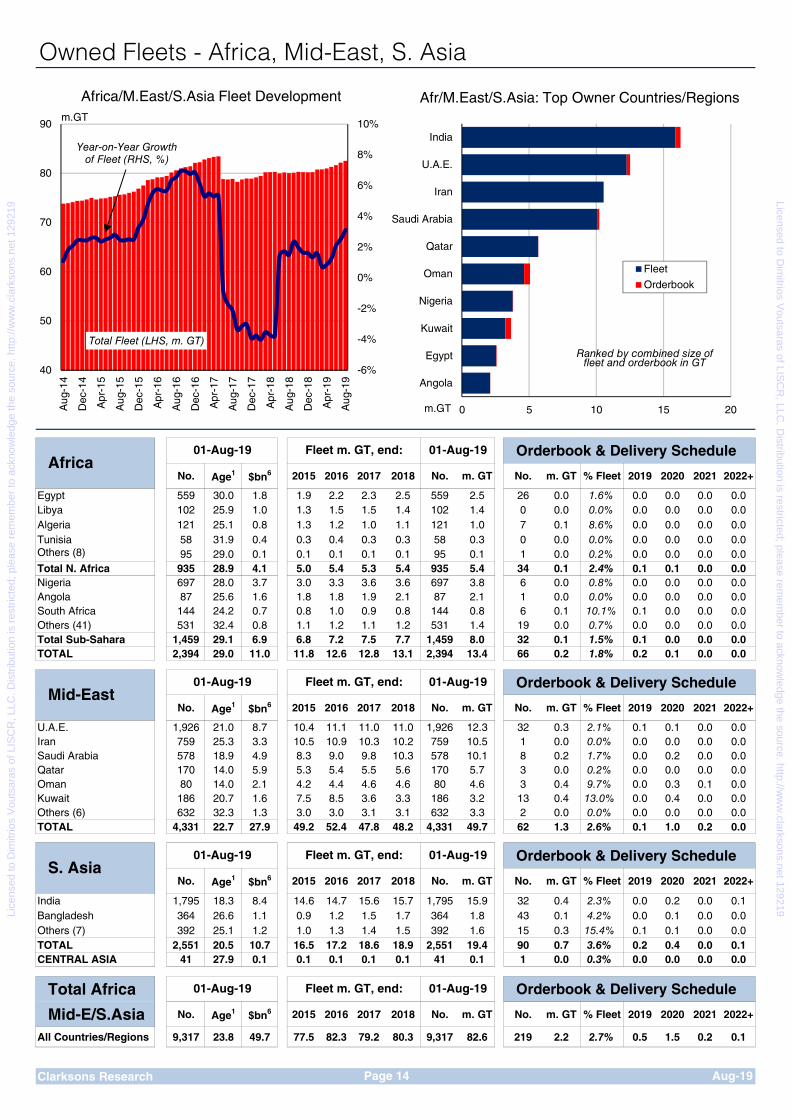
Egypt 559 30.0 1.8 1.9 2.2 2.3 2.5 559 2.5 26 0.0 1.6% 0.0 0.0 0.0 0.0Libya 102 25.9 1.0 1.3 1.5 1.5 1.4 102 1.4 0 0.0 0.0% 0.0 0.0 0.0 0.0Algeria 121 25.1 0.8 1.3 1.2 1.0 1.1 121 1.0 7 0.1 8.6% 0.0 0.0 0.0 0.0Tunisia 58 31.9 0.4 0.3 0.4 0.3 0.3 58 0.3 0 0.0 0.0% 0.0 0.0 0.0 0.0Others (8) 95 29.0 0.1 0.1 0.1 0.1 0.1 95 0.1 1 0.0 0.2% 0.0 0.0 0.0 0.0Total N. Africa 935 28.9 4.1 5.0 5.4 5.3 5.4 935 5.4 34 0.1 2.4% 0.1 0.1 0.0 0.0Nigeria 697 28.0 3.7 3.0 3.3 3.6 3.6 697 3.8 6 0.0 0.8% 0.0 0.0 0.0 0.0Angola 87 25.6 1.6 1.8 1.8 1.9 2.1 87 2.1 1 0.0 0.0% 0.0 0.0 0.0 0.0South Africa 144 24.2 0.7 0.8 1.0 0.9 0.8 144 0.8 6 0.1 10.1% 0.1 0.0 0.0 0.0Others (41) 531 32.4 0.8 1.1 1.2 1.1 1.2 531 1.4 19 0.0 0.7% 0.0 0.0 0.0 0.0Total Sub-Sahara 1,459 29.1 6.9 6.8 7.2 7.5 7.7 1,459 8.0 32 0.1 1.5% 0.1 0.0 0.0 0.0TOTAL 2,394 29.0 11.0 11.8 12.6 12.8 13.1 2,394 13.4 66 0.2 1.8% 0.2 0.1 0.0 0.0
Orderbook & Delivery Schedule
No. Age1 $bn6 2015 2016 2017 2018 No. m. GT No. m. GT % Fleet 2019 2020 2021 2022+
U.A.E. 1,926 21.0 8.7 10.4 11.1 11.0 11.0 1,926 12.3 32 0.3 2.1% 0.1 0.1 0.0 0.0Iran 759 25.3 3.3 10.5 10.9 10.3 10.2 759 10.5 1 0.0 0.0% 0.0 0.0 0.0 0.0Saudi Arabia 578 18.9 4.9 8.3 9.0 9.8 10.3 578 10.1 8 0.2 1.7% 0.0 0.2 0.0 0.0Qatar 170 14.0 5.9 5.3 5.4 5.5 5.6 170 5.7 3 0.0 0.2% 0.0 0.0 0.0 0.0Oman 80 14.0 2.1 4.2 4.4 4.6 4.6 80 4.6 3 0.4 9.7% 0.0 0.3 0.1 0.0Kuwait 186 20.7 1.6 7.5 8.5 3.6 3.3 186 3.2 13 0.4 13.0% 0.0 0.4 0.0 0.0Others (6) 632 32.3 1.3 3.0 3.0 3.1 3.1 632 3.3 2 0.0 0.0% 0.0 0.0 0.0 0.0TOTAL 4,331 22.7 27.9 49.2 52.4 47.8 48.2 4,331 49.7 62 1.3 2.6% 0.1 1.0 0.2 0.0
Orderbook & Delivery Schedule
No. Age1 $bn6 2015 2016 2017 2018 No. m. GT No. m. GT % Fleet 2019 2020 2021 2022+
India 1,795 18.3 8.4 14.6 14.7 15.6 15.7 1,795 15.9 32 0.4 2.3% 0.0 0.2 0.0 0.1Bangladesh 364 26.6 1.1 0.9 1.2 1.5 1.7 364 1.8 43 0.1 4.2% 0.0 0.1 0.0 0.0Others (7) 392 25.1 1.2 1.0 1.3 1.4 1.5 392 1.6 15 0.3 15.4% 0.1 0.1 0.0 0.0TOTAL 2,551 20.5 10.7 16.5 17.2 18.6 18.9 2,551 19.4 90 0.7 3.6% 0.2 0.4 0.0 0.1CENTRAL ASIA 41 27.9 0.1 0.1 0.1 0.1 0.1 41 0.1 1 0.0 0.3% 0.0 0.0 0.0 0.0
Total Africa Orderbook & Delivery Schedule
Mid-E/S.Asia No. Age1 $bn6 2015 2016 2017 2018 No. m. GT No. m. GT % Fleet 2019 2020 2021 2022+
All Countries/Regions 9,317 23.8 49.7 77.5 82.3 79.2 80.3 9,317 82.6 219 2.2 2.7% 0.5 1.5 0.2 0.1
Clarksons Research
Africa01-Aug-19 Fleet m. GT, end: 01-Aug-19
Mid-East01-Aug-19 Fleet m. GT, end: 01-Aug-19
Page 14 Aug-19
S. Asia01-Aug-19 Fleet m. GT, end: 01-Aug-19
01-Aug-19 Fleet m. GT, end: 01-Aug-19
-6%
-4%
-2%
0%
2%
4%
6%
8%
10%
40
50
60
70
80
90
Aug
-14
Dec
-14
Apr
-15
Aug
-15
Dec
-15
Apr
-16
Aug
-16
Dec
-16
Apr
-17
Aug
-17
Dec
-17
Apr
-18
Aug
-18
Dec
-18
Apr
-19
Aug
-19
m.GT
Africa/M.East/S.Asia Fleet Development
Total Fleet (LHS, m. GT)
Year-on-Year Growth of Fleet (RHS, %)
0 5 10 15 20
Angola
Egypt
Kuwait
Nigeria
Oman
Qatar
Saudi Arabia
Iran
U.A.E.
India
m.GT
Fleet
Orderbook
Ranked by combined size of fleet and orderbook in GT
Afr/M.East/S.Asia: Top Owner Countries/Regions
Lice
nsed
to D
imitr
ios
Vou
tsar
as o
f LIS
CR
, LLC
. Dis
trib
utio
n is
res
tric
ted;
ple
ase
rem
embe
r to
ack
now
ledg
e th
e so
urce
. http
://w
ww
.cla
rkso
ns.n
et 1
2921
9 Licensed to Dim
itrios Voutsaras of LIS
CR
, LLC. D
istribution is restricted; please remem
ber to acknowledge the source. http://w
ww
.clarksons.net 129219

Owned Fleets - Asia/Pacific
Orderbook & Delivery Schedule
No. Age1 $bn6 2015 2016 2017 2018 No. m. GT No. m. GT % Fleet 2019 2020 2021 2022+
China P.R. 9,082 14.0 110.7 133.0 143.1 156.8 178.8 9,082 186.5 492 20.2 10.8% 4.0 8.5 6.5 1.2Japan 8,354 16.0 108.9 164.2 164.2 166.0 168.6 8,354 173.1 680 29.0 16.7% 8.6 14.8 5.1 0.5South Korea 2,785 20.5 27.9 55.6 56.9 53.7 53.7 2,785 54.9 138 12.9 23.5% 1.5 6.7 4.3 0.3Taiwan 1,234 17.0 14.2 31.1 31.1 32.9 33.4 1,234 33.0 109 4.1 12.4% 0.7 2.2 1.1 0.1Hong Kong 1,363 17.8 11.2 23.5 24.7 27.7 22.7 1,363 23.0 34 0.6 2.8% 0.2 0.3 0.2 0.0Others (2) 264 31.2 0.3 0.5 0.6 0.7 0.7 264 0.7 0 0.0 0.0% 0.0 0.0 0.0 0.0TOTAL 23,082 16.1 273.2 407.9 420.6 437.7 457.9 23,082 471.2 1,453 66.8 14.2% 15.0 32.5 17.2 2.1
Orderbook & Delivery Schedule
No. Age1 $bn6 2015 2016 2017 2018 No. m. GT No. m. GT % Fleet 2019 2020 2021 2022+
Singapore 3,742 15.8 37.0 43.5 41.2 39.6 41.8 3,742 45.1 231 4.6 10.3% 1.1 2.2 1.1 0.3Indonesia 9,571 19.2 14.7 14.0 15.3 16.5 17.8 9,571 18.2 70 0.3 1.9% 0.1 0.1 0.2 0.0Malaysia 1,895 17.9 17.3 11.8 13.1 14.1 14.0 1,895 14.2 85 1.3 9.2% 0.2 0.8 0.2 0.1Vietnam 1,978 16.9 5.0 5.6 5.9 6.3 6.6 1,978 6.9 11 0.0 0.2% 0.0 0.0 0.0 0.0Thailand 909 28.6 2.7 4.9 4.9 5.2 5.0 909 5.3 5 0.0 0.5% 0.0 0.0 0.0 0.0Philippines 1,680 32.8 1.7 2.0 2.1 2.1 2.2 1,680 2.2 15 0.0 1.3% 0.0 0.0 0.0 0.0Others (4) 107 20.1 0.6 0.5 0.5 0.5 0.5 107 0.5 1 0.0 0.3% 0.0 0.0 0.0 0.0TOTAL 19,882 19.8 78.9 82.2 83.0 84.2 87.9 19,882 92.5 418 6.3 6.9% 1.5 3.1 1.5 0.3
Orderbook & Delivery Schedule
No. Age1 $bn6 2015 2016 2017 2018 No. m. GT No. m. GT % Fleet 2019 2020 2021 2022+
Australia 515 21.5 4.2 2.8 3.0 3.5 4.0 515 3.9 26 0.2 4.2% 0.0 0.0 0.1 0.0Marshall Is. 70 27.3 0.3 0.3 0.3 0.2 0.4 70 0.4 2 0.0 2.2% 0.0 0.0 0.0 0.0Others (28) 424 30.8 0.5 0.4 0.4 0.4 0.4 424 0.4 4 0.0 0.7% 0.0 0.0 0.0 0.0TOTAL 1009 25.8 5.0 3.5 3.7 4.1 4.8 1009 4.7 32 0.2 3.7% 0.0 0.0 0.1 0.0
Total Orderbook & Delivery Schedule
Asia/Pacific No. Age1 $bn6 2015 2016 2017 2018 No. m. GT No. m. GT % Fleet 2019 2020 2021 2022+
All Countries/Regions 43,973 18.0 357.1 493.6 507.3 526.1 550.6 43,973 568.4 1,903 73.3 12.9% 16.5 35.6 18.8 2.4
Orderbook & Delivery Schedule
No. Age1 $bn6 2015 2016 2017 2018 No. m. GT No. m. GT % Fleet 2019 2020 2021 2022+
TOTAL 97,207 21.2 981.3 1223.0 1260.8 1303.9 1343.0 97,207 1,374.5 3,988 138.3 10.1% 31.1 64.2 33.2 9.8
Clarksons Research
East Asia01-Aug-19 Fleet m. GT, end: 01-Aug-19
S.E. Asia01-Aug-19 Fleet m. GT, end: 01-Aug-19
Aug-19
Oceania01-Aug-19 Fleet m. GT, end: 01-Aug-19
01-Aug-19 Fleet m. GT, end: 01-Aug-19
World 201-Aug-19 Fleet m. GT, end: 01-Aug-19
Page 15
0%
2%
4%
6%
8%
200
250
300
350
400
450
500
550
600
Aug
-14
Dec
-14
Apr
-15
Aug
-15
Dec
-15
Apr
-16
Aug
-16
Dec
-16
Apr
-17
Aug
-17
Dec
-17
Apr
-18
Aug
-18
Dec
-18
Apr
-19
Aug
-19
m.GTAsia/Pacific Fleet Development
Total Fleet (LHS, m. GT)
Year-on-Year Growth of Fleet (RHS, %)
0 50 100 150 200 250
Thailand
Vietnam
Malaysia
Indonesia
Hong Kong
Taiwan
Singapore
South Korea
Japan
China P.R.
m.GT
Fleet
Orderbook
Ranked by combined size of fleet and orderbook in GT
Asia/Pacific: Top Owner Countries/Regions
Lice
nsed
to D
imitr
ios
Vou
tsar
as o
f LIS
CR
, LLC
. Dis
trib
utio
n is
res
tric
ted;
ple
ase
rem
embe
r to
ack
now
ledg
e th
e so
urce
. http
://w
ww
.cla
rkso
ns.n
et 1
2921
9 Licensed to Dim
itrios Voutsaras of LIS
CR
, LLC. D
istribution is restricted; please remem
ber to acknowledge the source. http://w
ww
.clarksons.net 129219

Orderbook & Delivery Schedule
No. Age1 $bn6 2016 2017 2018 2019 No. m. GT No. m. GT % Fleet 2019 2020 2021 2022+
Vessel Type Tanker 2,648 13.8 61.1 108.4 113.0 119.7 124.3 2,648 127.7 118 8.2 6% 1.6 4.0 2.6 0.0Bulker8 3,494 9.5 56.9 132.0 137.9 143.0 145.1 3,494 146.5 131 5.8 4% 2.2 3.3 0.3 0.0
General Cargo 5,450 17.6 69.7 144.1 143.1 146.0 146.7 5,450 148.2 163 8.0 5% 2.3 4.1 1.7 0.0Specialised Cargo 1,590 14.3 37.1 27.0 29.1 30.3 31.8 1,590 32.6 106 7.7 24% 0.7 3.2 3.3 0.4
Non-Cargo 7,332 27.4 87.7 29.7 29.1 29.8 30.6 7,332 31.4 263 5.7 18% 0.7 1.3 1.4 2.3TOTAL 20,514 19.0 312.4 441.2 452.2 468.8 478.4 20,514 486.4 781 35.4 7% 7.6 15.9 9.2 2.7
Orderbook & Delivery Schedule
No. Age1 $bn6 2016 2017 2018 2019 No. m. GT No. m. GT % Fleet 2019 2020 2021 2022+
Vessel Type Tanker 1,113 20.7 15.8 25.7 27.9 29.9 30.3 1,113 30.7 42 3.4 11% 0.8 1.7 0.6 0.3Bulker8 887 11.2 13.3 27.9 28.7 31.3 31.8 887 31.9 44 3.1 10% 1.5 1.4 0.2 0.0
General Cargo 2,916 30.6 8.8 14.4 14.9 15.8 17.4 2,916 17.2 50 0.4 2% 0.2 0.3 0.0 0.0Specialised Cargo 1,385 18.9 24.2 22.8 23.0 25.2 26.1 1,385 26.4 53 2.4 9% 0.6 1.2 0.4 0.1
Non-Cargo 3,572 27.3 33.8 10.2 11.0 11.2 11.1 3,572 11.1 198 0.9 8% 0.2 0.3 0.2 0.1TOTAL 9,873 24.9 95.9 101.0 105.6 113.4 116.7 9,873 117.2 387 10.2 9% 3.2 4.9 1.5 0.6
Orderbook & Delivery Schedule
No. Age1 $bn6 2016 2017 2018 2019 No. m. GT No. m. GT % Fleet 2019 2020 2021 2022+
Vessel Type Tanker 370 14.0 10.3 22.9 25.0 25.6 21.7 370 22.3 12 1.0 5% 0.3 0.7 0.1 0.0Bulker8 495 10.7 8.5 19.5 19.7 21.4 21.5 495 22.1 31 2.3 10% 0.3 1.5 0.5 0.0
General Cargo 529 29.7 7.8 13.5 14.1 14.5 15.5 529 15.5 17 0.3 2% 0.1 0.2 0.1 0.0Specialised Cargo 259 13.5 11.1 6.5 6.9 7.2 8.3 259 8.8 2 0.1 2% 0.1 0.0 0.0 0.0
Non-Cargo 4,655 29.7 100.2 27.0 28.0 28.5 29.7 4,655 29.7 163 6.6 22% 0.8 1.3 1.2 3.3TOTAL 6,308 26.7 137.9 89.3 93.7 97.2 96.7 6,308 98.4 225 10.4 11% 1.6 3.7 1.8 3.3
Orderbook & Delivery Schedule
No. Age1 $bn6 2016 2017 2018 2019 No. m. GT No. m. GT % Fleet 2019 2020 2021 2022+
Vessel Type Tanker 303 30.4 2.5 4.3 4.3 4.9 5.0 303 5.2 3 0.1 3% 0.0 0.1 0.0 0.0Bulker8 89 13.1 1.1 4.9 4.0 2.8 2.8 89 2.6 1 0.0 1% 0.0 0.0 0.0 0.0
General Cargo 551 43.9 0.4 1.0 0.9 1.0 1.0 551 1.0 1 0.0 0% 0.0 0.0 0.0 0.0Specialised Cargo 158 25.8 1.3 0.9 1.0 1.1 1.1 158 1.2 0 0.0 0% 0.0 0.0 0.0 0.0
Non-Cargo 2,576 27.1 19.3 5.1 5.3 5.4 6.5 2,576 6.6 48 0.7 10% 0.2 0.3 0.2 0.0TOTAL 3,677 29.5 24.7 16.1 15.6 15.1 16.4 3,677 16.6 53 0.9 5% 0.3 0.4 0.2 0.0
Orderbook & Delivery Schedule
No. Age1 $bn6 2016 2017 2018 2019 No. m. GT No. m. GT % Fleet 2019 2020 2021 2022+
Vessel Type Tanker 1,148 22.7 13.9 34.7 36.7 37.1 37.0 1,148 38.7 25 0.9 2% 0.0 0.7 0.2 0.0Bulker8 498 14.4 5.8 13.3 14.0 14.9 15.9 498 16.5 17 0.5 3% 0.2 0.4 0.0 0.0
General Cargo 1,943 26.2 2.7 10.6 11.9 7.1 7.1 1,943 7.1 24 0.1 1% 0.1 0.0 0.0 0.0Specialised Cargo 474 21.9 11.8 12.8 13.3 13.6 13.4 474 13.2 13 0.3 2% 0.1 0.2 0.0 0.0
Non-Cargo 5,254 24.1 15.5 6.3 6.4 6.6 6.8 5,254 7.1 140 0.4 6% 0.1 0.2 0.0 0.1TOTAL 9,317 23.8 49.7 77.5 82.3 79.2 80.3 9,317 82.6 219 2.2 3% 0.5 1.5 0.2 0.1
Orderbook & Delivery Schedule
No. Age1 $bn6 2016 2017 2018 2019 No. m. GT No. m. GT % Fleet 2019 2020 2021 2022+
Vessel Type Tanker 5,069 18.7 53.3 82.3 87.9 91.7 93.5 5,069 98.9 197 10.7 11% 3.5 5.1 2.1 0.0Bulker8 6,201 9.5 104.1 234.8 237.1 240.8 249.9 6,201 256.0 654 37.2 15% 8.4 19.0 8.6 1.2
General Cargo 11,813 21.4 60.3 91.1 91.1 98.9 108.1 11,813 112.2 337 16.0 14% 2.4 7.8 5.2 0.6Specialised Cargo 4,397 17.7 67.1 59.2 63.1 65.5 69.7 4,397 71.9 213 6.2 9% 1.5 2.4 2.2 0.2
Non-Cargo 16,493 18.6 72.3 26.1 28.1 29.2 29.5 16,493 29.4 501 3.1 11% 0.7 1.4 0.6 0.4TOTAL 43,973 18.0 357.1 493.6 507.3 526.1 550.6 43,973 568.4 1,902 73.2 13% 16.5 35.6 18.7 2.4
WORLD TOTAL 97,207 21.2 981.3 1,223.0 1,260.8 1,303.9 1,343.0 97,207 1,374.5 3,987 138.3 10% 31.1 64.2 33.1 9.8
Clarksons Research
01-Aug-1901-Aug-19
Fleet m. GT, end:
Fleet m. GT, end:01-Aug-19
01-Aug-19
Asia-Pacific
Page 16
America
01-Aug-19
Africa/Mid-East/S.Asia
Fleet m. GT, end:
N.America
Aug-19
01-Aug-19Other
Other
01-Aug-19
01-Aug-19
Fleet m. GT, end:
Fleet m. GT, end:
Europe
Owned Fleets by Region & Ship Type
EU-Europe01-Aug-19 Fleet m. GT, end: 01-Aug-19
01-Aug-19
01-Aug-19
Lice
nsed
to D
imitr
ios
Vou
tsar
as o
f LIS
CR
, LLC
. Dis
trib
utio
n is
res
tric
ted;
ple
ase
rem
embe
r to
ack
now
ledg
e th
e so
urce
. http
://w
ww
.cla
rkso
ns.n
et 1
2921
9 Licensed to Dim
itrios Voutsaras of LIS
CR
, LLC. D
istribution is restricted; please remem
ber to acknowledge the source. http://w
ww
.clarksons.net 129219

Clarksons Research Page i
World Fleet Monitor - Acknowledgements
Aug-19
Acknowledgements We would like to acknowledge the many organisations that have contributed to making this publication possible. (i) All of the owners and shipbuilders – too many to mention individually – who help us to keep the contents of our
ships and newbuildings databases up-to-date. (ii) Classification Societies, in particular American Bureau of Shipping, Bureau Veritas, Det Norske Veritas
Germanischer Lloyd, Indian Register of Shipping, Korean Register of Shipping, Nippon Kaiji Kyokai, Registro Italiano Navale and China Corporation Register of Shipping, who contribute to the accuracy of our databases.
(iii) Flag Registries, in particular The Marshall Islands Registry, the Isle of Man Ship Registry and the Liberia Registry, that also provide fleet information.
(iv) Equipment manufacturers, including Wartsila and MAN Diesel, who support our collection of vessel and equipment data.
(v) Our Clarksons Platou broker colleagues who assist in the collection of commercial information about the shipping markets and also provide ship specification and newbuilding information.
(vi) Government, trade and commercial organisations through which we collate trade data: UN, UNCTAD, IMF, OECD, IEA, EIA, BP, USDA, IGC, GTIS and many others.
(vii) International Maritime Organisation. (viii) The shipping press in all its manifestations.
No responsibility attaches to any of these organisations for the data published. _______________________________________________________________________________________ Data Notes & Disclaimer The fleet monitored within this publication represents an expansion of the fleet actively tracked by Clarksons Research previously. All best efforts have been made to discover previous data on small vessels not previously maintained on Clarksons Research databases. However, data on the dates of contracting or demolition for some of the vessels at the smaller end of the size ranges is incomplete prior to 2005. The statistical and graphical information is drawn from Clarksons Research databases and other sources. It should be noted that: (i) some information in the Clarksons Research database is derived from estimates or subjective judgments; and (ii) the information in the databases of other maritime data collection agencies may differ from the information in
Clarksons Research’s database; and (iii) whilst Clarksons Research has taken reasonable care in the compilation of the statistical and graphical
information and believes it to be accurate and correct, data compilation is subject to limited audit and validation procedures and may accordingly contain errors; and
(iv) Clarksons Research, its agents, officers and employees do not accept liability for any loss suffered in consequence of reliance on such information or in any other manner; and
(v) the provision of such information does not obviate any need to make appropriate further enquiries; and (vi) the provision of such information is not an endorsement of any commercial policies and/or any conclusions by
Clarksons Research; and (vii) shipping is a variable and cyclical business and any forecasting concerning it cannot be very accurate. This Information is confidential and is solely for the internal use of the recipient. Neither the whole nor any part of the Information may be disclosed to, or used or relied upon by, any other person or used for any other purpose without the prior written consent of Clarksons Research. Especially, the information is not to be used in any document for the purposes of raising finance whether by way of debt or equity. All intellectual property rights are fully reserved by Clarksons Research, its ‘connected persons’ and/or its licensors. To the extent permitted by law, Clarksons Research and its ‘connected persons’ shall not be liable to the recipient or any third party for any loss, liability or damage, cost or expense including without limitation, direct, indirect, consequential loss or damage, any loss of profit, loss of use, loss of or interruption in business, loss of goodwill, loss of data arising out of, or in connection with, the use of and the reliance on the Information whether in contract, tort, negligence, bailment, breach of statutory duty or otherwise, even if foreseeable. These exclusions do not apply to (i) death or personal injury caused by the negligence of Clarksons Research and its ‘connected persons’ or (ii) the liability of Clarksons Research and its ‘connected persons’ for fraud or fraudulent misrepresentation. In this disclaimer 'connected persons' means, in relation to Clarksons Research, its ultimate holding company, subsidiaries and subsidiary undertakings of its ultimate holding company and the respective shareholders, directors, officers, employees and agents of each of them. This disclaimer shall be governed by and construed in accordance with English law.
Lice
nsed
to D
imitr
ios
Vou
tsar
as o
f LIS
CR
, LLC
. Dis
trib
utio
n is
res
tric
ted;
ple
ase
rem
embe
r to
ack
now
ledg
e th
e so
urce
. http
://w
ww
.cla
rkso
ns.n
et 1
2921
9 Licensed to Dim
itrios Voutsaras of LIS
CR
, LLC. D
istribution is restricted; please remem
ber to acknowledge the source. http://w
ww
.clarksons.net 129219
Clarksons Research Page ii
World Fleet Monitor - Notes & Definitions
Aug-19
Footnotes The following notes should be read in conjunction with the relevant pages where they are referenced. * Year-to-date figures, up to the start of the month of the publication. 1 Average age is calculated using number of ships (changed from GT in Jul’10), based on year and month of build. 2 World fleet and sales figures on pages 5, 6, 15, 20 & 21 include vessels where flag, ownership or buyer is unknown, and thus are not equal to the sum of the individual regions. Vessels with an unknown flag are assumed to belong to a National Flag. 3 IACS - International Association of Class Societies. Abbreviations: ABS American Bureau of Shipping BV Bureau Veritas CCS China Classification Society DNV GL Det Norske Veritas Germanischer Lloyd Ind Indian Register of Shipping KR Korean Register of Shipping
LR Lloyd’s Register NKK Nippon Kaiji Kyokai RI Registro Italiano Navale RR Russian Maritime Register of Shipping PR Polski Register CRS Croatian Register of Shipping
4 Vessels in serious casualty incidents reported as permanent losses from the fleet. 5 Includes lives lost as a result of vessel losses only (see note 4). 6 Methodology for estimating fleet values is covered in General Note F. Values are estimated for all Oil/Product Tankers, Bulkers, Combined Carriers, Containerships & Gas Carriers in the fleet. Coverage of other ship types may not be complete and therefore figures may not accurately represent the total value of the global merchant fleet > 100gt. 7 Newbuilding Investment, Delivery and Orderbook values are based on contracted value (see general note G). 8 Bulkers includes Combined Carriers (page 16, 29 & 31) 9 Top 20 Countries/Regions sorted by GT contracted in previous calendar year 10 Year-to-date demolition in GT, annualised, as a % of start-year fleet 11 Average age of vessels (in current fleet / sold for demolition / sold second hand) this year, calculations are based on the year and month of build. 12 Aggregate value of reported second hand sales this year. 13 Vessel prices are collected in conjunction with Clarksons Platou brokers, who update pro-formas prepared by Clarksons Research. Prices relate to market contracts where these have taken place and to brokers’ best estimates where no contract has occurred. Prices are for standard ships of the type described in average condition with no account taken for specific conditions which could affect values. Newbuilding prices based on a “European spec.” 5x20% payments and “1st class competitive yards” quotations. Prices will vary according to yard & country of build, delivery and ship specification. Newbuilding prices for Ro-Ro vessels converted to $US prices from Euros. 14 Rate information is collected on a weekly basis with the assistance of Clarksons Platou brokers, who update pro-formas prepared by Clarksons Research. In the absence of reported fixtures, brokers provide an estimate of the likely rate acceptable to an owner. The Clarksea Index is a weighted indicator of shipping market earnings that references weighted average earnings covering oil tankers, dry bulk carriers, gas carriers and containerships. 15 Commodity trade flows shown on pages 26-28 are based on estimated seaborne global totals taking into account significant sources of imports and exports for which data is available. For additional information on the country and regional trade flows shown on pages 26-27, a separate notes document is available upon request.
A. Definition of the World Fleet & Orderbook The Clarksons Research World Fleet Monitor covers the World Fleet & Orderbook of Propelled Sea-going Merchant Vessels in excess of 100 Gross Tonnage. This includes the following vessel types (see note B for further details): Bulk Cargo: Oil & Products Tanker, Bulkcarrier, Combined Ore/Oil or Bulk/Oil Carrier General Cargo: Fully Cellular Containership, Multi-Purpose, Ro-Ro, Other Dry Cargo Specialised: Chemical Tanker, Specialised Tanker, Gas Carrier, Pure Vehicle Carrier, Reefer Non Cargo: Offshore, Dredgers, Tugs, Passenger Vessels. The following vessel types are excluded: Non-propelled vessels, Inland waterway vessels, Merchant vessels of below 100 GT, or where GT is unknown, Fishing vessels, Military vessels, Yachts, Fixed and mobile platforms and barges primarily used for drilling and production in the offshore energy sector (with the exception of FPSO & Drillships) Vessels in the fleet include inactive and laid-up vessels. Vessels on order are defined as vessels where a confirmed contract has been reported. Options, unconfirmed contracts and rumours are not included. Vessels remain on the orderbook until delivered to the owner. B. Shiptype Definitions The Clarksons Research shiptype definitions are based on the primary design function of the vessel as reported by owners, class societies or other sources. 1. Bulkcarriers Includes single deck dry cargo vessels in excess of 10,000 deadweight tonnes.
Lice
nsed
to D
imitr
ios
Vou
tsar
as o
f LIS
CR
, LLC
. Dis
trib
utio
n is
res
tric
ted;
ple
ase
rem
embe
r to
ack
now
ledg
e th
e so
urce
. http
://w
ww
.cla
rkso
ns.n
et 1
2921
9 Licensed to Dim
itrios Voutsaras of LIS
CR
, LLC. D
istribution is restricted; please remem
ber to acknowledge the source. http://w
ww
.clarksons.net 129219
Clarksons Research Page iii
World Fleet Monitor - Notes & Definitions
Aug-19
2. Multi-Purpose General Cargo A Multi-Purpose Vessel is defined as a Non-Cellular container capable vessel (excluding Barge Carriers and Conbulkers) meeting the following criteria: • Any vessel built 1970 onwards with a total TEU capacity of 500 or above; or • Any vessel built 1970 onwards with a TEU capacity of 100 or above and a Deadweight to TEU ratio of 45 or less. • Non-Cellular means the ship is not equipped with fixed cell guides for containers in all the cargo holds. There may be partial coverage and/or portable guides, or none. 3. Ro-ro These are ships intended for wheeled or tracked cargo, such as trucks, unaccompanied trailers, and forest products on bogies. The cargo is driven to and from the ship via a ramp. The deck area is usually covered. Passenger capacity ≤ 50. 4. Other Dry Cargo Other Dry Cargo vessels are dry cargo vessels that do not conform to the criteria in B.1, 2 & 3. This includes Bulkcarriers and Combined carriers below 10,000 dwt and those restricted to operation in the Great Lakes. Other vessel types include General Cargo Tramp & Liner vessels, Barge carriers, Heavy Lift cargo vessels, Landing craft, Deck cargo carriers and Livestock carriers. 5. Chemical Tankers Tankers suitable for chemical trades, including chemical parcel and chemical bulk tankers. Chemical tanker fleet includes stainless steel tankers not classed as specialised tankers, IMO I tankers, IMO II tankers (excluding those 25,000 dwt and above with average tank size >3,000cbm or equivalent), and tankers of an unknown IMO grade <25,000 dwt. Chemical parcel tankers include tankers with stainless steel tanks (not designated as specialised tankers), and vessels with tanks >75% segregated and average tank size <=3,000 cbm. Chemical bulk tankers include vessels with average tank size>3,000 cbm, vessels with average tank size <=3,000 cbm with tanks <=75% segregated, and IMO I tankers with average tank capacity or % tanks segregated unknown, excluding tankers with stainless steel tanks. 6. Specialised Tankers Specialised tankers designed to carry liquid bulk cargoes other than oil or chemicals, e.g. fruit juice carriers & wine. 7. Offshore AHTS, AHT, PSV, Supply, Maintenance, Standby/Rescue, Crew Boat, Multi-Functional Support, Diving Support, ROV/Submersible Support, Well Stimulation, Oilfield Pollution Control, Survey, Heavy Lift/Crane Ship, Transport (Heavy Lift), Cable Lay, Pipelay, Pipebury, Accommodation Vessels & Platforms, Lift Boat, Floating Storage, FPSO & Drillship. Excludes drilling & production platforms other than Drillships & FPSO. 8. Cruise Leisure vessels that operate on voyages exceeding one day. 9. Ferries Passenger Ferries & Passenger/Car Ferries (vessels where vehicles can be driven on and off a car deck, with significant passenger capacity, usually in excess of 50 people, and a high ratio of passenger capacity to cargo lane length, i.e. Passenger number > (lane metres*0.25).
C. Ownership and Ownership Nationality Vessel ownership is based on the Primary Reference Company, defined as the company with the main commercial responsibility for the ship. Nationality is defined as the “Real Nationality”, i.e. the home country/region of the interests behind the primary reference company. None of the information contained in Clarksons Research databases is intended to confirm or otherwise the legal status of the companies or the ships associated with them.
D. Historical Updating The Clarksons Research fleet database is updated on a retrospective basis. This means that historical data changes are applied, where possible, to the month in which they occurred, and not the month that the update was entered into the database. Thus, historical data published by Clarksons Research is subject to revision.
E. Units Fleet totals are expressed in Numbers (No.) and million Gross Tonnage (m.GT).
F. Estimated Fleet Values The aggregate fleet values published in the World Fleet Monitor are calculated from estimates of the value of each vessel based on type, size and age. Values are estimated for all Oil/Product Tankers, Bulkcarriers, Combined Carriers, Containerships & Gas Carriers (as per note B) with reference to matrices based on representative newbuilding, secondhand and demolition values provided by Clarksons Platou brokers. For other vessel types, values are estimated with reference to individual valuations, recently reported sales and residual values calculated from reported newbuilding prices. Please note that for specialised and non-cargo vessels, coverage may not be complete and therefore figures may not accurately represent the total value of the world merchant fleet above 100gt. These are desk-top estimates made on the basis of prompt charter-free delivery, as between a willing buyer and a willing seller for cash payment under normal commercial terms. For the purposes of this exercise all vessels are assumed to be in good and seaworthy condition. G. Newbuilding Contract Values Clarksons Research fleet analysts have allocated each newbuilding contract reported since 1st January 1996 with a contract value in $US. Wherever possible this is the reported contract price, but where this is not available Clarksons Research fleet analysts have provided estimates based on reported prices, adjusted for ship type, size and the date of the contract. Estimates are used to calculate aggregate investment figures but are not made available on a ship basis.
Lice
nsed
to D
imitr
ios
Vou
tsar
as o
f LIS
CR
, LLC
. Dis
trib
utio
n is
res
tric
ted;
ple
ase
rem
embe
r to
ack
now
ledg
e th
e so
urce
. http
://w
ww
.cla
rkso
ns.n
et 1
2921
9 Licensed to Dim
itrios Voutsaras of LIS
CR
, LLC. D
istribution is restricted; please remem
ber to acknowledge the source. http://w
ww
.clarksons.net 129219

Name of IMO
Instrument No. m. GT %EU-
EuropeOther
EuropeNorth
AmericaOther
AmericaAfrica/M.E/S.Asia
Asia/ Pacific
IMO Convention 48 17 Mar 58 177 1,367.0 99.5% 100% 100% 100% 100% 100% 99%IMO amendments 91 07 Dec 08 119 1,210.8 88.1% 98% 87% 100% 99% 97% 74%IMO amendments 93 07 Nov 02 119 1,177.7 85.7% 100% 88% 100% 100% 98% 66%SOLAS Convention 74 25 May 80 168 1,367.2 99.5% 100% 100% 100% 100% 100% 99%SOLAS Protocol 78 01 May 81 124 1,350.4 98.3% 100% 97% 88% 99% 97% 98%SOLAS Protocol 88 03 Feb 00 121 1,348.7 98.1% 100% 88% 100% 100% 97% 98%Stockholm Agreement 96 01 Apr 97 14 104.3 7.6% 22% 69% 45% 2% 0% 0%LOAD LINES Convention 66 21 Jul 68 165 1,367.0 99.5% 100% 100% 100% 100% 100% 99%LOAD LINES Protocol 88 03 Feb 00 117 1,349.4 98.2% 100% 98% 100% 98% 96% 98%TONNAGE Convention 69 18 Jul 82 160 1,365.5 99.3% 100% 100% 100% 100% 99% 99%COLREG Convention 72 15 Jul 77 163 1,367.1 99.5% 100% 100% 100% 100% 100% 99%CSC Convention 72 06 Sep 77 86 930.5 67.7% 67% 95% 100% 25% 93% 78%CSC amendments 93 - 11 176.5 12.8% 3% 0% 0% 0% 3% 30%SFV Protocol 93 - 17 246.0 17.9% 26% 35% 0% 0% 77% 0%STCW Convention 78 28 Apr 84 168 1,367.1 99.5% 100% 100% 100% 100% 100% 99%STCW-F Convention 95 - 32 92.6 6.7% 24% 52% 12% 0% 1% 0%SAR Convention 79 22 Jun 85 115 1,112.0 80.9% 100% 96% 100% 77% 96% 66%STP Agreement 71 02 Jan 74 18 309.3 22.5% 35% 68% 45% 2% 10% 28%STP Protocol 73 02 Jun 77 17 305.2 22.2% 35% 68% 45% 2% 10% 28%IMSO Convention 76 16 Jul 79 106 1,350.4 98.2% 99% 97% 100% 97% 98% 99%INMARSAT OA 76 16 Jul 79 89 1,209.2 88.0% 99% 97% 100% 95% 97% 74%INMARSAT amendments 94 - 41 294.5 21.4% 37% 36% 12% 2% 11% 28%INMARSAT amendments 98 31 Jul 01 64 1,105.6 80.4% 94% 37% 12% 92% 94% 70%IMSO amendments 2006 - 0 0.0 0.0% 0% 0% 0% 0% 0% 0%FACILITATION Convention 65 05 Mar 67 126 1,345.5 97.9% 100% 99% 100% 98% 96% 98%MARPOL 73/78 (Annex I/II) 02 Oct 83 161 1,366.6 99.4% 100% 100% 100% 100% 100% 99%MARPOL 73/78 (Annex III) 01 Jul 92 150 1,358.3 98.8% 100% 100% 100% 99% 100% 98%MARPOL 73/78 (Annex IV) 27 Sep 03 146 1,346.8 98.0% 100% 99% 57% 99% 99% 98%MARPOL 73/78 (Annex V) 31 Dec 88 155 1,360.6 99.0% 100% 100% 100% 100% 100% 98%
MARPOL Protocol 97 (Annex VI) 19 May 05 97 1,345.9 97.9% 100% 98% 100% 98% 95% 98%
London Convention 72 30 Aug 75 90 807.8 58.8% 100% 88% 100% 77% 9% 45%
London Convention Protocol 96 24 Mar 06 54 568.9 41.4% 34% 70% 57% 5% 11% 74%
INTERVENTION Convention 69 06 May 75 92 1,041.8 75.8% 41% 87% 88% 96% 94% 72%
INTERVENTION Protocol 73 30 Mar 83 60 775.4 56.4% 41% 86% 88% 26% 84% 66%
CLC Convention 69 19 Jun 75 33 40.0 2.9% 0% 2% 0% 2% 6% 4%
CLC Protocol 76 08 Apr 81 55 736.1 53.6% 61% 55% 12% 25% 88% 55%
CLC Protocol 92 30 May 96 142 1,348.6 98.1% 100% 100% 57% 98% 98% 99%
FUND Protocol 76 22 Nov 94 32 610.5 44.4% 60% 52% 12% 22% 82% 36%
FUND Protocol 92 30 May 96 117 1,243.6 90.5% 100% 97% 57% 98% 92% 83%
FUND Protocol 2003 03 Mar 05 33 241.8 17.6% 57% 79% 57% 2% 0% 8%
NUCLEAR Convention 71 15 Jul 75 17 252.7 18.4% 28% 35% 0% 0% 77% 0%
PAL Convention 74 28 Apr 87 26 438.8 31.9% 1% 2% 0% 22% 83% 36%
PAL Protocol 76 30 Apr 89 18 434.1 31.6% 1% 2% 0% 22% 81% 36%
PAL Protocol 90 - 3 2.3 0.2% 1% 0% 0% 0% 1% 0%
PAL Protocol 02 23 Apr 14 31 630.9 45.9% 81% 84% 45% 73% 0% 30%
LLMC Convention 76 01 Dec 86 55 734.8 53.5% 30% 13% 0% 24% 94% 71%
LLMC Protocol 96 13 May 04 59 818.1 59.5% 94% 95% 57% 3% 87% 62%
SUA Convention 88 01 Mar 92 167 1,329.2 96.7% 100% 99% 100% 99% 99% 93%
SUA Protocol 88 01 Mar 92 156 1,234.2 89.8% 100% 99% 100% 98% 99% 76%
SUA Convention 2005 28 Jul 10 49 542.6 39.5% 45% 47% 43% 73% 6% 30%
SUA Protocol 2005 28 Jul 10 43 536.3 39.0% 45% 47% 43% 73% 4% 30%
SALVAGE Convention 89 14 Jul 96 74 766.7 55.8% 51% 98% 100% 4% 94% 66%
OPRC Convention 90 13 May 95 114 1,088.2 79.2% 90% 98% 100% 28% 98% 94%
HNS Convention 96 - 14 197.9 14.4% 10% 16% 0% 0% 78% 0%
OPRC/HNS 2000 14 Jun 07 40 597.7 43.5% 78% 46% 0% 0% 82% 39%
BUNKERS CONVENTION 01 21 Nov 08 96 1,286.1 93.6% 100% 98% 57% 96% 90% 92%
ANTI FOULING 01 17 Sep 08 92 1,342.2 97.7% 100% 97% 100% 97% 95% 98%
BALLASTWATER 2004 08 Sep 17 83 1,125.8 81.9% 88% 64% 12% 96% 91% 73%
NAIROBI WRC 2007 14 Apr 15 46 1,029.4 74.9% 76% 34% 57% 95% 93% 61%
HONG KONG SRC 2009 - 13 395.8 28.8% 53% 45% 0% 70% 0% 6%
Clarksons Research Page iv
IMO Convention Ratification
Entry into
Force:
Signatories % of Regional Tonnage Signed up
Aug-19
Lice
nsed
to D
imitr
ios
Vou
tsar
as o
f LIS
CR
, LLC
. Dis
trib
utio
n is
res
tric
ted;
ple
ase
rem
embe
r to
ack
now
ledg
e th
e so
urce
. http
://w
ww
.cla
rkso
ns.n
et 1
2921
9 Licensed to Dim
itrios Voutsaras of LIS
CR
, LLC. D
istribution is restricted; please remem
ber to acknowledge the source. http://w
ww
.clarksons.net 129219

Ownership of Newbuilding Orders
Vessel Contracting
2018 2019* 2016 2017 2018 2019* 2016 2017 2018 2019* This Year
EU-Europe 25.1 10.3 243 396 351 99 5,792 19,103 16,082 4,923 DOWN BY….. -47.5%Other Europe 7.8 0.9 90 206 187 36 1,356 4,850 6,560 566 DOWN BY….. -85.2%North America 10.0 5.8 88 98 74 24 1,542 4,363 3,598 881 DOWN BY….. -58.0%Other Americas 0.1 0.2 14 17 14 2 23 89 12 21 UP BY…. 201.0%Africa 0.3 0.0 34 22 26 1 346 72 141 0 DOWN BY….. -99.9%Mid-East/S. Asia 0.7 1.4 98 92 38 14 1,034 498 587 581 UP BY…. 69.8%Asia/Pacific 31.4 11.6 690 900 871 282 12,188 28,888 34,115 12,161 DOWN BY….. -38.9%TOTAL 78.0 32.8 1,344 1,798 1,696 491 22,282 57,863 63,770 20,919 DOWN BY….. -43.8%
Vessel Contracting
2018 2019* 2016 2017 2018 2019* 2016 2017 2018 2019* This Year
1 China P.R. 6.0 5.7 222 272 153 105 5,446 9,808 5,175 6,151 UP BY…. 103.8%2 Greece 10.5 3.4 50 153 110 38 2,972 8,763 9,687 3,273 DOWN BY….. -42.1%3 Japan 12.7 3.1 121 240 385 97 3,789 7,545 14,844 2,960 DOWN BY….. -65.8%4 South Korea 5.1 1.9 46 68 69 49 629 5,495 7,188 2,398 DOWN BY….. -42.8%5 United States 9.7 5.6 82 73 67 21 1,339 3,731 3,251 853 DOWN BY….. -55.0%6 Oman 0.0 0.3 0 0 0 3 0 0 0 446 UP BY….7 Italy 2.2 2.7 9 21 37 10 394 3,431 938 395 DOWN BY….. -27.7%8 Norway 5.0 0.5 36 75 84 13 918 2,906 4,258 317 DOWN BY….. -87.2%9 Singapore 3.4 0.4 53 85 93 15 612 3,604 3,144 301 DOWN BY….. -83.6%
10 Taiwan 2.6 0.2 27 28 80 8 565 1,025 2,911 277 DOWN BY….. -83.7%Total Top-10 57.3 23.9 646 1,015 1,078 359 16,663 46,307 51,396 17,370 DOWN BY….. -42.1%Share of World Total 73% 73% 48% 56% 64% 73% 75% 80% 81% 83%
11 United Kingdom 2.8 0.8 14 31 27 10 472 1,358 1,644 250 DOWN BY….. -74.0%12 Denmark 1.6 0.4 10 23 25 8 156 1,260 960 229 DOWN BY….. -59.0%13 Sweden 0.4 0.5 16 9 6 7 252 106 209 213 UP BY…. 74.7%14 Netherlands 1.8 1.5 50 58 41 10 229 299 211 188 UP BY…. 52.6%15 Finland 0.0 0.4 2 1 2 3 60 63 1 174 UP BY…. 30926.1%16 Russia 1.2 0.3 26 31 27 12 65 811 647 173 DOWN BY….. -54.2%17 India 0.0 1.0 30 12 11 5 69 15 34 122 UP BY…. 518.9%18 Belgium 0.3 0.1 10 15 8 2 459 588 305 96 DOWN BY….. -46.3%19 Turkey 0.8 0.1 19 83 56 3 345 446 784 65 DOWN BY….. -85.9%20 Germany 4.2 0.2 27 24 59 4 220 591 1,843 64 DOWN BY….. -94.1%
Total 11-20 13.1 5.3 204 287 262 64 2,329 5,539 6,638 1,572 DOWN BY….. -59.4%Share of World Total 17% 16% 15% 16% 15% 13% 10% 10% 10% 8%
Others 7.6 3.6 494 496 356 68 3,290 6,017 5,736 1,976 DOWN BY….. -40.9%Share of World Total 10% 11% 37% 28% 21% 14% 15% 10% 9% 9%
WORLD TOTAL 78.0 32.8 1,344 1,798 1,696 491 22,282 57,863 63,770 20,919 DOWN BY….. -43.8%
Clarksons Research
New Orders in ,000 GT
/Regions9
Page 17 Aug-19
By Region$ bn.7 New Orders in ,000 GT
Top Countries $ bn.7
0
1
2
3
4
5
6
7
8
Jul-1
2
Jan-
13
Jul-1
3
Jan-
14
Jul-1
4
Jan-
15
Jul-1
5
Jan-
16
Jul-1
6
Jan-
17
Jul-1
7
Jan-
18
Jul-1
8
Jan-
19
Jul-1
9
m.GTNewbuilding Orders
EU-EuropeAsia/PacificOther EuropeN.America
3 mma of regional newbuilding
orders
0
1
2
3
4
5
6
7
8
9
10
Chi
na P
.R.
Japa
n
Sou
th K
orea
Gre
ece
Uni
ted
Sta
tes
Nor
way
Tai
wan
Sin
gapo
re
Ger
man
y
Den
mar
k
m.GTOrders By Owner Country/Region
Bars show orders over the past 12 months
Lice
nsed
to D
imitr
ios
Vou
tsar
as o
f LIS
CR
, LLC
. Dis
trib
utio
n is
res
tric
ted;
ple
ase
rem
embe
r to
ack
now
ledg
e th
e so
urce
. http
://w
ww
.cla
rkso
ns.n
et 1
2921
9 Licensed to Dim
itrios Voutsaras of LIS
CR
, LLC. D
istribution is restricted; please remem
ber to acknowledge the source. http://w
ww
.clarksons.net 129219

Ownership of Newbuilding Deliveries
Vessel Deliveries
2018 2019* 2016 2017 2018 2019* 2016 2017 2018 2019* This Year
EU-Europe 23.2 13.8 570 480 378 266 25,006 20,678 15,241 12,567 UP BY…. 41.4%Other Europe 5.3 3.1 198 149 124 103 6,546 5,018 3,753 2,258 UP BY…. 3.1%North America 10.9 5.4 149 124 115 36 5,253 4,949 4,467 1,709 DOWN BY….. -34.4%Other Americas 1.7 0.3 61 41 25 14 307 538 609 206 DOWN BY….. -41.9%Africa 0.3 0.0 25 29 25 3 832 346 274 3 DOWN BY….. -97.9%Mid-East/S. Asia 1.6 0.5 94 98 104 28 2,388 1,542 1,608 546 DOWN BY….. -41.8%Asia/Pacific 29.4 18.6 875 891 1,023 557 23,508 29,083 31,414 21,800 UP BY…. 19.0%TOTAL 73.0 42.1 2,360 2,114 1,911 1,059 66,858 65,989 58,056 39,539 UP BY…. 16.8%
Vessel Deliveries
2018 2019* 2016 2017 2018 2019* 2016 2017 2018 2019* This Year
1 Japan 10.4 7.6 187 193 232 189 6,532 8,271 11,028 8,291 UP BY…. 28.9%2 China P.R. 10.7 6.0 239 289 292 149 8,360 11,191 13,124 7,539 DOWN BY….. -1.5%3 Greece 6.8 5.4 185 162 127 106 11,770 10,167 7,192 7,404 UP BY…. 76.5%4 Singapore 2.7 1.9 123 103 105 58 1,885 1,728 2,249 2,406 UP BY…. 83.4%5 South Korea 2.1 1.5 72 57 58 28 3,272 2,600 1,662 2,129 UP BY…. 119.6%6 Denmark 2.6 1.2 24 41 46 24 468 2,265 2,648 1,249 DOWN BY….. -19.1%7 United Kingdom 1.1 1.5 60 35 20 16 2,322 859 733 1,037 UP BY…. 142.6%8 Norway 3.4 1.7 99 76 52 35 4,884 3,832 2,437 1,034 DOWN BY….. -27.3%9 Germany 1.7 1.2 60 56 42 22 2,494 2,335 1,065 748 UP BY…. 20.4%
10 United States 8.1 2.8 118 89 80 24 3,511 2,625 2,496 723 DOWN BY….. -50.4%Total Top-10 49.7 30.9 1,167 1,101 1,054 651 45,497 45,873 44,634 32,560 UP BY…. 25.1%Share of World Total 68% 73% 49% 52% 55% 61% 68% 70% 77% 82%
11 Italy 1.5 1.0 75 42 17 8 3,137 2,073 676 639 UP BY…. 62.1%12 Hong Kong 0.5 0.4 37 36 23 16 1,158 1,695 513 564 UP BY…. 88.6%13 Canada 2.7 1.2 23 28 32 8 1,325 1,610 1,802 548 DOWN BY….. -47.9%14 Turkey 0.6 0.6 41 39 34 41 422 733 736 541 UP BY…. 25.9%15 Taiwan 1.2 0.5 28 41 48 21 1,160 2,019 1,316 519 DOWN BY….. -32.3%16 Bermuda 0.1 1.4 8 7 3 4 418 714 169 438 UP BY…. 343.7%17 U.A.E. 0.5 0.3 35 23 26 9 354 75 86 354 UP BY…. 601.4%18 Switzerland 0.2 0.4 15 4 6 6 682 155 114 317 UP BY…. 378.3%19 Belgium 0.5 0.3 32 17 12 9 3,412 1,030 549 292 DOWN BY….. -8.8%20 Spain 0.5 0.5 9 15 11 8 7 41 424 248 UP BY…. 0.4%
Total 11-20 8.3 6.5 303 252 212 130 12,075 10,145 6,386 4,461 UP BY…. 19.8%Share of World Total 11% 15% 13% 12% 11% 12% 18% 15% 11% 11%
Others (241) 15.0 4.7 890 761 645 278 9,286 9,971 7,036 2,518 DOWN BY….. -38.7%Share of World Total 21% 11% 38% 36% 34% 26% 14% 15% 12% 6%
WORLD TOTAL 73.0 42.1 2,360 2,114 1,911 1,059 66,858 65,989 58,056 39,539 UP BY…. 16.8%
Clarksons Research
in ,000 GT
/Regions
Page 18 Aug-19
By Region$ bn.7 Vessels Delivered in ,000 GT
Top Countries $ bn.7 Vessels Delivered
0.0
0.5
1.0
1.5
2.0
2.5
3.0
3.5
4.0
4.5
5.0
5.5
6.0
Jul-0
9
Jul-1
0
Jul-1
1
Jul-1
2
Jul-1
3
Jul-1
4
Jul-1
5
Jul-1
6
Jul-1
7
Jul-1
8
Jul-1
9
m. GTNewbuilding Deliveries
EU-EuropeAsia/PacificOther EuropeN.America
3-mma of deliveries to
regional fleets
0
2
4
6
8
10
12
14
16
Chi
na P
.R.
Japa
n
Gre
ece
Sin
gapo
re
Sou
th K
orea
Uni
ted
Sta
tes
Nor
way
Den
mar
k
Uni
ted
Kin
gdom
Tur
key
m.GTDeliveries By Owner Country/Region
Bars show deliveries over the past 12 months
Lice
nsed
to D
imitr
ios
Vou
tsar
as o
f LIS
CR
, LLC
. Dis
trib
utio
n is
res
tric
ted;
ple
ase
rem
embe
r to
ack
now
ledg
e th
e so
urce
. http
://w
ww
.cla
rkso
ns.n
et 1
2921
9 Licensed to Dim
itrios Voutsaras of LIS
CR
, LLC. D
istribution is restricted; please remem
ber to acknowledge the source. http://w
ww
.clarksons.net 129219

Ownership of Demolition Sales
Demolition this Year
Avg11 % 25&+ 2016 2017 2018 2019* 2016 2017 2018 2019* % Fleet10 Age11
EU-Europe 19.0 4% 351 260 191 90 11,473 7,109 6,333 2,332 0.8% 30.7Other Europe 24.9 9% 118 158 114 45 2,192 1,871 1,766 515 0.8% 33.3North America 26.7 8% 54 41 67 47 1,498 1,073 1,255 768 1.3% 23.9Other Americas 29.5 37% 24 27 19 10 439 753 395 219 2.3% 33.3Africa 29.0 19% 18 26 29 5 200 496 223 21 0.3% 34.7Mid-East/S. Asia 20.6 7% 102 125 157 69 1,593 2,809 2,470 905 2.8% 32.8Asia/Pacific 18.0 6% 368 332 205 115 11,657 8,427 5,884 2,934 0.9% 28.9TOTAL 21.2 6% 1,051 991 808 392 29,276 22,960 18,987 7,853 1.0% 30.4
Demolition this Year
Avg11 % 25&+ 2016 2017 2018 2019* 2016 2017 2018 2019* % Fleet10 Age11
1 Greece 15.1 2% 118 79 89 36 3,686 2,368 3,879 1,215 0.9% 28.92 South Korea 20.5 10% 45 42 32 17 2,131 2,127 1,927 851 2.7% 24.83 Japan 16.0 2% 41 24 16 13 1,796 771 518 581 0.6% 27.14 China P.R. 14.0 4% 161 141 32 26 4,788 3,551 500 514 0.5% 29.05 India 18.3 6% 38 36 47 17 702 918 1,246 371 4.0% 32.46 Indonesia 19.2 31% 26 32 35 15 439 259 400 323 3.0% 34.27 Bermuda 11.0 16% 2 2 0 2 180 247 0 301 7.7% 27.28 Canada 27.8 8% 18 14 11 7 525 374 277 266 1.7% 34.79 U.A.E. 21.0 12% 25 38 81 29 256 976 658 235 3.3% 33.4
10 Netherlands 17.6 21% 17 22 16 12 323 271 193 216 2.4% 38.3Total Top-10 16.2 4% 491 430 359 174 14,827 11,862 9,598 4,873 1.1% 30.8Share of World Total 39% 47% 43% 44% 44% 51% 52% 51% 62%
11 Saudi Arabia 18.9 3% 4 1 5 9 214 52 93 211 3.6% 23.312 Germany 15.7 1% 118 48 26 8 4,170 1,831 1,462 210 0.5% 20.413 United States 26.7 8% 34 25 56 38 793 452 978 201 0.5% 21.714 Hong Kong 17.8 5% 12 12 9 8 583 443 191 179 1.3% 29.415 France 17.5 5% 13 6 3 3 507 105 76 178 1.6% 29.516 Norway 19.8 4% 40 36 18 6 958 539 747 175 0.5% 27.017 Italy 22.6 7% 15 20 9 5 379 646 48 174 0.7% 26.118 Brazil 21.2 49% 10 7 1 3 315 460 116 173 3.9% 28.019 Singapore 15.8 7% 16 31 30 10 436 701 1,145 149 0.6% 26.320 Taiwan 17.0 2% 21 6 5 6 835 53 111 131 0.7% 28.2
Total 11-20 19.5 6% 283 192 162 96 9,189 5,282 4,968 1,780 0.8% 24.3Share of World Total 26% 27% 19% 20% 24% 31% 23% 26% 23%
Others (241) 37.7 11% 277 368 287 122 5,261 5,815 4,421 1,199 0.8% 34.6Share of World Total 35% 26% 37% 36% 31% 18% 25% 23% 15%
WORLD TOTAL 21.2 6% 1,051 990 808 392 29,276 22,960 18,987 7,853 1.0% 30.4
Clarksons Research
in ,000 GT
/Regions
Page 19 Aug-19
By RegionFleet Age Demolition Sales in ,000 GT
Top Countries Fleet Age Demolition Sales
0.0
0.4
0.8
1.2
1.6
2.0
2.4
Jul-0
9
Jul-1
0
Jul-1
1
Jul-1
2
Jul-1
3
Jul-1
4
Jul-1
5
Jul-1
6
Jul-1
7
Jul-1
8
Jul-1
9
m. GTDemolition Sales
EU-28Asia/PacificOther EuropeN.America
3 mma of regional demolition sales
0.0
0.5
1.0
1.5
2.0
2.5
3.0
Gre
ece
Sou
th K
orea
Japa
n
Sin
gapo
re
Chi
na P
.R.
Uni
ted
Sta
tes
Ger
man
y
Indi
a
Mal
aysi
a
U.A
.E.
m.GTDemolition By Owner Country/Region
Bars show demolition sales over the past 12 months
Lice
nsed
to D
imitr
ios
Vou
tsar
as o
f LIS
CR
, LLC
. Dis
trib
utio
n is
res
tric
ted;
ple
ase
rem
embe
r to
ack
now
ledg
e th
e so
urce
. http
://w
ww
.cla
rkso
ns.n
et 1
2921
9 Licensed to Dim
itrios Voutsaras of LIS
CR
, LLC. D
istribution is restricted; please remem
ber to acknowledge the source. http://w
ww
.clarksons.net 129219
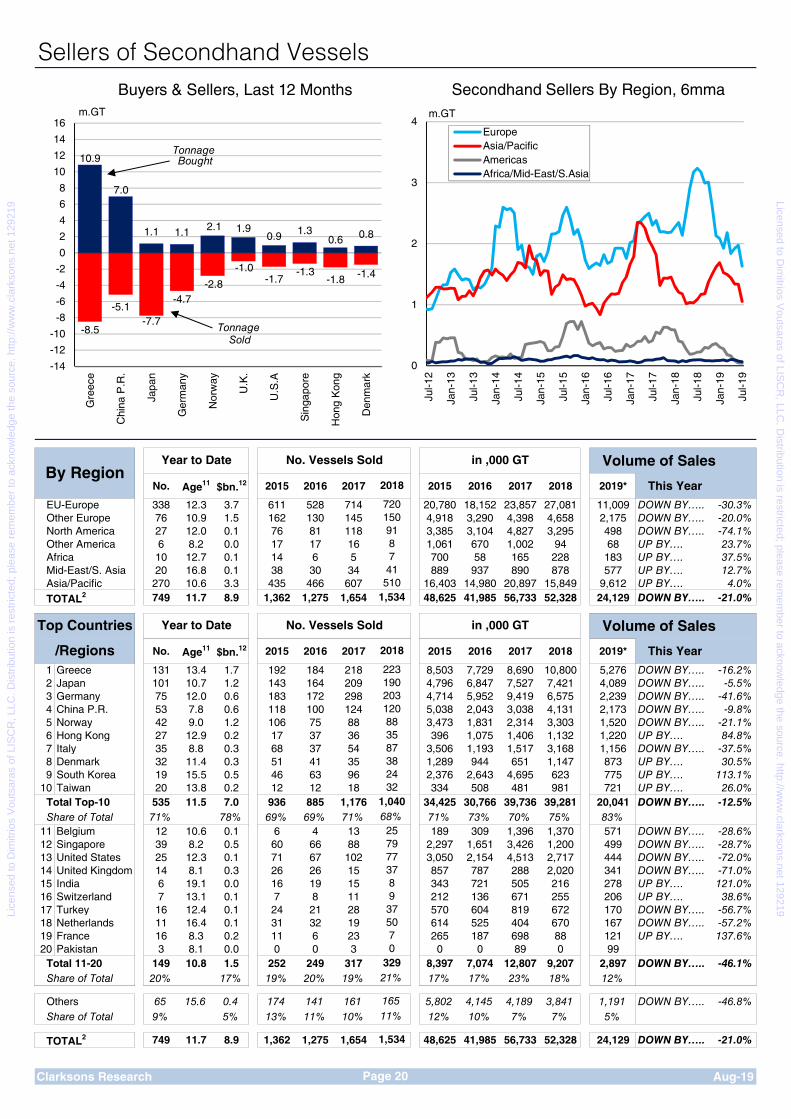
Volume of Sales
No. Age11 $bn.12 2015 2016 2017 2015 2016 2017 2018 2019* This Year
EU-Europe 338 12.3 3.7 611 528 714 20,780 18,152 23,857 27,081 11,009 DOWN BY….. -30.3%Other Europe 76 10.9 1.5 162 130 145 4,918 3,290 4,398 4,658 2,175 DOWN BY….. -20.0%North America 27 12.0 0.1 76 81 118 3,385 3,104 4,827 3,295 498 DOWN BY….. -74.1%Other America 6 8.2 0.0 17 17 16 1,061 670 1,002 94 68 UP BY…. 23.7%Africa 10 12.7 0.1 14 6 5 700 58 165 228 183 UP BY…. 37.5%Mid-East/S. Asia 20 16.8 0.1 38 30 34 889 937 890 878 577 UP BY…. 12.7%Asia/Pacific 270 10.6 3.3 435 466 607 16,403 14,980 20,897 15,849 9,612 UP BY…. 4.0%
TOTAL2 749 11.7 8.9 1,362 1,275 1,654 48,625 41,985 56,733 52,328 24,129 DOWN BY….. -21.0%
Volume of Sales
No. Age11 $bn.12 2015 2016 2017 2015 2016 2017 2018 2019* This Year
1 Greece 131 13.4 1.7 192 184 218 8,503 7,729 8,690 10,800 5,276 DOWN BY….. -16.2%2 Japan 101 10.7 1.2 143 164 209 4,796 6,847 7,527 7,421 4,089 DOWN BY….. -5.5%3 Germany 75 12.0 0.6 183 172 298 4,714 5,952 9,419 6,575 2,239 DOWN BY….. -41.6%4 China P.R. 53 7.8 0.6 118 100 124 5,038 2,043 3,038 4,131 2,173 DOWN BY….. -9.8%5 Norway 42 9.0 1.2 106 75 88 3,473 1,831 2,314 3,303 1,520 DOWN BY….. -21.1%6 Hong Kong 27 12.9 0.2 17 37 36 396 1,075 1,406 1,132 1,220 UP BY…. 84.8%7 Italy 35 8.8 0.3 68 37 54 3,506 1,193 1,517 3,168 1,156 DOWN BY….. -37.5%8 Denmark 32 11.4 0.3 51 41 35 1,289 944 651 1,147 873 UP BY…. 30.5%9 South Korea 19 15.5 0.5 46 63 96 2,376 2,643 4,695 623 775 UP BY…. 113.1%
10 Taiwan 20 13.8 0.2 12 12 18 334 508 481 981 721 UP BY…. 26.0%Total Top-10 535 11.5 7.0 936 885 1,176 34,425 30,766 39,736 39,281 20,041 DOWN BY….. -12.5%Share of Total 71% 78% 69% 69% 71% 71% 73% 70% 75% 83%
11 Belgium 12 10.6 0.1 6 4 13 189 309 1,396 1,370 571 DOWN BY….. -28.6%12 Singapore 39 8.2 0.5 60 66 88 2,297 1,651 3,426 1,200 499 DOWN BY….. -28.7%13 United States 25 12.3 0.1 71 67 102 3,050 2,154 4,513 2,717 444 DOWN BY….. -72.0%14 United Kingdom 14 8.1 0.3 26 26 15 857 787 288 2,020 341 DOWN BY….. -71.0%15 India 6 19.1 0.0 16 19 15 343 721 505 216 278 UP BY…. 121.0%16 Switzerland 7 13.1 0.1 7 8 11 212 136 671 255 206 UP BY…. 38.6%17 Turkey 16 12.4 0.1 24 21 28 570 604 819 672 170 DOWN BY….. -56.7%18 Netherlands 11 16.4 0.1 31 32 19 614 525 404 670 167 DOWN BY….. -57.2%19 France 16 8.3 0.2 11 6 23 265 187 698 88 121 UP BY…. 137.6%20 Pakistan 3 8.1 0.0 0 0 3 0 0 89 0 99 #DIV/0! #DIV/0!
Total 11-20 149 10.8 1.5 252 249 317 8,397 7,074 12,807 9,207 2,897 DOWN BY….. -46.1%Share of Total 20% 17% 19% 20% 19% 17% 17% 23% 18% 12%
Others 65 15.6 0.4 174 141 161 5,802 4,145 4,189 3,841 1,191 DOWN BY….. -46.8%Share of Total 9% 5% 13% 11% 10% 12% 10% 7% 7% 5%
TOTAL2 749 11.7 8.9 1,362 1,275 1,654 48,625 41,985 56,733 52,328 24,129 DOWN BY….. -21.0%
Clarksons Research Aug-19
1,534
Page 20
32921%
16511%
89375070
1,04068%25797737
883587382432
2018
223190203120
/Regions
5101,534
Year to Date No. Vessels Sold in ,000 GTTop Countries
720150918741
Sellers of Secondhand Vessels
By RegionYear to Date No. Vessels Sold in ,000 GT
2018
-8.5
-5.1-7.7
-4.7-2.8
-1.0-1.7
-1.3-1.8 -1.4
10.9
7.0
1.1 1.1 2.1 1.90.9 1.3
0.6 0.8
-14
-12
-10
-8
-6
-4
-2
0
2
4
6
8
10
12
14
16
Gre
ece
Chi
na P
.R.
Japa
n
Ger
man
y
Nor
way
U.K
.
U.S
.A
Sin
gapo
re
Hon
g K
ong
Den
mar
k
m.GT
Buyers & Sellers, Last 12 Months
Tonnage Bought
Tonnage Sold
0
1
2
3
4
Jul-1
2
Jan-
13
Jul-1
3
Jan-
14
Jul-1
4
Jan-
15
Jul-1
5
Jan-
16
Jul-1
6
Jan-
17
Jul-1
7
Jan-
18
Jul-1
8
Jan-
19
Jul-1
9
m.GT
Secondhand Sellers By Region, 6mma
EuropeAsia/PacificAmericasAfrica/Mid-East/S.Asia
Lice
nsed
to D
imitr
ios
Vou
tsar
as o
f LIS
CR
, LLC
. Dis
trib
utio
n is
res
tric
ted;
ple
ase
rem
embe
r to
ack
now
ledg
e th
e so
urce
. http
://w
ww
.cla
rkso
ns.n
et 1
2921
9 Licensed to Dim
itrios Voutsaras of LIS
CR
, LLC. D
istribution is restricted; please remem
ber to acknowledge the source. http://w
ww
.clarksons.net 129219

Volume Purchased
No. Age11 $bn.12 2015 2016 2017 2015 2016 2017 2018 2019* This Year
EU-Europe 209 11.4 2.5 442 345 492 19,186 13,068 18,410 22,048 6,800 DOWN BY….. -47.1%Other Europe 46 10.1 0.8 136 90 201 4,700 3,082 6,638 5,749 1,102 DOWN BY….. -67.1%North America 28 7.1 0.4 59 44 80 3,075 1,169 4,871 3,233 819 DOWN BY….. -56.6%Other Americas 7 7.2 0.1 20 10 19 308 231 230 189 78 DOWN BY….. -29.8%Africa 7 15.1 0.0 17 11 9 236 62 256 51 204 UP BY…. 585.5%Mid-East/S. Asia 28 14.0 0.3 63 64 51 1,391 2,128 1,493 1,637 965 UP BY…. 1.1%Asia/Pacific 240 10.9 3.1 296 325 453 11,585 10,400 14,891 14,080 8,323 UP BY…. 1.3%
TOTAL2 749 11.7 8.9 1,362 1,275 1,654 48,625 41,985 56,733 52,328 24,129 DOWN BY….. -21.0%
Volume Purchased
No. Age11 $bn.12 2015 2016 2017 2015 2016 2017 2018 2019* This Year
1 Greece 107 10.6 1.5 243 205 250 12,862 9,275 11,666 14,871 4,356 DOWN BY….. -49.8%2 China P.R. 120 10.9 0.9 140 174 223 6,288 5,376 6,763 8,015 4,076 DOWN BY….. -12.8%3 Singapore 37 7.2 0.6 21 32 31 592 912 704 1,322 810 UP BY…. 5.0%4 South Korea 14 9.0 0.6 39 32 53 1,630 1,577 3,060 1,050 799 UP BY…. 30.5%5 Germany 28 10.2 0.3 53 30 87 1,481 1,042 2,173 1,755 767 DOWN BY….. -25.1%6 Japan 12 6.5 0.5 6 11 18 421 309 777 1,073 758 UP BY…. 21.2%7 United Kingdom 11 11.9 0.1 42 32 56 1,941 879 1,481 2,328 579 DOWN BY….. -57.4%8 Denmark 25 11.3 0.3 32 20 22 754 536 774 721 566 UP BY…. 34.6%9 Norway 20 8.1 0.6 80 30 127 3,425 1,319 4,430 4,707 561 DOWN BY….. -79.6%
10 United States 17 5.4 0.3 38 35 68 1,763 729 4,630 2,523 559 DOWN BY….. -62.0%Total Top-10 391 9.9 5.6 694 601 935 31,158 21,952 36,458 38,364 13,831 DOWN BY….. -38.2%Share of Total 52% 63% 51% 47% 57% 64% 52% 64% 73% 57%
11 Indonesia 19 15.7 0.2 21 23 32 554 669 783 966 439 DOWN BY….. -22.1%12 Hong Kong 15 13.9 0.2 13 16 36 459 1,048 1,540 722 416 DOWN BY….. -1.4%13 Malaysia 3 17.4 0.1 15 3 2 912 88 308 345 335 UP BY…. 66.3%14 Thailand 3 16.0 0.1 3 5 8 6 110 296 123 323 UP BY…. 348.5%15 U.A.E. 9 15.2 0.1 17 15 16 192 307 296 599 290 DOWN BY….. -16.9%16 Vietnam 12 13.6 0.1 23 11 28 280 128 231 315 269 UP BY…. 46.4%17 Canada 11 9.6 0.2 21 8 11 1,312 407 208 129 260 UP BY…. 244.7%18 India 8 15.6 0.1 32 24 21 577 1,022 865 745 217 DOWN BY….. -50.1%19 Turkey 14 12.0 0.1 36 25 29 624 638 416 303 199 UP BY…. 12.5%20 Lebanon 3 14.1 0.0 3 0 0 60 0 0 42 135 UP BY…. 453.7%
Total 11-20 97 13.9 0.9 184 130 183 4,977 4,417 4,943 4,291 2,882 UP BY…. 15.2%Share of Total 13% 11% 14% 10% 11% 10% 11% 9% 8% 12%
Others 261 13.6 2.3 484 544 536 12,490 15,615 15,331 9,673 7,416 UP BY…. 31.4%Share of Total 35% 26% 36% 43% 32% 26% 37% 27% 18% 31%
TOTAL2 749 11.7 8.9 1,362 1,275 1,654 48,625 41,985 56,733 52,328 24,129 DOWN BY….. -21.0%
Clarksons Research Aug-19
1,534
Page 21
20613%
37024%
49281321173
95862%332976
723266289546
2018
2912436718
/Regions
4851,534
Year to Date No. Vessels Purchased in ,000 GTTop Countries
536144668387
Buyers of Secondhand Vessels
By RegionYear to Date No. Vessels Purchased in ,000 GT
2018
0
30
60
90
120
150
180
0.0
1.0
2.0
3.0
4.0
5.0
Jul-1
4
Nov
-14
Mar
-15
Jul-1
5
Nov
-15
Mar
-16
Jul-1
6
Nov
-16
Mar
-17
Jul-1
7
Nov
-17
Mar
-18
Jul-1
8
Nov
-18
Mar
-19
Jul-1
9
No. $bn.
Volume & Value of Sales
Number of Transactions 3mma(RHS)
Value of Sales 3mma (LHS)
0
1
2
3
4
Jul-1
2
Jan-
13
Jul-1
3
Jan-
14
Jul-1
4
Jan-
15
Jul-1
5
Jan-
16
Jul-1
6
Jan-
17
Jul-1
7
Jan-
18
Jul-1
8
Jan-
19
Jul-1
9
m.GT
Secondhand Buyers By Region, 6mma
EuropeAsia/PacificAmericasAfrica/Mid-East/S.Asia
Lice
nsed
to D
imitr
ios
Vou
tsar
as o
f LIS
CR
, LLC
. Dis
trib
utio
n is
res
tric
ted;
ple
ase
rem
embe
r to
ack
now
ledg
e th
e so
urce
. http
://w
ww
.cla
rkso
ns.n
et 1
2921
9 Licensed to Dim
itrios Voutsaras of LIS
CR
, LLC. D
istribution is restricted; please remem
ber to acknowledge the source. http://w
ww
.clarksons.net 129219

Newbuilding Ship Values
Movement in Prices
2015 2016 2017 2018 Apr May Jun Jul Last 3-Months
OIL TANKERSVLCC 320,000 dwt 93.50 84.50 81.50 92.50 93.00 93.00 93.00 92.50 DOWN BY….. -0.2%Suezmax 157,000 dwt 63.00 54.50 55.00 60.50 61.50 61.50 61.50 61.50 SAME…. 0.0%Aframax 115,000 dwt 52.00 44.50 44.00 48.00 48.50 48.50 48.50 48.50 SAME…. 0.0%Panamax 74,000 dwt 45.00 41.00 41.50 44.00 44.50 44.50 44.50 44.50 SAME…. 0.0%'MR' Tanker 51,000 dwt 35.50 32.50 33.75 36.50 36.50 36.50 36.50 36.50 SAME…. 0.0%
BULKCARRIERSCapesize 180,000 dwt 46.00 42.00 44.00 50.00 51.00 51.00 51.00 51.00 SAME…. 0.0%Kamsarmax 82,000 dwt 26.50 24.50 25.50 28.00 28.00 28.00 28.00 28.00 SAME…. 0.0%Ultramax 62,000 dwt 24.25 22.25 24.00 26.00 26.00 26.00 26.00 26.00 SAME…. 0.0%Handysize 38,000 dwt 20.50 19.50 22.00 24.00 24.00 24.00 24.00 24.00 SAME…. 0.0%
LPG CARRIERSVLGC 82,000m3 77.00 71.00 70.00 71.00 71.00 71.00 71.00 71.00 SAME…. 0.0%Mid-size 35,000m3 50.50 48.00 46.50 47.00 47.00 47.00 47.00 47.00 SAME…. 0.0%Mid-size (F/R) 24,000m3 44.00 42.00 42.00 43.00 43.00 43.00 43.00 43.00 SAME…. 0.0%
LNG CARRIERS# 174,000m3 199.00 197.00 182.00 182.00 185.00 185.50 185.50 185.50 UP BY…. 0.1%
CONTAINERSHIPSNeo-Panamax 13,000 teu g'less 116.00 109.00 107.00 115.00 113.00 111.50 111.50 111.00 DOWN BY….. -0.6%Neo-Panamax 8,800 teu g'less 89.00 83.00 83.00 89.00 89.50 89.00 89.00 89.00 DOWN BY….. -0.2%Intermediate 6,600 teu g'less 66.50 60.00 60.50 69.00 72.00 72.00 72.00 72.00 SAME…. 0.0%Intermediate 4,800 teu g'less 49.00 43.00 44.00 49.75 53.00 53.00 53.00 53.00 SAME…. 0.0%Feeder 2,750 teu g'less 29.50 27.00 28.75 35.00 35.00 35.00 34.50 32.75 DOWN BY….. -2.2%Feeder 2,000 teu g'less 26.25 22.25 22.50 26.50 26.50 26.50 26.50 25.75 DOWN BY….. -1.0%Feeder 1,700 teu geared 25.00 21.75 22.50 26.00 26.25 26.25 26.25 26.25 SAME…. 0.0%Feeder 1,000 teu geared 18.75 16.25 16.50 19.00 19.75 19.75 19.50 19.25 DOWN BY….. -0.9%
RO-RO VESSELSMedium 2,300-2,700 lm 50.13 46.17 51.01 48.89 48.31 48.05 48.61 48.29 DOWN BY….. 0.0%Large 3,500-4,000 lm 59.90 56.70 62.90 60.30 59.50 59.20 59.90 59.50 SAME…. 0.0%
OFFSHORE VESSELSOffshore AHTS 18,000 BHP 43.35 43.03 45.75 46.32 49.06 49.11 49.88 50.10 UP BY…. 0.7%Offshore AHTS 8,000 BHP^ 16.50 16.00 15.50 15.50 15.50 15.50 15.50 15.50 SAME…. 0.0%Offshore PSV c.4,000 dwt 31.79 31.40 34.31 37.06 40.88 41.11 41.76 41.94 UP BY…. 0.9%Offshore PSV c.3,200 dwt 19.07 18.61 20.47 22.00 23.36 22.84 23.20 23.30 DOWN BY….. -0.1%CLARKSON NB PRICE INDEX 131 123 125 130 131 131 131 131 DOWN BY….. -0.1%
Clarksons Research
Newbuilding prices vary as to country of build, delivery and ship specification. Prices here are end year/end month/latest and from Jun-08 assume a "European spec", 20/20/20/20/20% payments and "first class competitive yards" quotations, and relate to market contracts where these have taken place and to brokers' best estimates when no contracts have occurred. ^Asian Yard.
Page 22 Aug-19
Newbuilding Newbuilding, $m end13 Newbuilding, $m end13
Prices
120
125
130
135
140
-10%
-5%
0%
5%
10%
Jul 1
4
Jan
15
Jul 1
5
Jan
16
Jul 1
6
Jan
17
Jul 1
7
Jan
18
Jul 1
8
Jan
19
Jul 1
9
% y-o-y
Newbuilding Price Indices
Index, RHS
Index, y-o-y, LHS
Index, Jan 1988=100
20
40
60
80
100
120
140
160
Jul-0
9
Jul-1
0
Jul-1
1
Jul-1
2
Jul-1
3
Jul-1
4
Jul-1
5
Jul-1
6
Jul-1
7
Jul-1
8
Jul-1
9
$m
Newbuilding Price Trends
CapesizeVLCC13,000 TEU ContainershipVLGC
Lice
nsed
to D
imitr
ios
Vou
tsar
as o
f LIS
CR
, LLC
. Dis
trib
utio
n is
res
tric
ted;
ple
ase
rem
embe
r to
ack
now
ledg
e th
e so
urce
. http
://w
ww
.cla
rkso
ns.n
et 1
2921
9 Licensed to Dim
itrios Voutsaras of LIS
CR
, LLC. D
istribution is restricted; please remem
ber to acknowledge the source. http://w
ww
.clarksons.net 129219

Earnings & Timecharter Values
Movement in Index
2016 2017 2018 2019 Apr May Jun Jul Last 3-Months
Tanker Earnings 17,917 11,655 11,216 14,600 11,533 11,924 13,760 10,808 DOWN BY….. -2.1%Bulkcarrier Earnings 6,218 10,986 12,249 9,794 8,575 10,033 10,948 13,930 UP BY…. 17.6%Gas Carrier Earnings 19,813 15,215 16,177 23,100 24,770 26,016 32,404 32,402 UP BY…. 9.4%Containership Earnings 7,131 9,035 12,311 12,738 12,791 13,108 13,351 13,922 UP BY…. 2.9%CLARKSEA INDEX 9,441 10,767 12,144 12,119 10,861 11,866 13,050 14,094 UP BY…. 9.1%
Movement in Rates
2016 2017 2018 2019 Apr May Jun Jul Last 3-Months
VLCC 310,000 dwt 36,585 27,084 22,899 31,109 30,438 31,625 34,500 33,875 UP BY…. 3.6%Suezmax 150,000 dwt 27,302 18,495 17,486 23,573 22,938 22,900 23,750 24,625 UP BY…. 2.4%Aframax 110,000 dwt 21,488 15,490 14,925 20,379 20,500 21,350 21,625 21,563 UP BY…. 1.7%Panamax (LR1) 74,000 dwt 18,116 13,077 12,962 15,476 15,344 15,425 15,625 17,688 UP BY…. 4.9%MR (C) 47-48,000 dwt 15,092 13,219 13,120 14,048 14,094 14,125 14,125 14,875 UP BY…. 1.8%Handy (C) 37,000 dwt 13,998 11,430 11,572 12,879 13,000 13,000 13,000 13,375 UP BY…. 1.0%Capesize 170,000 dwt 7,344 13,996 18,139 14,992 12,719 14,900 16,813 20,094 UP BY…. 16.5%Panamax 75,000 dwt 6,263 10,665 13,029 11,455 10,875 11,460 11,669 13,681 UP BY…. 8.0%Supramax~ 58,000 dwt 6,044 9,822 12,808 10,544 10,281 10,425 9,844 11,063 UP BY…. 2.5%
Handysize† 32,000 dwt 5,264 8,087 10,207 8,952 9,250 8,825 8,875 9,094 DOWN BY….. -0.6%VLGC* 84,000m3 24,655 18,288 19,948 27,617 27,535 28,242 32,960 36,576 UP BY…. 9.9%Large 59,000m3 24,550 16,737 17,953 23,046 22,768 23,705 28,151 28,768 UP BY…. 8.1%Medium 35,000m3 23,579 14,766 14,526 17,006 16,562 16,767 17,466 18,247 UP BY…. 3.3%Semi-Ref 20,500m3 22,468 13,401 14,849 16,693 15,946 16,241 17,589 17,754 UP BY…. 3.6%Ethylene 17,000m3 22,537 20,852 20,988 21,795 22,192 21,600 21,206 21,206 DOWN BY….. -1.5%Ethylene 7-8,000m3 16,026 15,639 15,452 15,452 15,452 15,452 15,452 15,452 SAME…. 0.0%LNG Spot^ 160,000m3 (TFDE) 33,528 46,058 88,692 53,629 33,875 52,900 57,875 60,750 UP BY…. 21.5%
Intermediate# 6,800 teu g'less 13,208 15,229 18,138 17,839 18,000 18,200 19,000 19,000 UP BY…. 1.8%Narrow Beam 4,400 teu g'less 4,979 7,692 11,096 9,259 8,656 9,090 9,400 12,025 UP BY…. 11.6%Feeder 2,750 teu g'less 6,000 8,800 10,813 8,916 9,025 9,020 9,150 9,263 UP BY…. 0.9%Feeder 2,000 teu g'less 6,221 7,154 9,508 7,839 7,750 7,830 8,263 8,638 UP BY…. 3.7%Feeder 1,700 teu geared 6,804 7,242 9,675 7,795 7,938 8,210 8,313 8,675 UP BY…. 3.0%Feeder 1,000 teu geared 6,550 6,142 7,467 6,123 6,188 6,100 6,150 6,206 UP BY…. 0.1%MPP Liner 17,000 dwt geared 7,858 7,671 8,992 8,750 8,700 8,700 8,700 8,700 SAME…. 0.0%MPP Liner 12,000 dwt geared 6,767 6,454 8,342 7,775 7,700 7,700 7,700 7,700 SAME…. 0.0%AHTS 240t BP 23,842 22,697 26,427 28,118 28,200 28,625 29,000 29,000 UP BY…. 0.9%AHTS 120t BP 8,158 7,517 7,673 7,671 7,665 7,665 7,700 7,700 UP BY…. 0.2%PSV c.4,000 dwt 13,279 11,160 11,943 13,822 14,000 14,450 14,900 14,950 UP BY…. 2.2%PSV c.3,200 dwt 10,123 8,498 9,168 10,273 10,250 10,395 10,600 10,675 UP BY…. 1.4%^Single voyage loading within next 3 months. ~Based on 52,000 dwt ship until end 2014. †Based on 30,000 dwt ship until end 2015 *Based on 82,000m³ ship until end 2015. # 3 year rate
Clarksons Research Page 23 Aug-19
ClarkSea Index14Average Earnings, $/day Average Earnings, $/day
Charter Rates141 year t/c, $/day 1 year t/c, $/day
0
5
10
15
20
25
Jul 1
4
Jan
15
Jul 1
5
Jan
16
Jul 1
6
Jan
17
Jul 1
7
Jan
18
Jul 1
8
Jan
19
Jul 1
9
$,000/dayClarkSea Index
The ClarkSea Index is a weighted average of the earnings of Tanker, Bulk, Gas and Container vessels
0
10
20
30
40
50
60
70
80
90
100
Jul-0
9
Jul-1
0
Jul-1
1
Jul-1
2
Jul-1
3
Jul-1
4
Jul-1
5
Jul-1
6
Jul-1
7
Jul-1
8
Jul-1
9
$,000/dayTimecharter Rate Trends
CapesizeVLCC2,750 TEU ContainershipVLGC
Series basis 1yr timecharter rates
Lice
nsed
to D
imitr
ios
Vou
tsar
as o
f LIS
CR
, LLC
. Dis
trib
utio
n is
res
tric
ted;
ple
ase
rem
embe
r to
ack
now
ledg
e th
e so
urce
. http
://w
ww
.cla
rkso
ns.n
et 1
2921
9 Licensed to Dim
itrios Voutsaras of LIS
CR
, LLC. D
istribution is restricted; please remem
ber to acknowledge the source. http://w
ww
.clarksons.net 129219
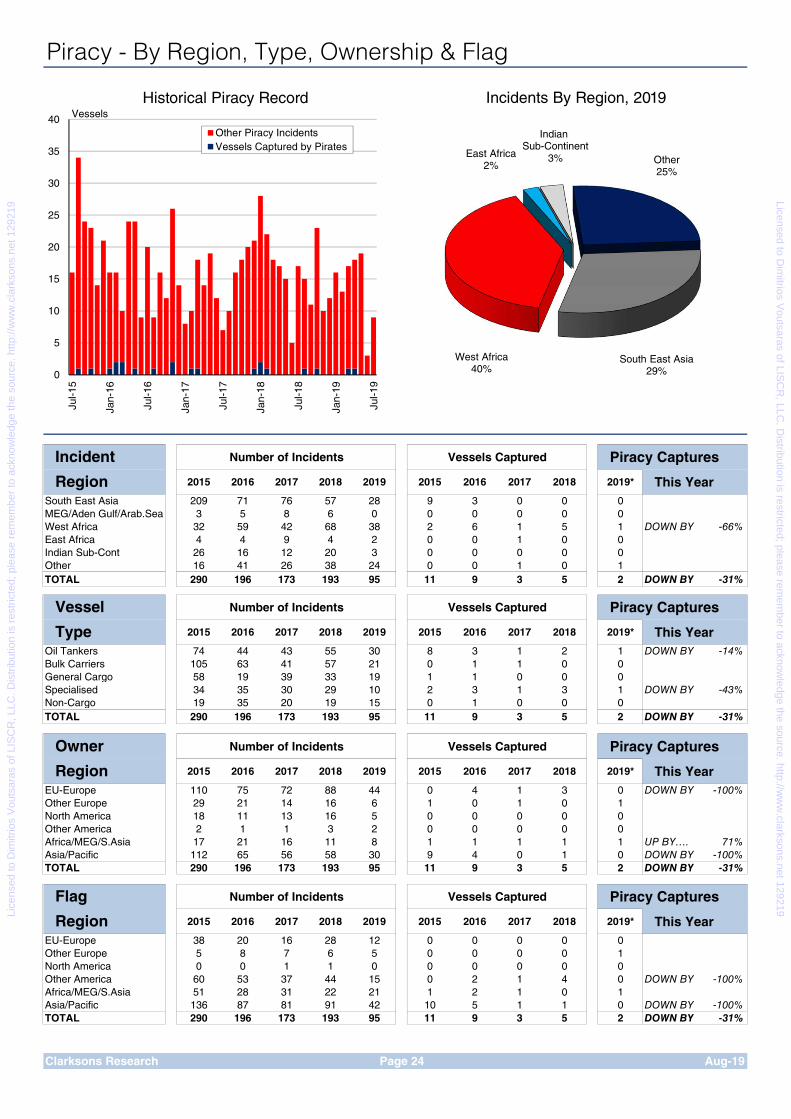
Piracy - By Region, Type, Ownership & Flag
Number of Incidents Vessels Captured Piracy Captures
2015 2016 2017 2018 2019 2015 2016 2017 2018 2019* This YearSouth East Asia 209 71 76 57 28 9 3 0 0 0MEG/Aden Gulf/Arab.Sea 3 5 8 6 0 0 0 0 0 0 UP BY….West Africa 32 59 42 68 38 2 6 1 5 1 DOWN BY -66%East Africa 4 4 9 4 2 0 0 1 0 0 UP BY….Indian Sub-Cont 26 16 12 20 3 0 0 0 0 0 UP BY….Other 16 41 26 38 24 0 0 1 0 1 UP BY….TOTAL 290 196 173 193 95 11 9 3 5 2 DOWN BY… -31%
Number of Incidents Vessels Captured Piracy Captures
2015 2016 2017 2018 2019 2015 2016 2017 2018 2019* This YearOil Tankers 74 44 43 55 30 8 3 1 2 1 DOWN BY -14%Bulk Carriers 105 63 41 57 21 0 1 1 0 0 UP BY….General Cargo 58 19 39 33 19 1 1 0 0 0Specialised 34 35 30 29 10 2 3 1 3 1 DOWN BY -43%Non-Cargo 19 35 20 19 15 0 1 0 0 0TOTAL 290 196 173 193 95 11 9 3 5 2 DOWN BY… -31%
Number of Incidents Vessels Captured Piracy Captures
2015 2016 2017 2018 2019 2015 2016 2017 2018 2019* This YearEU-Europe 110 75 72 88 44 0 4 1 3 0 DOWN BY -100%Other Europe 29 21 14 16 6 1 0 1 0 1 UP BY….North America 18 11 13 16 5 0 0 0 0 0 UP BY….Other America 2 1 1 3 2 0 0 0 0 0 UP BY….Africa/MEG/S.Asia 17 21 16 11 8 1 1 1 1 1 UP BY…. 71%Asia/Pacific 112 65 56 58 30 9 4 0 1 0 DOWN BY -100%TOTAL 290 196 173 193 95 11 9 3 5 2 DOWN BY… -31%
Number of Incidents Vessels Captured Piracy Captures
2015 2016 2017 2018 2019 2015 2016 2017 2018 2019* This YearEU-Europe 38 20 16 28 12 0 0 0 0 0 UP BY….Other Europe 5 8 7 6 5 0 0 0 0 1 UP BY….North America 0 0 1 1 0 0 0 0 0 0 UP BY….Other America 60 53 37 44 15 0 2 1 4 0 DOWN BY -100%Africa/MEG/S.Asia 51 28 31 22 21 1 2 1 0 1 UP BY….Asia/Pacific 136 87 81 91 42 10 5 1 1 0 DOWN BY -100%TOTAL 290 196 173 193 95 11 9 3 5 2 DOWN BY… -31%
Clarksons Research Page 24 Aug-19
Flag
Region
Incident
Region
Vessel
Type
Owner
Region
0
5
10
15
20
25
30
35
40
Jul-1
5
Jan-
16
Jul-1
6
Jan-
17
Jul-1
7
Jan-
18
Jul-1
8
Jan-
19
Jul-1
9
VesselsHistorical Piracy Record
Other Piracy IncidentsVessels Captured by Pirates
Incidents By Region, 2019
Indian Sub-Continent
3% Other25%
West Africa40%
East Africa2%
South East Asia29%
Lice
nsed
to D
imitr
ios
Vou
tsar
as o
f LIS
CR
, LLC
. Dis
trib
utio
n is
res
tric
ted;
ple
ase
rem
embe
r to
ack
now
ledg
e th
e so
urce
. http
://w
ww
.cla
rkso
ns.n
et 1
2921
9 Licensed to Dim
itrios Voutsaras of LIS
CR
, LLC. D
istribution is restricted; please remem
ber to acknowledge the source. http://w
ww
.clarksons.net 129219
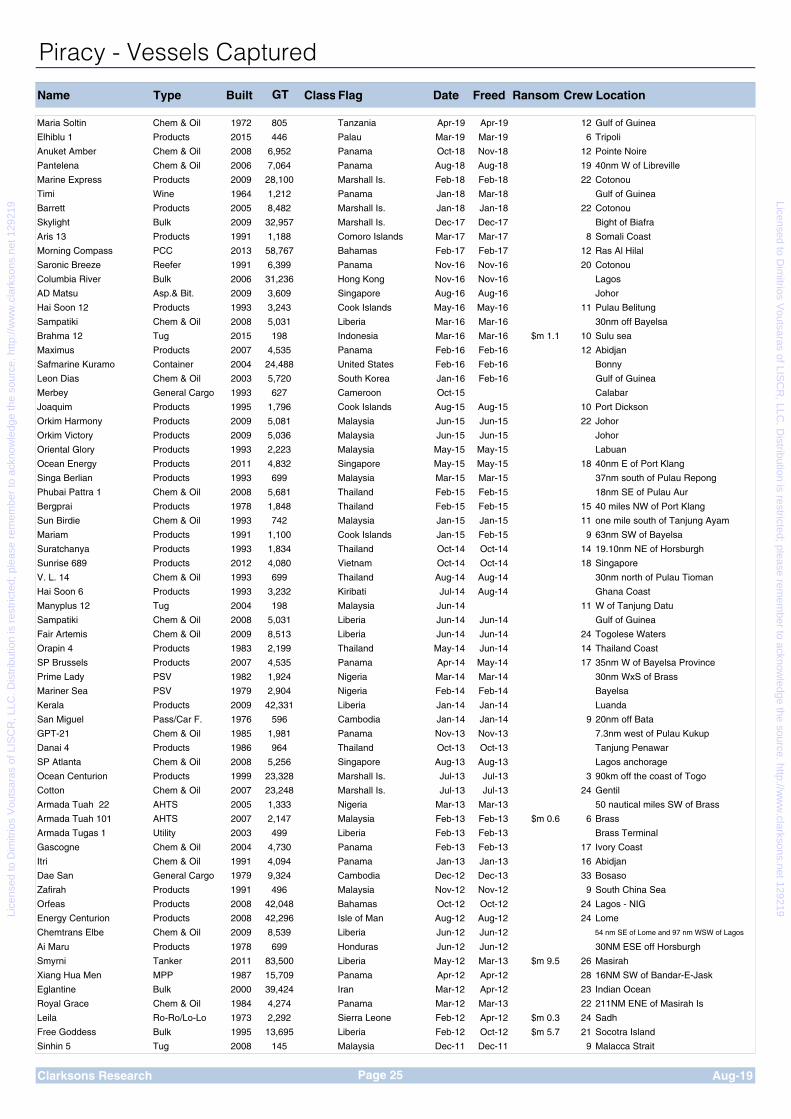
Name Type Built Class Flag Date Freed Ransom Crew Location
Maria Soltin Chem & Oil 1972 805 Tanzania Apr-19 Apr-19 12 Gulf of Guinea
Elhiblu 1 Products 2015 446 Palau Mar-19 Mar-19 6 Tripoli
Anuket Amber Chem & Oil 2008 6,952 Panama Oct-18 Nov-18 12 Pointe Noire
Pantelena Chem & Oil 2006 7,064 Panama Aug-18 Aug-18 19 40nm W of Libreville
Marine Express Products 2009 28,100 Marshall Is. Feb-18 Feb-18 22 Cotonou
Timi Wine 1964 1,212 Panama Jan-18 Mar-18 Gulf of Guinea
Barrett Products 2005 8,482 Marshall Is. Jan-18 Jan-18 22 Cotonou
Skylight Bulk 2009 32,957 Marshall Is. Dec-17 Dec-17 Bight of Biafra
Aris 13 Products 1991 1,188 Comoro Islands Mar-17 Mar-17 8 Somali Coast
Morning Compass PCC 2013 58,767 Bahamas Feb-17 Feb-17 12 Ras Al Hilal
Saronic Breeze Reefer 1991 6,399 Panama Nov-16 Nov-16 20 Cotonou
Columbia River Bulk 2006 31,236 Hong Kong Nov-16 Nov-16 Lagos
AD Matsu Asp.& Bit. 2009 3,609 Singapore Aug-16 Aug-16 Johor
Hai Soon 12 Products 1993 3,243 Cook Islands May-16 May-16 11 Pulau Belitung
Sampatiki Chem & Oil 2008 5,031 Liberia Mar-16 Mar-16 30nm off Bayelsa
Brahma 12 Tug 2015 198 Indonesia Mar-16 Mar-16 $m 1.1 10 Sulu sea
Maximus Products 2007 4,535 Panama Feb-16 Feb-16 12 Abidjan
Safmarine Kuramo Container 2004 24,488 United States Feb-16 Feb-16 Bonny
Leon Dias Chem & Oil 2003 5,720 South Korea Jan-16 Feb-16 Gulf of Guinea
Merbey General Cargo 1993 627 Cameroon Oct-15 Calabar
Joaquim Products 1995 1,796 Cook Islands Aug-15 Aug-15 10 Port Dickson
Orkim Harmony Products 2009 5,081 Malaysia Jun-15 Jun-15 22 Johor
Orkim Victory Products 2009 5,036 Malaysia Jun-15 Jun-15 Johor
Oriental Glory Products 1993 2,223 Malaysia May-15 May-15 Labuan
Ocean Energy Products 2011 4,832 Singapore May-15 May-15 18 40nm E of Port Klang
Singa Berlian Products 1993 699 Malaysia Mar-15 Mar-15 37nm south of Pulau Repong
Phubai Pattra 1 Chem & Oil 2008 5,681 Thailand Feb-15 Feb-15 18nm SE of Pulau Aur
Bergprai Products 1978 1,848 Thailand Feb-15 Feb-15 15 40 miles NW of Port Klang
Sun Birdie Chem & Oil 1993 742 Malaysia Jan-15 Jan-15 11 one mile south of Tanjung Ayam
Mariam Products 1991 1,100 Cook Islands Jan-15 Feb-15 9 63nm SW of Bayelsa
Suratchanya Products 1993 1,834 Thailand Oct-14 Oct-14 14 19.10nm NE of Horsburgh
Sunrise 689 Products 2012 4,080 Vietnam Oct-14 Oct-14 18 Singapore
V. L. 14 Chem & Oil 1993 699 Thailand Aug-14 Aug-14 30nm north of Pulau Tioman
Hai Soon 6 Products 1993 3,232 Kiribati Jul-14 Aug-14 Ghana Coast
Manyplus 12 Tug 2004 198 Malaysia Jun-14 11 W of Tanjung Datu
Sampatiki Chem & Oil 2008 5,031 Liberia Jun-14 Jun-14 Gulf of Guinea
Fair Artemis Chem & Oil 2009 8,513 Liberia Jun-14 Jun-14 24 Togolese Waters
Orapin 4 Products 1983 2,199 Thailand May-14 Jun-14 14 Thailand Coast
SP Brussels Products 2007 4,535 Panama Apr-14 May-14 17 35nm W of Bayelsa Province
Prime Lady PSV 1982 1,924 Nigeria Mar-14 Mar-14 30nm WxS of Brass
Mariner Sea PSV 1979 2,904 Nigeria Feb-14 Feb-14 Bayelsa
Kerala Products 2009 42,331 Liberia Jan-14 Jan-14 Luanda
San Miguel Pass/Car F. 1976 596 Cambodia Jan-14 Jan-14 9 20nm off Bata
GPT-21 Chem & Oil 1985 1,981 Panama Nov-13 Nov-13 7.3nm west of Pulau Kukup
Danai 4 Products 1986 964 Thailand Oct-13 Oct-13 Tanjung Penawar
SP Atlanta Chem & Oil 2008 5,256 Singapore Aug-13 Aug-13 Lagos anchorage
Ocean Centurion Products 1999 23,328 Marshall Is. Jul-13 Jul-13 3 90km off the coast of Togo
Cotton Chem & Oil 2007 23,248 Marshall Is. Jul-13 Jul-13 24 Gentil
Armada Tuah 22 AHTS 2005 1,333 Nigeria Mar-13 Mar-13 50 nautical miles SW of Brass
Armada Tuah 101 AHTS 2007 2,147 Malaysia Feb-13 Feb-13 $m 0.6 6 Brass
Armada Tugas 1 Utility 2003 499 Liberia Feb-13 Feb-13 Brass Terminal
Gascogne Chem & Oil 2004 4,730 Panama Feb-13 Feb-13 17 Ivory Coast
Itri Chem & Oil 1991 4,094 Panama Jan-13 Jan-13 16 Abidjan
Dae San General Cargo 1979 9,324 Cambodia Dec-12 Dec-13 33 Bosaso
Zafirah Products 1991 496 Malaysia Nov-12 Nov-12 9 South China Sea
Orfeas Products 2008 42,048 Bahamas Oct-12 Oct-12 24 Lagos - NIG
Energy Centurion Products 2008 42,296 Isle of Man Aug-12 Aug-12 24 Lome
Chemtrans Elbe Chem & Oil 2009 8,539 Liberia Jun-12 Jun-12 54 nm SE of Lome and 97 nm WSW of Lagos
Ai Maru Products 1978 699 Honduras Jun-12 Jun-12 30NM ESE off Horsburgh
Smyrni Tanker 2011 83,500 Liberia May-12 Mar-13 $m 9.5 26 Masirah
Xiang Hua Men MPP 1987 15,709 Panama Apr-12 Apr-12 28 16NM SW of Bandar-E-Jask
Eglantine Bulk 2000 39,424 Iran Mar-12 Apr-12 23 Indian Ocean
Royal Grace Chem & Oil 1984 4,274 Panama Mar-12 Mar-13 22 211NM ENE of Masirah Is
Leila Ro-Ro/Lo-Lo 1973 2,292 Sierra Leone Feb-12 Apr-12 $m 0.3 24 Sadh
Free Goddess Bulk 1995 13,695 Liberia Feb-12 Oct-12 $m 5.7 21 Socotra Island
Sinhin 5 Tug 2008 145 Malaysia Dec-11 Dec-11 9 Malacca Strait
Clarksons Research Aug-19
Piracy - Vessels Captured
GT
Page 25
Lice
nsed
to D
imitr
ios
Vou
tsar
as o
f LIS
CR
, LLC
. Dis
trib
utio
n is
res
tric
ted;
ple
ase
rem
embe
r to
ack
now
ledg
e th
e so
urce
. http
://w
ww
.cla
rkso
ns.n
et 1
2921
9 Licensed to Dim
itrios Voutsaras of LIS
CR
, LLC. D
istribution is restricted; please remem
ber to acknowledge the source. http://w
ww
.clarksons.net 129219

Major Seaborne Imports by Country/Region
Bulk Cargo
Imports15 2015 2016 2017 2018e
Japan 639 626 623 609 149 33 11 83 124 54 129 27 DOWN BY… -2%
China 1,581 1,732 1,864 1,907 414 33 19 54 1,047 39 198 103 UP BY…. 2%
Korea 426 432 456 467 153 35 6 44 73 25 116 15 UP BY…. 2%
India 460 461 467 515 227 7 13 22 16 59 170 0 UP BY…. 10%
Taiwan 173 176 180 179 44 16 2 17 24 12 57 8 DOWN BY… 0%
Total Asia 3,815 4,012 4,224 4,332 1,130 370 61 239 1,307 198 811 216 UP BY…. 3%
Germany 198 200 189 181 68 29 0 0 41 12 31 DOWN BY… -4%
France 121 120 126 122 53 27 3 9 16 4 9 DOWN BY… -4%
Italy 110 110 113 108 63 15 2 6 8 3 11 DOWN BY… -4%
Spain 106 98 109 105 68 3 2 11 7 2 13 DOWN BY… -3%
UK 112 94 96 97 39 34 1 5 9 3 6 UP BY…. 1%
Netherlands 197 201 208 206 93 83 4 3 9 4 10 DOWN BY… -1%
Other EU 266 272 284 293 104 85 4 9 17 13 15 47 UP BY…. 3%
Other OECD Europe 111 114 119 121 21 41 1 9 11 6 20 12 UP BY…. 2%
Eastern Europe & FSU 14 12 12 13 0 3 3 0 0 4 2 2 UP BY…. 12%
Total Europe 1,233 1,220 1,254 1,245 510 319 17 52 117 50 119 61 DOWN BY… -1%
USA 295 323 315 291 202 73 0 2 5 0 5 4 DOWN BY… -8%
Canada 49 42 43 47 28 15 0 0 0 0 1 2 UP BY…. 8%
Latin America 252 260 266 274 25 114 9 10 9 16 32 57 UP BY…. 3%
Total Americas 596 625 624 611 255 203 10 12 14 16 37 63 DOWN BY… -2%
Africa 182 193 185 193 20 71 8 2 9 3 17 63 UP BY…. 4%
Middle East 149 154 153 177 0 75 0 7 29 0 10 55 UP BY…. 16%
Oceania 56 52 55 59 24 33 1 0 1 0 1 0 UP BY…. 6%
Total Others 481 494 498 532 121 179 11 14 39 3 29 137 UP BY…. 7%
TOTAL 6,125 6,350 6,601 6,716 2,016 1,072 98 318 1,476 267 996 473 UP BY…. 2%
growth % 2% 4% 4% 2%
% Share
Europe 20% 19% 19% 19% 25% 30% 17% 16% 8% 19% 12% 13% DOWN BY… -2%
Americas 10% 10% 9% 9% 13% 19% 10% 4% 1% 6% 4% 13% DOWN BY… -4%
Asia/M.East/Oceania 66% 66% 67% 68% 57% 45% 63% 77% 91% 74% 83% 57% UP BY…. 1%
Africa 3% 3% 3% 3% 1% 7% 8% 1% 1% 1% 2% 13% UP BY…. 3%Note: Commodity import data based on latest available information. Grain imports include wheat, coarse grain and soybeans.
All EU grain imports are shown against 'Other EU'. LPG trade basis customs statistics of liquefied propane and butane.
Container
Imports15 2015 2016 2017 2018e 2011 2012 2013 2014 2015 2016 2017 2018e
North America 6% 5% 5% 7% 21 21 22 23 24 25 26 28 UP BY…. 7%
Europe 0% 3% 5% 4% 32 31 33 34 34 35 37 38 UP BY…. 4%
Far East 2% 6% 7% 4% 58 61 65 68 69 73 79 81 UP BY…. 4%
Middle East 6% 1% 2% -5% 5 6 6 6 7 7 7 7 DOWN BY… -5%
Indian Sub-Continent 7% 11% 5% 6% 5 5 5 6 6 7 7 8 UP BY…. 6%
Latin America -1% 1% 6% 6% 8 8 8 8 8 8 9 9 UP BY…. 6%
Africa -3% -2% 8% 5% 6 6 7 7 7 7 7 8 UP BY…. 5%
Oceania 5% 4% 5% 5% 3 3 3 3 3 4 4 4 UP BY…. 5%
TOTAL 2% 5% 6% 4% 145 149 157 164 168 176 186 194 UP BY…. 4%
growth % 7% 3% 5% 5% 2% 5% 6% 4%
% Share
Europe 22% 21% 21% 21% 20% 20% 20% 20% DOWN BY… 0.0%
Americas 20% 19% 19% 19% 19% 19% 19% 19% UP BY…. 0.4%
Asia/M.East/Oceania 49% 50% 51% 51% 51% 52% 52% 51% DOWN BY… -0.6%
Africa 4% 4% 4% 4% 4% 4% 4% 4% UP BY…. 0.0%Note: Container import data based on latest available information.
Clarksons Research Aug-19
2018/2017
Page 26
Ckg
. Co
al
Stm
. Co
al
Gra
in
Growth
2018/2017
Growth% Million teu Growth
Million tonnes
Cru
de
Pro
du
cts
LP
G
LN
G
Iro
n O
re
Lice
nsed
to D
imitr
ios
Vou
tsar
as o
f LIS
CR
, LLC
. Dis
trib
utio
n is
res
tric
ted;
ple
ase
rem
embe
r to
ack
now
ledg
e th
e so
urce
. http
://w
ww
.cla
rkso
ns.n
et 1
2921
9 Licensed to Dim
itrios Voutsaras of LIS
CR
, LLC. D
istribution is restricted; please remem
ber to acknowledge the source. http://w
ww
.clarksons.net 129219

Major Seaborne Exports by Country/Region
Bulk Cargo
Exports15 2015 2016 2017 2018e
Australia 1,180 1,224 1,236 1,245 0 3 2 6 836 149 231 19 UP BY…. 1%
Indonesia 390 389 407 437 10 3 0 0 0 1 422 0 UP BY…. 7%
India 61 82 92 80 0 60 0 0 19 0 0 2 DOWN BY… -13%
China 27 42 45 49 0 44 1 0 0 1 2 0 UP BY…. 7%
Total Asia-Pacific 1,877 1,966 2,016 2,036 10 288 4 49 855 151 655 23 UP BY…. 1%
Saudi Arabia 428 452 422 467 367 91 9 0 0 0 0 0 UP BY…. 11%
Iran 73 121 145 117 95 6 2 0 15 0 0 0 DOWN BY… -20%
Iraq 142 165 169 182 174 8 0 0 0 0 0 0 UP BY…. 8%
UAE 246 250 244 247 116 41 13 77 0 0 0 1 UP BY…. 1%
Total Middle East 1,124 1,228 1,212 1,248 920 182 39 92 15 0 0 1 UP BY…. 3%
Brazil 487 491 535 556 55 7 0 0 388 0 0 107 UP BY…. 4%
United States 339 357 432 503 92 155 31 0 0 52 48 125 UP BY…. 16%
Canada 100 102 107 115 0 9 0 0 47 29 1 30 UP BY…. 8%
Venezuela 110 104 90 70 60 7 0 0 2 0 0 0 DOWN BY… -23%
Colombia 128 125 121 111 27 6 0 0 0 0 78 0 DOWN BY… -8%
Argentina 40 53 52 47 3 2 1 0 0 0 0 41 DOWN BY… -10%
Total Americas 1,350 1,380 1,493 1,566 312 194 32 36 469 81 127 314 UP BY…. 5%
EU/Norway 441 462 448 428 104 273 9 7 2 0 0 33 DOWN BY… -5%
FSU 614 645 685 692 264 113 2 67 13 19 118 96 UP BY…. 1%
Total Europe 1,058 1,111 1,136 1,123 368 385 11 74 15 19 118 133 DOWN BY… -1%
Nigeria 125 106 114 117 95 2 1 20 0 0 0 0 UP BY…. 3%
North Africa 112 111 134 138 91 16 9 12 12 0 0 0 UP BY…. 3%
South Africa 144 141 150 145 0 0 0 0 63 0 79 2 DOWN BY… -4%
Total Africa 525 497 537 539 299 22 10 39 75 5 86 2 UP BY…. 0%
TOTAL 6,125 6,350 6,601 6,716 2,016 1,072 98 318 1,476 267 996 473 UP BY…. 2%
growth % 2% 4% 4% 2%
% Share
Europe 17% 17% 17% 17% 18% 36% 11% 23% 1% 7% 12% 28% DOWN BY… 0%
Americas 22% 22% 23% 23% 15% 18% 32% 11% 32% 30% 13% 66% UP BY…. 1%
Asia/M.East/Oceania 49% 50% 49% 49% 46% 44% 44% 45% 59% 57% 66% 5% UP BY…. 0%
Africa 9% 8% 8% 8% 15% 2% 10% 12% 5% 2% 9% 0% DOWN BY… 0%Note: Commodity export data based on latest available information. Grain exports include wheat, coarse grain and soybeans. Global totals equal global import totals;
total of regional products exports may exceed global total due to 'missing barrels' in import data. LPG trade basis customs statistics of liquefied propane and butane.
Container
Exports15 2015 2016 2017 2018e 2011 2012 2013 2014 2015 2016 2017 2018e
North America -3% 3% 2% 0% 15 15 15 15 15 15 16 16 UP BY…. 0%
Europe 4% 4% 6% 3% 26 27 28 30 31 32 34 35 UP BY…. 3%
Far East 2% 5% 6% 5% 80 83 88 93 95 100 106 111 UP BY…. 5%
Middle East 2% 7% 5% 6% 2 2 2 2 2 2 3 3 UP BY…. 6%
Indian Sub-Continent 3% 5% 7% 7% 4 4 4 5 5 5 5 6 UP BY…. 7%
Latin America 4% 6% 5% 5% 6 5 5 6 6 6 7 7 UP BY…. 5%
Africa -2% 1% 8% 6% 3 3 3 3 3 3 3 3 UP BY…. 6%
Oceania 4% 2% 7% -1% 2 2 2 2 2 2 2 2 DOWN BY… -1%
TOTAL 2% 5% 6% 4% 145 149 157 164 168 176 186 194 UP BY…. 4%
growth % 7% 3% 5% 5% 2% 5% 6% 4%
% Share
Europe 18% 18% 18% 18% 18% 18% 18% 18% DOWN BY… -0.2%
Americas 14% 13% 13% 13% 12% 12% 12% 12% DOWN BY… -0.3%
Asia/M.East/Oceania 60% 61% 61% 62% 62% 62% 63% 63% UP BY…. 0.3%
Africa 2% 2% 2% 2% 2% 2% 2% 2% UP BY…. 0.0%Note: Container export data based on latest available information.
Clarksons Research Aug-19
2018/2017
Page 27
Ckg
. Co
al
Stm
. Co
al
Gra
in
Growth
2018/2017
Growth% Million teu Growth
Million tonnes
Cru
de
Pro
du
cts
LP
G
LN
G
Iro
n O
re
Lice
nsed
to D
imitr
ios
Vou
tsar
as o
f LIS
CR
, LLC
. Dis
trib
utio
n is
res
tric
ted;
ple
ase
rem
embe
r to
ack
now
ledg
e th
e so
urce
. http
://w
ww
.cla
rkso
ns.n
et 1
2921
9 Licensed to Dim
itrios Voutsaras of LIS
CR
, LLC. D
istribution is restricted; please remem
ber to acknowledge the source. http://w
ww
.clarksons.net 129219

Seaborne Trade by Commodity
TradeVolumes 2011 2012 2013 2014 2015 2016 2017 2018(e) 2019(f) 2020(f) '19 % '20 % 5 Yr 10 Yr
Oil
Crude Oil 1,844 1,896 1,824 1,787 1,862 1,938 2,004 2,016 2,034 2,098 0.9% 3.2% 2.6% 1.2%
Oil Products 903 900 944 936 1,004 1,046 1,063 1,072 1,099 1,142 2.6% 3.9% 3.3% 3.0%
Total 2,747 2,796 2,768 2,723 2,865 2,985 3,067 3,088 3,132 3,241 1.4% 3.5% 2.8% 1.8%
Gas
LPG 59 61 64 72 80 88 91 98 104 109 5.4% 5.4% 7.6% 6.8%
LNG 247 240 241 246 250 268 292 318 345 371 8.5% 7.6% 7.0% 6.6%
Total 306 300 305 317 329 357 383 416 448 480 7.8% 7.1% 7.2% 6.6%
Chemicals 246 254 264 267 278 283 304 323 336 352 4.1% 4.8% 4.7% 4.5%
Major Dry Bulks
Iron Ore 1,050 1,107 1,188 1,340 1,364 1,418 1,473 1,476 1,454 1,487 -1.5% 2.2% 1.7% 5.0%
Coking Coal 218 225 259 256 245 246 256 267 269 275 0.6% 2.2% 1.0% 3.8%
Steam Coal 781 887 924 961 892 895 946 996 1,002 1,014 0.6% 1.2% 0.8% 4.9%
Grain 315 345 363 407 429 450 476 471 474 486 0.6% 2.5% 3.1% 4.8%
Sub-total 2,364 2,564 2,734 2,964 2,930 3,009 3,151 3,210 3,198 3,261 -0.4% 2.0% 1.5% 4.8%
Minor Dry Bulks
Agribulks 138 149 145 161 162 159 172 168 173 177 2.5% 2.5% 1.4% 3.3%
Sugar 56 57 56 54 56 62 61 57 57 60 0.7% 3.6% 1.2% 1.8%
Fertilisers 140 142 144 158 163 158 167 168 173 177 3.1% 2.6% 1.8% 5.3%
Forest Products 324 319 342 349 348 359 365 378 386 395 2.0% 2.4% 2.0% 3.3%
Steel Products 353 361 356 395 416 408 392 390 393 399 1.0% 1.3% -0.1% 3.0%
Others 699 720 796 741 758 744 787 855 904 950 5.8% 5.0% 4.1% 4.9%
Sub-total 1,710 1,748 1,840 1,859 1,903 1,891 1,944 2,016 2,087 2,157 3.5% 3.4% 2.3% 4.0%
Total Dry Bulk 4,074 4,312 4,574 4,823 4,834 4,899 5,096 5,226 5,285 5,418 1.1% 2.5% 1.8% 4.5%
Containers 1,371 1,418 1,487 1,569 1,605 1,679 1,776 1,852 1,912 1,985 3.3% 3.8% 4.0% 5.6%
Other Dry 714 752 779 810 830 855 888 914 932 951 2.0% 2.0% 2.9% 3.2%
Total Dry 6,160 6,482 6,840 7,202 7,269 7,433 7,761 7,993 8,130 8,354 1.7% 2.8% 2.5% 4.6%
Total 9,459 9,833 10,177 10,509 10,741 11,058 11,514 11,819 12,047 12,427 1.9% 3.2% 2.8% 3.8%
% Growth y-o-y 4.2% 4.0% 3.5% 3.3% 2.2% 2.9% 4.1% 2.6% 1.9% 3.2%
Clarksons Research Page 28 Aug-19
CAGR
Note: Commodity trade data based on latest available information. LPG trade basis customs statistics of liquefied propane and butane. CAGR calculated using 5/10 year period up to and including the current year.
Million Tonnes Growth
Crude Oil17%
Oil Products9%
Gas & Chemicals
6% Major Bulks27%
Minor Bulks17%
Containers16%
Other Dry8%
Seaborne Trade 2019(f), m.tonnes
-6%
-4%
-2%
0%
2%
4%
6%
8%
10%
12%
14%
0
2
4
6
8
10
12
14
16
1992
1994
1996
1998
2000
2002
2004
2006
2008
2010
2012
2014
2016
2018
2020
bn.tonnes % y-o-yGlobal Seaborne Trade
Other DryChemicalsGasContainerDry BulkOil
Year-on-year growth (RHS)
Lice
nsed
to D
imitr
ios
Vou
tsar
as o
f LIS
CR
, LLC
. Dis
trib
utio
n is
res
tric
ted;
ple
ase
rem
embe
r to
ack
now
ledg
e th
e so
urce
. http
://w
ww
.cla
rkso
ns.n
et 1
2921
9 Licensed to Dim
itrios Voutsaras of LIS
CR
, LLC. D
istribution is restricted; please remem
ber to acknowledge the source. http://w
ww
.clarksons.net 129219

World Fleet by Year of Build
Cellular Other Gas Other Non-Cargo TotalDry Cargo Carriers Specialised Vessels Fleet
No. ,000 GT No. ,000 GT No. ,000 GT No. ,000 GT No. ,000 GT No. ,000 GT No. ,000 GT No. ,000 GT<1990 2,571 4,139 216 4,408 122 1,382 7,709 12,984 193 2,601 1,393 2,402 14,969 26,459 27,173 54,3751990 100 276 35 1,012 19 362 389 831 33 502 146 512 507 1,837 1,229 5,3311991 116 445 29 990 33 397 411 986 29 383 147 538 491 1,861 1,256 5,5991992 154 434 27 1,356 18 296 370 752 28 469 159 692 545 1,942 1,301 5,9411993 218 834 34 2,210 44 756 378 658 28 715 150 796 546 2,326 1,398 8,2951994 179 875 84 3,636 56 650 431 871 22 859 109 803 538 965 1,419 8,6581995 142 830 160 5,254 85 1,242 440 937 43 724 79 817 560 1,854 1,509 11,6571996 148 3,113 148 3,789 113 1,921 408 1,056 55 1,027 115 755 577 2,007 1,564 13,6691997 100 2,466 192 5,200 156 2,748 342 1,085 36 895 122 1,191 674 2,166 1,622 15,7511998 122 3,231 146 3,928 166 3,242 292 1,476 41 556 145 1,939 646 2,377 1,558 16,7491999 145 5,169 162 4,861 105 2,572 249 1,408 35 806 148 2,532 687 3,425 1,531 20,7732000 166 8,482 151 5,368 131 4,357 299 1,692 47 1,788 138 2,441 579 2,929 1,511 27,0562001 159 6,966 285 9,862 155 5,621 245 1,009 33 533 83 809 604 2,998 1,564 27,7982002 225 11,886 209 7,228 176 6,007 267 1,106 33 1,334 113 1,218 738 3,546 1,761 32,3252003 336 15,729 169 6,615 160 5,512 285 1,466 45 1,960 141 1,651 687 2,871 1,823 35,8042004 347 14,790 263 10,544 169 6,478 430 1,511 41 2,211 149 2,347 749 2,680 2,148 40,5612005 359 15,862 328 12,639 266 10,033 496 1,544 34 2,087 189 3,043 863 2,528 2,535 47,7352006 419 13,362 340 13,823 371 14,460 522 2,051 69 3,460 239 3,618 1,030 2,550 2,990 53,3232007 441 16,182 356 13,921 407 14,559 583 2,127 94 4,159 282 4,300 1,079 3,255 3,242 58,5022008 479 18,392 423 14,450 433 16,128 700 2,505 137 7,829 401 6,316 1,342 3,878 3,915 69,4992009 536 24,359 691 25,007 277 11,616 688 2,872 101 5,786 379 5,872 1,611 3,867 4,283 79,3782010 469 21,939 1,070 44,985 262 14,774 619 3,543 89 3,781 302 5,052 1,534 4,781 4,345 98,8562011 448 21,326 1,260 55,415 199 13,421 593 3,688 72 1,722 245 4,638 1,558 4,198 4,375 104,4072012 478 17,489 1,254 55,480 216 13,735 480 3,210 48 539 164 2,814 1,692 4,136 4,332 97,4012013 410 11,847 812 35,208 209 14,710 392 2,402 66 2,600 107 1,724 1,511 3,404 3,507 71,8962014 301 9,037 617 26,801 207 16,399 250 1,614 86 4,329 120 1,932 1,513 4,596 3,094 64,7092015 289 9,798 657 27,394 211 17,269 200 1,572 115 5,336 127 2,680 1,183 3,966 2,782 68,0152016 331 17,037 566 25,954 132 9,481 172 1,219 126 6,457 153 2,815 880 3,895 2,360 66,8582017 352 19,884 460 21,216 154 12,044 145 1,201 107 5,207 138 2,917 757 3,494 2,113 65,9642018 307 14,524 298 15,505 175 13,615 127 884 96 7,302 164 2,494 741 3,723 1,908 58,0472019 206 13,755 236 11,947 91 6,665 72 688 50 3,963 81 941 323 1,581 1,059 39,539
TOTAL 11,053 324,458 11,678 476,006 5,318 242,452 18,984 60,948 2,032 81,920 6,428 72,599 41,714 116,095 97,207 1,374,471
Clarksons Research
Year Built
Tankers Bulkers8 Containers
Page 29 Aug-19
0
5
10
15
20
25
30
<19
90
1991
1993
1995
1997
1999
2001
2003
2005
2007
2009
2011
2013
2015
2017
2019
m GTTanker Age Profile
2.2% of fleet over 25 years
old
0
10
20
30
40
50
60
<19
90
1991
1993
1995
1997
1999
2001
2003
2005
2007
2009
2011
2013
2015
2017
2019
m GTBulkcarrier Age Profile
2.9% of fleet over 25 years
old
0
5
10
15
20
<19
90
1991
1993
1995
1997
1999
2001
2003
2005
2007
2009
2011
2013
2015
2017
2019
m GTContainership Age Profile
1.6% of fleet over 25 years old
0
2
4
6
8
10
<19
90
1991
1993
1995
1997
1999
2001
2003
2005
2007
2009
2011
2013
2015
2017
2019
m GTGas Carrier Age Profile
6.7% of fleet over 25 years
old
Lice
nsed
to D
imitr
ios
Vou
tsar
as o
f LIS
CR
, LLC
. Dis
trib
utio
n is
res
tric
ted;
ple
ase
rem
embe
r to
ack
now
ledg
e th
e so
urce
. http
://w
ww
.cla
rkso
ns.n
et 1
2921
9 Licensed to Dim
itrios Voutsaras of LIS
CR
, LLC. D
istribution is restricted; please remem
ber to acknowledge the source. http://w
ww
.clarksons.net 129219

Orderbook & Delivery Schedule
No. Age1 $bn6 2015 2016 2017 No. m. GT No. m. GT % Fleet 2019 2020 2021 2022+
BULK CARGO:Oil Tankers 11,053 18.9 157.4 279.4 295.7 309.5 11,053 324.5 446 26.2 8% 6.6 13.4 5.9 0.3
VLCC 779 9.3 42.5 104.0 111.6 117.5 779 124.6 78 11.8 10% 3.5 6.1 2.3 0.0Suezmax 586 9.6 23.0 40.1 42.2 45.9 586 48.3 51 4.0 8% 0.6 2.4 1.1 0.0Aframax 1,035 10.2 29.3 54.9 57.9 59.8 1,035 62.6 77 4.8 8% 0.9 1.7 2.0 0.2
Panamax 458 10.9 8.7 17.4 18.1 18.7 458 19.2 21 0.9 5% 0.2 0.6 0.1 0.0Handy 2,301 11.5 40.0 53.0 55.6 57.2 2,301 59.0 177 4.6 8% 1.3 2.6 0.5 0.1
Small <10k 5,894 26.2 14.0 10.0 10.2 10.4 5,894 10.7 42 0.1 1% 0.1 0.0 0.0 0.0Bulk Carriers 11,670 9.9 189.5 431.0 440.4 453.4 11,670 475.4 925 50.6 11% 13.2 26.2 10.0 1.2
Capesize 1,740 8.5 51.8 160.1 163.2 167.7 1,740 176.0 222 25.7 15% 6.6 12.7 5.6 0.8Panamax 2,649 9.7 45.2 105.2 105.7 108.6 2,649 115.0 274 11.8 10% 2.5 6.9 2.3 0.2
Handymax 3,684 9.4 55.4 105.6 110.6 114.9 3,684 119.8 281 10.1 8% 3.0 5.0 1.8 0.2Handysize 3,597 11.3 37.1 60.1 61.0 62.1 3,597 64.6 148 3.1 5% 1.1 1.7 0.3 0.0
Combined Carriers 8 17.7 0.2 1.6 1.1 0.8 8 0.6 6 0.3 56% 0.1 0.2 0.1 0.0
GENERAL CARGO:Containerships 5,318 12.5 109.3 215.6 217.5 225.0 5,318 242.5 387 23.0 9% 4.4 11.4 6.5 0.6
12,000&+ TEU 394 4.5 39.2 37.3 42.1 49.6 394 64.1 87 14.4 22% 3.2 6.9 3.7 0.58-11,999 TEU 623 8.2 31.1 53.8 57.2 60.1 623 62.4 29 3.0 5% 0.0 1.2 1.8 0.0
3-7,999 TEU 1,354 12.2 19.0 81.1 75.5 72.7 1,354 72.1 8 0.3 0% 0.0 0.3 0.0 0.0100-2,999 TEU 2,947 14.6 20.0 43.4 42.6 42.7 2,947 43.8 263 5.3 12% 1.2 3.0 1.0 0.1
MPP 3,164 17.3 14.3 21.9 21.9 21.6 3,164 21.6 62 0.5 2% 0.2 0.2 0.1 0.0Ro-Ro 848 23.0 11.0 11.8 11.9 12.2 848 12.7 38 1.3 11% 0.2 0.5 0.5 0.0Other Dry Cargo 14,972 29.0 16.4 26.7 26.7 26.6 14,972 26.6 154 0.6 2% 0.3 0.3 0.0 0.0
SPECIALISED:Chemical Tankers 3,828 15.0 34.7 25.3 26.6 27.7 3,828 29.4 184 2.0 7% 0.6 0.9 0.3 0.1Specialised Tankers 406 34.2 0.5 0.6 0.7 0.7 406 0.7 0 0.0 0% 0.0 0.0 0.0 0.0LPG Carriers 1,454 15.1 29.7 16.8 19.5 21.2 1,454 22.1 75 2.1 9% 0.4 1.3 0.4 0.0LNG Carriers 578 10.3 63.9 44.7 48.1 51.1 578 59.8 135 12.9 22% 1.7 4.5 5.4 1.3Vehicle Carriers 780 12.6 21.9 37.1 37.0 37.8 780 38.1 22 1.1 3% 0.5 0.4 0.3 0.0Reefers 1,414 30.4 2.3 4.8 4.7 4.6 1,414 4.4 11 0.1 2% 0.0 0.0 0.1 0.0
NON-CARGOOffshore 9,086 18.2 175.6 55.2 57.0 58.2 9,086 59.7 371 5.0 8% 1.2 2.2 1.1 0.5Dredgers 2,037 30.5 7.6 4.6 4.6 4.7 2,037 4.7 70 0.3 7% 0.1 0.2 0.0 0.0Tugs 19,714 23.6 23.9 5.1 5.3 5.4 19,714 5.5 622 0.2 4% 0.2 0.1 0.0 0.0Cruise 447 22.0 82.6 19.0 20.1 21.2 447 23.2 112 9.7 42% 0.9 1.8 1.7 5.3Ferries 7,871 28.3 39.5 19.6 19.8 20.0 7,871 20.5 279 2.0 10% 0.5 0.6 0.6 0.3Other Non-Cargo 2,559 32.2 0.9 2.3 2.4 2.4 2,559 2.4 88 0.3 10% 0.1 0.1 0.1 0.0TOTAL 97,207 21.2 981.3 1,223.0 1,260.8 1,303.9 97,207 1,374.5 3,987 138.3 10% 31.1 64.2 33.1 9.8
Clarksons Research
22.520.42.4
1,343.0
Page 30 Aug-19
4.4
59.74.75.5
28.90.7
21.556.938.2
72.443.721.612.426.7
0.6
237.258.962.2
10.7466.4173.5111.5117.863.7
312.4118.646.660.118.857.6
World Fleet by Ship Type
World01-Aug-19 Fleet m. GT, end: 01-Aug-19
2018
Tankers26%
Gas6%
Bulkers35%
Containers18%
Non-cargo8%
Others7%
World Fleet By Vessel Type(by % of GT)
Tankers19%
Gas11% Bulkers
37%
Containers16%
Non-cargo13%
Other4%
Orderbook By Vessel Type(by % of GT)
Lice
nsed
to D
imitr
ios
Vou
tsar
as o
f LIS
CR
, LLC
. Dis
trib
utio
n is
res
tric
ted;
ple
ase
rem
embe
r to
ack
now
ledg
e th
e so
urce
. http
://w
ww
.cla
rkso
ns.n
et 1
2921
9 Licensed to Dim
itrios Voutsaras of LIS
CR
, LLC. D
istribution is restricted; please remem
ber to acknowledge the source. http://w
ww
.clarksons.net 129219

Orderbook & Delivery Schedule
No. Age1 $bn 2016 2017 2018 2019 No. m. GT No. m. GT % Fleet 2019 2020 2021 2022+
Ownership EU-Europe 2,648 13.8 61.1 108.4 113.0 119.7 124.3 2,648 127.7 118 8.2 6% 1.6 4.0 2.6 0.0Other Europe 1,113 20.7 15.8 25.7 27.9 29.9 30.3 1,113 30.7 42 3.4 11% 0.8 1.7 0.6 0.3
North America 370 14.0 10.3 22.9 25.0 25.6 21.7 370 22.3 12 1.0 5% 0.3 0.7 0.1 0.0Other Americas 303 30.4 2.5 4.3 4.3 4.9 5.0 303 5.2 3 0.1 3% 0.0 0.1 0.0 0.0
Africa/Mid-East/S.Asia 1,148 22.7 13.9 34.7 36.7 37.1 37.0 1,148 38.7 25 0.9 2% 0.0 0.7 0.2 0.0Asia/Pacific 5,069 18.7 53.3 82.3 87.9 91.7 93.5 5,069 98.9 197 10.7 11% 3.5 5.1 2.1 0.0
TOTAL 11,053 18.9 157.4 279.4 295.7 309.5 312.4 11,053 324.5 446 26.2 8% 6.6 13.4 5.9 0.3
Orderbook & Delivery Schedule
No. Age1 $bn 2016 2017 2018 2019 No. m. GT No. m. GT % Fleet 2019 2020 2021 2022+
Ownership EU-Europe 3,494 9.5 56.9 132.0 137.9 143.0 145.1 3,494 146.5 131 5.8 4% 2.2 3.3 0.3 0.0Other Europe 887 11.2 13.3 27.9 28.7 31.3 31.8 887 31.9 44 3.1 10% 1.5 1.4 0.2 0.0
North America 495 10.7 8.5 19.5 19.7 21.4 21.5 495 22.1 31 2.3 10% 0.3 1.5 0.5 0.0Other Americas 89 13.1 1.1 4.9 4.0 2.8 2.8 89 2.6 1 0.0 1% 0.0 0.0 0.0 0.0
Africa/Mid-East/S.Asia 498 14.4 5.8 13.3 14.0 14.9 15.9 498 16.5 17 0.5 3% 0.2 0.4 0.0 0.0Asia/Pacific 6,201 9.5 104.1 234.8 237.1 240.8 249.9 6,201 256.0 654 37.2 15% 8.4 19.0 8.6 1.2
TOTAL 11,678 9.9 189.7 432.5 441.5 454.2 467.0 11,678 476.0 931 51.0 11% 13.3 26.4 10.1 1.2
Orderbook & Delivery Schedule
No. Age1 $bn 2016 2017 2018 2019 No. m. GT No. m. GT % Fleet 2019 2020 2021 2022+
Ownership EU-Europe 5,450 17.6 69.7 144.1 143.1 146.0 146.7 5,450 148.2 163 8.0 5% 2.3 4.1 1.7 0.0Other Europe 2,916 30.6 8.8 14.4 14.9 15.8 17.4 2,916 17.2 50 0.4 2% 0.2 0.3 0.0 0.0
North America 529 29.7 7.8 13.5 14.1 14.5 15.5 529 15.5 17 0.3 2% 0.1 0.2 0.1 0.0Other Americas 551 43.9 0.4 1.0 0.9 1.0 1.0 551 1.0 1 0.0 0% 0.0 0.0 0.0 0.0
Africa/Mid-East/S.Asia 1,943 26.2 2.7 10.6 11.9 7.1 7.1 1,943 7.1 24 0.1 1% 0.1 0.0 0.0 0.0Asia/Pacific 11,813 21.4 60.3 91.1 91.1 98.9 108.1 11,813 112.2 337 16.0 14% 2.4 7.8 5.2 0.6
TOTAL 24,302 23.6 151.0 276.0 277.9 285.4 297.9 24,302 303.4 641 25.4 8% 5.2 12.4 7.2 0.7
Orderbook & Delivery Schedule
No. Age1 $bn 2016 2017 2018 2019 No. m. GT No. m. GT % Fleet 2019 2020 2021 2022+
Ownership EU-Europe 1,590 14.3 37.1 27.0 29.1 30.3 31.8 1,590 32.6 106 7.7 24% 0.7 3.2 3.3 0.4Other Europe 1,385 18.9 24.2 22.8 23.0 25.2 26.1 1,385 26.4 53 2.4 9% 0.6 1.2 0.4 0.1
North America 259 13.5 11.1 6.5 6.9 7.2 8.3 259 8.8 2 0.1 2% 0.1 0.0 0.0 0.0Other Americas 158 25.8 1.3 0.9 1.0 1.1 1.1 158 1.2 0 0.0 0% 0.0 0.0 0.0 0.0
Africa/Mid-East/S.Asia 474 21.9 11.8 12.8 13.3 13.6 13.4 474 13.2 13 0.3 2% 0.1 0.2 0.0 0.0Asia/Pacific 4,397 17.7 67.1 59.2 63.1 65.5 69.7 4,397 71.9 213 6.2 9% 1.5 2.4 2.2 0.2
TOTAL 8,460 18.0 152.9 129.3 136.5 143.0 150.6 8,460 154.5 427 18.2 12% 3.2 7.1 6.4 1.5
Orderbook & Delivery Schedule
No. Age1 $bn 2016 2017 2018 2019 No. m. GT No. m. GT % Fleet 2019 2020 2021 2022+
Ownership EU-Europe 7,332 27.4 87.7 29.7 29.1 29.8 30.6 7,332 31.4 263 5.7 18% 0.7 1.3 1.4 2.3Other Europe 3,572 27.3 33.8 10.2 11.0 11.2 11.1 3,572 11.1 198 0.9 8% 0.2 0.3 0.2 0.1
North America 4,655 29.7 100.2 27.0 28.0 28.5 29.7 4,655 29.7 163 6.6 22% 0.8 1.3 1.2 3.3Other Americas 2,576 27.1 19.3 5.1 5.3 5.4 6.5 2,576 6.6 48 0.7 10% 0.2 0.3 0.2 0.0
Africa/Mid-East/S.Asia 5,254 24.1 15.5 6.3 6.4 6.6 6.8 5,254 7.1 140 0.4 6% 0.1 0.2 0.0 0.1Asia/Pacific 16,493 18.6 72.3 26.1 28.1 29.2 29.5 16,493 29.4 501 3.1 11% 0.7 1.4 0.6 0.4
TOTAL 41,714 24.1 330.2 105.8 109.2 111.8 115.1 41,714 116.1 1,542 17.5 15% 2.9 4.8 3.5 6.2
Orderbook & Delivery Schedule
No. Age1 $bn 2016 2017 2018 2019 No. m. GT No. m. GT % Fleet 2019 2020 2021 2022+
Ownership EU-Europe 20,514 19.0 312.4 441.2 452.2 468.8 478.4 20,514 486.4 781 35.4 7% 7.6 15.9 9.2 2.7Other Europe 9,873 24.9 95.9 101.0 105.6 113.4 116.7 9,873 117.2 387 10.2 9% 3.2 4.9 1.5 0.6
North America 6,308 26.7 137.9 89.3 93.7 97.2 96.7 6,308 98.4 225 10.4 11% 1.6 3.7 1.8 3.3Other Americas 3,677 29.5 24.7 16.1 15.6 15.1 16.4 3,677 16.6 53 0.9 5% 0.3 0.4 0.2 0.0
Africa/Mid-East/S.Asia 9,317 23.8 49.7 77.5 82.3 79.2 80.3 9,317 82.6 219 2.2 3% 0.5 1.5 0.2 0.1Asia/Pacific 43,973 18.0 357.1 493.6 507.3 526.1 550.6 43,973 568.4 1,902 73.2 13% 16.5 35.6 18.7 2.4
TOTAL 97,207 21.2 981.3 1223.0 1260.8 1303.9 1343.0 97,207 1,374.5 3,987 138.3 10% 31.1 64.2 33.1 9.8% Growth y-o-y 3.8% 3.1% 3.4% 3.0%
Clarksons Research Page 31 Aug-19
Non-Cargo01-Aug-19 Fleet m. GT, end: 01-Aug-19
World Fleet01-Aug-19 Fleet m. GT, end: 01-Aug-19
Gen. Cargo01-Aug-19 Fleet m. GT, end: 01-Aug-19
Specialised01-Aug-19 Fleet m. GT, end: 01-Aug-19
World Fleet by Ship Type & Owner
Oil Tankers01-Aug-19 Fleet m. GT, end: 01-Aug-19
Bulkers801-Aug-19 Fleet m. GT, end: 01-Aug-19
Lice
nsed
to D
imitr
ios
Vou
tsar
as o
f LIS
CR
, LLC
. Dis
trib
utio
n is
res
tric
ted;
ple
ase
rem
embe
r to
ack
now
ledg
e th
e so
urce
. http
://w
ww
.cla
rkso
ns.n
et 1
2921
9 Licensed to Dim
itrios Voutsaras of LIS
CR
, LLC. D
istribution is restricted; please remem
ber to acknowledge the source. http://w
ww
.clarksons.net 129219

Fleet Analysis
The ratio between the size of the orderbook and fleet is typically used as a useful indicator of future changes to global fleet supply. However, there are also many interesting trends by individual owner country, and this month’s Fleet Analysis investigates what these are and how they stack up on a national and regional level.
World Fleet Monitor, August 2019 Published by: Clarkson Research Services Limited Commodity Quay, St Katharine Docks London E1W 1BF, England. Tel: + (44) (0) 20 7334 0000 E-mail: [email protected] On-line Shop: http://www.crsl.com Website: http://www.clarksons.com/research Shipping Intelligence Network: https://sin.clarksons.net World Fleet Register: http://www.clarksons.net/wfr World Fleet Monitor is published 12 times a year. It is available on subscription at a price of £925/£940 per year (within Europe/outside Europe), including postage.
Editorial Board: Managing Director Stephen Gordon Research Director Trevor Crowe Editor Ivan Rumynin Publisher Rob Benson Senior Compilers P. English/A. Hughes/K. Cook Fleet Data Karen McBride/H. Vernall/ J. Ballard/N. Abbott/ Yue Cheng/Yunqi Ma Data Processing D. Whicker/W. Lowes/ D. Higgins Analysts A.Springer/G. Warner/C. Miles/ A. Parker/D. Whittaker/ G. Paterson/J. McMorran Research Services H. Abbas/J. Milne
Ahead Of The Average Overall, the global orderbook to fleet ratio (in GT) stood at 10% at start August 2019, the lowest for over 20 years, with wide variation by owner country. Of the top 10 owner nationalities (ranked by total fleet GT at start August), Korean owners had the largest orderbook to fleet ratio, 24%, with a particularly firm ratio of 62% in the containership sector, support-ed by HMM ordering 20 ‘megaship’ units in 2018. Despite this, Korean owners accounted for only the fourth largest share of the total orderbook (9%). Mean-while, Japanese owners had the second largest ratio (17%), as well as accounting for the largest share of the orderbook (21%). US owners had a ratio of 14%, the third largest of the top 10, with firm cruise contracting by US owners in recent years supporting a ratio of 35% in this sector. Finally, while Chinese owners accounted for the second largest share of the total orderbook (15%), their orderbook to fleet ratio was only slightly ahead of the global average at 11%. Surveying The Smaller Shares German owners had the smallest order-book to fleet ratio of the top 10 owner nations, 3.6% at the start of August 2019, down from a peak of almost 60% in 2008. In particular, the German-owned order-book to fleet ratio was less than 1% in the containership sector, down from almost 70% in 2005. Meanwhile, despite Greek owners having the largest fleet and third largest orderbook of any owner nation, their orderbook to fleet ratio was just 6.9% at start August, possibly reflecting a balanced approach to growing their fleet through secondhand activity too. Sup-
ported by firm LNG carrier newbuild con-tracting in recent years, Greek owners had a ratio of 68% in this sector, although in the bulkcarrier sector the ratio was just 3%, down from 56% in 2008. Regional Ramifications Looking at the orderbook to fleet ratio at a regional level, European owners had a ratio of 8% in GT terms at start August 2019, below the global average, whilst the ratio for Asia/Pacific owners was larg-er at 13%. Meanwhile, European owners accounted for 33% of the start August orderbook in GT terms, whilst Asia/Pacific owners accounted for 53%. Alt-
hough for the time being the European owned fleet remains larger (604m GT compared to 568m GT), these statistics potentially indicate that the gap between the two could close further in the future. So, there are a number of noteworthy trends in the orderbook to fleet ratio at an owner country level. Korean owners have the largest ratio of the top 10 owner na-tions, while German owners have the smallest. Regionally, Asia/Pacific owners have a larger ratio than European own-ers, as well as the larger absolute order-book. It will be particularly interesting to see how this is reflected in the changes to the global fleet that now follow.
Graph of The Month Orderbooks And Fleets: Ranking The Ratios
Source : Clarksons Research
The bars on the graph show in GT terms the total orderbook as a percentage of fleet for each of the top 10 owner nationalities (ranked by total fleet GT at start August 2019). The final three bars also show the same ratio for all European, Asia/Pacific and global owners. The diamonds show the orderbook of the top 10 owner nationalities as a percentage of the global orderbook, in GT terms. A wide range of ownership data is available on the World Fleet Register.
The Orderbook And The Fleet: Reviewing The Ratio
The material and the information contained herein are provided for general information purposes, and may not be reproduced without the written permission of Clarksons Research. To the maximum extent permitted by law, Clark-sons Research shall not be liable to the recipient or any third party for any loss, liability or damage, cost or expense including without limitation, direct, indirect, consequential loss or damage, any loss of profit, loss of use, loss of or interruption in business, loss of goodwill, loss of data aris-ing out of, or in connection with, the use of and the reliance on the information whether in contract, tort, negligence, bailment, breach of statutory duty or otherwise, even if foreseeable. This disclaimer shall be governed by and construed in accordance with English law.
The author of this feature article is Ivan Rumynin. Any views or opinions presented are solely those of the author and do not necessarily repre-sent those of the Clarksons group.
0%
5%
10%
15%
20%
25%
Gre
ece
Chi
na
Japa
n
Ger
man
y
US
Nor
way
Sou
th K
orea
Sin
gapo
re
Italy
Den
mar
k
Eur
ope
Asi
a/P
acifi
c
WO
RLD
OB as % of global OB
Lice
nsed
to D
imitr
ios
Vou
tsar
as o
f LIS
CR
, LLC
. Dis
trib
utio
n is
res
tric
ted;
ple
ase
rem
embe
r to
ack
now
ledg
e th
e so
urce
. http
://w
ww
.cla
rkso
ns.n
et 1
2921
9 Licensed to Dim
itrios Voutsaras of LIS
CR
, LLC. D
istribution is restricted; please remem
ber to acknowledge the source. http://w
ww
.clarksons.net 129219