world bank document world bank for omcial use only repw no. p-4062-in report and recommendation of...
TRANSCRIPT

Documont of
The World Bank
FOR OMCIAL USE ONLY
Repw No. P-4062-IN
REPORT AND RECOMMENDATION
OF THE
PRESIDENT OF THE
INTERNATIONAL BANK FOR RECONSTRUCTION AND DEVELOPMENT
TO THE
EXECUTIVE DIRECTORS
ON A
PROPOSED LOAN
IN AN AMOUNT EQUIVALENT TO US$250 MILLION
TO INDIA
FOR THE
RIHAND POWER TRANSMISSION PROJECT
May 7, 1985
This doaeM hs a restrickd distinlhuim md *ay be used by reipiens mly in dte perfornmanc ofdhir officd dutes s lbcotnts any no othrwise be disosed witbout Wodd Bank authoioatibm.
Pub
lic D
iscl
osur
e A
utho
rized
Pub
lic D
iscl
osur
e A
utho
rized
Pub
lic D
iscl
osur
e A
utho
rized
Pub
lic D
iscl
osur
e A
utho
rized
Pub
lic D
iscl
osur
e A
utho
rized
Pub
lic D
iscl
osur
e A
utho
rized
Pub
lic D
iscl
osur
e A
utho
rized
Pub
lic D
iscl
osur
e A
utho
rized

CURRENCY EOUIVALENTS(As of April 29, 1985)
US41.00 - Rs12.454Rs 1.00 - US40.0803Rs 1 million - US$80,300
.
The US Dollar/Rupee exchange rate is subject to change.Conversions in the Staff Appraisal Report were, exceptas othervise noted, made at the rate of US$1 to Rs 12.0.
FISCAL YEAR
April 1 - March 31
Abbreviaticns and Acronyms
AC - Alternating CurrentCE& - Central Electricity AuthorityDC - Direct CurrentGOI - Government of IndiaGWh - Gigawatt-hourHQI - Hydro Quebec InternationalHVDC - High-voltage direct currentICB - International Competitive BiddingLCB - Local Competitive BiddingLREC - Long-Run Marginal CostMW - MegawattNEPC - National Hydroelectric Power Corporation LimitedNPP - National Power PlanNTPC - National Thermal Power Corporation LimitedREB - Regional Electricity BoardREC - Rural Electrification CorporationSEB - State Electricity BoardTOE - Tons of oil equivalent

FOR OMCIAL USE ONLY
INDIA
RIHAND POWER TRANSMISSION PROJECT
QAN AND PROJECT SUMMARY
Borrover: India, acting by its President.
Beneficiarv: National Thermal Power Corporation (NTPC)
Amount: USS250 million.
Terms: Repayment over 20 years, including five years' grace,at the applicable rate of interest.
Onlendint Terms: From the Government of India (GOI) to NTPC, withrepayment over 20 years, including five years' grace,at an interest rate of not less than 12.5Z per annum.
GOI will bear the foreign exchange and interest raterisks.
Project Description: The project's main objective is to help meet thedemand for electricity in the Northern Region ofIndia by providing transmission linkage betweenthe thermal power plants at Singrauli-Rihand inthe State of Uttar Pradesh and the main loadcenters in the Northern Region, and to ensure theevacuation of power from these plants at leastcost to the economy. The project comprises theinstallation of about 910 km of 500-kV directcurrent (DC) power transmission line betweenRihand and Delhi, and the associated convertingstations, together with about 1,450 km of 400-kValternating current (AC) line connectingSingrauli-Rihand with the main load centers atKanpur, Delhi, Panipat, and Jaipur and relatedsubstations in the Northern Region. The projectwill introduce long-distance, high-voltage, directcurrent (HVDC) power transmission technology inIndia. There are no risks other than those
* normally associated with this type of project.NTPC will be assisted by consultants for theimplementation of the DC component. NTPC hasexperience vith transmission line installation sorisk of slippage will be minimal. Most of themajor equipment components, with the exception ofthe converting stations, are manufactured inIndia, and there is adequate understanding of, andexperience with, their installation.
Ibis document has a restricted distribution and may be used by recipients only in the performanceof their official duties. Its contents may not otherwise be disclosed without World Bank authorization.
-ii-
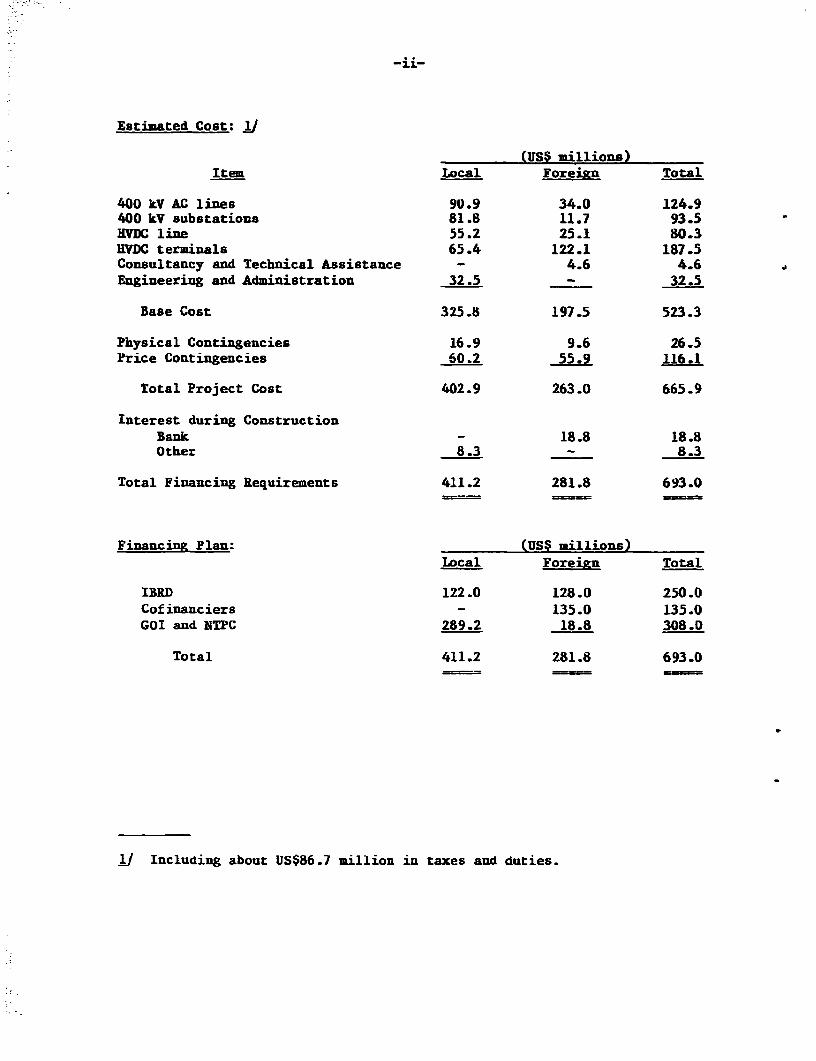
Estimated Cost: Jj
(USS millions)Item Local Foreizn Total
400 kV AC lines 90.9 34.0 124.9400 kV substations 81.8 11.7 93.5HVDC line 55.2 25.1 80.3HVDC terminals 65.4 122.1 187.5Consultancy and Technical Assistance - 4.6 4.6Engineering and Administration 32.5 - 32.5
Base Cost 325.8 197.5 523.3
Physical Contingencies 16.9 9.6 26.5Price Contingencies 60.2 55.9 116.1
Total Project Cost 402.9 263.0 665.9
Interest during ConstructionBank - 18.8 18.8Other 8.3 - 8.3
Total Financing Requirements 411.2 281.8 693.0
Financing Plan: (USS millions)Local Foreian Total
I-RD 122.0 128.0 250.0Cofinanciers - 135.0 135.0GOI and MTPC 289.2 18.8 308.0
Total 411.2 281.8 693.0
O/ Including about US$86.7 million in taxes and duties.
-iii-
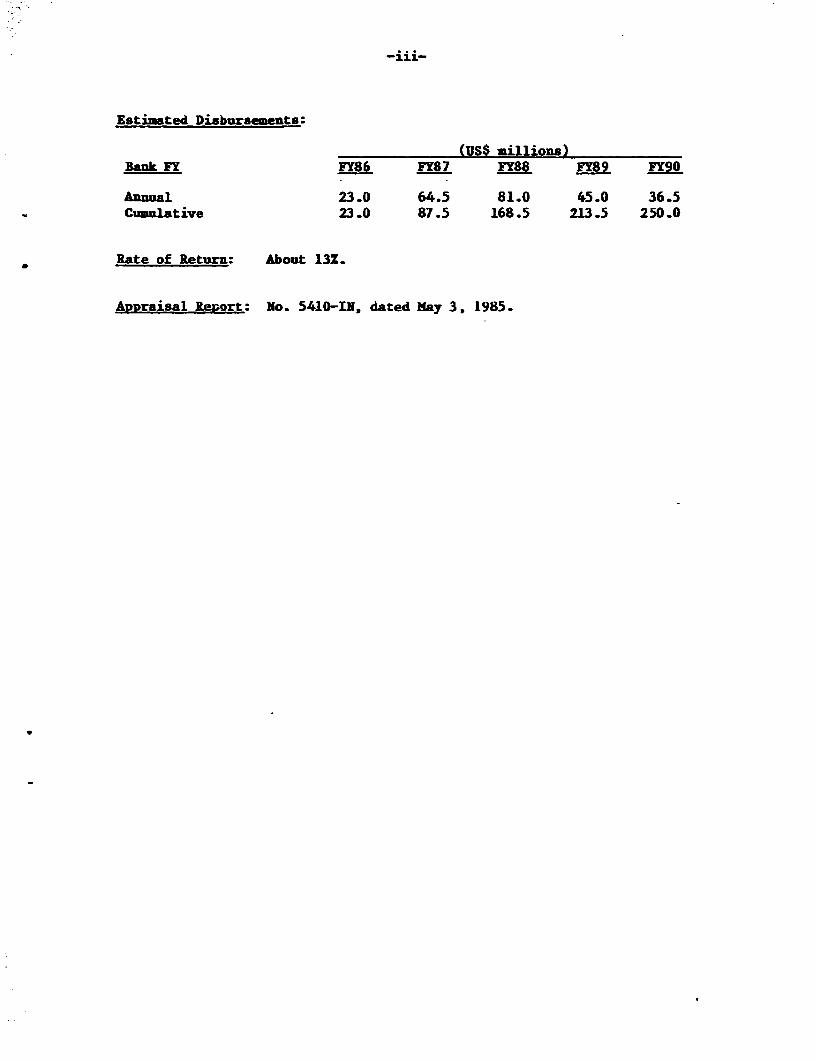
Estimated Disbursements:
(US$ millions)Bank FY FY86 FY87 FY88 FY89 FY90
Annual 23.0 64.5 81.0 45.0 36.5Cumulative 23.0 87.5 168.5 213.5 250.0
Rate of Return: About 13Z..
Appraisal Re,ssrt: No. 5410-lN, dated May 3. 1985.
.
INTERNATIONAL BANK FOR RECONSTRUCTION AND DEVELOPMENT
REPORT AND RECOMMENDATION OF THE PRESIDENTTO THE EXECUTIVE DIRECTORS ON A PROPOSED
LOAN TO INDIA FOR THE RIHAND POWER TRANSMISSION PROJECT
1. I submit the following report and recommendation on a proposed loanto India, for US$250 million to help finance the Rihand Power TransmissionProject, designed primarily to assist in meeting the electricity demand in theNorthern Region of India by providing power transmission linkage between thethermal power plants at the Singrauli-Rihand complex and the main load centersin the Northern Region. The proceeds of the loan will be onlent by theGovernment to the National Thermal Power Corporation for twenty years, includ-ing five years' grace, at an interest rate of not less than 12.5% per annum.Additional financing for the project, in an amount equivalent to about US$135million, may be provided from official bilateral assistance, export credits, orsuppliers' credits to cover the foreign exchange cost of the high-voltageterminal equipment. The foreign exchange and interest rate risks will be borneby the Covernment of India.
PART I - THE ECONOMY 1/
2. An economic report, "Structural Change and Development Perspectives"(5593-IN, dated April 24, 1985), was distributed to the Executive Directorson May 1, 1985. Country data sheets are attached as Annex I.
Background
3. India is a large and diverse country with a population of about 750 mil-lion (in mid-1984) and an annual per capita income of US$260. The economy isdominated by agriculture which employs more than two-thirds of the labor force.However, the land base is not sufficient to provide an adequate livelihood toeveryone engaged in agricultural activities, especially those who own little orno land. Growth of value-added in agriculture -- 2.2Z since 1950/51 - hasbeen slower than growth of industrial value-added (5.3% per annum). As aresult, there has been a gradual decline in the share of agriculture in GDP (atfactor cost) from 52% in 1950/51 to about 33% in 1981/82, while the share ofindustry rose from 20% to around 26Z. But industrialization has not been rapidenough to absorb the growing labor force, or to bring about a rapid economictransformation, with significantly higher productivity and income levels. As aresult economic growth has been slow over the past three decades, averagingabout 3.6Z per annum since 1950/51.
4. Nevertheless, there has been steady progress, with per capita incomerising by about 1.4% per year in the period 1950 to 1980. Despite the largepopulation base and its relatively rapid growth, India has been able toeliminate persistent dependence on foodgrain imporcs through significant
1/ Parts I and II of the report are similar to Parts I and II of thePresident's Report for the Chandrapur Thermal Power Project (No.P-4041-1N),dated April 24, 1985.

-2-
improvements in agricultural production. Savings and investment have increasedmarkedly since 1950/51: the gross national savings rate more than doubled from10.82 of GDP (at factor cost) to 22.72 in 1983/84, while the gross domesticinvestment rate rose from 12.52 of GDP to 24.82 in 1983/84. Foreign savings(balance of payments deficit on current account) have never financed a majorportion of domestic investment: a peak of about 20% was reached during theearly 1960s. Currently, foreign savings account for about 8% of investment.External assistance has been low both as a percentage of GDP and in per capitaterms, never rising above 3% of GDP and averaging below 1% for the past fiveyears. Net use of foreign savings has never risen above 3Z of GDP, andpresently stands at 2.1%.
5. Before the 1970s, India placed relatively less emphasis on exportpromotion and more on import substitution. The volume growth of exportsbetween 1950/51 and 1969/70 averaged only 2.2% per annum, while the volumegrowth of imports over the same period was 4.3Z. In the early to mid-1970s,however, India's terms of trade, which had remained roughly constant duringthe 1960s, deteriorated sharply. In response, the Government introducedvarious policy measures designed to stimulate exports. As a result, the volumeof India's exports grew on average about 7.3% per annum for the 1970s as awhole, a performance which demonstrates that sustained rapid growth ispossible. While expanding world markets, particularly in the nearby MiddleEast, contributed to this growth, liberalized access to imported inputs andmore effective export incentives pLayed a major role.
6h Moving into the second half of the 1970s, the Indian economy was buoyedby higher levels of investment and an expanding level of foodgrain output. Asa resuLt, growth in real GDP and in agricultural and industrial value-addedsubstantially exceeded the historical 30-year trends (paragraph 3) averaging5.3X, 3.3% and 8.1%, respectively, during the 1975/76 to 1978/79 period. In1979/80, however, this momentum was broken when the worst drought in recentyears, combined with a doubling of international oil prices and domestic supplyshortages, led to a sharp fall in foodgrain production, a decline in GDP, andthe opening up of a relatively large trade deficit. Severe inflationary pres-sures also emerged after several years of virtual price stability. Thesesetbacks coincided with the preparation of the Sixth Five-Year Plan which laiddown a program of adjustment that aimed at improving the trade deficit, remov-ing infrastructural bottlenecks and ensuring price stability with an overallgrowth of the economy of 5.2% per annum.
Recent Trends
7. Despite the effects of two severe droughts in 1979/80 and 1982/83,India's economy in the early l980s continued to grow at the faster pace of thesecond half of the 1970s. Between the two droughts (from 1979/80 to 1982/83),GDP growth averaged almost 5% per annum, while between the two recovery years(from 1980/81 to 1983/84), it was 4.5% per annum -- substantially higher thanIndia's long-term growth rate of 3.6%. Continued rapid economic growth hasresulted from a development strategy which includes higher investment levelsand liberalized policies on imports, industrial licensing, prices, and commer-

-3-
cial borrowing. These policies, by easing constraints on the supply ofinfrastructure and basic comnodities, were a determining factor in the improvedperformance of the economy and the industrial sector. This overall improvementin performance, combined with a more restrictive monetary policy in 1981/82 and1982/83, resulted in a sharp decline in the rate of inflaticn. The growth rateof wholesale prices declined from over 18% in 1980/81 to only 2.6% in 1982/83,but rose to over 9% in 1983/84, mainly due to the effect of the 1982/83 drought
* on food prices. Further improvements in the policy environment will berequired to maintain these higher levels of economic growth and investmentwithout putting undue pressure on the balance of payments or reviving infla-tionary expectations.
8. Economic growth in the early 1980s has not been steady, mainly becauseof the effect of uneven rainfall on agricultural production during the period.In 1980/81 and 1981/82, the economy substantially recovered from the 1979drought, with real CDP growing by 7.6% and 5.3%, respectively. Whileindustrial output expanded by 4Z in 1980/81 and 8.6Z in 1981/82, recovery wasparticularly robust in agriculture where normal weather helped output to riseby more than 15Z and 5.5%, respectively. The supply of power, coal, and railtransport, already improved in 1980/81, was further expanded in 1981/82,recording growth rates of about 10%, 9.6Z and 12.5%, respectively. This over-all improvement in the Indian economy was halted in 1982/83 by a severe droughtin mid-1982 which reduced agricultural production by 4Z, brought down the GDPgrowth rate to 1.8%, and put further strains on the already difficult balanceof payments and domestic resource situation. The timely implementation ofvarious economic policies relating to foodgrain imports; procurement anddistribution, and the allocation of power to irrigation pumps mitigated theotherwise very distressing effects of the poor monsoon. The economy recoveredin 1983/84, led by a robust agricultural sector - GDP grew by about 6.5% to 7Zwith agricultural production growth in the 9Z-10 range and industrial growthof 4.52. The major factors contributing to the good economic performanceduring 1983/84 were the excellent monsoon, combined with adequate agriculturalpolicies and programs, and satisfactory performance of the coal and transportsectors. The power sector, however, emerged again as a constraint on highergrowth, especially in industry.
9. Agricultural production rebounded strongly in 1983/84 in response tothe monsoon, improved use of inputs and continued expansion of irrigation.Overall foodgrain production rose by 10X-12X over the previous year, reachinga new record of 142-144 million tons, a substantial increase over the previouspeak of 133 million tons in 1981/82. Corrected for weather variations,foodgrain production continues to grow at a trend oE 2.6% per annum-sufficientto maintain a broad balance between supply and steadily increasing domesticdemand. Nonetheless, the balance remains delicate, and the need for foodgrainimports to maintain consumer supplies or adequate buffer stocks could arisefrom time to time. Thus, adequate management of foodgrain stocks and programsto expand irrigation, strengthen extension and encourage the efficient use ofother agricultural inputs ccntinue to receive high priority.

-4-
10. Basic infrastructure services had a mixed performance in 1983184,partially because of sluggish demand from industry during the first half ofthe year but also due to a failure to maintain the productivity gains of1980-82. Electricity generation grew only by about 3.7% due to low reservoirwater levels during the first half of the year, delays in the commissioningof new capacity, and a deterioration of capacity utilization in thermal plants.As a result, power generation was about 11.5% below requirements and con-stituted a major bottleneck in the economy. Key industries which were adver-sely affected by power constraints included steel, fertilizers, cement, andcoal. To improve performance in the power sector, the Government recentlyincreased incentives for higher labor and management productivity in thermalplants. Railway freight traffic, measured in ton-kms, grew by only 0.5X in1983/84, reflecting sluggish demand. Coal production increased by about 6.5Zin 1983/84 reaching 139 million tons. When combined with stocks already avail-able this level of production was sufficient to meet the relatively slow demandgrowth. Infrastructural constraints would have emerged much more sharply hadthe pace of industrial growth and demand been more rapid. It is thereforecritically important that India maintain the pace of investment in these keysectors, mobilize sufficient resources to do so, and implement programs toenhance productivity.
11. The Indian economy has reverted from a situation of resource surplus inthe late 1970s to an aggregate resource deficit. The gap between gross invest-ment and national savings increased from negligible levels during the late1970s to an average equivalent to 2.1X of CDP in 1980-84. India's grossnational savings rate, which averaged 22.6% of GDP in the last four years, ishigh by any standard, particularly considering India's low income and the largeproportion of its population below the poverty line. The scope for a substan-tial increase in the savings rate is therefore quite limited. If India is tomaintain investment at about 25% of GDP, a major effort will be required toraise additional domestic resources particularly in the public sector. Futureincreases in savings will depend heavily upon the enhAnced profitability ofpublic sector enterprises which would require better utilization of capacity,more efficient operations and adequate pricing policies. This would also allowa marginal decline in the use of foreign savings from the recent 2.1Z-2.3Z ofGDP to 1.5X-1.8Z, to ensure a sustainable external debt service burden.
12. India's external resource position has changed notably since the late1970s. The current account balance, which recorded surpluses from 1976/77 to1978/79, reverted to deficits averaging US$3.5 billion and 2.1% of CDP during1980/81 to 1983/84. Several developments contributed to these relativelylarger current account deficits. First, the terms of trade deterioratedsharply in 1979/80 due to the second round of oil price increases and continuedto move against India during the first three years of the 1980s. Second, amore liberal import policy towards industrial inputs was pursued. Third, netinvisibles declined as travel receipts fell off, workers' remittances stagnated(reflecting slower developmeLt activity in the Middle East), and payment ofinterest on higher levels of foreign debt increased. Faced with severeinfrastructural constraints and a deterioration in its balance of payments,India initiated an adjustment program in 1980/81 designed to raise the growth
-5-
rate from its historical level of 3.6% to 5.2% while adjusting the country'sexternal balance to the adverse price developments in the world markets. Themain elements of this strategy, which is being successfully implemented, areexport promotion, import substitution where economically justifiable, implemen-tation of a coherent energy policy designed to meet the energy needs of theeconomy while curbing the growth of oil imports, and continued movement towarda more liberal import policy aimed at providing producers with access to inputsfor higher capacity utilization, greater efficiency, improved technology andcapacity expansion.
13. A positive development in India's balance of payments is the reductionin the trade deficit from US$7.7 billion in 1980/81 to US$5.9 billion in1983184 despite unfavorable world market conditions and import liberalization.Export volume growth and import substitution of oil and petroleum proWducts,metals and fertilizers more than offset the substantial increase in "other"imports. These "other" imports consist mainly of industrial imports and capi-tal goods which historically have been in chronic short supply and which are ofcritical importance to capacity utilization, product quality, and plant modern-ization and expansion. A major factor in the decline of the trade deficit wasthe lower net import bill for petroleum, which dropped from US$6.7 billion in1980/81 to US$3.4 billion in 1983/84 in response to a successful oil develop-ment program that reduced import needs and allowed crude oil exports, whichtotalled about US$1.5 billion in 1983/84. These structural changes in thebalance of payments are to a significant degree the result of India's develop-ment and adjustment efforts over the past three years. It is expected that thebalance of payments will continue to be under strain for the next severalyears, since the adjustment strategy will continue to require high levels ofimports.
14. Even assuming a favorable export performance, India will need externalcapital flows to augment its own resources for the foreseeable future, giventhe low per capita income level in the country, the already high savings rate,and the structural adjustment process. Faced with a growing need for externalcapital inflows and stagnation in the availability of concessional assistance,India decided at the start of the Sixth Plan to increase borrowings from theInternational Monetary Fund (IMF) and commercial banks to substantial levels.In the period covering the fiscal years 1981/82 to 1983/84, India A ew SDR 3.9billion from the Extended Fund Facility of the IMF. In addition, India bor-rowed significant amounts on commercial terms from the Euro-dollar market andincreased the use of suppliers' and export credits. In the period 1980-84,India contracted commercial loans totalling over US$6,000 million andsuppliers' credits of over US$1,000 million. The bulk of this borrowing hasbeen used for specific development projects in the public and private sector(mostly for petroleum exploration and development, steel, power, aluminum andshipping). India's favorable debt service position and the nature of itsborrowings, for project-related purposes instead of direct balance of paymentssupport, enabled it to tap commercial capital markets at favorable spreads.This larger commercial borrowing and transfer of funds under the arrangementwith the IMF has stemmed the use of foreign exchange reserves which had fallento less than four months of import coverage in 1981/82.

Development Prospects
15. I.e experience of recent years illustrates that India has the capacityto grow and develop at a more rapid pace. Although the industrial sector issmall compared to the size of the economy, it nevertheless is large in absoluteterms and has a highly diversified structure, capable of manufacturing a widevariety of consumer and capital goods. Basic infrastructure -- irrigation,railways, telecommunications, power, roads and ports -- is extensive comparedto many countries, although there is considerable need for additional capacityas well as improvement in the utilization of existing capacity. India also hasa wide range of institutions capable of fostering development and is well-endowed with human resources. Finally, India has an extensive natural resourcebase in terms of land, water, and minerals (primarily coal and ferrous ores,but also gas and oil). With good economic policies and reasonable access toforeign savings, India has the capability for managing these considerableresources to accelerate its long-term growth.
16. The Government is currently preparing the Seventh Plan which will laydown the development strategy for 1985/86-19B9/90. This strategy is expectedto continue the emphasis of the Sixth Plan on agriculture, energy development,export promotion, domestic import substitution where economically justifiableand the removal of infrastructural bottlenecks. Overall Sixth Plan performancehas been encouraging, with aggregate real investment projected to be about 30%higher than in the period 1975-80--a creditable performance indeed. The SixthPlan expenditure targets, however, will not be fulfilled as resource mobi-lization by the public sector will fall short of the financing requirements ofplanned public investment. Actual aggregate real investment is projected to beabout 7% below the original target for the period 1980-85, private investmentbeing 5% to 10% higher and public investment about 20% lower in real terms thanactually projected. In terms of meeting Plan expenditure targets, the perfor-mance of the Central Government is considerably better than that of the StateGovernments. The Central Government's Plan outlays are likely to reach about80% to 90% of the original Plan allocation in real terms, while the States'will probably achieve only about 50% of their targets, due principally toshortfalls in resource generation. Bottlenecks in key sectors such as power,transport and irrigation are likely to persist as a consequence of real invest-ment shortfalls relative to original Plan allocations.
17. Although Sixth Plan expenditure targets will not be met, India's capi-tal formation rates have increased from 22.6% in 1975-80 to 24.7% of GDP in1980-84. Recent higher capital formation rates are encouraging for futureincome growth, but returns to investment have so far been relatively low. Muchof this phenomenon relates to India's stage of development, in which a largeand growing proportion of investment has been needed to build up basicinfrastructure services which have inherently high capital-output ratios.However, there is scope to reduce capital-output ratios through improvementsin efficiency. As discussed in greater detail in our recent economic reports,performance in the basic service sectors can be improved through better plan-ning and management, thus leading to higher productivity and capacity utiliza-
-7-
tion throughout the economy. At the same time, programs to expand domesticcapacity are vital. In the case of tradeable commodities like coal, steel andcement, this is justified on the grounds of comparative advantage. For sectorssuch as irrigation, power and transportation, expansion of planned capacity inaccordance with the requirements of the rest of the economy will be vital forsustained growth.
18. Under the Sixth Plan, India has an ambitious oil development programbacked by substantial financial commitment. Performance under the program hasbeen excellent with real investment and oil production levels running wellahead of Plan Targets. In 1981, and again in early 1983, resources forexploration and development were raised by successive price increases fordomestic crude and products. While the gap between domestic consumption ofpetroleum and production remains large, India's dependence on oil importsdropped from 63Z of consumption in 1979/80 to about 41X in 1983/84 and isexpected to decrease to about 33% of consumption by 1984/85. The rapidlyexpanding level of exploration activity, combined with the possibilities foraccelerated offtake from known fields, offers much encouragement for India'slonger-term energy prospects. At the same time, the increases in domesticpetroleum prices have helped encourage conservation and slow demand growth.
19. India's development prospects over the next few years will hinge onthe extent to which the economy can be brought into both internal and externalbalance, while at the same time achieving more rapid growth than in the past.This will require the continuation of the current development strategy whichassigns high priority to export promotion, public finance discipline, improve-ment of economic efficiency, and investment in infrastructure, supported byadequate flows of external borrowing and aid. In the short term, a relativelylarge level of external borrowing, including an increased emphasis on commer-cial borrowing, will be necessary to cope with the balance of payments conse-quences of such a growth strategy. However, an important element in providingIndia with the capacity to adjust flexibly will be adequate flows of conces-sional assistance since India is still a very poor country with a large ruralsector and enormous investment requirements for human development and basicinfrastructure. Although India is currently in a position to increase borrow-ing on coumercial terms from the very low levels of the past, there are, ofcourse, limits beyond which India will choose to sacrifice growth objectivesrather than accept debt on unfavorable or unmanageable terms. Nevertheless,with a more open trade policy and expanded efforts to remove constraints on thegrowth of productive capacity, supported by adequate mobilization of bothforeign and domestic savings, India is demonstrating that it can sustain a rateof growth closer to 5.0% per annum than to the long-run trend of 3.6Z perannum. If the rate of population growth can be brought to below 2.0% perannum, a 5.0% growth rate would mean a doubling of the trend rate of growth ofper capita income of 1.4% per annum. Success in these efforts would make asignificant difference to the prospects of easing poverty in India.
20. A large and growing population and severe poverty underline the needto accelerate India's development efforts. The 1981 Census indicated therewas no decline in the rate of population growth, which remained about 2.2% per

-8-
annum in the 1970. despite a measurable decline in fertility rates. Thepopulation growth rate failed to decLine in the past decade due to a reductionin the infant mortaLity rate and an increase in life expectancy, reflectinglarger availability of food and health services. While this is a welcomedevelopment, it impLies a greater strain on the economy and re-emphasizes theneed for continuing efforts to strengthen the health and family planningprograms in a broad range of activities and services. These efforts are givenhigh priority in the Sixth Plan, which aims at a rise in the proportion ofprotected couples in the reproductive age group from its estimated 1979/80level of about 23% to over 35% by 1984/85. The Government is reviewing itspopulation policy for the Seventh Plan, with indications of a determination toretain the emphasis on the implementation of family planning, health, educationand literacy programs aimed at reducing fertility rates.
21. Reduction of poverty remains the central goal of Indian economic andsocial policy. More than one-third of the world's poor live in India, and morethan 80% of the Indian poor belong to the rural households of landless laborersand small farmers. About 51% of the rural population and 40Z of the urbanpopulation subsist below the poverty line. Significant reductions in povertywill depend primarily on an acceleration of economic growth, particularly inagriculture, combined with effective implementation of poverty alleviationprograms. India's poverty alleviation strategy appropriately recognizes thatproduction-oriented programs, which aim at accelerating the overall pace ofeconomic growth, and poverty alleviation programs, targetted at those leastable to participate in the general growth of the economy, can be mutuallyreinforcing rather than substituting for each other. Major poverty programsoperating on a nationwide basis at present include: the Minimum Needs Program(MNP), the Integrated Rural Development Program (IRDP), and the National RuralEmployment Program (NREP). The IRDP and NREP are targeted programs aimed atincreasing the incomes of the poor rapidly, either through the transfer ofproductive assets or direct employment. The MNP, aims at broadening the provi-sion of social infrastructure and basic services which enhance the human capi-tal of the poor and improve living standards. These programs represent avitally important commitment of the Government to address the needs of thepoorest. The scale of the poverty problem in India, combined with the inherentdifficulties in implementing poverty programs in any country, imply the needfor continued efforts to enhance the effectiveness of these programs.
PART II - BANK GROUP OPERATIONS IN INDIA
22. Since 1949, the Bank Group has made 82 loans and 165 developmentcredits to India totalling US$6,526 million and US$12,268 million (both netof cancellation), respectively. Of these amounts, US$1,524 million has beenrepaid, and US$6,207 million was still undisbursed as of September, 30, 1984.Bank Group disbursements to India in the current fiscal year throughSeptember 30, 1984 totalled US$171 million, representing a decrease of about40 percent over the same period last year. Annex II contains a sutmary state-ment of disbursements as of September 30, 1984.
-9-
23. Since 1959, IFC has made 29 commitments in India totalling US$223million, of which US$34 million has been repaid, US$56 million sold andUS$34 million cancelled. Of the balance of US$98 million, US$91 million repre-sents loans and US$7 million equity. A summary statement of IFC disbursementsas of September 30, 1984, is also included in Annex II (page 4).
24. The thrust of Bank Group assistance to India has been consi'tent withthe country's development objectives in its support of agriculture, energy andinfrastructure. Of particular importance have been investments in irrigation,extension and on-farm development designed to increase agriculturalproductivity, and efforts to improve the availability of basic agriculturalinputs to farmers through credit, fertilizer, marketing, storage, and seedprojects. Major elements of the lending program have also been directed athelping to meet the energy needs of the economy while curbing the growth of oilimports, and to ease the infrastructure bottlenecks which have hamperedeconomic growth in India, particularly through power generation anddistribution, and railways and telecommunications projects. The Bank Group hasalso provided financing for a broad range of medium- and small-scale industrialenterprises, primarily in the private sector, through its support of develop-ment finance institutions. Recognizing the importance of improving the abilityto satisfy the essential needs of urban and rural populations, the Bank Grouphas supported nutrition and family planning programs, a rural roads project, aswell as water supply and sewerage and other urban infrastructure projects.
25. This pattern of assistance remains highly relevant, and consonant withGovernment priorities, as reflected in the Sixth Plan and in the approach beingtaken by GOI in the preparation of the Seventh Plan. First, high priority willcontinue to be given to GOI's agricultural program. While India has madesignificant progress in agriculture, productivity growth will have to be sus-tained to improve the balance between food demand and supply and to contributeto poverty alleviation and employment. Thus, the Bank Group will continue tosupport irrigation, fertilizer production and distribution, and agriculturalextension and credit. Second, alongside COI's efforts in promoting greaterefficiency and faster development of the industrial sector, increased assis-tance will be provided for industrial development. Third, the review of per-formance under the Sixth Plan confirms the high priority that should continueto be given to the expansion and more efficient use of basic infrastructurecapacity and to the development of India's indigenous hydrocarbon resources.Accordingly the Bank Group will continue to support the development of theenergy, transport and telecommunications sectors to alleviate criticalshortages which constrain output in both agricultural and industrial sectors.Fourth, support of urban development and other GOI basic social servicesprograms for the poor will also continue in light of the growth in populationwhich, despite successes in lowering birth and death rates, still increases byabout 16 million each year.
26. The need for a substantial net transfer of external resources insupport of the development of India's economy has been a recurrent theme ofBank economic reports and of the discussions within the India Consortium.Thanks in part to the response of the aid community, India successfully
-10-
adjusted to the changed world price situation of the mid-1970s. However, Indiacontinues to require a substantial level of foreign assistance both to offsetthe overall deterioration in the world trade environment, and to sustain therelatively higher investment and growth rates achieved during the first fouryears of the Sixth Plan. As in the past, Bank Croup assistance for projects inIndia should aim to include the financing of local expenditures. India importsrelatively few capital goods because of the capacity and competitiveness of thedomestic capital goods industry. Consequently, the foreign exchange componenttends to be small in most projects. This is particularly the case in suchhigh-priority sectors as agriculture and irrigation.
27. India's poverty and needs are such that whenever possible, externalcapital requirements should be provided on concessional terms. Accordingly,the bulk of the Bank Group assistance to India in the past was provided fromIDA. However, IDA lending to India is declining from a peak of US$1.6 billionin FY82, mostly due to funding constraints related to IDA. The amount of IDAfunds available to India is likely to remain small in relation to India's needsfor external support. Thus, this requirement for additional assistance willhave to be met, in part, through larger Bank lending. Civen its developmentprospects and policies, India is judged creditworthy for Bank lending to sup-plement IDA assistance. A continuation of efforts already underway to achievegrowth in productive capacity, trade expansion, higher levels of savings,foodgrains self-sufficiency and a reduction in the rate of population growthshould result in continued economic growth and improvement in the balance ofpayments. India's debt service ratio is estimated at about 15.2% in 1984/85.This ratio is projected to rise to around 20% by 1989/90, mainly due to thehardening structure of India's debt; and to increase slightly over this levelthrough the mid-1990's. Although the projected debt service ratios are con-siderably above historical levels, they are still manageable and will notadversely affect India's creditworthiness.
28. Of the external assistance received by India, the proportion con-tributed by the Bank Group has grown significantly. In 1969/70, the Bank Groupaccounted for 34Z of total commitments, 13% of gross disbursements, and 12% ofnet disbursements as compared with 622, 33% and 37Z, respectively, in 1983/84.In 1983/84, about 19.0% of India's total debt service payments were tD the BankGroup. On March 31, 1984, India's outstanding and disbursed external publicdebt was estimated to be about US$26.9 billion, of which the Bank Group's sharewas US$9.6 billion or 36Z (IDA's US$7.8 billion and IBRD's US$1.8 billion). Asof September 30, 1984, outstanding loans and credits to India held by the Banktotalled US$17,271 million, of which US$6,207 million remain to be disbursed,leaving a net amount outstanding of US$11,064 million.
-11-
PART III - THE POWER SECTOR
29. India's commercially exploitable energy resources consist of coal,oil, gas, hydro, uranium, and thorium. Of the nonrenewable resources,coal is the most abundant. Reserves of thermal coal have been estimatedat slightly more than 100 billion tons, of which 25 billion tons areproven. Although reserves are ample, the quality of coal produced isgenerally low and is deteriorating. Proven and probable petroleumreserves comprise approximately 530 million tons of oil and 390 milliontoe of natural gas. Despite recent increases in domestic production,India still imports 35Z of its oil requirements, which in 1983/84 cost theequivalent of 40Z ot its merchandise exports. Consequently, theGovernment of India has attempted to stimulate exploration whilerestricting petroleum and natural gas consumption by emphasizing premiumuses such as transportation, petrochemicals and fertilizer. However, inthe case of natural gas, the slow development of premium uses has led tosubstantial volumes of associated gas being flared. India's hydroelectricpotential is about 100,000 NW. At present, only 13,000 NW have beendeveloped, 4,700 SW are under construction, and a further 23,000 MW arebeing studied-for future development. The prominent role of hydro inregional least-cost development plans prepared in 1982 has led GOI toemphasize the need to accelerate its development; however, progress hasbeen slow owing to the limited resources available for the simultaneouspreparation of a large numrber of schemes and the time required to resolvewater rights and environmental issues. The country's uranium reservescould support a modest nuclear program (8,000-10,000 MW), and its thoriumreserves are enough for a large fast breeder program.
30. Planning the best use of India's indigenous energy resources forpower generation raises a number of issues. First, the high ash contentof coal, which can reach 50X, increases transport costs, as well as powerstation capital and operating costs. The development of minemouthstations, which is constrained by pollution limitations and theavailability of cooling water, helps to solve only the transport problem,and thus priority needs to be given to more selective mining and improvedcoal preparation. Even though a lower ash content might help to alleviatetransport problems, they would still persist. Two studies included in theDudhichua Coal Project (Loan 2393-IN) are designed to help formulate astrategy to deal with these problems: one study will examine ways ofimproving the linkages between the sources of supply and demand, and theother will concentrate on improvements in handling and transportationfacilities. Second, with the recent increases in the supplies of bothassociated ana free gas, there is a need for a coherent policy on theutilization of gas. A Bank study planned for 1985 will focus on, amongother things, the potential for the economic use of gas in powergeneration. Third, if hydro development is to accelerate, furtherresources, including consultants if necessary, need to be deployed toprepare hydro schemes. Furthermore, it water rights and environmentalissues cannot be resolved quickly, appropriate procedures need to be

-12-
initiatea to ensure that an adequate number of schemes are available fordevelopment.
Supply and Demand of Electricity - Inaia
31. Approximately 50% of India's electricity is generated from coal,40% from hydro, ana the rest from oil, nuclear power, and natural gas.Although a number of large thermal projects are planned for the shortterm, the share of hydro is expected to increase in the long run.Electricity losses have risen slowly but steadily over the last few yearsand now exceed 26% of gross generation. The deteriorating quality of coalhas been at least partly responsible for this trend, with coal stations'own consumption now approaching 10% of gross generation against adesirable 5% or 6Z. Distribution networks have been overloaded becauseinadequate attention has been given to systematic analysis and planning ofthis part of the system. As a result, distribution losses are high bygenerally accepted standards and, although they are lower than in severalcountries in the region, they need to be reduced. Under its lendingprogram, the Bank has supported pilot studies to reduce system losses, anait will continue to tollow this approach in its future lending. However,the Bank can only pursue this on a State-by-State basis, vith lossreduction targets reflecting the particular circumstances of each State.
32. Over the past two decades, the consumption of electricity hasgrown approximately twice as fast as total commercial energy consumptionand now accounts for more than 30Z of the latter. As a result, shortageshave prevailed throughout the country and, during the last five years,averaged an estimated 13% of electricity requirements. The principalsectoral shares of total electricity consumption are: industrial, 56X;agricultural, 19%; and domestic, 12X. Agriculture-s share has grownsteadily owing to increased electrical irrigation pumping made possible byrural electrification and encouraged by heavy subsidies. Totalconsumption has grown at an average rate of 1UX per annum during the pasttwo decades, and the Central Electricity Authority (CR4) has forecastgrowth of 9X per annum between 1984/85 and 1989/90. Whether such growthcan take place will depend on the utilities'-success in installing newcapacity.
Supply and Demand of Electricity - Northern Region
33. The Northern Region comprises the States of Uttar Pradesh, Punjab,Haryana, Rajasthan, Himachal Pradesh, Jammu and Kashmir, and the UnionTerritories of Delhi and Chandigarh. As of March 31, 1984, the installedcapacity in the Region was about 11,200 H, consisting of 5,958 M (53%)of thermal power, 4,771 MW (452) of hydro power, and 440 MM (4%) ofnuclear power. The Region's installed capacity is expected to reachalmost 20,000 MW by 1990, representing an average increase of 10.4% peryear. NTPC's share of installed capacity in the Region is expected toincrease from 1,770 MW in 1983/84 to 4,600 MW in 1989/90, the increasebeing provided from the ongoing extension at Singrauli (1,000 MW), the newRihand plant (1,000 MW), and a proposed 800 MW station at Muradnagar.Electricity consumption in the period 1978/79 through 1983/84 grew at an

-13-
average rate of 7.1X per year, reaching 28,200 GCh in 1983/84 with a peakdemand of about 8,700 NW. Industry is the largest consumer of electricityin the Region with a share of about 521 of total consumption, followed byagriculture at 30%. Over the period 1984/85 to 1992/93, energyrequirements are expected to increase at an average rate of 10.2Z per yearto 102,432 GWh, and peak demand to increase by 10.8Z per year to 20,024 MWover the same period. Forecast demands are unlikely to be met because ofcapacity shortages and operational problems; deficits in both peak demandand energy are therefore expected to continue.
Organization of the Power Subsector
34. Responsibility for the supply of electricity is shared between theCentral and State Governments. The State Electricity Boards (SEBs) andthe Regional Electricity Boards (RE5s) are controlled by States; theCentral Electricity Authority, the National Thermal Power Corporation, theNational Hydro-Electric Power Corporation (NHPC), and the RuralElectrification Corporation (REC) are controlled by the CentralGovernment. SEBs were instituted under the Electricity Supply Act of 1948to promote the development of the power subsector and to regulate privatelicensees. Although, in principle, SEBs are supposed to be autonomous inmanaging their day-to-day operations, in practice they are under thecontrol of State Governments in such matters as capital investment,tariffs, borrowings, pay, and personnel policies. As a first step towardnational integration, the SEBs have been grouped into five regionalsystems, each coordinated by an REB. Coordination responsibilitiesinclude overhaul and maintenance programs and determination of generationschedules, inter-State power transfers, and concomitant tariffs. CEA wascreated in 1950 to develop national power policy and to coordinate thevarious agencies involved in supplying electricity. It is responsible forthe formulation of countrywide investment plans for approval by theCen;ral Government, the development of integrated system operation, thetraining of personnel, and research and development. It maintainsoperational, economic, and financial data at both the Central and Statelevels, and provides consulting support to SEBs. NTPC and NHPC wereincorporated in 1975 by GOI to construct and operate large power stationsand associated transmission facilities. They sell bulk power to the SEBsfor distribution. NTPC has had marked success and has grown rapidly. Incontrast, NHPC is still struggling to establish a role for itself. TheStates own most hydro sites and are reluctant to relinquish these sourcesof comparatively inexpensive energy to the Central Government. REC wasestablished in 1969 to coordinate rural electrification and providefinancial and technical expertise for SEB schemes. At present, RECfinances more than half of total rural electrification investment.
Pricing and Resource Mobilization
35. Through the 1983 amendments to the Act, GOI has set a financialobjective for the SEBs to produce an annual return of at least 3Z on theirhistorically valued net fixed assets, after meeting operating expenses,taxes, depreciation and interest. The 31 return would represent, in termsof the Bank's conventional method of calculation, a rate of return on
-14-
historically valued assets in the range of 102 to 13%. The Bank considersthis objective to be a reasonable minimum but believes that because oftheir investment requirements, a number of SEBs need to achieve internalcash generation which implies returns higher than this minimum. Higherreturns may be possible in some cases through reclassification ofconsumers. However, substantial improvements are only achievable throughtariff increases. Present tariffs are in most cases inadequate, not onlyin economic terms but also in financial terms, and most SEBs are unable tofinance a reasonable share of their investment programs. On average, SEBtariffs are equivalent to only about 502 of the long run marginal cost(LRhC) of producing power. In contrast, NTPC's tariff approximates LRMC.Industrial tariffs are almost 90Z of LRMC, whereas agricultural anddomestic tariffs, which are considered politically sensitive and have beenconsistently subsidized, are only 272 and 36% of LRMC, respectively.State-specific financial programs are needed to provide both an increasedreturn on investment and a simpler, efficient and affordable tariffstructure. Such programs will be addressed through the Bank's lending toindividual SEBs.
Power Suusector Planning
36. Because the demand for electricity has increased rapidly, GOI atpresent allocates about 20% of public investment to power development. Toensure that the subsector would be developed in the most economic manner,the Bank encouraged GOI to prepare a comprehensive least-cost NationalPower Plan (NPP), which was completed in September 1982. Although thisplan represents substantial progress, further refinement is needed. Toassist GOI in this task, the Bank has planned a study for FY85 that willreview the assumptions and methodology employed in formulating theleast-cost plan. There appears to be a need for further nationalintegration and greater coordination between power and other sectors,especially coal and gas. Since it will not be possible to achieve fullnational integration im-ediarely, the Bank will continue to ensure thateach Bank-financed project forms a part of an up-to-date regionalleast-cost development plan In due course, the sources of supplyconsidered in the formulatior of each regional least-cost plan should bewidened to include the option of importing from neighboring regions. Thisapproach would eventually lead to integrated planning at a national level.A further problem has arisen in the coordination of the long-term NPP withthe national five-year plan and shorter-term budgets. Because ofinadequate resources, fewer projects have been included in the five-yearplan than in the NPP and, as a result of underestimation of project costsand delays in project implementation, st;11 rewer have been executed.Consequently, the shortage of power has bacome more and more acute, andover the next decade, India expects its power deficit to increaseseveralfold. This deficit will tend To Undermine rational planningbecause emphasis is likely to be places on rapid expansion of supplyrather than on least-cost development. Furthermore, it may promptoverinvestment in captive plant and excessive use of high-value energyproducts in the generation of power. In addition to supporting GOI'sefforts to increase the supply, the Bank will continue to stress to GOI

-15-
the role of pricing in eliminating the deficit and the importance ofintegrating planning and pricing.
Management and Operations
37. SEBs' organization and management capabilities have not kept pacewith the expansion of supply. The quality of service, reliability, andfinancial performance are the principal areas of concern. In gene&al,SEBs have high-quality engineering staff, but lack experienced personnelin the areas of financial planning and control. The relatively poorstatus and pay of these personnel merely add to the already significantpay differential between the public and private sectors, and make itdifficult to recruit competent staff. Management practices are generallyoutmoded and inadequate. The SEBs' inefficient accounting systems are anexample. At present, accounts are maintained principally to track cashreceipts and expenditures, and accounting information is seldom used formanagerial purposes. GOI has decided that a new and uniform accountingsystem should be installed in all SEBs. After initial delays,preparations are now proceeding and implementation is scheduled to beginin April 1985.
38. In the area of operations, one of the main concerns has been thepoor performance of thermal plant. Factors that have contributed to thiaare inadequate maintenance (due to capacity shortages), deficiencies inplant manufacture, lack of spares, and the poor quality of coal; ingeneral, these problems have been recognized by the relevant authoritiesand corrective steps are being taken. GOI is currently preparing arehabilitation program for thermal plant which may be financed by theBank. Until this program is compiled, the Bank will, wheneverappropriate, include a thermal rehabilitation component under each of theloans made to the SEBs.
Bank Group Participation in the Past
39. The Bank Ias made 18 loans for Indian power projects amounting toUS$1,983 million, and 17 IDA credits totaling US$2,409 million. Seventeenprojects financed under the following loans and credits have beencompleted: ten generating projects, the Beas Project (Credit 98-IN), thefirst four transmission projects (Loan 416-IN, Credits 242-IN, 377-IN and604-IN), and the First and Second Rural Electrification Projects (Credits572-IN and 911-IN). The Fourth Transmission Project (Credit 604-IN) wascompleted in 1983, and the Second Rural Electrification Project in 1984.The Singrauli (Credit 685-IN), Korba (Credit 793-IN), and Ramagundam(Credit 874-IN and Loan 1648-IN) Thermal Power Projects are in advancedstages of implementation. The credit for the Second Singrauli ThermalPower Project (Credit 1027-IN) and the credit/loan for the first stage ofthe Farakka Thermal Power Project (Credit 1053-IN and Loan 1887-IN) wereapproved in May and June 1980. Korba II (Credit 1172-IN) was approved inJuly 1981, Ramagundam II (Loan 2076-IN) in December 1981, and the ThirdRural Electrification Project (Loan 2165-IN) in June 1982. The UpperIndravati Hydro Project (Credit 1356-IN and Loan 2278-IN) and the CentralPower Transmission Project (Loan 2283-IN) were approved in May 1983, and
-16-
the Bodhghat Hydroelectric Power Project in May 1984. The Second FarakkaThermal Power Projec. (Loan 2442-IN) was approved in June 1984, and theTrombay IV Thermal Power Project (Loan 2452-IN) in June of the same year.The Third Rural Electrification Project is about a year behind schedule.The first five units of the Singrauli Project and the first two units ofthe Korba project were commissioned on schedule. The Farakka andRamagundam projects are proceeding satisfactorily, the first unit atRamagundam having been commissioned four months ahead of schedule. TheThird Trombay Project (Unit 5) (Loan 1549-IN) was first synchronized inJanuary 1984, about a year behind schedule; time was lost mainly becauseparts for the boiler were not delivered on time, and because of delays inits construction.
40. A performance audit conducted in 1980 for the Second PowerTransmission Project (Credit 242-IN) concluded that the project hassucceeded in helping the nine beneficiary SEBs extend their transmissionsystems and meet their growing power requirements. Utilization ofgenerating capacity in these SEBs has exceeded the appraisal forecast.The upgrading of the SEBs' financial management practices that began underthis project will continue under subsequent projects. The audithighlighted the difficulties of adequately supervising this project(because it consisted of many widely scattered subprojects), and ofeffecting institutional improvements in the absence of a close workingrelationship between the Bank Group and the beneficiary SEBs. The Bankhas therefore sought more direct involvement with the SEBs throughState-specific projects.
Bank Group Strategy in the Power Subsector
41. Over the last ten years the Bank Group has assisted GOI insubstantially expanding its centrally-owned generation capacity, which iscurrently being run relatively efficiently. In the past two years,however, the emphasis of Bank Group lending has begun to shift fromsupporting projects owned and operated by the Central Government toprojects owned and operated by the SEBs. This gradual shift has comeabout in support of GOI's desire to accelerate the development of India'shydroelectric power resources (most of which are owned by the StateGovernments), and because of the considerable need to improve theoperational and project implementation efficiency and the financialviability of the State-owned power sector institutions. In parallel withthis shift in Bank Group lending, sector-wide objectives for power systemoperation at both Center and State levels--such as improving efficiency inthe use of existing power generation, transmission and distributionsystems, strengthening Central and State level sector institutions,improving country-wide power system planning, and increasing resourcemobilizarion within the sector--will continue to be pursued by the BankGroup. More specifically, the principal objectives of the Bank Group'sassistance in the subsector are:
(a) the better use of existing facilities--through transmissionprojects improving regional interconnections and throughrehabilitation of plant, particularly of thermal power

-17-
stations and distribution networks: these measures willimprove the efficiency of energy use and reduce systemlosses, thereby helping to minimize system capital andoperating costs;
(b) institution building-although the Bank will continue tomaintain an interest in Central institutions, its effortswill be broadened to encompass individual SEBs, wheresubstantial efforts are needed to strengthen management,operations, and finances;
(c) improved planning-particularly by extending the scope ofplanning from the State through the regional to the nationallevel and through greater integration of planning with othersectors in the economy, both those that consume electricityand those that supply other forms of energy; and
(d) improved resource mobilization from electricity consumers -the principal vehicle for this has been and will continue tobe financial covenants in relation to beneficiaries; however,the Bank will also continue to stress the importance ofrelating tariffs to the economic costs of supply.
PART IV - THE PROJECT
42. The project was prepared by NTPC and appraised by a mission thatvisited India in August 1984. A Staff Appraisal Report is beingdistributed separately to the Executive Directors. Negotiations were heldin Washington in April 1985. GOI and NTPC were represented by adelegation with Mr. Arjun Thapan of the Department of Economic Affairs ascoordinator. A Supplementary Project Data Sheet is attached as Annex III.
Project Objectives and Rationale for Bank Involvement
43. The primary objective of the project is to help meet the demandfor electricity in the Northern Region of India by providing a powertransmission linkage between the thermal power plants in theSingrauli-Rihand complex in the State of Uttar Pradesh and the main loadcenters of the Region, and to ensure the evacuation of power from theseplants at least cost to the economy. The three large thermal powerstations in the area-at Singrauli, Rihand, and Vindbyachal--willultimately have a combined total capacity of about 7,300 M4. Five unitsat Singrauli, with a total capacity of 1,000 MW, are already in operation.A least-cost program for the transmission system necessary to ensure theefficient evacuation of power from the Singrauli-Rihand stations into theNorthern Regional transmission grid has been developed by CEA, incooperation with a firm of consulting engineers. The proposed project isdesigned to implement this program. A secondary objective of the projectis to continue the institution-building efforts initiated under earlierBank Group lending operations in the sector by strengthening CEA's

-18-
planning capabilities, particularly in the area of power transmission.Though not a Bank-financed component of the project, a series of long-termplanning studies will be undertaken to provide the basis for theformulation of a long-term (15- to 20-year) national plan for thedevelopment of the country's extra-high-voltage power transmission system.The policies and procedures for its operation will also receive closeattention in view of the increased size of power generating units andplants, the expansion of the interconnected transmission grid, and theintroduction of high-voltage, direct-current facilities which has becomenecessary to keep up with the growth of the power sector. Anotherobjective of the proposed project is to increase the technologicalcapabilities and experience of NTPC and other power sector institutions byintroducing long-distance HVDC transmission technology in India.
44. Through its participation in the project, the Bank would besupporting GOI's objectives and efforts to alleviate power shortages andreduce transmission losses. Through its involvement with the powertransmission studies, the Bank would also help to ensure sound planning inpower transmission throughout the country and at the same time help CEA tostrengthen its capabilities in this area. The HVDC facilities in theproject will not only acquaint Indian engineers with this type ofequipment, but should also encourage the mobilization of foreign exchangefor the project through official bilateral assistance or other sources ofcofinancing.
Project Description
45. The project is made up of the following components:
(a) about 910 km of 500-kV DC transmission line connecting Rihandand Delhi, together with the associated AC/DC convertingstations and auxiliary equipment;
(b) about 1,450 km of 400-kV single- and double-circuit ACtransmission lines connecting the Rihand and Singraulistations with Kanpur, Delhi, Panipat, and Jaipur, togetherwith new or extended substations, and associated auxiliaries;and
(c) technical assistance for the engineering, testing, andcommissioning of the project.
Project Implementation
46. The project will be implemented over a five-year period(FY85-FY89) by NTPC, as part of its ongoing power development program.NTPC will construct, own, and operate the proposed transmission facilitiesfrom the Singrauli-Rihand complex from which power will be distributed andsold in bulk to SEBs in the Northern Region-in Darticular to those ofUttar Pradesh, Rajasthan, and Haryana-and to the Delhi Electricity SupplyUndertaking. The AC transmission lines to be constructed under the

-19-
project will form part of the 400-kV system for that region, which willeventually be integrated into the national grid.
47. NTPC has developed its expertise in building 400-kV transmissionsystems through the transmission components of its large thermal powerprojects. With the commissioning of nine 200-MW units in rapid successionsince the beginning of 1982, the organization has moved from theconstruction phase to the operational phase, and has accomplished thistransition efficiently. In support of this process, the corporation in1982 adopted an organizational structure that made regional headquartersunits responsible for the design, construction, and operation ofgeneration and transmission facilities within the region. More recentorganizational changes provide for a division that will be responsible forthe construction of power transmission facilities in the Northern andWestern Regions, including the introduction of HVDC facilities. Most ofNTPC's operations have now been decentralized. Recruitment is progressingsatisfactorily to meet NTPC's expanding operational needs. UTPC placesspecial importance on the training of engineers, supervisors, andoperating staff as well as managerial and administrative staff, anddetailed programs have been developed to meet the training needs of allcategories of staff.
48. Detailed system and engineering studies for the project werecompleted in September 1984 by NTPC in close association with itsconsultant, Hydro Quebec International (HQI) of Canada, and financed bythe Canadian International Development Agency. As part of the process,HQI helped CEA and MTPC staff become familiar with power systems analysisand equipment performance specifications. NTPC is now preparing detailedspecifications for the HVDC component of the project, and will retainconsultants to assist in supervising the engineering activities during theequipment supply, construction, testing, and comhissioning phases of thatcomponent. The 400-kV Lines and substations in the project are based onstandardized designs adopted by India in similar projects in the past.With the aid of contractors, NTPC is currently installing 400-kV lines andsubstations associated with a number of the thermal power plants that areunder construction. The same arrangement will be followed for theconstruction of the 400-kV AC facilities (lines and substations) under theproposed project.
49. In conjunction with the project, CEA will carry out a series ofpower transmission studies, to be financed by GOI from its own resources.These studies will be undertaken for each of the Regions and will form thebasis for the formulation of a least-cost, long-term (15- to 20-year)national power transmission plan for the development of the high-voltagepower transmission system; the plan will include the configuration of aprimary grid, interregional linkages, and system control requirements.Further studies will be undertaken by GOI as necessary to address theresponsibilities, policies, and procedures pertaining to theinstitutional, commercial, operational and training aspects of the systemat the State, regional, and national levels. The scope and terms ofreference for the power transmission studies will be prepared by CEA incollaboration with the Bank by December 31, 1985, and consultants will be

, -20-
appointed or retained as necessary to assist and train CEA staff in theirexecution. The studies and the national power transmission plan will becompleted, and the results reviewed with the Bank, by June 30, 1987.
50. No ecological problems are expected. The area of the transmissioncorridor required for the HVDC Line is significantly smaller than thatrequired for an AC line of similar capacity. There are no landacquisition or resettlement problems. Conductor sizes and spacing will bedesigned to keep energy losses and radio interference within acceptablelimits.
Project Cost and Financing
51. The total cost of the project, including contingencies butexcluding about US$87 million in taxes and duties, is estimated at aboutUS$579 million equivalent, of which about US$263 million (45Z) representsthe estimated foreign exchange costs. Interest during construction addsabout US$27 million to the financing required. The principal costs, netof physical and price contingencies, but including taxes and duties, willbe as follows: 400-kV AC lines, US$125 million; 400-kV AC substations,US$94 million; HVDC line, US$80 million; HVDC terminals, US$188 million;engineering and administration, US$33 million; consultancy and technicalassistance, US$5 million. The estimates of project costs for the mainitems of equipment and materials related to the 400-kV AC facilities arebased on the most recent price quotations for similar projects, withprices updated to December 1984 levels. Estimates for the HVDC facilitiesare based on indicative proposals of firms with extensive experience inthe installation of HVDC equipment. Price contingencies, amounting to 22Zof base cost, are based on expected annual inflation rates of 8.5Z for1985/86 through 1990/91, and 6% thereafter for local costs, and 9Z for1985/86 through 1987/88, 7.5% for 1988/89, and 6% thereafter for foreigncosts. Physical contingencies of about 10 on civil works and 5% onequipment have been allowed, and these amount to abo t 5Z of base cost.
52. The proposed Bank loan of US$250 million will finance about US$128million (45%) of the total foreign exchange financing requirement of aboutUS$282 million, together with about US$122 million of the local costs, andwould cover about 431 of the total project cost net of taxes and duties.Additional financing of about US$135 million may be obtained from externalcofinancing sources in the form of official bilateral assistance, exportcredits, or suppliers' credits, to meet the foreign cost of the HVDCterminal equipment. This amount would finance about 47% of the foreignexchange costs, or about 23% of the total project costs net of taxes andduties. The balance of the funds required, totaling about US$308 millionequivalent, wilL be provided by GOI in the form of loan and share capital,and by NTPC from its own resources.
53. The proceeds of the proposed loan will be onlent by GOI to NTPC atan interest rate of not less than 12.52 per annum, with repayment over 20years, including five years' grace, under a subsidiary loan agreementbetween GOI and NTPC (Section 3.01(b) of Loan Agreement). Execution ofthe subsidiary loan agreement between GOI and NTPC will be a condition of
-21-
effectiveness for the loan (Section 5.01 of Loan Agreement). The averageinflation rate is not expected to exceed 8.5Z per annum over the next fiveyears. GOI's onlending rate to NTPC is therefore expected to remainpositive in real terms. The foreign exchange and interest rate risks willbe borne by GOI.
Procurement and Disbursement
54. Procurement arrangements are summarized in Annex IV. Most of themajor items of equipment associated with the 400-kV AC lines andsubstations under the project--conductors, insulators, hardware, metering,telecommunications, and substation equipment, and the construction of thesubstations themselves (US$150 million)--together with the supply anderection of towers and auxiliary equipment associated with theconstruction of the HVDC transmission line and converting stations (US$108million), will be subject to international competitive bidding (ICB), inaccordance with Bank guidelines. The main AC/DC terminal equipment(converting stations) would be purchased through negotiated contract inthe event that external cofinancing becomes available (para 53); otherwiseit would be procured through ICB. This contract, which also includeserection works, is eatimated to amount to US$176 million. The contractwould also include provision for the training of NTPC staff since the HVDCfacilities are being introduced in the Indian power sector for the firsttime. Contracts for the supply and erection of towers for the 400-kVlines (US$59 million), and the construction of buildings and other worksassociated with the HVDC converting stations (US$26 million), will beawarded on the basis of local competitive bidding (LCB); these componentsare not being financed from the Bank loan. Consultants for projectsupervision, including the engineering, testing, and commissioning of theproject, would be selected in accordance with Bank guidelines. Localmanufacturers are expected to be competitive for all equipment andmaterials contracts associated with the AC facilities and HVDC lines.Local manufacturers competing under ICB will be allowed a margin ofpreference of 15Z of the c.i.f. bid price of imported goods, or the actualcustoms duties and import taxes, whichever is less. All contracts costingUS$3,500,000 or more will be subject to the Bank's prior review.
55. The project is scheduled to be completed by the end of 1988, tocoincide approximately with the completion of the Rihand thermal plantwhich is currently under construction. Under the schedule for theprocurement of the equipment and material to be financed from the proposedBank loan, the first award decision is expected by mid-May 1985.Accordingly, advance procurement and retroactive financing of up to US$20million is being proposed to cover expenditures under contracts awardedafter April 15, 1985 and prior to loan signing, and in accordance withBank procurement guidelines, in respect of the supply of equipment for theAC facilities and HVDC line, and associated consultancy services (Schedule1, para. 3 of Loan Agreement).
56. The proceeds of the loan will be disbursed over a four and onehalf year period (FY86-90) and will cover 100% of the c.i.f. cost ofimported goods or of the ex-factory cost of goods manufactured in India,
-22-
902 of the civil and erection works subject to ICB, and 100X of the costof consultancy services associated with the HVDC facilities. Thedisbursement period for this loan is shorter than the Bank-wide averagefor power transmission and distribution projects, but is reasonableconsidering NTPC's experience in the construction of transmission linesand the advanced stage of project preparation.
NTPC Finances
57. NTPC is currently in the ninth year of an investment program bLgunin 1977 under which it expects to construct and commission by 1995/96 anumber of large-scale thermal power stations with an aggregate generatingcapacity of 21,580 MW and about 10,700 km of high-voltage transmissionlines. The Government's investment in this development has undergonecontinuous review during the past five years in an attempt to accommodatethe increased demand for power. As a result, the original investmentprogram, which was designed to provide generating capacity of 7,300 MW andabout 6,000 km of associated transmission lines at a cost of aboutUS$3,417 million, has been extended in stages by eight years through1995/96 and increased to about US$35,243 million equivalent. By the endof 1983/84, NTPC had an installed generating capacity of 1,800 MW.Financing for the increased investment program will come from NTPC'sincreased internal resources accruing during the extended constructionprogram (about 30%), from GOI in the form of long-term loans and equityshare capital (about 40%), and from foreign sources in the form of Bankloans, bilateral assistance, and cofinancing (about 30%). NTPC'scontribution to the investment is expected to increase to about 40% in thelatter years of the program. NTPr's investment program and financing planthrough 1995/96 are satisfactory.
58. NTPC began commercial operations in 1982 shortly after its first200-MW generating unit at Singrauli was commissioned. Since then, eightadditional 200-MW units have been commissioned--four more at Singrauli,three at Korba, and one at Ramagundam. Operations in 1982/83 were minimalowing to the stabilization requirements of the newly commissionedgenerating units. However, NTPC's net earnings for that year comparedfavorably with the forecast. For 1983/84, operating income and net incomeexceeded previous forecasLs and yielded a rate of return of about 11 onhistorically valued assets, which compares favorably with the 7% minimumrate of return required for this year (para. 59). The equivalent rate ofreturn on revalued assets, calculated on a pro-forma basis, is slightlyless than 9%. Cash generation measured as a percentage of average annualcapital investment requirements was only about 3%, but this low level ofcontribution was due to the fact that generation during the year was onlyabout 43Z of the potential output, mainly because of the time required tostabilize the units, and that 1,000 MW of the 1,800 MW year-end capacitywer2 progressively commissioned and in operation only during the last sixmonths of the year. Cash generation will increase significantly in futureyears (para. 61). NTPC's debt-equity ratio at year end is 26:74, which issatisfactory. Alt;.ough NTPC still needs to improve in accountsreceivables collections (para. 62), its overall financial performance in1983/84 and its financial position at year end were satisfactory.

-23-
59. Estimates of NTPC's future earnings are based on the assumptionthat it will supply bulk power to its customers at regional tariff levelssufficient to achieve high enough minimum rates of return to ensure itsfinancial viability. In accordance with agreements reached under theSecond Farakka Thermal Power Project (Ln. 2442-IN), approved in FY84, NTPCis to set tariffs at the levels required to achieve annual rates of returnof not less than 7% on historically valued assets for the period 1984/85through 1989/90, not less than 9.5% for the period 1990/91 through1994/95, and at levels sufficient to ensure its viability thereafter. Itwas also agreed that since the Government does not wish to use assetrevaluation to determine a realistic basis for estimating returns tocapital, a rate of return of about 15% in 1995/96 (which would beequivalent to a rate of return of about 7.5Z on revalued assets), based oncurrent projections, would be required. The progressive step-wiseincrease in the rate of return takes into account the schedule for thestabilization of new units, and the dampening effect on the rate of returnwhen large new investments are undertaken. In view of the high initialcapital investment in the early stages of NTPC's power development programand the time involved in commissioning generating capacity, this approachto tariff setting is appropriate. Similar measures will be adopted underthe proposed project (Section 4.03 of Project Agreement). On the basis ofcurrent projections, NTPC's rates of return through 1994/95 are expectedto exceed the minimum levels specified; in addition, its projected rate ofreturn of 14.7% for 1995196 is considered adequate to ensure asatisfactory level of financial performance in that year.
60. Under previous loans and credits, GOI and NTPC agreed to sell thepower from NTPC's power plants to its customers under contractssatisfactory to the Bank Group. Contracts have now been concluded betweenNTPC and the Delhi Electricity Supply Undertaking, the Damodar ValleyCorporation, the Electricity Department of the Union Territory of Goa, andall but two of the SEBs, with respect to sales of electricity from thefour major Regional plants-Singrauli (Northern Region), Korba (WesternRegion), Ramagundam (Southern Region), and Farakka (Eastern Region). TheBihar and West Bengal SEBs are not expected to receive power from theFarakka plant for some time, as the first 200 MW unit there is yet to becommissioned. Contracts in respect of these SEBs are expected to beconcluded, however, by August 31, 1985. The Electricity Department of theUnion Territory of Pondicherry is not expected to receive power from theRamagundam plant until the commissioning of the second stage, which beginsin early 1988. A contract in respect of this entity is therefore notrequired at this time, but will be concluded as appropriate in the eventit becomes necessary. The contracts concluded to date are interimcontracts only, since certain additional provisione--contract renewal,tariff revision, capacity charge, and NTPC's return on equity-need to beincluded. GOI and NTPC propose in due course to replace these interimcontracts with either individual or regional supply contracts (one foreach Region) that will provide uniform terms and conditions for the saleof electricity by NTPC to all SEBs and other customers within a region.Accordingly, GOI and NTPC will provide to the Bank, by March 31, 1986,revised electricity supply contracts incorporating the necessary
-24-
additional provisions with respect to the SEBs and other customers of theNorthern, Western, Southern and Eastern Regions. In the interim, theterms of the existing contracts will continue to apply (Section 3.04 ofProject Agreement).
61. With regard to NTPC',s future operations, power generation isexpected to increase from 1,109 GWh in 1982/83 to 106,161 GWh in 1995/96.NTPC's average tariff is expected to increase at an average rate of about8.5X per annum, from 32.30 paise/kWh to 93.22 paise/kWh, over the sameperiod. Average tariffs would be maintained approximately on par with thelong-run marginal cost of electricity generation. Operating income isexpected to increase from Rs 675 million (US$56 million) in 1983/84 toRs 42,236 million (USS3,520 million) in 1995/96, and net income fromRs 449 million (US$37 million) to Rs 25,622 million (US$2,135 million)during the same period, yielding financial rates of return on historicallyvalued assets ranging from about 9.4% to 14.7Z. Both the financial rateof return and the internal cash generation would increase to acceptablelevels of about 12% and 52%, respectively, by 1993/94. NTPC's projectedrates of return are realistic and achievable, and its forecast of futurefinancial performance and cash generation are satisfactory.
62. NTPC's capitalization as of March 31, 1983--which is the end ofthe financial year in which NTPC began to earn revenues--was aboutUSS1,254 million, divided betweeu GOI loans (including the onlending ofBank Group finance) and equity capital in the ratio of 21:79. In March1990, after the completion of the proposed project, total capitalizationwill be about US$15,299 million, with a debt-equity ratio of 34:66. Thedebt-equity ratio would increase slightly to 35:65 by March 1995, at whichtime total capitalization will be about US$33,133 million. Debt servicecoverage is expected to decrease from 3.5:1 in 1983/84 to 2.0:1 in1989/90, then to increase to 2.7:1 by 1994/95. NTPC's issuea sharecapital will rise progressively during this period from a level of aboutUS$1,305 million at the end of 1983/84 to US$14,419 million by the end of1994/95. NTPC's financial position, debt-equity ratios, and debt servicecoverage are, and will remain, satisfactory.
63. NTPC's collection of accounts receivable has been slower than isconsidered acceptable. As of July 31, 1984, outstanding receivables onthe average represented about 3.9 months of NTPC's total sales. Accordingto the terms of the bulk supply coatracts (para. 60), NTPC's customers arerequired to remit payment for power purchases within 30 days of receivingbills from NTPC. The contracts also require that customers open revolvingbank letters of credit in favor of NTPC for an amount equivalent to onemonth's power purchases. At present, five of the nine customers concernedin the Northern and Western Regions have complied with this requirement;none of those in the Southern and Eastern Regions has yet done so as bulksupply contracts for these were concluded only recently, only a limitedamount of power is available from NTPC's Ramagundam plant, and NTPCs Farakka plant is yet to be conmissioned. NTPC has encountered resistancetrom some of its customers concerning the opening of letters of credit,because at this stage of development of the transmission network, powerfrequently has to be routed through one or more States before it reaches

-25-
its ultimate destination, and as a result NTPC is not able to ensure thatthey receive their allocated shares of power. In view of this situation,it has been agreed that the required letters of credit should be openedfor each NTPC customer within 30 days of their receiving their allocatedsbares of power. In the meantime, NIPC will continue to make every effortto obtain letters of credit from those customers that have not yet openedthem. With regard to the arrears in NTlC'Bs accounts receivable, thesehave arisen primarily in connection vith NTPC',s sales of electricity priorto the signings of the bulk supply agreements vith its customers, duringwhich time electricity was being sold at interim rates vhich were subjectto subsequent aajustment. By December 31, 1985, NTPC will provide theBank with repayment schedules drawn up in conjunction with each of thecustomers in arrears in its payments, with the objective of liquidatingthe outstanding arrears within two years. NTPC will also ensure that withrespect to its sales of electricity since the signing of the bulk supplyagreements, its total monthly accounts receivable will be maintained, fromMarch 31, 1986, at a level equivalent to not more than two months'. sales(Section 4.02 of Project Agreement).
Proiect Justification and Risks
64. The proposed project is justified as part of the least-costhigh-voltage transmission system for the Northern Region. Long-termplanning studies of the region'.s high-voltage transmission system carriedout by CEA in 1982, with the assistance of HQI, showed that of the threeoptions considered (expansion of existing 400-kV network, introduction ofa 735-kV grid, and a combined AC-DC system), a combined AC-DC system wouldprovide the least-cost option. The proposed project was formulated onthis basis. The proposed national power transmission studies to becarried out in conjunction with the project are also expected to confirmthe need for a transmission line between RihAnd and Delhi in anycomprehensive national transmission plan, given the geographicdistribution of electricity supply and demand in the country. Theeconomic rate of return for the Northern Region's expansion program isabout 13Z, according to benefits based on incremental revenues at averageretail tariffs, and quantifiable industrial and agricultural consumers6,surplus. The actual rate of return is likely to be considerably higher itdomestic consumers', surplus or industrial output made possible Dy thealleviation of power shortages is taken into account.
65. Project risks are no greater than can normally be expected inoperations of this type. Risk of slippage in the implementation scheduleis expected to be minimal in view of NTPC's previous experience withtransmission facilities construction. In addition, suppliers of HVDCterminal equipment have indicated that terminals can be commissioned on aturnkey basis within 36 months of the placement of orders. The HVDC linealso is simpler to construct and install than the AC lines. NTPC willclosely monitor the implementation of the proposed project and the ongoingRiband thermal power plant to ensure that the commissioning of these isappropriately coordinated.

-26-
PART V - LEGAL INSTRUMENTS AND AUTHORITY
66. The draft Loan Agreement between India and the Bank, the draftProject Agreement between the Bank and NTPC, and the Report of theCommittee provided for in Article III, Section 4(iii) of the Articles ofAgreement of the Bank are being distributed to the Executive Directorsseparately.
67. Special conditions of the project are listed in Section III ofAnnex III. Execution of the Subsidiary Loan Agreement between India andNTPC has been made an additional condition of loan effectiveness(Section 5.01 of Loan Agreement).
68. I am satisfied that the proposed loan would comply with theArticles of Agreement of the Bank.
PART VI - RECOMMEMDATION
69. I recommend that the Executive Directors approve the proposedloan.
A. W. ClausenPresident
May 7, 1985

AID= IPage 1 of 5
TAILS 3*
INDIA _ UCILAL UUC&T0 DATA NEMTY1151* ~ ~ ~ ~ ~ mREPO 089013 (WEEUIHeD, AVEUNAcm) Is
ROUT (OST AECWT STINTO) fb39k ,L Low INCOME KIDuDI INCOE
1 1970^-I rArolk xi ML" ASIA tAc FACrrEC LIlA & PAC
LIA CSI*S. -)--TOTAL 3267.6 3267.6 3287.6ACRICULTtUAL 1763.S 1780.5 1312.3
CuNM CAPITA (CM) 40.0 £O0.0 260.0 278.4 1091.2
-ERE cmsmuwnm - cnnt(KILOuS OF OIL TUIVALEWT) ".0 113.0 15.0 272.0 567.3
inaneU -M VITAL STATSTICOPOPULATION,ID-TAR (TlOtAMS) 4343*9.0 54759.0 719n .0URDA FOPUATIfO (Z O TOTIL) 18.0 19. Z4.1 21.7 34.7
PDPCIAT101 7110J=tlOSPOPULATO IN TER 20l0 CHILL) 9.4*.STATIONARY POPUATION CHILL) 17D7.2POPULATION 11u11 1.7
POPULTION amouPER SO. DI. 132.3 1664. 213.4 114.6 243.9Pri SQ. 10. AGR1. LAN 24b.4 307.5 337.1 345.5 1735.1
POPATtION ACE YSCIW E (r'0-14 YRS 40.9 42.7 39.3 35.8 39.0
15-4 nS 54.5 s4.2 57.4 59.8 57.6S AND AOVE 4.6 3.1 3.1 4.3 3.3
POPUIATION CRO1 RA MT (2)TOTAL 1L 2.3 L22 1.9 2.3UNA Z.5 3.3 3.9 4.1 4.3
CRUMt *8D MATU (PEA TOM) 47.7 41*4 31.2 21.7 30.1CRUE DATH RATM (PE ?OUS) 23.6 17.8 12.7 10.1 8.3GROSS REPROCUCflO RATE L9 2.3 2.2 1.8 2.0
FAMLT PLAIMISACCEPTOS LANUAL (THOis) 64.0 3782.0 6826.0USERS CZ OF MAI oMN*) 11.7 2S.0 .. 52.7
FMS An maTRTlsINDEX OFOOD ram PE CAPITA(1949-71-100) 91.0 102.0 101.0 112. 123.0
PER CAPMA SUPPLY OFCIAIRIES (2 OF EWIRbDiS) 9S_0 91.0 S6.0 97.7 114.4poiSim (CPSS PM DAY) 54.0 50.0 4&0 56.8 57.0
OF WHICH ANDL ALD P1LSE 17.0 15.0 13.0 Ic 14.9 14.1
CWILD (CCrS 1-4) DmTh 3TC 21.2 20.7 11.0 9.6 7.2
LIV EXPECT. AT 13M (IEA) 4Z.5 47.5 54.6 60.0 60.4IWNANT HOIT. RATE (PER 7us) 165.0 9o 940 83.8 66.3
ACCESS 1T SATE WATER (POF)TOrAL - .. 17.0 33.0 Id 3L.9 37.0CuAnm .. 60.0 83.0 Fd 70.9 54.6
AL .. 4.0 20.0 22.1 26.4
ACCESS TO XRta DISPOSALCl or rPOPLATION)
TO^tL .. 150 20.0 IL 41.3INs .. 8S.0 87.011 7LU *7.4RUUL .. LU Lo 4.6 33-3
POPULATION PEt PYSICUM 4850.0 4890.0 3690.0 If 3484.2 7749.4POP. PER NUEc PERSON 10980.0 L 7420.0 5464.W * 793.i 2460.4POP. P HPITAL MM
TOTAL 21800 1650.0 1290.0 If 106LS 104.2uma. .. .. 370.0 F 29B.0 651.2RURAL .. .. 10420.0 599L.4 2594.6
ASEISIS PM UOISPlTAL 3D .. .. .. .. Z7.0
AVERAE SIZE Or IHOUUEIUDTOTAL 5.2 .6 3.2 1aURB 5.Z LG6 4.87 ,.RIMAL 5.2 5.6 L 3 T..
AVUSAE 10. OF PEFOIROOMTOL L6 LO..Una 2.1 LS2RURAL 2.6 2.8
S A TO ELEr. (2 OF NettleS)
m .. .. . ..

ANNEX IPage 2 of 5
It A 5 L I 1%
7,NDL - SOCIAL n Aro DATA S
KOST (M0M R%Cl3! ZUTDIXA) li,soLk O/.k ~ LW INCU NZWDi &
II6O& LL0111 A= a ASIA 4 PACIC ABIA PACIFIC
ADMTED ENROUJ43a RATIOSrI4AlT TOTAL 61.0 73.0 79.0 17.4 102.0
HAL1E 00.0 90.0 13.0 110.3 105.9?LA1Z 40.0 56.0 64.0 53.7 91.2
SECONMARIs TOrAL 20.0 26.0 30.0 35.9 46.0AIZ 30.0 36.0 39.0 44.6 46.7
FIAz 10.0 15.0 20.0 26.6 43.1
VOCATIONAL (3 or SUCONDART) 2.8 1.0 0.7 / 2.2 17.5
PUPIL-E R RATWIOPRDIAY 4.0 41.0 54.0 38.5 31.8SECONDARY 16.0 21.0 .. 15.7 MS.5
ADULT LITERACY UTE (Z) 27.6 34.1 36.2 53.4 72.9
PASSENCK. CARS/THOUSAND POP 0.6 1.1 1.4 0.9 10.1RADO ECEIVE1RSI ,USAID POP 4.9 21.5 43.6 112.1 113.6TV hECEIVERS/ITNUAND POP 0.0 0.0 1.7 15.7 50.1Ns rAPER ("DAILY GENERAL
INTEREST") CIRCULATIOIPER TROUSND POPULATION 10.6 16.2 19.4 A 16.2 53.9
CINIQ ANUAL ATTENDANCICAPITA 3.2 6.2 3.7 ^ 3.6 3.4
TOtAL LABOR FORCE (ThOUS) 185951.0 219194.0 242169.01E313 (PIcr?) 30.7 32.3 31.8 33.3 33.5A=ORXCLTURZ (PERCENT) 74.0 74.0 71.0 69.6 52.2INmUSTRY (PERCEIT) 11.0 11.0 13.2 13.6 17.9
PAiTIICIATION XATE (PERCENT)TOTAL 42.8 40.0 39.4 42.6 3A.7KALZL 57.0 52.4 52.0 54.7 50.9PIKALE 27.3 26.9 25.9 29.8 26.6
ECONOlIC DEPENDENCY RATIO 1.1 1.1 1.1 1.0 1.1
YORC OF PRIVATE INC@RZCEIzD BY
HIGHEST 5Z OF HOUSEHDS 26.7 26.3 A 22. 2J 22.2 22.2RICHEST 202 or HousEOLDS 51.7 41.9 49.A4 44.0 48.0LOWEST 2OZ OFHUSEOLDS 4.1 6.7 [ 7.0O 6.4 6.4LOWEST 402 OF W uRoLLS 13.6 17.2 It 1 6
.2
1t 15.5 15.5
ESTDITD ALSOLUTE POVMRY ClOELEVEL (USS PER CAPrTA)
UR6AN .. .. 132.0 A 133.9 18.6RURAL .. .. 114.0 111.6 152.0
ESTAMEO RELATIVE POVERTY INCONELML (USS PER CAPITA)
URAN .. .. .. .. 177.9RAL .. . .. .. 16.6
ESTIDATED POP. BELOW ABSOLUrEPOVERTY ENCaE LEVEL (Z)
URBAN ., ,, 40.3 f1 43.8 23.4RURAL .. , 50.7 51.7 37.7
NOT AVAILAJI£NO APLICABLE
NOTES
/a 7be group average for each Indicater are popcation-¶miahtd ariteb_tc memo. Coverag of countriee among theindieaters depends an availabilit of data and is not imfer_.
/b Danem otbezwire noted. c Dta for 1960" cefer to *ay Fear betwen 199 and 1961; "Data for 1970" between 1969 md1971; ad data for "ibst Recent ZEtiate" betwen 190 and 1982.
/c 1977; /d 1976; /e 1975; /f 1978; L 1962; /h 1979; A 196-65.
im, 19Us
-
AM=fZ I-Slam- bs~ SbCSb iije cof 5
beete. .i.e.l .. tooe lof llee.cm. an dam.leswedseso. Aemm wamem
lb Csheeown guls emm 45) lsms aumeIp Ers 4oa. mam swank man (Ni ml? urn .c mM..StWSmsema ue ~9a
al9Wb ie le b llsf t .mtw. msIsm l eiess -l blble .1 dIue to Me o beEst. -win mm .esetetbe go InIL.113 MeSo 9S .hltb a? imsamS spml s l 'Ak el ang *dlginet a e elmf e a. met me
.1. M wdeleft L5beoo arm kind lal betin . af beliS mae.a ee beS, lbelisle. ~ ~ ~ ~ ~ ~ ~ ~ ~ ~ ~ ~ ~ ~ ~~~~~fonefe ludort-ro 16mpllll belee .1 eeSwIfleerl e was teqeor.ell St Itmeel ad5 mm 5..mo. mu.=. ..slaeeS moom. sealla sr.m be
(eUPCwlT(Ib. - bset alk alMoaa de "-ILse "M. p WMsesIMIG..I 1e.14, be pnno1 semes be "spessoll bIlld VA~~ eseeL esled~-o -hM 1md . ales (115541 eeetsSlleea . bupllele S e,eebelambreetme.el .5l1.lto". low. be 19W iee. Ip at 119W a* a.51e1. bue imali psetilgm sIleePlpI oewale
- S Ms aeslebe heelg %-md. mm. andlod bodd be
ebeep .. S-b It.selI. PA1R onows Md be Set- mees =lIeSO. ulsAM% sll M& Se.) bsa .dll 55ee sbummila beOa OWeebees salsealelly Is hiLegftm .l1 elIequeib see opplaee IN%5 ibetd& C lIld =MP 1 mibem leelItl.t.
Mesaso mwe N*P or lbemom.l 9..
ileisnaieCsSetees be ~~~~~~~~a.sr be. mis. a b=ouMi - Iw- or aw weem &"Km" goMe onowton; glm IWO. OM IM dwo, ~~b 1m*.I he "Ififiet"& iwnesm.
I JN9__ _ _ _ _ _ _ m m Mbe
besle emEg LIb .eeel 1 lolnbe' eta ames e lees5uyebCea.Idlmal -s.9l wab berem ad
eee. b m ... l, be tmleopsao ali11fe .e ..el Ombele a91 q 11gr. 1 bmssILiel.eIbll? ase9est e
eM-L daises es IsIILliF "ems"e B. Im M mal on *alspPt-am ff pssem me Meps I. elm sonoi osb of abo ele.milmee..at ow"eselsl, be fttleelstoonfinm he sesIsb serum
bee. bee e5eeism Ion emi.i 6le lea asrnoi sb p11m
?it el.Sb. PctviSbI e -eWI nlesber. beUbee 5.11r
emIl. an is.- lb MMebb, peMisslsl ca Sb newsumi a a. elm me rots ol b .. Ae.- a. .95141.1 odoesl Mo.beag. .Wa :leei= mi.e"Inl.e5.do sis MqleplIlis me Ilon ae.t Anot be5 -Ie~lme be - 5mwsl. no a.sl9 semolet.WMt e bwe.-dt--. 4StIonLes. orel-lep ra seeleee e. on dee -1lM__. P-..ee Ise Ml slIm, Aesebsebel~l.1l~mlin-st. ee oood Ca p.selsanto Sron 9.5m bevolio PI-to"b 8fS. ee.l. 10r.eidbe B-Bleba looffbeerns teiieb ii.wBe. e,sMPMe-5eeel letelIIs be be. sllioesie Elm 9wileMotl meS Itse efr. I .-Mr mein onlonxonloon eeebe Sbbe. me :110f, cb oft Mnseesis "Win h-e e.ab Mal. lb Isb"ieI, -e551mionmesa of 5 PeIMleele is lb- res j Is mesd M a bee .1 a.n -ee 9.- bbllS l bsef"obegInorse "MI e.. Meseelle Itol seseleebu is a. pm j, elm see oee !"M m ba esm. p-em 1.1eea. e9owtes elm ft..lslsr melee 4 eISplesm.ess i he.f ese.L lInA nelp, - moansweesmee.lmea, leee-lv -4two-m
.l IO. lst, be ISe de.. iff"sr., eIqeeI-UeeoeeS (b .. ebel4* ~5ed- elmhe e.leele.el Ie e semeeo - s.e -l .llee5e Moft (Itee.. .a Om So.
ItIleC-lP.= .1 Wsellow
melalal 555. SIb fib 5452 bee. - f ."Mo
2tCM)- -m- so-l Pe." .. .1 eebe ISM"" . og-bv- .- on WI ebrb SIt tinea. atmeee.. C .1)0 be sib..).alme beetsdow Is Mone bev ad eos ofte slianelles a9 robe
,.esleaa19W 1975.j be lobw ils.b" -"-. 1M-4 mg .. obUma" ftme. -t WM -- M -
,eselesleeos 5S J1. be - OM doa. ow"Goo Anbe -hometIbslh Weeee II lielad - Am.1 am" Mor Monsoon M ~~ ~ ~ beMeeos,N a sensuli I r.bm
ML-= st oafln .99r.. 6-se A is lonsmelee be so Psa. don ok fbetel St 15wlaso m. Is m.
e-ms.t Wain"M-W e- -~~~~~e~~ - ~ L- i a . 9 sie. no0s, idlWO at Is aqsoes lobs Iora-ems mk.
.1 kIl .e~ eebb els. mSoeeCeertm tall , e.e - mea a. m.t Sp59Wa. lIMe.. esli dalE a. pm. Ibbul.~~~~~~k..b sM.b e- a ~~~~ am metl~~~~~~~~~~~~~~~~~~~on belIe..ou
bubme Sb~ ~ ~~ _11. 11nal.1 0036bn" reei olesWIb ee-MU.0,21 esste muodsu
C - ml.,. - imesa ~~, am. 1mb saet tSte Ms ueeeo Monaee le0 te.
U - -b d V-g.."esConoe pm bee.pml-e.. ele... G.e.- - eeemm: or teed lber leseI lson. two be M9 i.le.um esMi of oaw) WAlao m NW sbl,b *mde. Mossous (e4am W.. - lob emsn IS Ma~ Mdeela me sb
esilee be s a mimi). inowe sei -. cW Am muep I. on"llp mr e A. M pseemelaSI on" "sh- lmn Mel. gm1eas bebe emw pownw, ties -lowl Ifflel. £95 be PM be m151 afts. mja mle W
I-M M "..mo !Lla t" e-" on- MOW foelmle o
onnow, ___________ _________...___M .. W ito swimes - 1 lull mle. be- lob bees..wo9w. JMLIS.e mpUe esonvou iomul pookou.%.~e am~ 5Ww INr, be glan o, Nos. ,11mm We." tIPs lien, besbeo mu-.esser. bef Monn iS e. beS O =es1.- -a1m MAMAl Sa. IMo. eiuee emo oogeelo a. 1mbela b to" 1" "MA69 AS
mu me b l 5, ml~.. ~elbslee1-M-M e- bmeeGltf. 8 ~ e m We0zbI .1d lebubet I4e I e
Mw beA 1A "dl M-".e Iwo sesolal be0 do.e 5 eumh
*l~ .90w...or ISbi lebs-te " 9W0 9 be mu-d odes bep.5. sea.. . bsSasono .muid "o bebemft. Noon
Moolos Sb Wool me- mu .9 flomeC emS osesho be U u de5s m be Psbme~-M uleme lSe"2t, isb. be
ibd" food bsi imipa 1l.4. "M1 be lbs das.n- - 5______ _____ _____ _____ _____ ____L- "eset. 'R Ond bei A SM. 5 mS In a el b. cc
an .W M -. 9CmwC.-d2laId me ~eI beb be tqqt~m,) -~*dse an-P is ood ga's M -W Pt
ma.. beedou 4-11a Cu t.blei . ams owam doe. meem"es da.su.? %beslow b" iib los Sb -11
I EL- gso-dw soow se poe Mr Uitt noamete P- nn es...i Mele (-eb- be -meL a.WeS.b
~~ 1915.mmld - lOts be am:e be..
1metf Mp (ml5-Iwo.eL ilf Me no; dmm l.siae em es
Cm . 6-wb. M.Ann - bee. l.1. on eMMfSin. s~ 9.i-A Mono memoift, mm wld l W.1ma ~b.W a
........ a.lal i bl a al,l.S m.
a. -13MISIe, be m) easamsconon" mu knosebe -bt I -St bmm el-S, a a.m .1' gse Monson be

lea 4 of S
OW PU CAPITA Il 1US8260 St
cOS DtBU C Snl KU 19"315 k/ AIAL 0I OF g. M ccitmat mlen) is5/91 60161.645 65/61469/70 7o1n-74/75 75/76-7910 0/61-2UW/3
MX BID. X
GO at Market Prices 1S9.81 100.0 3.7 3.6 3.7 2.9 4.1 5.1Grog: Domaotic Inv t 45.94 24.0Gro- Natina Saving 43.17 22.7Currte Acout 2lalce -2.17 -1.5
OUTPUT. lABO FORCE AIND PRDDCTIrV2 Dl 1981
Value added Cat factor cost) Labor Fore sl V.A. Pr Worker0s5 UIn. X 1 7T of Iioi l AVerag
Agriculture 52.5 35.9 172.7 70.6 304 51Industry 34.5 23.6 31.6 12.9 1092 183Servceas 59.2 40.5 40.3 16.5 1469 246
tell,Averag 16.2 100.0 1.6 100.0 51 100
GOV 71A1C
CGaral Covermat Central Cowe tRe. DIn. S of 0P RS. Bin. *Z of GDO19631/34 193/84 1979/O-1983SK lS83/B4 1963/84 1979/W-1963/4
Current RUeLipts 378.54 19.3 19.5 201.67 10.3 10.3Curre:. Ez9enditures 397.12 20.3 19.4 225.42 11.5 10.9Curr"et SurplunjlDficit -18.58 -1.0 0.1 -23.75 -1.2 -0.6Capital Expenditures ft 149.66 7.7 8.0 114.12 5.8 5.8Externel Assistance (net) d1 19.16 1.0 1.1
:DNIT. CFRDIT AND PRICES 1970/71 1975/76 1978/79 1979/80 1960/81 1981/82 1982/83 1913/3" Januar- 1914 January 1965(R Billon outstanding at end of period)
Money end QuL Mony 109.8 224.8 401.1 472.3 557.7 627.5 728.7 860.9 835.1 993.9Bank Cradit to Covermnt (net) 54.6 106.3 159.3 200.1 257.2 306.3 353.8 407.7 403.1 483.9Bank Credit to Com_ecil Sector 64.6 156.2 255.3 310.1 366.4 434.6 517.1 612.7 575.5 685.0
(P*erentag or Ind Numers) A[n-Je 83/8& Anril-Jan 84/85
Money nd Quasi Money as a 2of GOP 27.3 30.3 41.1 44.1 43.7 42.5 44.5 44.0
Wbolesale Price Index(1970/71 - 1w) 100.0 173.0 185.9 217.6 257.3 281.4 288.6 315.2 313.6 336.7
Annual Percentage changes in:
--boleale Price Xndex 7.7 -1.1 - 17.1 18.2 9.4 2.6 9.2 9:2 7.4Bank Creit to Government (net) 13.0 22.7 16.0 25.6 28.5 19.1 15.1 15.3 16.9-J/ 23.2 hiBank Credit to Comercl Sector 19.4 22.7 20.3 21.5 18.2 18.6 17.7 18.7 13.8 1I 15.6 h
a/ The per capita GNP estateo is at market prices. sing World lank Atlae mtbodolOgy. bae period 1981-83.All other conversions to dollars Z. thti table are at the naerag exchage rate pre-alling during the period covered.
b/ Quick Eati_mtee, Central Statisticai Orhenizatio0.cl Coeputed fro trend line of GNP st fctcor cost series. inlding one observation before first yar and coe observatio after
lat year of listed period.dl World Bank estiates of net diabursement of ceneamional aid and IBRD.*t Trnsfers betmm Centre and States have bean netted out.f All loan and advenea to third p rtiam have been netted out.S' Percentage change from end-March 1983 to end-Jn.84.ht Percentage chane fro end-Mrch 1984 to end-Jan.85.V Total Labor Force and percentae breaUdown frm 1981 Cseus. E=cludes data for Asan.
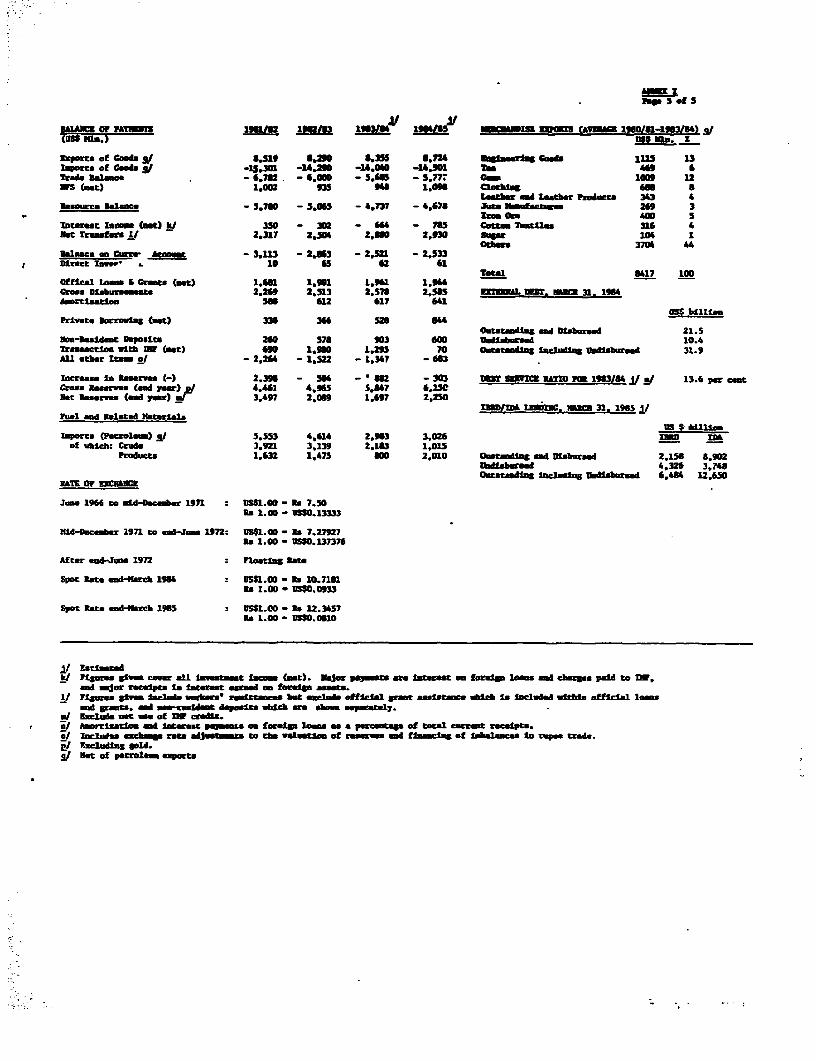
74P5 of 5
jI 11P0TH= o 1nom w00 n CAY 1910/a-1"316)t
Rgports of Good jf 3.51 2 8.355 .724 h _ine U C s 12S 13lwores of fONda -25.301 -14.2 -14.0W -14.301 Te 45 Trae BEL.O - 6*M2 - G.0 - S.4S - 5.777 1009 12Ws (net) 1.002 "5 1.093 a etlbs 343 a
Leat.r and Leather productis 343 4Usmourct Umle - 5.710 - 5,065 - 4.737 - 4.678 Mn _factures 249 3
X. 0g. 480 5interest Ineam (ast) hI 350 - 302 - 44 - 75 Cott Textils 316 4Noe Trsfer. 2,317 2.50D Z,6 2.930 Sar 104 1
ate 3704 ZBelince an Curr CCOe - 3.13 - 2.53 - 2.521 - 2,533Direct aver, 10 f5 62 61
Total 8417 100Offical ans & Grams (nut) 1 190 L.9U 1.914Cress Disbuummta 2.269 2.513 2.578 2,585 MM2AWL 1313WACE 31. 194hmrtit 5so 412 17 641
Us$ billionPivate Borroufag (met) 3W 34 526 64
Omlatanding and Ulubursed 21.5No-Residet Deposit. 240 578 903 600 10.4Iransctie with W (net) 690 1,6 1.23 70 etd ludg ikdlsburued 31.9All otbhr Ier_ El - 2,24 - 1,522 - 1.347 - 683
incre in Reserves -) 2.396 - 50 - 3 2 - 303 MT Sancz Raw lOt 19384 1/!Y 13.6 per centCross Iceerve. (sed yew) p/ .42 4,945 5.87 6.150Net Reserves (snd yeer) . 3,497 2.069 1.497 2.250
Puel and Relstud Materials
IMPrtS (P0eroleu) SI 5.553 4,614 2.963 3,026 16 -s
of whch: Crud. 3.921 3139 2.U3 1.015Products 1,632 1.475 600 2.010 O.tanding a DIsbursed Z.158 8.902
Wdiabota.d 4.326 3,748Outstanding including IbiUraed 4.484 12.650
RATE OF RICUMNEI
0use 1966 to id-Decmb 1971 : nSS1.00 - Re 7.50Rs 1.00 - IS50.13333
Mld-OecDer 1971 to <-jm 1972: 1SS1.00 - fe 7.27927Rs 1.00 - 0580.137376
After end-Ja 1972 : latigs Rate
Spot Rate ead-March 1984 : US$1.00 - Rs 10.71Rs 1.0D - 1R58.0933
Spot Rate end-Mrh 1985 : USSL.00 - Re 12.3457as I.00 - 0D0.04810
JjEstimatedt Fgurs givm cewr Al Investet ncom Cnt). Mejor pVpta are intert - forig loans aod chars psdd to DV,
and maor receipto i cerms ear_ed on foreig I/ Figures SI"e lude secRet' amttmas but minde officl I sietanc sdlnh Iseluded within official Loans
ad grants. ad m-r.slden depoeits _lae a boeh sepeaatly.01 Enlude et we of WU credlt.*I ~ptation and Inters peymans an foreig lo. ase a percentag of toal curent receipts.o/ Includes exchanie ret adjutors to cb valuatioe of reser_e and f -nancin of S 1bmacas In rupee trad.
[ RIKxludlng 8O.14n ot of petrolsi exports

ANNEX IIPage 1 of 4
THE STATTUS OF BANK GROUP OP1RATIONS TX MIA
A. STATEMT OF BANK LOANS AID IDA CREDITS(A. of September 30, 1984)
USS millionLoan or Fiscal (Net of Cancellations)Credit Year ofNo. A- Aroval Purpose Bank IDA iJ Undisbursed Zj
50 Loans/ 2,1640 -.93 Credits fully disbursed - 5,535.2
482-IN 1974 Karnataka Dairy 30.0 8.15610-IN 1976 Integrated Cotton Development - 18.0 0.03
1251-IN 1976 Andhra Pradesh Irrigation 145.0 - 24.941273-IN 1976 National Seeds I 25.0 - 11.191335-IN 1977 Bombay Urban Transport 25.0 - 1.17
680-IN 1977 Kerala Agric. DevelopmetL - 30.0 8.45682-IN 1977 Orissa Agric. Development - 20.0 1.65690-IN 1977 West Bengal Agricultural
Extension & Research - 12.0 7.321394-IN 1977 Gujarat Fisheries 14.0 - 2.62720-IN 1977 Periyar Vaigai Irrigation - 23.0 1.52728-IN 1977 Assam Agricultural Development - 8.0 1.34747-IN 1978 Second Foodgrain Storage - 107.0 52.65761-IN 1978 Bihar Agricultural
Extension & Research - 8.0 4.931511-IN 1978 IDBI Joint/Public Sector 25.0 - 1.721549-IN 1978 Third Trombay Thermal Power 105.0 - 3.60788-IN 1978 Karnataka Irrigation - 117.6 37.38793-IN 1978 Korba Thermal Power - 200.0 30.11806-IN 1978 Jamuu-Kasbmir Horticulture - 14.0 9.91815-IN 1978 Andhra Pradesh Fisheries - 17.5 8.40816-IN 1978 National Seeds II - 16.0 4.861592-IN 1978 Telecommunications VII 120.0 - 15.10824-IN 1978 National Dairy - 150.0 43.85842-IN 1979 Bombay Water Supply II - 196.0 141.11844'-IN 1979 Railvay Mbderaization
& Maintenance - 190.0 25.05848-IN 1979 Punjab Water Supply & Sewerage - 38.0 5.28855-IN 1979 National Agricultural Research - 27.0 14.06862-IN 1979 Composite Agricultural Extension - 25.0 2.94871-IN 1979 National Cooperative Development
Corporation - 30.0 0.831648-IN 1979 Ramagundam Thermal Power 50.0 - 50.00
874-IN 1979 Ramagundam Thermal Power - 200.0 10.71889-IN 1979 Punjab Irrigation - 129.0 38.32899-IN 1979 Maharashtra Water Supply - 48.0 6.72911-IN 1979 Rural Electrification Corp. II - 175.0 4.45925-IN 1979 Uttar Pradesh Social Forestry - 23.0 2.24954-IN 1980 Maharashtra Irrigation 1I - 210.0 42.74961-I1N 1980 Gujarat Commnity Forestry - 37.0 6.51963-IN 1980 Inland Fisheries - 20.0 16.07981-IN 1980 Population II - 46.0 27.63
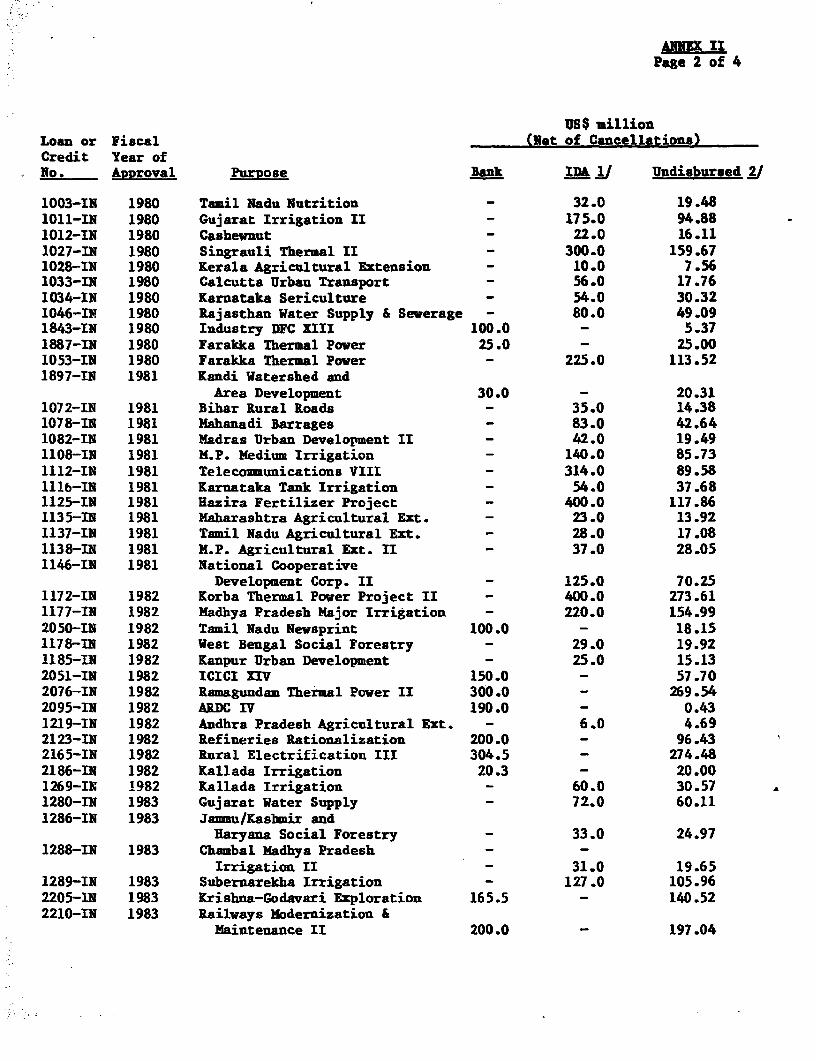
Page 2 of 4
US$ millionLoan or Fiscal (Net of Cancellations)Credit Year ofNo. Approval Purpose lank IDA jJ Undisbursed ;J
1003-IN 1980 Tamil Nadu Nutrition - 32.0 19.481011-IN 1980 Gujarat Irrigation II - 175.0 94.881012-IN 1980 Cashewnut - 22.0 16.111027-IN 1980 Singrauli Thermal II - 300.0 159.671028-IN 1980 Kerala Agricultural Extension - 10.0 7.561033-IN 1980 Calcutta Urban Transport - 56.0 17.761034-IN 1980 Karnataka Sericulture - 54.0 30.321046-IN 1980 Rajasthan Water Supply & Sewerage - 80.0 49.091843-IN 1980 Industry DFC XIII 100.0 - 5.371887-IN 1980 Farakka Thermal Power 25.0 - 25.001053-IN 1980 Farakka Thermal Power - 225.0 113.521897-IN 1981 Kandi Watershed and
Area Development 30.0 - 20.311072-IN 1981 Bihar Rural Roads - 35.0 14.381078-IN 1981 Mahanadi Barrages - 83.0 42.641082-IN 1981 Madras Urban Development II - 42.0 19.491108-IN 1981 M.P. Medium Irrigation - 140.0 85.731112-IN 1981 Telecommunications VIII - 314.0 89.58111h-IN 1981 Karnataka Tank Irrigation - 54.0 37.681125-IN 1981 Eazira Fertilizer Project - 400.0 117.861135-IN 1981 Maharashtra Agricultural Ext. - 23.0 13.921137-IN 1981 Tamil Nadu Agricultural Ext. - 28.0 17.081138-IN 1981 M.P. Agricultural Ext. II - 37.0 28.051146-IN 1981 National Cooperative
Development Corp. II - 125.0 70.251172-IN 1982 Korba Thermal Power Project II - 400.0 273.611177-IN 1982 Madhya Pradesh Major Irrigation - 220.0 154.992050-IN 1982 Tamil Nadu Newsprint 100.0 - 18.151178-IN 1982 West Bengal Social Forestry - 29.0 19.921185-IN 1982 Kanpur Urban Development - 25.0 15.132051-IN 1982 ICICI XIV 150.0 - 57.702076-IN 1982 Ramagundan Thermal Power II 300.0 - 269.542095-IN 1982 ARDC IV 190.0 - 0.431219-IN 1982 Andhra Pradesh Agricultural Ext. - 6.0 4.692123-IN 1982 Refineries Rationalization 200.0 - 96.432165-IN 1982 Rural Electrification III 304.5 - 274.482186-IN 1982 Kallada Irrigation 20.3 - 20.001269-IN 1982 Kallada Irrigation - 60.0 30.571280-IN 1983 Gujarat Water Supply - 72.0 60.111286-IN 1983 Jammu/Kashmir and
Raryana Social Forestry - 33.0 24.971288-IN 1983 Chambal Madhya Pradesh - -
Irrigation II - 31.0 19.651289-IN 1983 Subernarekha Irrigation - 127.0 105.962205-IN 1983 Krishna-Godavari Exploration 165.5 - 140.522210-IN 1983 Railways Modernization &
Maintenance II 200.0 - 197.04

ANNEX IIPage 3 of 4
US$ millionLoan or Fiscal (Net of Cancellations)Credit Year ofNo. hworoval Purpose Dank IDA 1f Undisbursed )
1299-IN 1983 Railways Modernization &Maintenance II - 200.0 177.00
2241-IN 1983 South Bassein Gas Developmect 139.3 - 133.711319-IN 1983 Haryana Irrigation II - 150.0 114.381332-IN 1983 U.P. Public Tubevells II - 101.0 89.791356-IN 1983 Upper Iadravati lydro Power - 170.0 148.382278-IN 1983 Upper Indravati Rydro Power 156.4 - 156.011369-IN 1983 Calcutta Urban Development III - 147.0 132.101383-IN 1983 Maharashtra Water Utilization - 32.0 26.952308-IN 1983 Maharashtra Water Utilization 22.7 - 22.642283-IN 1983 Central Power Tranmission 250.7 - 250.072295-IN 1983 Riualayan Watershed Management 46.2 - 45.892329-IN 1983 Nadhya Pradesh Urban 24.1 - 24.041397-IN 1984 Orissa Irrigation II - 105.0 83.201424-IN 1984 Rain£ed Areas Watershed Dev. - 31.0 29.371426-IN 1984 Population III 70.0 66.231432-IN 1984 Karnataka Social Forestry - 27.0 25.572387-IN 1984 Nhava Sheva Port 250.0 249.382393-IN 1984 Dudhichua Coal 151.0 150.622403-IN 1984 Cambay Basin Petroleum 242.5 241.902415-IN 1984 Nadhya Pradesh Fertilizer 203.6 203.091483-IN 1984 Upper Ganga Irrigation 125.0 117.381496-IN 1984 Gujarat Nedium Irrigation 172.0 164.142417-IN 1984 Railways Electrification* 280.7 280.702442-IN 1984 Farakka II Thermal Power* 300.8 300.80
Total 6,526.3 12,268.3of which bas been repaid 1.350.8 173.0
Total now outstanding 5,175.5 12,095.3Amount Sold 133.8
of which has been repaid 133.8 - -Total now teld by Bank and IDA 5,175.5 12,095.3
Total undisbursed (excluding *) 2,712.69 3,494.35
IJ IDA Credit amounts for SDR-denominated Credits are expressed in terms of theirUS dollar equivalents, as established at the time of Credit negotiations and assubsequently presented to the Board.
V Undisbursed mnounts for SDR-denminated IDA Credits are derived from cumulativedisbursements converted to their US dollar equivalents at the SDRIUS dollarexchange rate in effect on September 30, 1984.
/ Prior to exchange adjustment.
* Not yet effective.
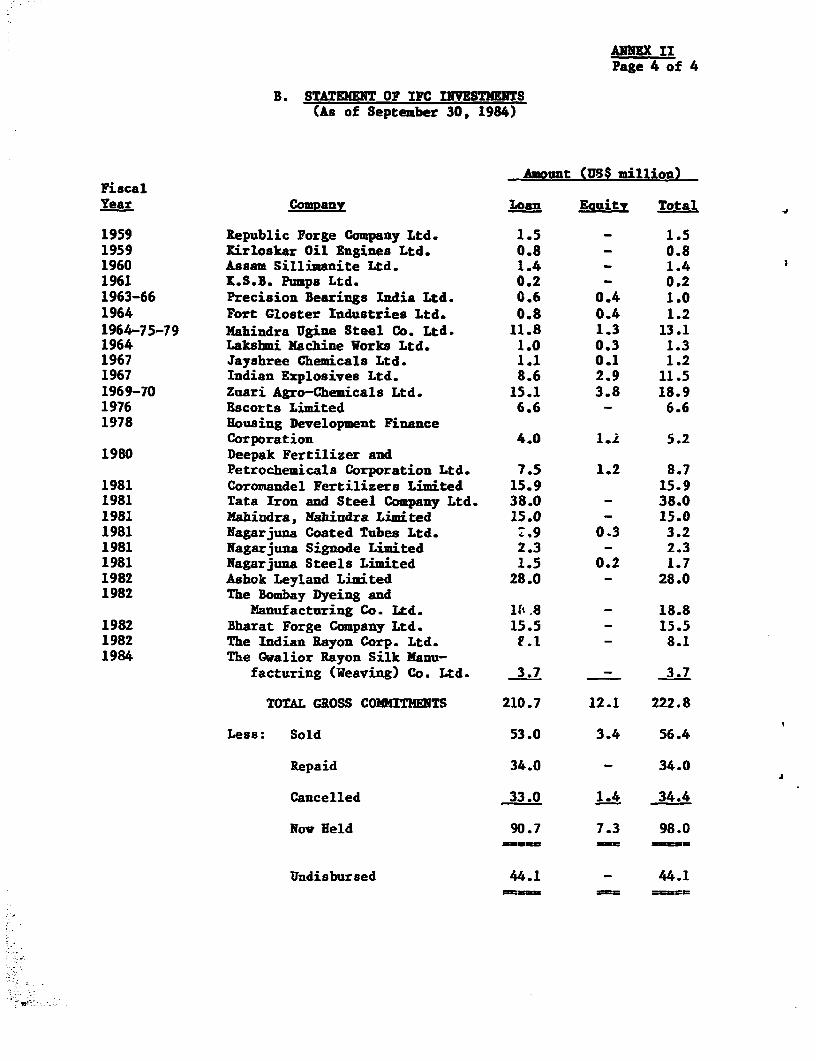
ANNEX IIPage 4 of 4
B. STATEMENT OF IFC INVESTMENTS(As of September 30, 1984)
Amount (US$ million)FiscalYear CLmany loan Eouitv Total
1959 Republic Forge Company Ltd. 1.5 - 1.51959 Kirloskar Oil Engines Ltd. 0.8 - 0.81960 Assam Sillimanite Ltd. 1.4 - 1.41961 L.S.B. Pumps Ltd. 0.2 - 0.21963-66 Precision Bearings India Ltd. 0.6 0.4 1.01964 Fort Gloster Industries Ltd. 0.8 0.4 1.21964-75-79 Mahindra Ugine Steel Co. Ltd. 11.8 1.3 13.11964 Laksbmi Machine Works Ltd. 1.0 0.3 1.31967 Jayshree Chemicals Ltd. 1.1 0.1 1.21967 Indian Explosives Ltd. 8.6 2.9 11.51969-70 Zuari Agro-Chemicals Ltd. 15.1 3.8 18.91976 Escorts Limited 6.6 - 6.61978 Housing Development Finance
Corporation 4.0 1.2 5.21980 Deepak Fertilizer and
Petrochemicals Corporation Ltd. 7.5 1.2 8.71981 Coromandel Fertilizers Limited 15.9 15.91981 Tata Iron and Steel Company Ltd. 38.0 - 38.01981 Mbhindra, Mahindra Limited 15.0 - 15.01981 Nagarjuna Coated Tubes Ltd. 2.9 0.3 3.21981 Nagarjuna Signode Limited 2.3 - 2.31981 NagarjnnA Steels Limited 1.5 0.2 1.71982 Ashok Leyland Limited 28.0 - 28.01982 The Bombay Dyeing and
Manufacturing Co. Ltd. 11Y8 - 18.81982 Bharat Forge Company Ltd. 15.5 - 15.51982 The Indian Rayon Corp. Ltd. F.A - 8.11984 The Ovalior Rayon Silk Manu-
facturing (Weaving) Co. Ltd. 3.7 - 3.7
TOTAL GROSS COMMITMENTS 210.7 12.1 222.8
Less: Sold 53.0 3.4 56.4
Repaid 34.0 - 34.0
Cancelled 33.0 1.4 34.4
Now Held 90.7 7.3 98.0
Undisbursed 44.1 - 44.1
- ~ ~ ~ ~ ~ ~ ~ ~ ~ ~ ~ ~ - =
;-:

ANNEX IIIPage 1 of 2
INDIA
RIHAND POWER TRANSMISSION PROJECT
SUPPLEMENTARY PROJECT DATA SKET
Section I: Timetable of Key Events
(a) Time taken by the Borrower to Prepare the Proiect
About two years.
(b) The azency that has prepared the proiect
National Thermal Power Corporation.
(c) Date of first Presentation to the Bank and date ofthe first mission to consider the proiect
The project vas first presented to the Bank inFebruary 1984; a preparation miseion visited Indiain June 1984.
(d) Date of departure of appraisal mission
August 19, 1984.
(e) Date of completion of negotiations
April 29, 1985.
(f) Planned date of effectiveness
September 30, 1985.
Section II: Special Bank Implementation Actions
None.
Section III: Special Conditions
(a) Execution of subsidiary loan agreement between GOI andNTPC (condition of effectiveness, para. 53);
(b) Achievement of financial rate of return by NTPC(para. 60);
(c) Execution, by March 31, 1986, of bulk supply contractsbetween NTPC and each of its customers in the

ANX= In.Page 2 of 2
Northern, Western, Southern, and Eastern legions(para. 62);
(d) Maintenance of accounts receivable of NTPC at a levelof. two months', electricity sales, from March 31, 1986(para. 65).
l
lI
,~~~~~~~~~~~~~~~~~~~~~~~~~~~~~~~~~~~~~~~~~~~~~~~~~~~~~~~~~~~~~~~
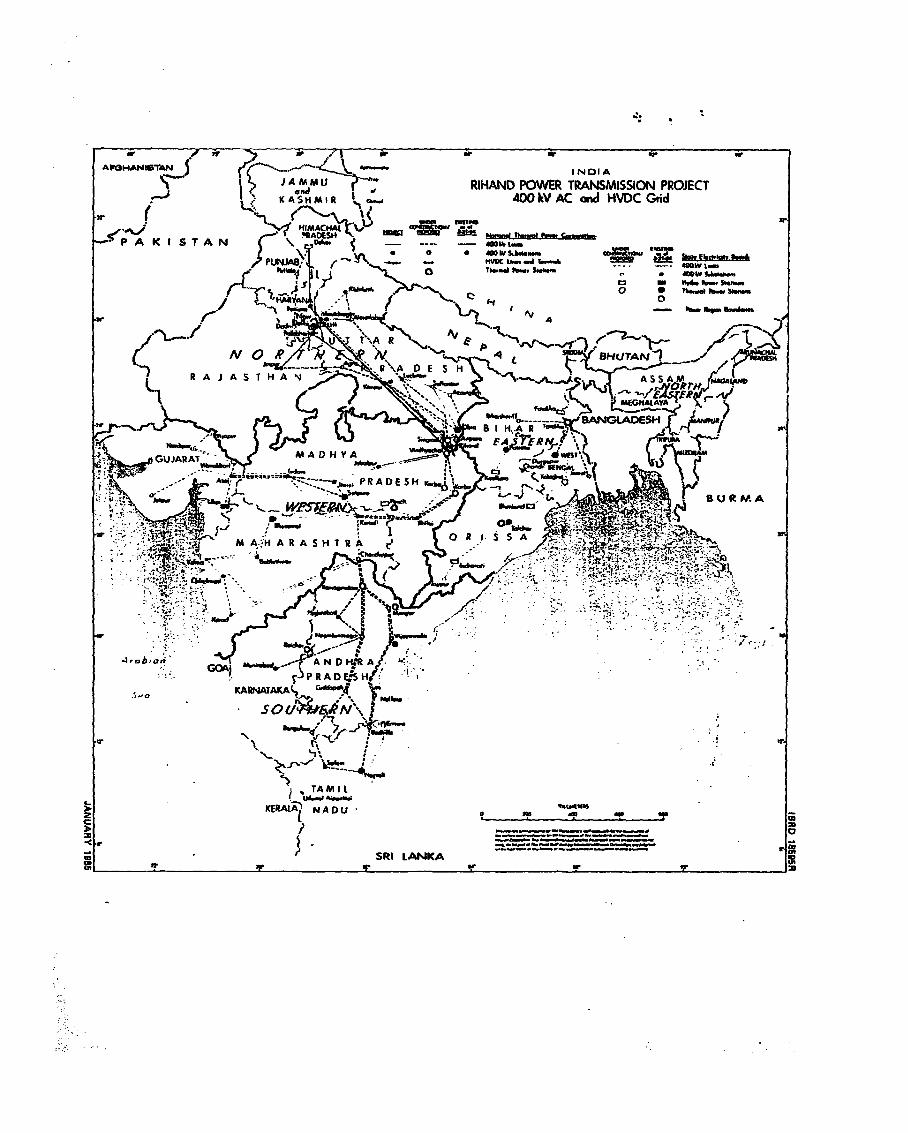
. -|i - _V i r- 1
Abl3HANISTAN r 4- '-2'v& 1 NOI1A
J A RIHAND POWER TRANSMISSION PROJECTand
KASHMIR . 40 kV AC and HVDC Grd
> P N1(8 U _HIACNAI -sr _.e _ fDC C.
P ~ A K I S Ti1 -Ao NPAKISTAPN .- t fmn I1..O * .
0 __
-'-;'.'' '' Alt s)' ;" -'AN'
ot~~~~~~~~~~~ Aa, 0v E_.- A N v e~~ ~ ~~~~~~~~~~ .. MVDC LI ,d h.i. - -a !
~~~~~~~~~~~~~~~~~ - / . ;. M,%
>GUJARA=---' ADO--- z PRADESHADEK&LI 7
w 9 S H r I
:-s..RAESC -l.-
MA~~~H PRAS1TA D'O
cQ~, AL1 ~ ANDSRI AKC5 sr or~~~a
