world bank document · i. the 1974 constitution: antecedents and ... 1962-75 133 9 distribution of...
TRANSCRIPT

k- LL LFILE COPY
Report No. 1615a-YU
Yugoslavia: Self-Management Socialism and theChallen1rs of Develonment(In Six Volumes)
Volume IPart 1: An Economic System in EvolutionMarch 21, 1978
Firope, Middle East and Nnrth Africa Region
FUDmK ,rmaFFrI.C i AA L Imu S .. -tON ,
Document of the World Bank
This document has a restricted distribution and may hb used by recipientsonly in the performance of their official duties. Its contents may nototherwise he disc!osed without World Rank aiithnriz7tionn
Pub
lic D
iscl
osur
e A
utho
rized
Pub
lic D
iscl
osur
e A
utho
rized
Pub
lic D
iscl
osur
e A
utho
rized
Pub
lic D
iscl
osur
e A
utho
rized
Pub
lic D
iscl
osur
e A
utho
rized
Pub
lic D
iscl
osur
e A
utho
rized
Pub
lic D
iscl
osur
e A
utho
rized
Pub
lic D
iscl
osur
e A
utho
rized

CURRENCY EQUIVALENTS
Before January 23, 1971
1 US dollar = 12.5 dinars
1 Dinar = 8 US cents
From January 23, 1971 to December 22, 1971
1 USdo A1lr = 15. n 44a
1 Dir.ar - .7zScents
From December 22, 1971 to July 12, 1973
1-US dollar = 17.0 dinars
1 Dinar = 5.89 US cents
Since July 12, 1973
The Dinar has been floating.
The rate of December 31,1977 was
1 US dollar = 18.445 dinars
1 Dinar = 5.42 US cents
MD R O IrF! AT LTUE OTf v
YUGOSLAVIA: SELF-MANAGEMENT SOCIALISM AND THE CHALLENGES OF DEVELOPMENT
Trable ofP rConlents
I U.LC
Page No.
VOLUME I
COUNTRY DATA
MAP
PREFACE.
PART I: AN ECONOMIC SYSTEM IN EVOLUTION .... .............. 1
I. THE 1974 CONSTITUTION: ANTECEDENTS AND
IMPLICATIONS. i
The Historical Setting .1
Economic Overview 1954-74. 3Economic Management 1950-74. 6Economic Performance 1965-75. 7
The 1974 Constitution and its Economic
Implications .12
II. MEDIUM-TERM PROSPECTS: THE FIVE-YEAR PLAN,
1976-80 .20
Recent Developments .20
The Balance of Payments and Economic Growth . 22
Labor Force and Employment Prospects 29
Reducing Regional Disparities .32Summary .37
VOLUME II
PART II: SELF-MANAGEMENT SOCIALISM--CONTOURS OF THE SYSTEM. 39
A. THE INSTITUTIONAL FRAMEWORK OF THE
YUGOSLAV SYSTEM .... 40
Historical Overview .40
Political Premises of the Yugoslav System 43
Instruments and Organizations of Self-
Management .50
B. MARKET AND PLANNING IN THE YUGOSLAV SYSTEM .. 65
The Role of the Mfarket .65Planning .70
This document has a restricted distribution and may be used by recipients only in the performanceof their official duties. Its contents may not otherwise be disclosed without World Bank authorivation.

Table of Contents (Continued)
Page No.
VOLUME III
PART III: DEVELOPMENT ISSUES ............................... 83
I. STABILIZATION ............................... 84
Trends and Functioning of the Economy,
1966-75. .................................. 84
Macro-Economic Policies ..... ................ 91
Prospects fLor Stabilizatior .................... 1
I T T OBILIZA'TIVPJ 110J.J. AftJLa2I.JDZJ kUJL.LkiL'.1.....1.0 ..... ....
Trends O'L Financial LDieve'Lopment L96'-7J .I.... I 110
Business Banks .............................. 126Other Financial IntermuediarLie ...... ........ I
Social and Private Sectors Savings andInvestments i966-75 ..... .................. 134
Prospects for Domestic Resource Mobilization. 145
III. ALLOCATION OF INVESTMENT RESOURCES ... ....... 166
Past Development ............................ 166New System of Resource Allocation .... ....... i89Allocation in the Five-Year Plan 1976-80 .... 198
IV. FOREIGN ECONOMIC RELATIONS .... .............. 215
Structure of the Balance of Payments ... ..... 215Foreign Trade and Payments System and Policy. 244Prospects ....... ............................ 254
VOLUME IV
V. EMPLOYMENT ....... ........................... 280
Characteristics ............................. 281Labor Absorption ............................ 294Employment Policy ..... ...................... 310Population, Active Labor Force and Employment
1975-85 ........ ........................... 317
VI. REGIONAL DISPARITIES ..... ................... 355
Factors Affecting Interregional Disparities . 360Past Measures to Redress Regional Disparities 376Targets, Measures and Policies of the
New Plan ....... ........................... 381

Table of Contents (Continued)
Paee No.
VII. FUTURE PROSPECTS AND THE FIVE-YEAR PLAN _Q3
The Lona-Term Plan 1976-85 .... .............. 39QQThe Five-Year Plan 1976-80 ........ .......... 402
VOLUME V
APPENDICES
I. GLOSSARY OF FREQUENTLY USED LEGAL AND SYSTEM TERMSII. THE CONTOLURS OF A THEORY OF SELF-MANAGEMENT PLANNING
III. NATIONAL ACCOUNTS OF YUGOSLAVIAIV. FLOW OF FUNDSV. THE SCOPE OF A SOCIALIST CAPITAL MARKET WITHIN THE
V'TT('CT AXT CV1U
VI. FORMAT, SCOPE AND APPLICATION OF COST-BENEFIT ANALYSISVIT. T tL'OIT AV?ENT;' STATISTICAT NOTEVT
VuLaur1i VI
V'l'11. INP`u T1-OT j.Pl T ANiAT.YS IS F ...............R YUGOSL. T AVTIA


LIST OF TABLES
Table No. Page No.
VOLUME I
PART I: ,A ECONOMIC SYSTEM IN EVOLUTION
I. The- 1974 ConLLs t i t u t-i on: Anteced4ents and TImplicatior.s* ~ J J J *~ '..~JL~ L.LLUL.LJLI * CLLIU. £ULIjJ..'..L..JL
1~ ~ f Gowth P-es of Specified macro=Economlc Indicators, 1954=74
-rL th.L. 1±2±W~L LL. -LL . rlL= £±V 1. r.L L, L ~./UOU
1 or%±:IA U Di±4LLL UJ. dU0WJlL:L dLIU LL- UWLI LVv.LUpllII:LlILL:L, L U-lU V
2 Employment by Major Sector, 1969, 1973 and 1975 223 Plan Assumptions 274 Balance of Payments Results--Alternate Scenarios 285 Absorption of Returning MLigrant Workers and Reduced
Unemployment, 1976-80 306 Labor Force Balances 1976-80 32
7 Regional Growth Targets: Five-Year Plan 1976-80 358 Employment Growth by Republic, 1976-80 36
VOLUME III
PART II: DEVELOP-MENT ISSUES
I. Stabilization
1 GNP Growth and Inflation in OECD Countries and Yugoslavia,1965-73 84
2 Indices of Components of Aggregate Demand, Imports and MoneySupply, 1966-75 85
3 Growth Rates of Prices and Average Workers' Receipts 1966-76 864 Structure of Budgetary and Extra-Budgetary Receipts 1966-75 945 Consolidated Budgets of Socio-Political Communities, 1974:
Structure of Revenues 856 Consolidated Budgets of Socio-Political Communities, 1974:
Structure of Expenditures 977 Major Determinants of Money Supply 1965, 1970, 1975 100
Appended to Chapter:
1.1 GNP Growth, Inflation, Investment and Savings Rates, inOECD Countries and Yugoslavia, 1965-73 107
1.2 Structure and Growth of GMP, 1966-75 1081.3 Indices of Major Economic Aggregates, 1966-75 1091.4 Indices of Producer Prices, 1966-75 1101.5 Cost of Living Indices, 1966-75 1111.6 Indices of Average Net Personal Receipts, 1966-75 1121.7 Money Supply, 1966-75 1131.8 Total Budgetary and Extra-Budgetary Receipts, 1966-75 1141.9 Consolidated Budgets of Socio-Political Communities, 1974 115

Table No Page No.
1.10 Revenues and Expenditures of Communities of Interest, 1974 1161.11 Revenues and Expenditures of Public Funds,1974 117
II. Resource Mobilization
1 Savings and Investment Rates, 1961-75 1202 Gross Savings (Investment) by Sector, 1961-75 1213 Financial Savings by Sector, 1961-75 1234 Structure of Busine6s Banks Resources, 1965-75 128
5 Structure of Business Banks' Assets, 1965-75 1296 Secrtnrl flig-tribution of Total Bank Credits. 1970 and 1975 130
7 Regional Distribution of Business Banks' Assets, 1975 1318 Balance Sheet of investment Loan Funds, 1962-75 133
9 Distribution of GMP of Social Sector Economic Organizations,
1966-75 ~~~~~~~~~~~~~~13910 Realized Gross Investment and Self-Financing Rate of Social
Sector Economic Organizations, 1966-75 14111 Summary of Household Receipts, 1966-75 143;2 CicSummary of Y.ousehold Sav4ingsa nnd TInratmnrc 1in6-7 143
13 Portfolio of Household Financial Savings, 1966-75 144
14 Formation and Distribution of Total Resources, 1971-75and 1976-80 146
15 TULrect Firnancing o[ L InvestmentL lb)y Sector, 1971-75.
and 1976-80 147
Appended to Chapter:
2.1 Savings, Investments and Financial Savings by Sector, 1961-75 1562.2 Gross Savings and Investments by Sector, 1961-75 1572.3 Balance Sheet of National Banks End Year Position, 1965,
1970, 1975 158
2.4 Balance Sheet of Business Banks End Year Position 1965, 19701975 - 159
2.5 Banks' Credits by Sector and Term, Changes 1970-75 and EndYear Position 1975 160
2.6 Financial Investments by Sector and Type of Asset, End YearPositions 1965, 1970, 1975 161
2.7 Social Product of Social Sector Working Organizations,1965-75 162
2.8 Social Product of Social Sector Economic Organizations,1965-75 163
2.9 Realized Gross Investments and Self-Financing of SocialSector Economic Organizations, 1966-75 164
2.10 Households Investment and Financial Savings, 1966-75 165

- iii -
Table No. Page No.
III. Allocation of Investment Resources
1 Allocation of Fixed Investment 166
2 Capital Stock in Social Sector's Economic Activities 168
3 Regional Distribution of Capital Stock 169
4 Comparison of Aggregate ICORs and Income Per Capita 172
5 TIORs of Prodi-ctive Activities in Selected Countries.
1968-73 174
6 Regional Differences of Gross Accumulation Rates, 1974 175
7 Sector/Branch Differences of Net Profit Rates,
1972-74 176
8 Differences of Branch Gross Accumulation Rates Between
Regions, 1974 177
9 Sources of Growth Decomposition of Output, 1966-72 181
10 Structural Coefficierts, 1966 and 1972 182
11 Investment Targets of the Plan 198T.dL .L1+,U~LL 4 19912 P~lLan Ir.vestment i`n 'Fixed Assets, Economic Activities19
13 Plan Growth Rates and ICORs 200IL I TruWDUJLWLLLXL~ 202I14 Esti.-uatedu Gro-wthI' Rates and COs 0
AppenLded to Chapter:
3.1 Gross Domestic Product by Industrl.al Origir, 1 966-75 05
3.2 Gross Domestic Product by Industrial Ori.gin, 1966-75
at Constant 1972 Prices 206
3.3 Resources and Uses of GDP at Current Prices, 1966-75 207
3.4 Resources and Uses of GDP at Constant 1972 Prices, 1966=75 208
3.5 Investment by Major Sectors, 1962-74 209
3.6 Average and Incremental Capital/Output arid Capital Labor
Ratios, 1952-74 210
3.7 Profitability Pattern Analysis: Slovenia and Kosovo, 1974 211
3.8 Plan Projections of Investment by Category 212
3.9 Plan Projection of Investment by Sector and Activity 213
3.10 ICORs and Growth Projections 214
IV. Foreign Economic Relations
1 Trade Intensity of the Economy, 1958-74 215
2 Real Growth Rates of Output and Trade, 1958-76 216
3 Structure of Current Account, 1962-75 216
4 Balance of Payments, 1962-75 217
5 Trade Volume and Prices, 1972-76 218
6 Geographical Orientation of Trade, 1956-76 220
7 Trade by Convertible and Bilateral Areas 221
8 Growth Rates of Exports and Production, 1956-75 223
9 Constant-Market-Shares Analysis of Yugoslav Export Growth,
1961-74 224
10 Share of Manufactured Goods in Total Merchandise Exports
of Selected Southern European Nations 225
11 Composition of Exports by Sector of Origin, 1956-75 226
12 Growth Rates of Imports and GMP, 1956-75 229
- iv -
Table No. Page No.
13 Total Import Content of Major Sectoral Groups, 1966-72 23014 Import Sources of Growth Decomposition, 1966-72 23215 Index of Imports by End Use, 1966-76 233le Foreign 4nes-. inVugoslavia I1968-73 235
17 Foreign Investment Correlation Coefficients, 1972 23618 Extern.uual., DebtJL '.JLOutsatn'andir.g, I, 6-75 23
19 External Debt Burden, 1966-75 241
20 ilomLnal anLU PurcLLasing=Power=ar4y ELxcange Rate, - 1966=75 24
21 Structure of Imports by Restrictive Categories 24722 1LeIsb UL 'LlaUue DBLWeenk AgLrcULULd a MnLU factureud
Goods, 1955-75 249
23 Plan Targets on ForUeign Trade 1971-75 arid 1976-80 255
Appended to Chapter:
4.1 Balance of Payments Aggregates, 1955-76 2634.2 Balance of Current Accounts, 1967-75 2644.3 Indices of Development of the Balance of Trade, 1956-76 2654.4 Geographical Structure of Trade, 1956-76 2664.5 Regional Structure of Commodity Exports 1973 267
4.6 Regional Structure of Commodity Imports 1973 2684.7 Export Structure According to Use of Product, 1954-76 2694.8 Import Structure According to Use of Product, 1954-76 2704.9 Structure of Exports by Sector and Branch of Origin, 1956-75 2714.10 Total Import Content of Production, 1966-72 2724.11 Ratio of imports to Total Available Domestic Supply, 1962-75 -734.12 Foreign Investment by Industry Branch 2744.13 Foreign Investment, in Yugoslavia by Country :2754.14 Growth Rates of GMP, Exports: Import Elasticity, 1958-75 2764.15 Export Coefficients 1972 2774.16 Nominal and Effective Tariff Rates 1970 2784.17 Dinar Deposits Requirements 279
VOLUME IV
PART III: DEVELOPMENT ISSUES (continued)
V. Employment
1 Annual Personal Incomes Per Worker in the Social Sectorand Per Active in Private Agriculture, 1962-75 283
2 Personal Incomes in Private Agriculture and SocialSector Per Active Worker by Republic, 1971 285
3 Labor Mobility, 1961-71 2864 Labor Market Balance. 1961-75 2885 Estimates of the Effects of Age Composition and Labor
Force Participation on Crude Activity Rate, 1953-71 2906 Sources of Change in Labor Use 1966-72 2917 Social Sector Emnlovment. 1974 2958 Social Sector Employment: Growth and Elasticities, 1956-75 2969 Regional E.mployment Performancen 196q-75 298

Table No. Page No.
10 Social Sector Concentration, 1974 30011 Capital Intensity in the Social and Private Non-
Agricultural Sector, 1975 30212 Employment in Private Sector Handicrafts, 1970-74 30313 Contribution of External Migration to Labor Absorption,
1961-75 30514 External Migration According to Republic of Origin, 1971 30715 Migrants Registered with the Yugoslav Employment Services,
1970-75 30816 Migrants Securing Employment through the Yugoslav
Employment Service, 1973-76 30917 Population and Labor Force, 1970-85 31818 Absorption of Natural Increase in Labor Force, 1976-85 31919 Absorption of Planned Return of Migrant Workers and
Reduced Unemployment, 1976-80 32020 Labor-Output and Capital Output Ratios 1972 32121 Social Sector Employment Growth. 1976-80 32222 Labor Force Balances, 1976-80 32423 Employment Growth by Republic, 1976-80 325
ADDended to ChaDter:
5.1 Labor Force 1975 3265.2 Labor Force 1961-75 3275.3 T.abnr Fnrrc Conmnoitinn by Repniihlic 1971 3285.4 Unemployment Rates by Republic and Province, 1971-75 3295 5 Underemployed Labor Force by Republics, 1969 3305.6 Annual Balances of Inter-Republican Migration 1953-71 3315.7 Crude Act4T4ty Rts toandL WorkIng Agae Act-4ivityRt71 P l2
5.8 Age Structure of Active Population 1971 333C 0 Crude,A Activ inty Rate nol bn Puntbl 4 ,- onA A-,t-nn-.n.,,5.9 Cude ctivty ts byRepublic and Autonomous
Republic, 1953-71 3345. 1 U &Emuployment in the CiC4a cector, 1966-74 3355.11 Social Sector Concentration 1974 3365c 12) Small Sclel Industry,e- 107/4 337J .J IL -- -ZV _ - ,, , -_,,-
5.13 Employment Value Added Productivity, 1965-76 3385.1 R Degiconal- D ist ri4butior. o'f Privt 'r-gi.lua 4au
Added 1975 3395.15~~V_ 1 po-yment ir. Private Sector Y.-a4-dcrfts, 1070)-7A 422 * 1] ~~J.:LU11.L yW -L .31 1. L. L.~ ..3 L.LJ - --Si.L'.A1- -~ A. * I I -II t
5.16 Private Non-Agricultural Sector: Capital Intensity 1975 3415.7 I/ c.comes Per Active Worker in Private Ag1rIuLUre, 19ou-75 342
5.18 Income Per Active Worker in Private Agriculture by Republic1 71 '2'
5.19 Yugoslav Migrant Workers Remittances and Savings 1963-75 344r..2 Ff oreignL Excchar.ge TDeposi-- -ts - .ll 'L- Yugos-lav -- YuosavaJ.L.U 1L±,L FXAALIIdirC1JtPU.L L)W.JL= I1U LJy 1UrU0-L4&V0 iLi. LUrUZ$a.LCd.LL
1966-75 3455.21 External Migration as a Proportion of Private Sector
Employment 1971 3465.23 Population and Labor Force 1970-85 3475.24 Population, Active Labor Force by Republic, 1975-85 3485.25 Population Projections: Migration Flows 3495.26 Direct and Total Labor Output Ratios, 1966-72 3505.27 Labor-Output Ratios, Capital-Output Ratios and Capital-Labor
Ratios, 1972 351

- vi -
Table No. Page No.
5.27 ChanRes in Employment.1966-72 3525.28 Employment Elasticities,1956-74 3535.29 Employment Elasticities by Republic. 1969-75 354
VI. Regior.al Disparities
1 Regiona1 Di4sparit4ies of TrCOM. Per Capit 1954-75 355
2 Basic Social Indicators by Region, 1975 357P~..-..4-1. - (mD D_-1 -~ 4 - .--. (ThAf T)_ InA.j... 3583 SJL~.JGrowth Rates± of. 'I, PUoJulatiLo.LL, aru.dLL ±L PrCatajLdC, 1966-75J 360
4 Demographic Indicators, 1950-755 ComposU1 LrULtlon ofion, 19u48-75on1
6 Indices of Income Differentials of Social Sector, 1974 3627 lHousehold income rer Capita Differentials, 197/3 3
8 Gini Coefficient, 1963-73 3669 Gini Coefficients, Total and By Sector.and Region, 1973 36710 Theil Indices, 1973 369ii Income Distribution (Per Capita Household Income), 1973 37012 Structural/Operational Coefficients, 1974 371ID inalustrial Specialization by Region, 1974-75
14 Regional Distribution of Transfers, 1971-75 37715 Size of Transfers, 1974 37816 Investment and Transfers, 1974 37917 Regional Growth Targets ot the Plan, 1976-80 382
Appended to Chapter:
6.i Basic Social Indicators by Region, 1975 3896.2 Caloric Value of Average Daily Food Intake, 1963-73 3906.3 Average Daily Consumption of Proteins, 1963-73 3916.4 Population and Growth Rates by Region, 1948-75 3926.5 Natural Increase of Population by Region, 1950-75 3936.6 Household Income Per Capita, 1973 3946.7 Population by Socio-Economic Sector, 1973 3956.8 Income Distribution, 1973 3966.9 Federal Fund and Federal Budget Transfers, 1974 397
VII. Future Prospects and the Five-Year Plan
1 Long-Term Plan 1976-85 Principal Growth Targets 4022 Five-Year Plan 1976-80 Real Growth Targets 4033 Growth of Output 1971-75 and 1976-80 4054 Projections 1975-80 4075 Growth of Output Plan and Projected 1976-80 4106 Output Sources of Growth Decomposition: Priority Activities
1966-72 4127 Import Sources of Growth Decomposition: Priority Activities
1966-72 4148 Plan Scenario 4189 Plan Scenario Balance of Payments 419
10 Ralanne of Pavments--A1tPrnativP Scenarios 421

.s>j<Y. 4 \~ R U M A N I A
H E E G 0 VJ,~~~~~~~~~~~~~~ LBDEK~ C
CCCBBBCC CC~.CCBCYUGOSLAVIA
f~~~~~~~~~~~~~~~~~~~~~~~~~~~~~ A C t-
M,Y,1972 ~BR 3773R
M U T 1 A97?"UNGARY ZYUGOSL VIA>o,


Page 1 of 2
COUNTRY DATA - Yugoslavia
AREA POPruLATrION DFdSITY255,804 sq. km. 21.5 million (1976) 84 persons per sq. km.
Rate of Growth: 0.9% (1961 to 1971) 149 persons per sq. km. of agricultural land
POPULATION CHARACTERISTICS (1976) HEALTh (1975)Crude Birth Rate (per 1,000) 18.1 Population per physician 687Crude Death Rate (per 1,000) 8.5 Population per hospital bed 167Infant Mortality (per 1,000 live births) 37.1
INCOME DISTRIBUTION (1971) DIS'-IB-''ION 0P ND OWNERSP,IP (1971)% of national income, lowest quintile 6.1 % owned by top 10% of owners
highest quintile 39.2 (social sector Rombinats) 15.17 %owned by smallest 10% of owners 84.9
(private smallholders)
ACCESS TO PIPED WATER (1976) ACCESS TO ELECTRICITYOccupied dwellings with piped water (38.57.) 7. of all dwellings. (1976) 89
rural (1971) 80
NUIKIIION (1974-76) ED-CATION (1971)Calorie intake (% of requirements) 137 Adult 'literacy rate % 85Per capita protein intake 98 grams Primary school enrollment % 96
Secondary school enrollment 7. 49
L/GNP PER CAPITA in 19767: US$1680
GROSS NATIONAL PRODUCT IN 1975 ANNUAL RATE OF GROWTH (%. constant 1972 prices)
($1 - Din. 17.5) US$ MN. % 1966-7_ i97;-75 '" .7
GNP at Market Prices 32,152 100.0 6.7 7.0 12.4 4.2Gross Domestic Investment 10,148 31.6 6.2 6.1 8.5 8.1Gross National Savings 9,122 28.4 3.8 7.2 - 5.6 10.7
Current Account Balance 1,032 3.2 _ _ _ _Exports,of Goods, NFS 6,266 19.5 7.4 5.6 - 0.9 1.7Imports of Goods, NFS 8,703 27.1 12.5 6.1 10.8 - 0.1
OUTPUT, LABOR FORCE ANDPROD'JCTIVITY IN 1975
GDP at Factor Cost Labor Force V. A. Per Worker
USS Mln. % Mln. % -;US 7,
Agriculture 3,894 14.4 3.10 39.1 1,256 37.0Industry 2/ 10,387 38.6 2.28 28.8 4,556 134.0
Other 12,643 47.0 2.54 32.1 4,977 146.4Total/Average 26,924 100.0 7.92 100.0 3,399 100.0
G0VEPNMENT FINILNCE con.solidated, 1974
Total Federal Republican CommanalDin. bil. Percentaxe Distribution
Current Receipts 4/ 71.95 60.8 18.2 21.0Current Expenditure _/ 68.89 65.2 15:8 19.0Current SUrpLUS 3.06 -37.9 69.9 68.0Capital Expenditures 3.61 11.9 54.6 33.5Overall Surplus - 0.55 -289.1 30.9 158.2Current Receicts as 7 of GNP 16.02
MONEY. CREDIT AND PRICES1970 1971 1972 1973 1974 1975
(Din. billion)
5/_____Mor,ey Supply (erd-year posi.t.ion) 3S.5 43.3 60. 8a2.1 103.4 137.1Money Supply as % of GDP 22.4 19.6 22.5 24.9 24.3 24.7Bank Credits (annual changes) Total 6/ 31.8 37.8 36.4 43.3 68.6 96.8Enterprises -. 24.7 25.5 29.1 34.0 52.6 74.0Governiment and other Social Sector 2.9 9.9 5.5 5.6 8.8 12.6Households 4.2 2.4 1.8 3.7 7.2 10.2
Price Indices (1974=100) 54 62 68 77 100 122Industrial Producer Prices 45 57 70 88 100 113Agriculture Producer Prices 51 59 69 83 100 124Cost of Liv'.-
1/ The Per Capita GNP estimate is at 1976 market prices, calculated by the same conversion technique as the 1977 World Atlas. All other conver-sions to dollars in this Table are at the current exchange rate prevailing during the period covered.
2/ Manufacturing, mining and construction.3/ Total active resident labor force, excluding unemployed.4/ Including subsidies.5/ Money, demand deposits and float.6/ Short- and long-term credits.

Page 2 of 2
EALANCE OF PAYMENTS AND EXTERNAL ASSISTANCE AND DEBT
Annel Data at Ctrrent Price.(0S$ Million)
1972 1973 1974 1975 1976
DEBT AND DEBT SERVICE /3 1972 1973 1974 1975
SUMMIARY o O BALANCE Public Debt Out. & Disbursed 1,619.0 1,869.3 2,056.5 2,272.5
up-e. (i.I. N7rS) 3,424 4,363 5,696 6,30.7 7,259Exports ncel. 3 S 2 S 3,424 4,363 5.696 6,307 I Interest o- Public Debt 63.2 97.1 101.2 120.1
Imports (tool. DPI) 5.1~~~,2. . . . . . 64,33
Deenurre Dolexec (2-N) - 404 - 761 -2,641 -2,453 -1,405 RePnYoc ta cx Public Debt 154.3 205.0 202.3 309.0Total Public Debt Sarvios 217.5 302.1 363.5 429.6
IntcrcsE - 165 - 222 - 285 - 337 - 350 Othee Debt Service 638.2 746.4 622.7 989.7
-wonricerEcs' iiaueoa 689 1,301 1,511 1,575 1,729 Total Debt Serice 655.7 1,046.5 1,206.2 1,419.5
W-kb.r En9rsric e 7 50 93 62 40
Currnct Trcnsf r n ot 92 96 139 121 140 Borden ox Export aicringo (7) Lt) ~~~~419 464 -1,184 -1,032 150
Public Debt Services Ratio 5.0 5.2 5,2 5.4
M6LT0 Lnne /I iTota D'bt Sor.'en P:t:u 19.3 17.6 16.4 17.6
Diebrsnet. 943 1.170 1,426 1,650 1,700 IDS - Diesct Inv-eetnet Inc.
Rcyav nto 5 370 _ 686 - 814 - 930 _ BOO
Nct Dieberseesn-t 373 484 612 920 900 Averae Tet of Public Debt
Capital Trsc nntie-e /2 - 117 - 255 139 - 68 - 133 It. ne 7 Prior Yc-rU.oc f Res.rv. - 675 - 663 438 165 _ 917 D06D 4.7 6.0 5.4 5.9
eaer * ~~~~~~~~~~~~~~~~~~~~~Aiort. ne 7. Print Year
crnrc.nD-vn nE . D04D 11.5 12.7 15.1 15.0
ICpiltS 669 1,004 1,305 1,687 1,759 BIRO DIbt Outs. & Dieborsed
P _trole .nd Puel 177 359 952 943 1,060 as % Public Debt O0D 19.6 10.6 20.6 24.6
Ieter-ediatc Goods 1,S59 2,450 4,291 4,109 3,616 as 7, Public Debt Service 14.7 12.7 11.6 12.9
Cuxe-eption Goode 502 OB69S -T, 972 75S. 91-: 0_
TSt1 Mer-h. Iep-rte (c-i.f.) 3,227 4,311 7,520 7,697 7,367 0RA1T AND LOAN COMENTSOfficixi _rants 6 Gr-t-like
ExpertsCopitol GoeAn 316 369 514 695 920 Public M67T L-aes
Toctilt etd Lothber Goode 362 409 477 600 761 IBRD 75.0 104.9 256.5 209.0
Ievfereu et1-ury 272 325 556 439 472 IDA --Aonigric ul Prednetu (let , feed) 400 475 439 486 640 Other Meltilnternl .Otbr 687 1128 1,819 I.S31 2.0S5 Oovssmsxte 105.9 179.7 615.4 274.7
Tetl M-roh. Eperct (feb.) 2,237 2,653 3,805 4,072 4,676 Seppelie- 82.3 3.0 0.6 _Fiexecin1 Ix-titti.one 121.4 _ 73.1 66.2
YERChANDISE ORADE INDICES 1974 - 100 Boeds 51.5 -
MEpurI Price INdIx 63 76 100 109 114 Public Laos4 6.e.i. 4.2
I=pert Prier Index 58 66 i00 163 169 Total Peblic M4LT L.- 997.2 569.9
Tern of Trade Indee 109 112 100 104 105Epertc Vof1e Ivdre 93 99 105 98 112 A-cM1 Debt outSteedixo ox DIc. 31. 1975
EXTER.NAO DEBY Diebursn-ce ecl Inr
A7rA TE O CF NCE W-erld BDk 559.1 24.6
Evd of 1971 to mid-1973 IDA
US$100 - Dixate 17.00 Other Multilateral 5.3 0.2
Dli. 1.0 -000.05882 Govewnts 1,304.3 57.4Sappliero 115.6 5.1
Rats rIl.ting eiect =id-1973 Fi-cecial Ixetitutie.e 26s.9 11.9
ebeh-gerotctat etd of Dc-mb-r 1977 Bonds 18.1 0 8
US$i.'O - Dieave 10.445 Public Debt .0.1
Dic. 1.0 - USS0.05422 2,272.3 100.0Othe MAIT Debt, 53,9.
Short-tevx Debt (dieb. exly)
Icelodro direct foreige Ixvcet.cnt.7 Tvri,e - vvsetrnrs ned olenlev. ebhrt-te-m Icns, net enpart credita, IMF acct, Notional Bank ad Coctil BSk Crdit.
Li Figurc ee dobt aervicn do eet curreepeed ibth belaxee of poymeets figurea d.e to differences In coverage.74 In.lude _rknrn re,ittane.L5 E.titE.r
E-rp., Middl. E..t Ind Not Afri.. R.glon
PREFACE
This report was prepared by an economic mission thatvisited Yugoslavia in October and November 1976. Themission consisted of the following: Messrs. M. Schrenk(chief), C. Ardalan (general economist), B. Blazic-Metzner(general economist), C. Chittle (foreign trade consultant),Mrs. N. El Tatawy (development economist), Miss K. Jordan(input-output specialist) and Mr. Y. Kubo (input-outputspecialist).


YUGOSLAVIA: SELF-MANAGEMENT SOCIALIStM AND
THE CHALLENGES OF DEVELOPMENT
PART I--AN ECONOMIIC SYSTEM IN EVOLUTI-ON
I. THE 1974 CONSTITUTION: ANTECEDENTS AND ItPLICATIONS
The Historical Setting
1.1 The territories which came together to form Yugoslavia after the
First World War comprise seven distinct political, legal, and administrativeregions. Serbia and Montenegro were independent countries at the time of the
outbreak .of the First World War. The remaining five regions had all formedpart of the Anistro-Hungarian empire--Slovenia and Dalmatia in the Austrian
half, Croatia-Slavonia and Vojvodina in the Hungarian half, and the provinceof Bosnia-Her.Ponvi na under the common Austro-Hlunarian central hierarchy.Superimposed on these divisions, and only partially explained by them, wasan extraordinary dive rsit-y and lack of cohesion among ethnic, lingnuistic,
religious, cultural, and historical factors, together with wide disparitiesin social and economic develonment. The differences gave rise to complexproblems, which were intensified during the interwar period by the internalpolicies of successive governments. The failure to recogniz7e and deal effec-
tively with the problem of multiple nationalities and to ensure a more evennational distribution of political npower and influence greatly weakened the
internal cohesion of Yugoslavia during this particular time.
1.2 From an economic point of view, the main effect of the Second WorldWTar was tLILe appa 14..L casualties and physical aama-e which i-trl claused. Poli-
tically, the Communist Party of Yugoslavia emerged in full control of the1 U4~~1
whole coLtLLry. The rise to power of a genuinely Yugoslav party Lade a new
and more constructive approach to the nationalities' problem possible. UnderLlthe constitution L lormalLUly auoptedul in t7Afl, vugosa'v4a becaLe a federal state
with six constituent republics. 1/
1.3 Despite a liberal-minded approach to the nationalities problem,
the Yugoslav regime of thiCe ear'ly postwar years was h.ighLly cer.tralized and
authoritarian. The 1946 Constitution provided for state direction of eco-nomic life and economic developm-ent by means of a comprehensive economic
Note: Paragraphs 1.1, 1.2, and 1.3 of this report are taken, almost entirely,from the World Bank's Country Economic Report, Yugoslavia: Development
with Decentralization (Baltimore: Johns Hopkins University Press, 1975).
1/ A later constitutional amendment created two separate administrativeregions within the Republic of Serbia. Tnese are the two autonomousprovinces of Vojvodina and Kosovo. The term "republic," as it is usedin this study, should be understood to include all of tne present eight
regions: Croatia, Slovenia, Bosnia-Herzegovina, Montenegro, Macedonia,and Serbia Proper, as well as Vojvodina and Kosovo.

- 2 -
plan. The first postwar plan covered the five years from 1946 through 1951.
In the first two years of the plan, output increased impressively, and the
investment ratio rose to more than 30 percent. However, after mid-1948, the
break with the Soviet Union and the other Cominform countries prevented ful-
fillment of the plan.
1.4 In 1950, Yugoslavia embarked on a unique path of development: it
attempted to establish a new economic order based on a system of workers' self-
management characterized by social ownership and control of the means of pro-
duction. 1/ The motivation underlying this decision was complex. Workers'
self-management was perceived as an embodiment of the spirit of the social-
ist state envisioned by Marxist philosophy -- a state in which workers would
receive according to their labor and there would no longer be any alienation
based on a separation of workers from the ownership of the means of produc-
tion. 2/ In addition, workers' self-management provided decision makers
with an ingenious way of dealing with the pluralistic character of Yugoslav
society; differing interests can be voiced, respected, and harmonized. Thus,
in one respect the system of economic management is moving toward creating
an environment in which the decision-making process can best reflect the
obiective of providing workers with the maximum control over their work-
places and ultimately over the economy itself. In another respect, through
a parallel process of devolving decision making from the Federal government
to the Republics and Communes, the system is moving towards an ever-increasing
accommodation of the diverse needs and aspirations of the various national-
ities that Yugoslavia comprises.
1.5 Yugoslavia's development in the postwar period is the history of how
these comnlex factors have shaped the country's ability to attain its basic
objectives and to cope with its inherited economic problems. Yugoslavia has
had an almost uniqiue nrpdilection toward innovating and testing novel organi-
zational and systemic relations. Its innovative zeal has been characterizedby a commendable blend of nragmatism and flexibility and an almost uncanny
irreverance for institutions and policies that have failed to meet expectations.
Few dictums, apart from Yugoslavia's commitment to Marxist thought on the
social ownership of property, appear to have been inviolable, and few have
/ Not all productive enterprise in Yugoslavia ic socinllv owned Although
the social sector includes virtually all nonagricultural activities,
abuout 90V percent of the agricultural sector- consists onf sml,individ-
ually owned farms. In 1975, the agricultural sector accounted for about
39 percent of the active res4Aent labor force and 15 percent of value
added to Yugoslavia's GMP.
2/ The Yugoslav interpretation of self-management reaches beyond the concept
of "workers' participation," which would imply some sharing of power by
workers with nonworkers - management or the state. Self-management in
Yugoslavia signifies direct democracy in a dual sense; decision-making
power is assigned and restricted to individuals directly affected by
decisions, and these individuals exercise their power directly, without
the intervention of intermediaries.

- 3 -
withstood the march of time. Although these changes were deliberate responsesto diverse--and not always mutually compatible--social, economic, and political
issues, an uiuerlying economiLc ratLorLaLe is dUscernible throughout he period.
An appreciation of this rationale is crucial to understanding the evolution of
the sysLem. The analysis that follows stresses the continuity of the institu=tional changes that have occurred; they represent an evolutionary processratner than a set OL unIreLated responses. The process of change Las been
dialectic in nature: institutional changes have impinged on the performanceof the economy, which in turn has prompted further institutional changes. It
is this process that is the most interesting feature of contemporary Yugoslav
development.
Economic Overview 1954-74
1.6 Yugoslavia's economic objectives have included the traditional
ones: rapid growth, transformation of a preponderantly agrarian economy into
a modern diversified one, achievement of a high degree of income equality,
and increasing integration into the world economy. During the postwar period
as a whole, Yugoslavia has been remarkably successful in achieving these
economic objectives. Until 1954, the performance of the economy was severely
constrained by the structural readjustments that the break with the Cominform
in 1948 required. After 1954, however, the economy developed rapidly.
1.7 Between 1954 and 1974, growth in Yugoslavia's real gross material
product (GMP) averaged 7.2 percent a year. 1/ Rapid economic growth and
a low and declining population growth rate, which averaged 1.1 percent a
year during this period, resulted in per capita income reaching US$1,480 by
1975--a significant gain. 2/ Throughout the period, the economy succeeded
in mobilizing a large share of domestic resources for investment. Domestic
savings rates averaged about 30 percent of gross domestic product in earlier
years--a considerable sacrifice in consumption. In turn, however, this sacri-
fice permitted the rapid growth of GMP, which facilitated large gains in
personal incomes throughout the period; in fact, real personal incomes in the
modern social sector rose by an average of 5.8 percent a year.
1.8 The growth of real incomes was accompanied by significant structural
changes in the economy. Employment in the modern social sector increased 3.7
percent a year between 1954 and 1974, absorbing large transfers of labor from
the low-productivity, private sector in which small, traditional, individually
owned farms predominate. As a result, the share of the labor force employed
in the private agricultural sector declined from 66 percent to 33 percent
between 1953 and 1975. Paralleling this trend, the share of value added
1/ GMP includes a market price value added of those sectors which produce
goods plus the value added by the activities contributing to the pro-
duction and distribution of these goods and thereby increasing their
value - transport and trade. It does not include other services whichare directly rendered to individuals - housing, social services, and
government.
2/ Data are from World Bank, The World Bank Atlas (Washington, D.C.: 1976).

- 4 -
attributable to the traditional private agricultural sector declined from
40 percent in 1953 to 19 percent in 1975. As the importance of the private
sector declined, a highly diversified industrial structure developed.
1.9 These domestic changes were achieved in an environment of growing
integration into the world economy. Although from time to time the economy
faced balance of payments difficulties which constrained its growth, its export
performance was impressive- Between 1954 and 1974, exports in constant prices
increased by 8.5 percent a year. By 1974, exports and imports were equal,
respectively, to 20 percent and 27 nercent of GNP - a high level of foreign
trade for a country of Yugoslavia's size and income. This growing integration
into the international economy, in addition to providing additional resources
for growth, acted as a spur to efficiency and competitiveness and resulted in
significant improvements in the quality of …oods and services Yugoslavia
produces.
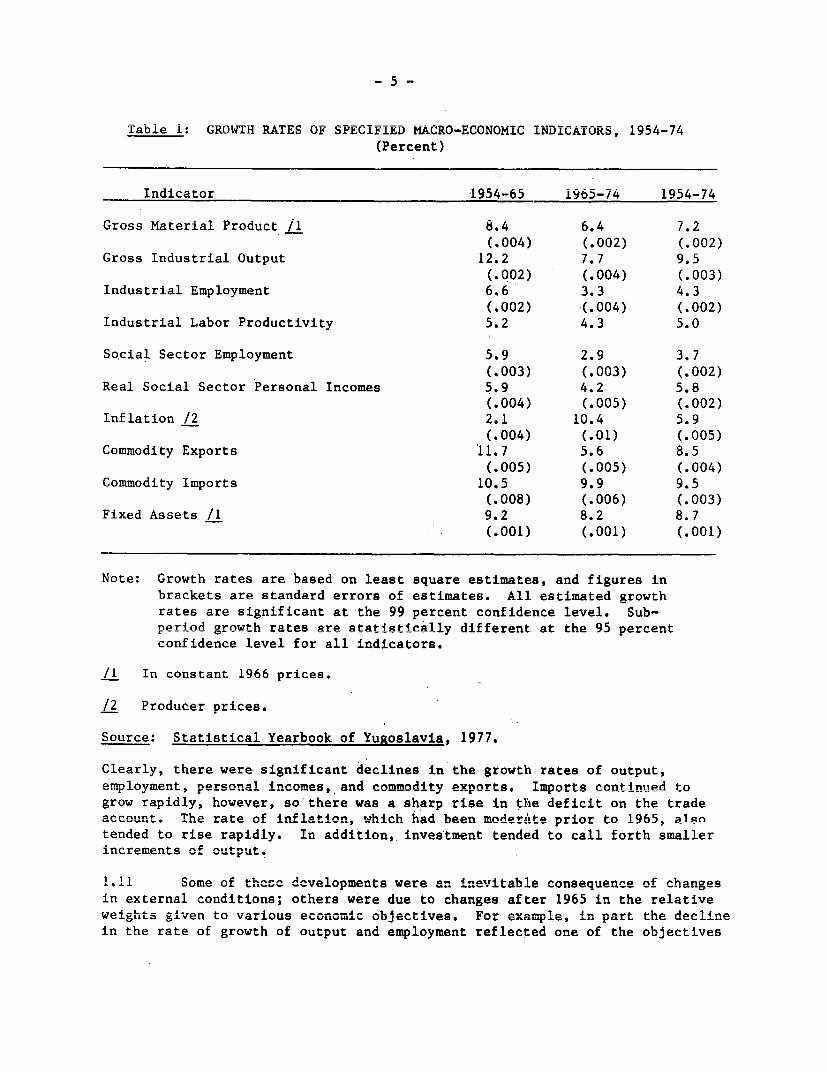
1.10 Although the overall performance of Yugoslavia's economy in the post-war era has lbeen irpresS4ve, its performance i a -umber of areas has appeared
to deteriorate in recent years, particularly after the 1965 reforms. This is
shlow- by the macro-economic indicators suImmar4zed in Table !.
-5-
Table 1: GROWTH RATES OF SPECIFIED MACRO-ECONOMIC INDICA1ORS, i954-74(Percent)
Indicator 1954-65 1965-74 1954-74
Gross Material Product /I 8.4 6.4 7.2(.004) (.002) (.002)
Gross Industrial Output 12.2 7.7 9.5(.002) (.004) (.003)
Industrial Employment 6.6 3.3 4.3(.002) (.004) (.002)
Industrial Labor Productivity 5.2 4.3 5.0
Social Sector Employment 5.9 2.9 3.7(.003) (.003) (.002)
Real Social Sector Personal Incomes 5.9 4.2 5.8(.004) (.005) (.002)
Inflation /2 2.1 10.4 5.9(.004) (.01) (.005)
Commodity Exports 11.7 5.6 8.5(.005) (.005) (.004)
Commodity Imports 10.5 9.9 9.5(.008) (.006) (.003)
Fixed Assets /1 9.2 8.2 8.7(.001) (.001) (.001)
Note: Growth rates are based on least square estimates, and figures inbrackets are standard errors of estimates. All estimated growthrates are significant at the 99 percent confidence level. Sub-neriod growth rates are statisticallv different at the 95 percentconfidence level for all indicators.
/1 In constant 1966 prices.
/2 Producer prices.
Source: Statistical Yearbook of Yugoslavia, 1977.
Clearly, there were significant declines in the growth rates of output,employment, personal incomes, and comvmodiftv exports Imports onntinued togrow rapidly, however, so-there was a sharp rise in the deficit on the tradeaccount. The rate of inflation, which had been moderat p rinr tn 1965; alsotended to rise rapidly. In addition, investment tended to call forth smallerincrements of output.
1.*e11 Some of these developments we:e an inevitable consequence of changes
in external conditions; others were due to changes after 1965 in the relativeweights given to varLous eco.omLc obJectives. For example , in part the declinein the rate of growth of output and employment reflected one of the objectives

-6-
of the 1965 reforms--to distribute a greater portion of income to consumption.
Similarly, the growing importance of remittances from Yugoslavs working abroad
allowed the trade account to deteriorate to the extent that it did during the
1965-74 period. The deterioration in many of the macro-economic indicators,
however, conceals the considerable improvements that were realized during this
period in the quality and price of domestic goods and services. This was a
consequence of the increased competition that followed liberalization of the
foreign trade regime in 1965. In some instances, these improvements may not
have been directly reflected in the growth of output. Further, measuring
changes in benefits is elusive, because it is difficult to compare incomes
under a system of multiple exchange rates with those that emerge when a more
realistic, unified exchange rate is adopted.
1.12 The performance of the economy after 1965 not only reflected the
results of new policy priorities, it also reflected increasing difficulty in
attaining these objectives. Although many factors--both internal and external
--contributed to these difficulties, the particular system of economic manage-
ment that prevailed during this period was the root cause of many of these
problems. The "economic model" of the period after 1965 had a number of
weaknesses. Mainly, these stemmed from trying to reconcile two divergentobjectives: developing an effective system of workers' self-management, andretaining macro-economic instruments adequate to manage the short- and long-
term development of the economy. This conflict was accentuated by a policy
of relying on a market mechanism which was fraught with imperfections. The
way the economy was managed offers some insight into its lagging performance
and into the reasons for the institutional changes that began in the early
1970s.
Economic Management 1950-65
1.13 Yugoslavia has passed through three constitutions since 1946. These
have not represented new departures, rather they have been part of an evolu-
tionary process guided by the overriding goal of self-management and tempered
by the need to reconcile the pursuit of greater worker autonomy with the
development of adequate policy instruments for economic management.
1.14 Self-management'was initiated in 1950 and codified in the "Law on
the Management of Government Enternrises and Economic Association by Workers'
Collectives." Its purpose was to ensure that workers achieved growing influ-
ence in the day-to-day operation of thpir work places. Use of the conven-
tional macro-economic policy instruments, such as planning, price and incomespolicies, and fiscal and monetary noliries, ramainpd firmly in the hands of
the State. The respective spheres of competence of the State and of workers
in economic affairs was, at least in practice, well defined. In Yugoslav
eyes, however, this clarity was achieved only by depriving workers' self-
management of uch of it-s substance. Giving workers more real autonomy inmanaging their own affairs could not readily be reconciled with continuingto give the State direct control in the spheres of resource mobilization and
allocation.
1.15 As a response to this perceived shortcoming, the second phase inthe evolution of the system was initiated in the early 1996 0s. This appeared

-7-
to ue a logical attemLpt toL give practicai suDsLance to tne principie orworkers' self-management by reducing the control State agencies had overenterprise decision making. Tne Constitution of 1963 set the stage, and the"economic reforms" of 1965 (in fact, a series of economic measures taken bet-ween ;964 and 1967) provided a new framework for decision making. These mea-sures instituted two parallel and closely linked processes: "de-etatization,"which reduced the role of the state and "decentralization," which devolveddecision making from higher to lower level State agencies. These processesinvolved, among other things, abandoning central allocation of investmentfunds in favor of a self-managed banking sector that would have considerablecompetence and autonomy in allocating investable resources, reducing planningof "global balances" (macroaggregates) to a largely "indicative" rather thanbinding mechanism, 1/ devolving of the fiscal system, and greatly increasingthe role of the market. The operation of the market was to be enhanced byrealigning prices, abandoning multiple exchange rates, and generally liberal-izing foreign trade. Previously, the workers had the right to manage theiraffairs within their own enterprises, subject to the influence of the State indetermining the role of these enterprises within the economy; under the 1965reforms, workers were to manage their affairs independent of the State andsubject principally to the impersonal forces of the marketplace.
Economic Performance 1965-75
1.16 The "economic model" that emerged with the 1965 reforms was soonto reveal two important shortcomings. One was that the reforms significantlyweakened macro-economic management by reducing the number of macro-economicpolicy instruments. In the process of de-etatization, some of the State'spolicy instruments were effectively dismantled--notably, in areas of fiscalpolicy, resource allocation, and compulsory plan coordination and implementa-tion; in addition, policy making was regionalized. There was no attempt tointroduce alternate mechanisms for coordinating diverse economic objectives,and too few instruments of economic policy were left to pursue these obiectiveseffectively. The policy instruments, such as those fcor incomes and pricepolicies, that were still intact were perceived as implicitly running counterto the spirit of self-management, and consequently they were pursued half-heartedly and erratically. In effect, attempts to strengthen self-managementat the micro level had greatly reduced the scope for the short-term managementof the economy and for the pursuit of longer term objectives.
1.17 The second shortcoming of the 1965 reforms arose from the greatlvexpanded role of the market. Under the new system, prices were realigned,and many were freed; investment decisions were left to enterprises and theirconfreres, the banks; imports were liberalized, and exchange rates wereadjusted. Greater reliance on the market had many benefits, but the market
1/ Plans during the period were drawn up by the Federal Republican Plan-ning Institutes and formed the basis of investment derisinns and hbck-ground for policy measures by government authorities. They were, how-ever; "indinative" in thp ense fthat hepv did nnt imnnpo ann learl ormandatory obligations for social sector enterprises.

- 8 -
alone was not sufficient asa coordinating mechanism. The Yugoslav institu-tional framework created a number of serious distortions which hampered theeffective operation of the marke ot- The ' nl mobi lit-y .-if in vct-abeI f,,nA was
limited and, in practice, highly regionalized; the influence of enterprisesin pre-empting fun.ds for i4nvestment rn,cas d4sparate; and the f4nanc4al acco-rnt-
ability of enterprises was scant. Other distortions were created becausesom.e prices were freed and others were still- administratively .4-t-r ned
There was growing concern about negative social and political trends at theenterprise l1evell; thL-ese incue monoplisti -rcie -n -oto by -the,_-~ - -41
managerial elite rather than by the workers. Even if the market had beenallowed to operate efficiI ently, rellying solely on thLe L-aa r kC Le t would have been[
difficult for an economy at Yugoslavia's level of development; market pricescan be misleading in an- economy -under-oing rapid structural changes callin,gfor a medium-term perspective and development strategy.
1.18 Many of the negative economic trends of the period following 1965can bDe ascribed LU Ltiese weakInesseS in [UdCLu-euLLC pUlitcymakinIg adIIU i
market performance. The adverse impact of the reforms is particularly evi-dent in the ways inflation, the balance of payments, and resource alloca-tion were affected; the impact on employment and regionalization is lessclear-cut.
(i) inflation
1.19 After the mid-1960s, the Yugoslav economy was subjected to consider-able inflationary pressure. In part, this was because of difficulties inreconciling the demands on resources for investment and for consumption;partly, it was because of the built-in inflationary bias of the system.Until the early 1960s, prices had been fairly tightly controlled by theState, so there was a high degree of price stability. With the liberaliza-tion of prices, however, economic growth increasingly was accompanied byhigh and rising rates of inflation.
1.20 Before 1973, at least, the causes of inflation were principallydomestic. The reforms of 1965 had sought to shift the distribution of in-come toward consumption, but the lack of any mechanism to balance conflict-ing claims on resources resulted in significant upward pressures on prices.The inflationary bias built into the economic system added to these pressures.The response of wages to labor market conditions was much stronger in theupward than in the downward direction, and prices in many sectors of produc-tion were set on the basis of cost (cost mark-up pricing) rather than demandconditions. Thus, the nominal wage increases that resulted from inflationaryexpectations, from attempts to maintain wage differentials among enterprisesand sectors, from labor market conditions, and from productivity increaseswere quickly translated into price pressures.
1.21 With the liberalization of prices, particularly after 1965, theinflationary bias of the economy manifested itself in the form of largeprice increases. Attempts to dampen these price movements met with onlylimited success; too many policy instruments had been withdrawn, and thosethat remained were weakened by market imperfections. The use of fiscal pol-icy for demand management was now extremely cumbersome, and the governmentwas reluctant to rely on mandatory price and incomes policies. Monetary
policy became the principal, and often the only, policy instrument available,but it had significant shortcomings. The use of monetary policy to accomplishother objectives, notably the use of selective credit policy to influence re-source allocation, weakened its anti-inflationary impact. This was particu-larly evident in the difficulties encountered in neutralizing the effect ofchanges in Yugoslavia's international liquidity on its domestic money supply.In addition, institutional factors often frustrated changes in monetary policy.Enterprises could dampen the effect of restricting the money supply by build-ing up credits among themselves. This practice was aggravated and sustainedbecause enterprises were rarely forced into liquidation; thus, their financialaccountability was limited.
(ii) Balance of Payments
1.22 Yugoslavia's balance of payments was influenced by three factorsduring this period: a growing dependence on imports, a lagging export growthrate, and an increasing reliance on workers' remittances from abroad tofinance the widening trade gap. Greater dependence on imports was partly anatural outcome of the liberalization of trade and nartlv a nolinv respnonse to
the increased foreign exchange that workers' remittances made available. Thedependenre on imnorts was conrentrated in intermediate and canital goond. As
a result, restricting imports in times of balance of payments difficultydirctlyv nffonrtnr thA nniintrv' c cornnth rnto hxu re-iliring rZicndutriall nrnridncti nn
and investment rather than consumption. Given the inadequacy in short-termecononmic mnagemeont, .whicrh might haveo al levlate the need fo~r restr4rictng
imports, continuous growth was interrupted by a series of stop-go policies.In retrospect, a longer term trrade strate-g was needed.
1.29 Commod4ity exporrs grew consd4A-raly more -lowly ir. the period after1965. This was largely due to the export commodity mix in combination withth,e export mar'-el mix; the emphas4s was on products anA on markets thatLI- CA~ LI. Ua L¼C iU.. LI UILa L aLLL u LJIU-1. i. Lii fe. N"OLl
had relatively low trade growth, and there was little attempt to reorientthe export mix. Workers' rem4tta.ces, the principal source of increased
foreign exchange earnings, were vulnerable to external factors over whichdomestic policy hadu onLy limitedu control, and LLthu3s tLkey were a precartious
base for Yugoslavia's balance of payments.
(iii) Resource Mobilization and Allocation
1.24 The decentralization of decision making, as well as the intendedinoerelistribution in favor of -persor.a-l inL1 omes, C r-esulted in a hageiincLiJIiC LUL3 L . UL.LLL i L aLL Ltje uia. ILU O 1 C3UJ LU LIi a1 k_iiau1g" ±11
the pattern of saving and some decline of the domestic saving rate (24-25 per-cenLt as compared to previously very iligh levels. A tltough the Large inflowof workers remittances sustained the national saving rate at about 28 percent,th'1e marklet f or investable fundLuUs d'uring th :is per'ioU was characterized by exces-
sive demand as compared to available resources. Many factors contributed tothis: enterprises had little reason to fear risk-taking, because bankruptcywas rarely enforced; interest rates were low; the cost of labor was high; 1/ amajor objective of enterprises was to maximize the productivity of labor; andsocial infrastructure development made large demands on investable resources.
1/ Added to wage cost is that of enterprise social services contributionson behalf of workers.

- 10 -
1.* 25 Excess demand, in itself, would not have led to misallocation
and inefficiency if an appropriate mechanism had been available for ration-
ing investable f-Lds. WhLen t-e State investment fxds were abandoned in
1965, 1/ and an essentially indicative planning framework was adopted, coordi-
nation oL competing investment demands was left to the market. The market
had its limitations, however. The banks, which often had been founded by
the large enterprises in a republic, were strongly influenced by their
founders, so the capital markets tended to be regional, rather than national,
in scope. Miany different criteria were used to choose proJects for funding
making a rational choice among alternatives impossible. Ad hoc intervention
by the State and enterprises often led to compromicses that were not neces=
sarily based on the economic merits of projects.
1.26 Even if the market had operated efficiently, however--if current
market prices had reflected relative scarcities and if these prices had been
allowed to prevail--it is questionable whether the market is an appropriate
mechanism for allocating resources in a developing country undergoing major
structural changes. A longer term perspective, reflecting longer run objec-
tives and constraints, is necessary. The Yugoslav planning mechanism, had
it provided such a vision, could have done little to implement it.
1.27 As a result of shortcomings in resource allocation, there was a
tendency in the post-1965 period toward duplication and excess capacity.
The incremental capital-output ratio tended to rise, 2/ and there was a
shift to a more capital-intensive growth path; neither of these effects
was desirable or intended.
(iv) Employment
1.28 The performance of the Yugoslav economy in generating modern social
sector employment has been mixed. After 1965, employment in the social sector
grew less rapidly than before, but this does not appear to have been due to a
deterioration in the employment-generating capacity of the economy. Between
1965 and 1967, there was a once-and-for-all decline in employment as enter-
prises attempted to rationalize production and to increase labor productivity.
After 1968, the decline in employment growth mirrored the decline in the
economy's overall growth rate. In fact, employment-output elasticities before
1965 and after 1968 were quite similar. Capital-labor ratios did rise after
1965, but this was a consequence of rising incremental capital-output ratios.
1.29 Employment has always been one of the most pressing problems facing
Yugoslavia. Although the reforms of 1965 did not directly impede solutions
to this problem, neither did they contribute to a solution. One of the effects
of the reforms was the large transfer of labor out of the traditional agricul-
tural sectors induced by the increasing income disparities between those
1! With the exception of the Federal Fund for the Accelerated Development
of the Lesser Developed Republics and the Autonomous Province of Kosovo,
wihich was rreated sushequent to the 1965 reforms.
21/ The increase in output at the margin due to an increase in fixed assets
at the margin.

employed in the social sector and those in the private agricultural sectors. 1;Interregional migration tended to be limited, however, and this resulted invastly different labor market conditions among the various Yugoslav republics.
1.30 Conditions for external migration were considerably liberalizedin 1965, and migration abroad became virtually as important as the socialsector in absorbing labor. It particularly benefitted the more developedrepublics and, as a rule, the more skilled workers. In many instances, itaccentuated existing disparities. Although external migration brought sig-nificant gains, the social costs became increasingly apparent as more workersleft, and, with the recent changes in the attitude of host countries, itbecame evident that external migration could not be sustained as a vent forsurplus labor.
1.31 Incentives were lacking to develop alternate forms of modern employ-ment within the private agricultural sector or new forms of modern sectoremployment, such as small-scale, labor-intensive activities in the private orsocial sector. This placed the burden of job creation on established socialsector enterprises. Thus, by the early 1970s, despite large annual transfersof labor from the private agricultural sector to the social sector andabroad, the rate of open unemployment began to increase appreciably, whichreflected significant disequilibria in the labor market. 2/ The market, byitself, could not be expected to cope with the employment problem, and itbecame imperative to enunciate and implement a comprehensive employmentstrategy.
(v) Regional Policy
1.32 In contrast to areas in which emphasis had been placed on de-etatization; the 1965 reforms, estahlished for the first time a federal agency
specifically for transferring funds to the lesser developed republics.Regiona] disnarities in incomes were;. and continue to hbe one of Yugoslavia's
key economic problems, but establishing this federal fund has been importantin stPmmningj nd recentlv s,lightly repduing these riiqnsritiPe. Thp suiirces nf
this coordinated approach has been less than complete, however.
1.33 The Federal Fund for the Accelerated Development of the LesserDe'veloped Repnuhlics transfers financial resources to 1Pesser develoned
regions by providing low-interest, long-term credits. This, along withmni fnrm an'fll Qp'rtnr W:1COPQ h:Q A cmlrapti rInnl tiiirr l v rnt tn1--in ton qiUP
development. The most abundant resource in the lesser developed republics--labor--has b~een left- underutilized * Furthermorej the npurelv finnrcial trans-
fer of resources, though a necessary condition for development, has not provento be a sufficient condition. Thaere has been only a relat4ivly modest transfer
of technical and managerial know-how--a crucial ingredient for development--
1/ These disparities increased sharply immediately after the reforms, butthey were gradually redAressedA.
-U- Labor .aret in _ thi study, is usedA as a sh-orth-and for lzbor supplyL/ .LdUUL UlJ.. NC L , .LLI LAI.LO O L.UUy , .LO 3 u ~ LJL L.L LI U I_.J Ja. vk Vy
and demand. It is not used to denote an actual marketplace whereLabor 'Ls actuadlly tranisacted, wh`1ich would r-LUll counter to thile basic
philosophical premises of the Yugoslav system.
- 12 -
to the less develoned repnublics. As a result; industrial growth, thoughrapid, has been concentrated in a limited number of large enterprises, andoften it has heen high1v canit2l intensive; its ir,ome effects nave heenfairly limited, and its economic benefits localized.
(vi) External Events of 1973-74
1.34 The diverse problems that persisted in the wake of the 1965 reformswvere sharpened by events of 1973 and 1Q74. Fuelo 1 by r Itrnal inf lation,
domestic producer prices rose by 30 percent in 1974 as compared to 13 percentin 1973. Pi s cird I pric ar.d t-no on -in ro cession in Eurone adverselly
affected Yugoslavia's balance of payments. The 1973 current account surplusof TJS$464 mllion shifted to arecord deficit of nearly US$1.2 billion. Theemployment situation, already unfavorable, was exacerbated by returningmigrants; between 1974 and 1975, some 150 thousand workers returned = a figure30 percent higher than the natural increase in the labor force during the
period . ,LLe new conditions surroudng emloen of Yuolvokrsaraper L)U LI~ LI W .AJIUL LULO OL 1.'4 ILU. L LUj uy _L LU.LI L '4 U5rc _La V WU L MN_J. d UL Ua. U
have also had significant adverse effects on the growth prospects of workers'LerLwttances. 't would require ___1fian stutua chne in -h - ecIto---nor4-uy-----_-renL L LdILc .L ULU £ 4L L aJ .tL LL-L L _aCLI L- n LL Ut-LLUL CL L ULICdAt~ 61= iiL1 L I U ectfULIUuy
in order to adjust to the increased burden of petroleum imports and to theuwicertaili LUtUre Of work[eLrus' ittances.
TLhe 1974 ConstLtution andL its C uL-mi.LC IL-LpLLL:U LiL
1.35 In the early 1970s, the growing awareness of the need to find moreeffective solutions to Yugoslavia's problems led to further evolution of thesystem of economic management. Tne constitutional amendments of 1971, thefirst important steps in this direction, were followed in 1974 by a new Con-stitution which encompassed these changes, introduced others, and paved theway for major revisions in the system of economic management. 1/ Althoughthe motivations and consequences of this Constitution extend beyond strictlyeconomic factors, there is much to suggest that the changes were, in fact,a response to current economic problems.
(i) Macro-economic Management
1.36 The most important consequence of the Constitution is to extendthe principle of workers' self-management to macro-economic decision makingby introducing various workers' self-managed macro-economic instruments. Thisreflects a realization that ad hoc intervention in the economy had been lesssuccessful than anticipated and that a consistent framework for macroeconomicmanagement must be agreed upon if short-term economic stability is to beensured and longer term aspirations fulfilled. The interesting and novelfeature of the Constitution is that it achieves this objective without trans-gressing the rights of workers to self-management; rather, it makes self-man-agement an integral part of the new instruments of economic policy. These
1/ It is important to bear in mind that many of the new instruments andinstitutions codified in the 1974 Constitution were introduced withthe constitutional amendments of 1971. The 1974 Constitution is sig-nificant in that it consolidates these earlier changes and provides acomprehensive and consistent vision of the new economic system.

- 13 -
new instruments consist of a new planning mechanism--self-management plan-ning--which will affect principally the allocation of resources, and theuse of contractual agreements--Social Compacts and Self-Management Agree-ments--to govern such diverse areas as prices, incomes, and employment.
1.37 Self-management planning involves the participation of all economicdecision makers--nongovernment as well as government. Under this system,each group prepares its own plan based on a predetermined and standardized setof indicators that describe current conditions and future exnectations. Theprocess of coordinating these diverse plans involves a series of successiveadiustments. or comnromises- amnng the variOs plan mAkers. ml This "iterativeprocess" is based on mandatory free exchange of information among all parti-cipants. The law on planning distinguishes at an early stage in the plannin.gexcercise between those activities that are identified as priority sectors,and a1l ntther activities. TI the case nf priority activities, consistency ofplans by a prescribed date is mandatory, and the plan that is agreed upon mustbe codified in legally binding agreements among affected parties; if a dead-lock should occur, government agencies can impose a temporary injunction andis suei temponrnary in st-ruiof-4 ns. ITn the case of nonpr4 o-rity sons
consistency is encouraged but not mandatory.
1.38 The unique feature of the planning mechanism is that once broadconsistency among individAual plars 'as been attaired, partcicpanits are ex-pected, or even required, to enter into publically negotiated, legally bindingcontractual arrangements -- Social Compacts and Self-Ma,nagernent Agree-ents.These agreements involve the participation of all parties affected, and theyare valid onLy Lor the signLatories, but they can be contested by any partywho feels his interests have been violated. The Agreements will cover thequantities of goods to be produced and transacted, prices, the origin anduse of investable resources, and all other facets of the relationship betweenthll partiles. Tne plan period is five years, with supplemental annual plansensuring that the process is continually monitored and adjusted.
1.39 These Social Compacts and Self-MIanagement Agreements are not new;what is new is that they are recognized explicitly and will, in addition totheir role in planning be widely used as an instrument of economic policy.The Social Compact is designed to promulgate broad policies in such diverseareas as prices, income and employment. Economic organizations, State agen-cies, and trade unions participate in the formulation of a Social Compact,and, once it is signed, for all practical purposes it has the force of law.The Self-Management Agreement is a much more specific agreement than theSocial Compact. It is akin to a civil contract among a limited number ofeconomic organizations. The Self-Management Agreement is intended to deter-mine specific obligations of the parties to ensure the fulfillment of the moregeneral objectives agreed upon in the Social Compacts, and it includes compen-sation clauses for noncompliance or violation. Social Compacts are particu-larly useful in the areas of stabilization and employment policies.
1.40 The process of negotiation and compromise that underlie theseinstruments could prove to be extremely cumbersome and time consuming, andit could result in deadlocks. Foreseeing this, the Constitution has providedthree countermeasures: (i) to expedite decision making, a stepwise system
- 14 -
oL dueLegates represetig successively 'Larger and Larger groups o'L worke rsospecific interest groups has been instituted; (ii) in case of a deadlock andfor iLatters of vi tal national in t-ll 6)-LL[iInL can take emelgencymeasures until an agreement is reached; and (iii) the Constitution has assured
s __ _ t _ _ : _ s ^ a Cl _: _ 1: L ~~~~~~~~~~~~~~~~~A 1 1: _ 1stroIIg cUIIbsi Ve ei'LemeLLit LIILrougii Lllthe uoLaL Ull Ut L'ie SoULds l.L lr | ^Lane t 'le
trade unions, and--above all else--the League of Communists (LCY). These arenot new organizations, but they have been considerably strengthened. LTe
LCY, as "the organized force of Socialist Consciousness," is likely to play adecisive role in encouraging various negUtiatilng parties to reaCh agree-mentamong themselves; and act as an arbitrator where this fails. The LCY embracesthe principle of "democratic centralism," obliging ail its members to act inaccordance with any resolution the LCY adopts, and it includes the politicallymost active segment of the popuiation. Tnerefore, any position taken by tneLCY strongly affects decisions at all economic and political levels.
(ii) Micro-economic Decision Making
1.41 The economic implications of the Constitution extend beyond itsimpact on macro-economic management into a second area that is less immediatelyapparent, but no less important. This area encompasses a whole set of measuresthat potentially improve the effectiveness of the market as a mechanism forcoordination and decision making. Although the "1965 model" was frustratedby a number of important shortcomings in the way the market operated, therecent changes do not see a reduced role for the market per se. The new con-tractual arrangements are not intended -to supercede the market; in fact,contracts are expected to be formulated on the basis of market signals. TheConstitution attempts to make the market mechanism operate better mainly byincreasing the checks and balances on the actions of decision makers. Thereis a new emphasis on ensuring greater accountability in the operation ofenterprises and increased competition among them. This emphasis is evidentin a number of areas such as the atomization of the industrial structure intosmall, autonomous operating units called Basic Organizations of AssociatedLabor (BOALs), with new forms of inter-enterprise financing and new accountingregulations governing the calculation of enterprise income and the settlementof inter-enterprise debts.
1.42 BOALs were created to be the building blocks which together formlarge enterprises. A BOAL is the smallest operating unit which produces amarketed or marketable output. In principle, BOALS are free to join eachother, and they have the right to separate, subject to the conditions agreedupon at the time of association. Stringent regulations governing the calcula-tion of income and settlement of outstanding debts impose considerable dis-cipline on BOALs. Transfer prices among BOALs are to be made explicit, andBOALS retain the rights to distribute their incomes between personal incomesand accumulation, to allocate investable resources, and to retain claims overfiinds invested outside the BOAL. BOALs are expected to provide funds to eachother, not only on the basis of fixed interest, but also through a newlyin.tit1it-P(d fnrm nf limitped inint ventnire- Partifinantq in this tvne nf rela-
tionship decide on the use of funds and the sharing of income and risk.

- 15 -
1. '-t 1IIe r.LLLiternt uIIUL rthe nLew Constitution to LncLreeL UoevelUp-
ment of the individual sector is evident in the new legal provisions for set-ting up cooperatives anud mixed social-individual sector entities called Con-
tractual Organizations of Associated Labor (COALs). A COAL is basically anenterprise" in wlnich a private individual contributes 10 percent or more or
the initial capital. If there is more than one person involved, each individ-ual's contribution must be at least 10 percent. The founders of the COAL workin the COAL but earn, in addition to their wages, income based on their shareof the paid-in capital. The details of the arrangement are negotiated with theworkers and spelled out in a Self-Management Agreement. One of the basic ideasof the COAL is that, over time, the founder should be paid back his initialcapital. This has the effect of transforming the COAL into a social sectorenterprise proper.
1.44 in addition to these new institutional forms, the Constitution hasintroduced the "Communities of Interest," an organization designed to bringboth producers and consumers together to deal with transactions that, bytheir nature, cannot be handled efficiently through the market mechanism;these transactions will include many involving goods with public good charac-teristics, various types of social services, and nontraded goods.
(iii) Economic Implications
1.45 It would be premature at present to judge the ultimate impact ofthese constitutional changes on the economic performance of Yugoslavia. Anumber of the more salient features of the recent changes on various policyquestions are already discernible, however, and these can serve to highlightat least the potential impact of some of the recent measures.
1.46 Resource Allocation. The most radical changes are evident in themechanism for allocating resources. The most significant innovations arethe introduction of self-management planning, a procedure for coordinatingindividual plans, and legal instruments which represent a binding agreementamong all parties to abide by the ultimate, coordinated plan. The process bywhich plans are simultaneously coordinated and agreement is reached resemblesin important respects an attempt to simulate the operation of forward markets,in which commodities are traded on the basis of future prices and forwarddeliveries. Furthermore, by specifying the origins and uses of investableresources, the planning mechanism provides an alternative to the impersonalcapital market, which has always been difficult to reconcile with Marxistthinking. The Yugoslav mechanism provides, as do central planning models,prior coordination of resource allocation; this facilitates structural changeand reduces market uncertainty. Yet, unlike central planning, it is notimposed, but participative; it is based on an exhaustive exchange of inform-ation, so in principle it should reflect the revealed preferences of indi-viduals and ensure a strong commitment to plan implementation.
1.47 The nlanning nrocess leaves a number of issues rnresolved- however.The iterative process of coordinating individual plans is excessively timeronqiimino- and it- also malkpsq criim'hromTn t-he nrocess of ndriiiqt-ina t-he plan to

- 16 -
new conditions. Above all, there is considerable ambiguitv surrounding theprocedures enterprises will use to achieve agreement on production targets.Conrenttiallvy the use of cost-benefit analysis based on anoronriate scarcityprices could act as an objective arbitrator among conflicting demands; innrarticre however, there is little to indicate that such techniques have beenwidely used. In short, although the planning methodology offers a novel andchallenging framework for improv'ino the effiriency of rsouirep nllor2tion, a
number of important practical issues will need to be resolved if its fullpotential -is a roo be raized.Refinemetnt of projecOt evanluation techlniquesC
would also positively contribute to improving resource allocation at theniro=c. .onr,ni lev 1,el.
1 /. Q T A4 to,1 4-; e; 44..; A4,1; o r., frtoA.,nr1, Fr,r n r ,-4on PA;nn o- r n AA; - V * n 1 t advt1L.lVVv t5 L.'o V v V V a * -- i--i--
making, the Constitution has introduced a number of measures that can improveanu strengthen ruarket forces and., ultimatelly, resource allocation. The most
notable of these is an attempt to reform the industrial structure by vestingthLe Uecision-ataking f.unct i4on ol enterprses in 4thir cons 4 ituents--the
BOALs. The large size of Yugoslav enterprises, compared to internationalstandUard's, andU their high propensiLty to grow, presents a udilemma in the
application of workers' self-management. First, for self-management to be ameaningful concept, it has to apply to relatively small collectives with nwhich individuals of fairly homogeneous views and interests can communicateeas ily. Second, the large size of enterprises counteracts the effectivenessof the market mechanism. Large enterprises may have easier access than smallones to investable resources; they may more easily engage in collusive behavior
and exclude a growing number of transactions from the market place. TheBOALs represent the means by wnich tne new Constitution and the Law on Asso-ciated Labor seek to resolve this dilemma, by atomizing the economy's enter-prises into small decision making units.
1.49 By greatly increasing the number of independent and separatelyaccountable entities, the roles of the market and of competitive forcespotentially have been much expanded. At the same time, the transparency oftransactions and the lending among BOALs are expected to reduce opportunitiesfor monopolistic behavior and the accrual of pure economic rent. Furthermore,the ability of BOALs to enter into joint ventures, sharing risk and income, inthe long run could result in a de facto "market" for investable resourcesthat would more closely reflect opportunity costs of investable funds. Toovercome the diseconomies of scale that are likely to occur with such anatomization of the economy, the Constitution recognizes a number of alter-native forms of integration. Enterprises consisting now of a number of BOALslinked through a contractual relationship are expected to remain the mostimportant economic organization. The autonomy of BOALs is safeguarded,however, by the right of BOALs to join or separate and by the requirement thatall major enterprise decisions be approved by all constituent BOALs. Analogousto the association of BOALs in enterprises, enterprises are also expected to"integrate" horizontally or vertically. The emphasis is expected to be onvertical integration based on interindustry linkages between enterprises.It is hoped that the atomistic units which form the foundation of the economycan be brought together on the basis of economic principles, such as verticallinkages and economies of scale, in order to create a more efficient economicstructure than one based on historical factors.

- 17 -
1 CA .JSA . 1 l r . r~~~~~~~~~ 7
1.50 Two aduditional features of the Constitution also nave implicationsfor resource allocation. The creation of the COAL addresses some of thehandicaps tne individuai sector nas faced; it is designeed to provide greaterparity in the opportunities available to that sector. The new Self-managementCommunity of Interest, by acting as a forum for consumers and producers toconfront one another, is expected to provide more objective assessments ofthe revealed preference of consumers and of the costs ot producers. Ineffect, the Communities of Interest substitute both for the self-regulatingmechanism of the market and for the regulating or administering agenciesof the State.
1.51 Prices and Incomes. The new Constitution, through the institutionof Social Compacts on prices and incomes is likely to ease the task of stab-ilizing the economy by reducing the burden on monetary policy. A SocialCompact on prices which reflects a political consensus against inflationcan act as an instrument helping to curb the inflationary spiral. A SocialCompact on incomes can ensure that the growth of personal incomes is in linewith growth in productivity and provide a mechanism for regulating the dis-tribution of resources between personal incomes and capital accumulation.Social Compacts are only one of a number of features of the new Constitutionthat are likely to strengthen the operation of monetary policy. In general,the need for selective credit policies will be reduced, and greater enterpriseaccountability will prevent uncontrolled build-up of involuntary credits.
1.52 Employment. Social Compacts and Self-Management Agreements havealso helped Yugoslavia to adopt a broad employment strategy. Social Compactshave been regulating such diverse areas as growth of social sector employment,development of small-scale industry, and encouragement of growth in the in-dividual sector. The object of these compacts with regard to employment isto ensure (i) conscious regulation of the growth of employment opportunitiesin the social sector and of the labor-intensive activities that are beingdeveloped as agricultural alternatives, and (ii) an explicit recognition ofthe potential trade-off between maximizing growth in worker productivity andgrowth in employment.
1.53 Regional Policy. Regional policy has not been directly changedby the new Constitution. The Federal Fund and the budget, through a processof financial transfers, remain the basic instruments for accelerating thedevelopment of the lepser developed republics. In contrast to the past,however, under the new planning system Social Compacts orovide a way ofsupplementing pure financial transfers with other policies. These may includejoint ventures involving enterprises in developed republics and those inlesser developed republics, relocation of industry and/or labor, and specialmeasures to encourage specific tvnes of industrial growth such as labor-intensive activities. The new framework offers considerable potential forinnovative nolicieps though at nrpepnt it is~ dilffiuiilt to-n ass how far thecswill be realized.
1.54 Foreign Trade. The new Constitution has introduced significantchanges in the field nf fnreign trade, but, again, the effect of the changesis difficult to interpret. The new law contains two major innovations: a
- 18 -
new prnciple for allocating foreign exchange,-and new instituti-n for -akinELCW tJ tLI V_~ Ljt -S. -_a --.J~ -. t1-r tJ .LI .-l~a a. - -fl~ -1 - - - - 1
these allocations and for monitoring balance of payments developments. 1/ Pre-ViOUs.Ly, foreign -char.ge was allo.ated according to a f retention
quotas which were linked to an enterprise's ability to earn foreign exchangeand according to thLe depreciation allowances on LLLhe e ntpI equpm pnt .r
The allocative procedure was biased against enterprises that provided the
inputs Lfor coriimUUdities thLat were exporteLu, because Lh L'Le retention quotas appiJ±eu
only to the direct exporters. To harmonize foreign exchange requirements with- 1___ ,. .1 - ..tile new ConbstitULtlU[l b pii.l 0 -bphy p ildL WUL (rsL O IUU L UL lIV r bL za WL L IL-Uc 1 L ett
over questions that affect their interests, the new law abolishes the old
retention quotas system and substitutes contractual ---- [--t-- ----- enter-
prises on how to share the pool of foreign exchange. The guiding principle ofthese agreements is that foreign exchange resources siould bue sharedU on the
basis of each enterprise's contribution towards earning foreign exchange. Ineffect, the scheme amounts to distributing foreign exchange on the basis ofvalue added by an enterprise, either directly to exports or indirectly by pro-
viding inputs to the exports of other enterprises. Tnis scneme may provide anequitable means of distribution, but it fails to distribute foreign exchangeto enterprises on the basis of their need for foreign excnange and on the basisof the most productive use of foreign exchange. Enterprises are permitted to
share their foreign exchange, but no secondary market for foreign exchange isforeseen. Consequently, under conditions of scarcity, the procedures adoptedmay not in themselves, lead to an efficient distribution of foreign exchange
resources.
1.55 Linked to the new procedure for distributing foreign exchange is
the establishment of Communities of Interest for Economic Relations Abroad.These Communities will be established in each republic and they will include
all users and earners of foreign exchange. The basic function of these Com-munities is to determine the distribution of foreign exchange among republics,
and subsequently its distribution within republics -- that is, among enter-prises. Annual balance of payments projections, by republic, with targeted
surpluses and deficits will form the basis for distributing foreign exchangeamong republics and also the basis for extending rights for republics to bor-
row and lend foreign exchange among themselves. Distribution within republicsis decided subsequently through a process of negotiation among enterprises.The precise mechanism for operating this scheme is unclear, as is its rela-
tionship to the principle of allocation according to contribution.
1.56 It is hoped that the Communities of Interest, acting as forums for
distributing foreign exchange, will induce enterprises to be more consciousof the foreign exchange implications of their activities and thus foster abetter distribution of foreign exchange. In addition, the process of annual
balance of payments forecasting and the linkage of borrowing rights to fore-casted foreign exchange requirements are expected to provide greater controlover the balance of payments. In particular, it is hoped that a more coor-
dinated and planned approach towards foreign borrowing will develop. Clearly,
1/ Most of these changes are embodied in the Law on Foreign Exchange Oper-
ations and Credit Relations with Abroad (March 1977).

- 19 -
there will be much to learn when the system is actually put into operation;the precise mechanism that will be used to determine interenterprise alloca-tions of foreign exchange has not yet evolved, and the practical implicationof involving the republics in balance of payments decisions remains to beseen.

- 20 -
II. MEDIUM-TERM PROSPECTS: THE FIVE-YEAR PLAN, 1976-80
2.1 The growing integration of Yugoslavia into the world economy hasinevitably exposed the country to the fortunes of Yugoslavia's principaltrading partners. The stop-go policies of the past decade reflect the grow-ing interdependency between the country's domestic growth objectives and theconstraints imposed by the balance of payments. This growing vulnerabilityhas been precipitated by two factors: the growing importance of foreign tradein the economy and a number of structural changes that have characterized theevolution of the balance of payments in recent years. The most important ofthese structural changes have been the growing orientation of trade towardsmarket economies, particularly those in Western Europe; the increasing relianceon workers' remittances as a principal source of additional foreign exchange;and the prominence of intermediate and capital goods in Yugoslavia's imports.
2.2 Unlike its imports, Yugoslavia's export structure is diversifiedboth in terms of commodity composition and market orientation, and this hasbeen an important factor in moderating, and at times shielding the economyfrom, the influence of external events. This can be clearly seen, forexample, in the way YuRoslavia has been able to shift the direction of itstrade between its Western European partners on one hand and Eastern Europeanpartners on the other. Despite this built-in flexibility, the Yugoslaveconomy over the years has become increasingly more vulnerable to externalevents.
Recent Developments
2.3 Table 1 compares for recent years certain elements in Yugoslavia'sbalance of payments situation and in its economy. The link between its balanceof navments situation And the nverall growth rate of its economy can hp celnrly
seen. For years prior to 1972, Yugoslavia's current account deficit had in-creased, and international reserueq were lnw nnd declining; at the same time,GMP growth rates were relatively high. In 1972 and 1973, the current accountdeficit was reversed bhit there was a percenrihle decline in the growth rate ofthe economy. In 1974, the combined effects of rapid economic growth in Yugos-lavia at a time when the Western indiuctrialized nations were oning th-rnugh a
recessionary period and of the four-fold increase in oil prices led to adramatic return of the current account deficit, which continued through1975. The adoption of strong controls led to deceleration in the growth rateof the economy and, in 1976, to a somewhat unexpected surplus in tte currenLaccount. This surplus, however, was achieved by depleting stocks of importedcom.modities and by restLriLcting -croi ------ io to- wha - is, by- I'l oLAJUWlJ L CO aiu uy £ CO L -£L L16I. 0 CLkULILUt.L. =JCpii I JLOLL L.J WILIta -LO, U)' ±U U _a
standards, a very modest rate. It is to be expected that the current accountUtefliU L Wili LtlUL as LhLe ecoouiiuy m omULetLUU i' LCb LULrtoU dLIU db stLUcKs are
replenished.

- 21 -
Table 1: SELECTED B^AT-0CE OF PAVME'NTS AMD GRPOWTH. DE!fELOPMP'NTS, 1970-76
(Millions of US dollars unless otherwise noted)
YearTtem 1 n7n 171 1) a7 1 A7' 1 71. 1 Q7r 1 07C
LeLiL 171L1 1211 1- 7l . l itJ | 7121 1. 7 J 1 J- U
Trade deficit -1195 -1439 -990 -1658 -3737 -3625 -2489Workers' remittances 440 652 889 1301 1511 1575 1728Current account deficit -340 -358 418 464 -1184 -1032 150
Official reserves aspercentage of imports 4 6 19 26 14 i0 24
Real GMP growth (percent) 6 8 4 5 9 3 4Change in producer
prices (percent) 9 15 ii 13 29 22 6
Source: National Bank of Yugoslavia and Statistical Yearbook of Yugoslavia,1977.
2.4 The external events of 1973 and 1974 obviously had a sudden andsignificant impact on Yugoslavia's current economic situation. Their import-ance extends beyond their short-term cyclical impact on the economy, however;they have also had a significant impact on Yugoslavia's medium-term outlook.The legacy of the events of 1973 and 1974 are most apparent in two areas. Thefirst, and the most obvious, is the balance of payments. The sharp increasein the price of oil has permanently boosted the country's import bill byUS$600 million; this was an addition of nearly 8 percent to commodity importsin 1974. Ilore importantly, the external recession that followed sharplyreversed prospects for migration by Yugoslav workers, and this has inhibitedthe growth of an important source of foreign exchange--workers' remittances.Between 1970 and 1973, workers' remittances grew by nearly 44 percent a year,accounting for 22 percent of Yugoslavia's total current foreign exchangeearnings in 1973. In contrast, merchandise exports grew by 19 percent duringthis period. Between 1973 and 1976, workers' remittances grew by only 10percent, a decline that is even more significant if tihe higher internationalrate of inflation in the period after 1973 is taken into consideration.The growth rate in merchandise exports did not change. This slackening rateof foreign exchange earning, along with the oil-inflated import bill, hasmade the balance of payments a potentially more binding constraint on economicgrowth, a factor that has significant implications for Yugoslavia's medium-term development prospects.
2.5 The second area that will be affected by the decline in externalmigration is employment. Table 2 summarizes the employment status and sectoralstructure of the labor force in recent years. Between 1969 and 1973, thenumber of workers absorbed by external migration increased by more than 500thousand, nearly twice the national increase in the labor force and almost

- 22 -
equal to theinraeisoilsco rplyetdrnthpei. *ec,~~(4Ud -1. LU L ~~Li l LI L t::CZIt IL 0Uk--L-La 3t-tL.L UJ. LL L ±U YIt= iLL UUL- T7_Lt_jJt.LU
external migration was a key factor allowing the low-productivity, privateagrlculturald labor force to LUeclinLe Latpi.LUy inL s i. Ate 197 however, Lthe
situation was dramatically reversed. External migration virtually ceased andlarge numbers of workers returned LU IUgUoLsVLa. rUL Lthe LfL..t.L LL since tile
mid-1960s, the resident labor force began to increase. The net reflux ofworkers between 1973 and 1975 equalled Ltle nIaLural increase th Lilt ±abor Lorce.This put considerable pressure on the social sector to create additionalemployment opportunities, but despite a rapid growth in social sector employ-ment, there were sharp declines in migration out of the agricultural sectorand perceptible increases in open unemployment.
Table 2: EMPLOYNENT BY MAJOR SECTOR, 1969, 1973, and 1975(Thousands)
Employment Status and Sector 1969 1973 1975
Actively employed 8,579 8,801 8,823Residents 8,007 7,701 7,923
Social sector 3,622 4,222 4,667Private agriculture 4,095 3,145 2,897Other private employment 290 334 359
Temporary migrants workingabroad 572 1,100 900
Unemployed 198 229 324Total labor force 8,777 9,030 9,147
Sources: Statistical Yearbook of Yugoslavia and World Bank Estimates.
2.6 The present study is concerned with analyzing Yugoslavia's medium-term prospects, taking into consideration the implications of the 1973/74events. In addition, a portion of the study will focus on the long-rangeproblem of regional disparities in Yugoslavia. Although this issue was notdirectly affected by the recent events, it does represnt one of the criticaland, at the same time, least tractable issues facing Yugoslavia.
The Balance of Payments and Economic Growth
2.7 Yugoslavia's potential for maintaining a rapid rate of economicgrowth hinges on the country's ability to mobilize significant externalresources. But the country faces a sharply higher import bill, a problemcompounded by a perceived erosion of the economy's long-term foreign exchangeearning capacity. The Yugoslavs could have responded to these conditions inone of two ways or a combination of both. First, they could have initiatedpolicies, such as an export promotion drive, designed to increase the country'sforeign exchange earning capacity in order to compensate for the deterioratingnrospects for workers' remittances. Second, they could have attempted to

- 23 -
reduce their future foreign exchange requirements by lessening the country'sdependency on imports; that is. by import substitution policies.l/
2.8 The present Five-Year Plan opted primarily for the import substi-tution approach. This is apparent in the Plan's overall export and importtargets. The growth rate of exports, though somewhat higher than the his-torical rate, is nevertheless broadly consistent with past experience; thegrowth rate of imnorts is considerablv below the historical rate. The nroi-ected 4.5 percent growth rate in imports, coupled with a 7.0 percent growthin GMP; would imnlv an imnort elasticirt of 0.64 nercent -- aboiut onp-t-hirdbelow the historic level. Such a sharp reduction in import elasticitywould imnlv a conniderahle degree of imnort- substitut-Jon, RBcrusie 90 nprcentof Yugoslavia's imports consist of intermediate and capital goods, any signi-ficant amount of imnort Qsuhbs-itiituion wurild req-ii,ire consiiderable restructuringof the economy. The analysis in this study confirms that the industries givenpriority in the Five-Year Plan are those output has tended to lagmainly as a result of growing import dependency. The Plan's strategy, then,is to develop import substitutes in those sectors that were most directlyaffected by growing import dependency since 1965.
2.9 The economic justification for the specific strategy chosen bythe Yug oslavs cannot bDe readily assesseA. cucl an assessment w-.ul requir
detailed project data on the various investments proposed and an evaluationof Yugoslav4a's comparative davantage in thVese areas. TI partic-ular i.
would be necessary to compare the cost of saving foreign exchange by develop-ing import substitutes with `at of earning additional foreign exchange bypromoting exports. This is beyond the scope of this study, and such an assess-ment h'das not bUeen undertaken.
1) lr n L L. - gron', _ o_wever , tL statg un eLy_. ._ng ._L. U UnLI trLL1Lly a pLiL ULXUULIUb, I UWCVCL 1 LLl bLL dL-L U UU L.y1
the plan cannot be faulted. It is true that insofar as the priority sectorstend to be amongst the more capital-intensive the plan's emphasis may JeUp-ardize the attainment of the country's employment objective. On the otherhand, while there is no direct evidence to suggest that the slower growth ofdomestic intermediate and capital goods industries since 1965 was due to in-cppLupL.LidLe pL-LUX X1ig pUoLi Ucieb,s, LthUere Lb CViUItICU LtIda coU[UmCLaLd.l poULLcy U1
criminated against many of these industries. Tariffs during the period favoredfinished goods, providing them high effective rates of protection. In conLrast,there were low nominal and effective tariffs on raw and intermediate goods.This is likely to have contributed to the shift in tne pattern or resourceallocation away from sectors producing raw and intermediate goods and towardthose producing consumer goods. Emphasis on import substitution, as opposedto export promotion, is a more prudent strategy given the uncertainties sur-rounding the future prospects of the world economy. Analysis indicates that
1/ Import dependency is measured by the ratio of imports to gross output.

- 24 -
Yugoslav exports in recent years have been concentrated in markets and pro-ducts that have been relatively slow growing. Although Yugoslavia has a verydiversified export structure, its products are subject to intense competitionunder present fairly weak market conditions. Import substitution offers amore certain path to external economic balance and one that makes the domesticeconomy less vulnerable to future externally induced oscillations.
2.11 This study's assessment of the new Five-Year Plan takes a somewhatdifferent, if more modest, tack. Because detailed sector or industry datawere not available, the analysis is conducted at an aggregative level usinga two-alternative macroeconomic models. The analysis attempts to determine:(1) the internal consistency of the Plan, (2) the extent and plausibility ofthe import substitution assumption implicit in the plan, and (3) the impli-cations for the overall objective of the plan if the implied degree of importsubstituion were not realized.
(i) Internal Consistency and Structural Change
2.12 The present study uses a static input-output model, which also wasthe basis of the Yugoslav planning exercise, to analyze the overall internalconsistency of the plan. The estimates derived by the model indicate that,based on the gross output targets, the Five-Year Plan appears to overestimatethe growth of aggregate final demand. In other words, if inter-industryrelations are taken into consideration, the targeted growth in output andimports will not be sufficient to achieve the targeted growth of consump-tion, investment, and exports. The target growth rate for at least one of thecomponents of final demand will have to be sacrificed. This would imply, forexample, that consumption would grow less than is expected, if the investment,export, and import rates are maintained; conversely, the level of imports mustbe higher than expected, if the other targets are to be achieved. Assumingthe adjustment factor would be imports, the implicit growth rate of importswould be 6.0 percent rather than the 4.5 percent rate the Plan calls for.
2.13 The inDut-outDut model of the economy was used similarly to assessthe extent and character of import substitution implicit in the Plan. Basedon historic trends; an indenendent estimate of sectoral and industrv finaldemand was made using the Plan-estimated aggregate growth of consumption andi nnvesqt-ment -This esqt-iimated vector of final demand was then cont-rastedi wththe Plan vector of gross outputs. Imports were treated as a residual in orderto ensure consistenc- between the estim,ateed finial demand vr etor anrd t-he Plar.
vector of gross outputs. By deriving imports residually in this fashion, thePl' il sectoral and irdustrial shifts in import ratios can be ana-
lyzed. The results confirm that the Plan implies a significant sectoralrestructur,ing of im.ports. T1he share of the op of riorit sectrstheir respective domestic markets will have to increase considerably duringthis period. At th-e sam,e ti.me, the growth 4n -4-4-oit --ivts ----L LL jJL 4 L4U L-L Li ~~1C L~LL L~LC r,i VW L.LL -~LLL&JL. J M L' J- y ~ V .L . US L~= , PI.C
ponderantly consumer goods industries is considerably below the projectedgrowLt0L1 UL cUUnsumptLnLUL. *UoLLsequenLtL ty Ller e WLue d a t:d uejeliueLL)' uu
imported consumer goods, if the present patterns of demand are to be sustained.

- 25 -
2.1+ WIat emerges rom tile analysis is a significant restrUULUctLilg (limports, with import dependency increasing in some sectors and sharply declin-ing in others. The decline in some industries is particuiarly noticeabie; inchemicals, for example, import dependency would be reduced 60-70 percent andin ferrous metallurgy, 40-50 percent compared with a decline of about 20 per-cent in other priority sector import ratios. 1/ Although determining thefeasibility of such declines in import ratios would require a detailed project-by-project analysis, which cannot be undertaken here, such large reductions doraise a number of questions. The new system of planning based on forward con-tracting may provide an effective vehicle for ensuring that increased domesticproduction is, in fact, used to substitute for imports. Even with this assur-ance, however, the costs of such a significant reduction of imports may behigh for several reasons:
1. Providing domestic intermediate goods of a quality and speci-fication comparable to those imported may be physicallyimpossible in the short run and difficult in the medium run,particularly in view of the wide array of intermediate goodsthat would be involved.
2. In certain sectors, import substitution may be difficult inthe short run because of existing contractual or licensingarrangements between domestic and foreign companies.
3. The fall in import ratios implied by this analysis representsthe net substitution of domestic production for imports; ifthe indirect import content of domestic production is takeninto consideration, a considerably greater amount of grossimport substitution must take place.
4. The trade gap projected by this study's input-output modelis somewhat higher than the Plan specifies for 1980. Usingthe Plan target growth rates for consumption, investment,and exports and deriving imports residually, the estimateof import requirements is about 10 percent higher than thePlan specifies. Thus, the actual import reduction foreseenin the Plan must be even larger than these figures indicate.This lower rate of import growth does not appear to be con-sistent with the overall Plan targets; it could only berealized by reducine other comnonents of domestic finaldemand.
(ii) Domestic and Foreign Exchange Requirements
2.15 The static input-output model, though useful as a consistency checkon some of thp overnll PlAn targets, provuide littlp insight into a number ofthe more important issues involved in the growth process. The analysis, byits nature, serves only to comnpra tha ca tr1isic of an eonomy at twopoints in time. Although it does provide a basis for judging the consistency
I/ These changes in export dependency are shown A industry in Table 5,
Chapter VII of Part III.

- 26 -
of the system between those specific points in time, it does not provide a
means of determining whether the economy can attain the level and structure
of output projected for the terminal year. Specifically, the input-output
model does not provide a means of assessing whether the Plan targets can be
financed from either domestic or foreign resources.
2.16 A two-gap model was used to analyze the domestic and foreign financ-
ing implications of the Plan, as well as the links between the two sources. 1/
The model was first used to simulate the evolution of the economy, using
assumptions close to those used in the Plan (see Table 3). Then, by adjusting
certain Plan assumptions--notably, those concerning the import elasticity
and the overall growth rate--the Plan scenario is contrasted with alternate
possibilities.
2.17 Plan Scenario. Though the growth prospects for workers' remittances
play a crucial role in the overall development of Yugoslavia's balance of
payments, the Plan does not provide an estimate of their likely level. The
number of Yuguslav workers employed abroad has been, and is likely to remain,
severely curtailed. Since 1974, large numbers of workers have returned to
Yugoslavia; although the rate of their return is expected to subside, the
trend is expected to continue. The effect on workers' remittances is complex
and difficult to assess. The rise in incomes in host countries will offset to
some extent the reduced number of workers abroad, and in addition, returning
workers are likely to repatriate the reportedly large savings they now hold in
host countries. The hypothesis used in this study is that, on balance, these
offsetting effects are likely to cancel each other out so that remittances
will remain constant in nominal terms. Since 1973, there has been a tendency
for remittances to decline in real terms; thus, a constant nominal level for
the Plan period seems a reasonable working assumption.
2.18 The simulations revealed a number of interesting results. The first
was based on the Plan's macroeconomic parameters, which are summarized in
Table 3. This simulation indicated that the foreign exchange requirements to
finance the Plan would be considerable. The assumption regarding workers'
remittances, combined with assumed growth in commodity and non-factor service
exnorts of 8.0 nercent; nroduces an overall growth requirement in foreign
exchange earnings of 6.0 percent between 1976 and 1980. The trade gap and the
current account deficit will rise throughout the neriod. calling for a sig-
nificant inflow of foreign exchange on the capital account. Even allowing for
the likely inflow of foreign exchange through spnn1iers' credits and credits
from official sources, there will still be a gap that would have to be filled
through financial credits obtained in the international canital mqrkntr . These
are by their nature less certain and more volatile than other sources, particu-rly in te wake of the h-vy borrowin, by developing count-ries in the inter-
ta t LL I LC *r.~jL .tt -t '-2 '_-_--- -r- ' in th int…
national capital markets in recent years. Assuming, however, that it will be
possible to LUorrow the audditionall capital req .red, the economy's debt serv4
ratio should not increase significantly. This is mainly because export earningsare projectedU to rise rapidly, particularly so if the effects of the expected
rate of international inflation during the period are taken into account.
1/ A similar model was used in World Bank, Yugoslavia, DevelopiLent withL
Decentralization (Baltimore: John Hopkins University Press, 1975).

- 27 -
Furthermore, the fin-nc4in requirements for financial credits- net of annual
repayment of principle, will not be that large. Thus, on balance, the externalfinancing of thle Plan is likely to Ile 4easile.
Tabl 3: PLAN casCUPibNe*rl e1 DT AM A CCDIruDTiAN1C
(Percentages unless otherwise noted)
In71_71, in74Ga !non ataqO1fL7 7. 1A7l UV Ol 1OU_
Rea'l Growth RatesGross Domestic Product (GDP) 6.6 7.0 7.2Investment J. J.2 0.4
Consumption 4.9 6.4 6.3imports /i J.5 4.5
Exports /_ 4.8 7.8 8.6
Value ofIncrementai capitai-output ratio 4.2 4.2 4.2
Import Elasticity /2 1.0 0.6 1.0Marginal Saving Rate 24.0 21.0 34.0Investment/GDP 29.8 29.2 30.6Domestic Saving/GDP 24.0 24.9 27.6National Saving/GDP 27.6 27.1 28.4
/1 Includes goods and nonfactor services./2 Based on three-year averages.
Source: Federal Institute of Planning and World Bank estimates.
2.19 The availability of domestic resources also is not expected to con-strain the growth targets of the Plan. Historically, the incremental capital-output ratio, though volatile, has averaged around 4.CI. Even allowing for asomewhat more capital-intensive development under the current Plan, the incre-mental capital-output ratio is not expected to exceed 4.2. The new institu-tional changes, by avoiding duplication and waste due to inadequate plan prep-aration and coordination, are likely to have a positive effect on the efficiencyof resource allocation. A growth trend of gross domestic product (GDP) of7.0 percent, using an incremental capital-output of 4.2, would call for aninvestment share of about 29.5 percent of GDP. 1/ One of the consequences ofthe investment boom of 1974 was to increase the share of total investment inGDP to 30.2 percent in 1975, compared to an average of 29.8 percent for theperiod 1971 to 1975. Thus, the investment requirements of the Plan period
1/ ICOR K _I _I Yo=1/ ICOR = = aY =- - y = (Investment Share) X (inverse of growth of GDP).
Where ICOR = incremental capital-output ratioK = capital stockY. = GDP in period i
I = investment
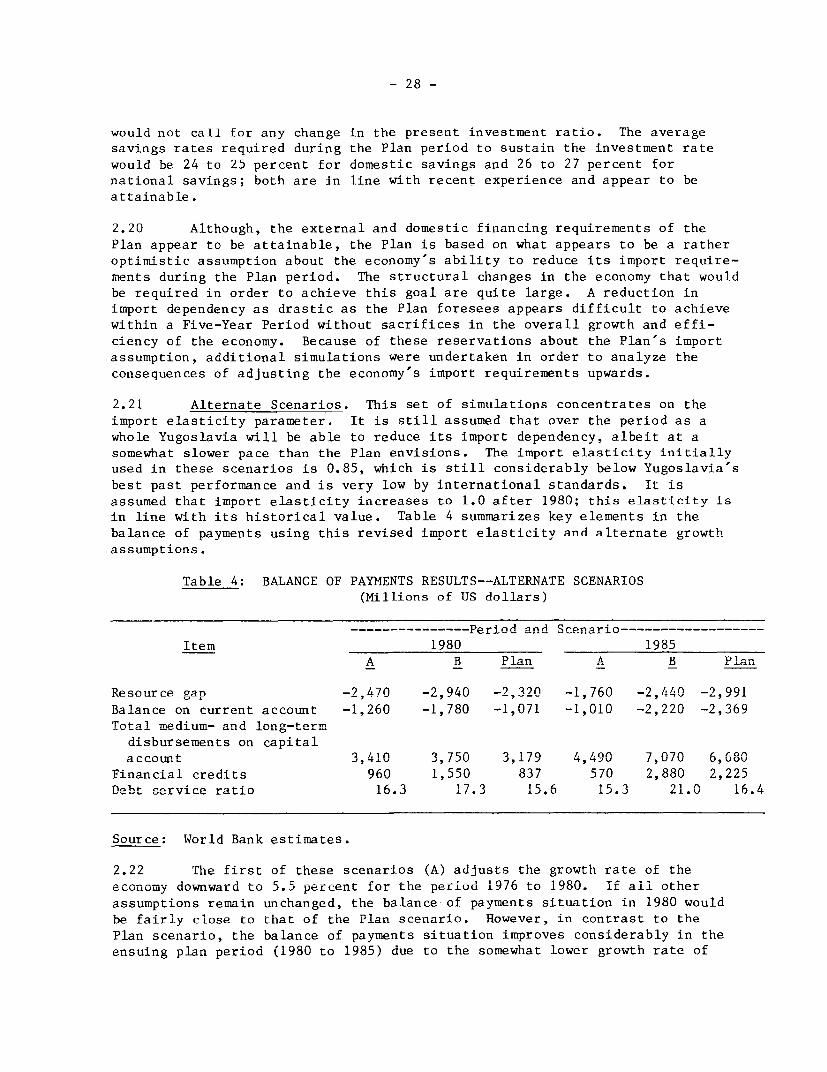
- 28 -
would not call for any change in the present investment ratio. The averagesavings rates required during the Plan period to sustain the investment ratewould be 24 to 25 percent for domestic savings and 26 to 27 percent fornational savings; both are in line with recent experience and appear to beattainable.
2.20 Although, the external and domestic financing requirements of thePlan appear to be attainable, the Plan is based on what appears to be a ratheroptimistic assumption about the economy's ability to reduce its import require-ments during the Plan period. The structural changes in the economy that wouldbe required in order to achieve this goal are quite large. A reduction inimport dependency as drastic as the Plan foresees appears difficult to achievewithin a Five-Year Period without sacrifices in the overall growth and effi-ciency of the economy. Because of these reservations about the Plan's importassumption, additional simulations were undertaken in order to analyze theconsequences of adjusting the economy's import requirements upwards.
2.21 Alternate Scenarios. This set of simulations concentrates on theimport elasticity parameter. It is still assumed that over the period as awhole Yugoslavia will be able to reduce its import dependency, albeit at asomewhat slower pace than the Plan envisions. The import elasticity initiallyused in these scenarios is 0.85, which is still considerably below Yugoslavia'sbest past performance and is very low by international standards. It isassumed that import elasticity increases to 1.0 after 1980; this elasticity isin line with its historical value. Table 4 summarizes key elements in thebalance of payments using this revised import elasticity and alternate growthassumptions.
Table 4: BALANCE OF PAYMENTS RESULTS--ALTERNATE SCENARIOS(Millions of US dollars)
--------------- Periood and Scenario------------------Item 1980 1985
A B Plan A B Plan
Resource gap -2,470 -2,940 -2,320 -1,760 -2,440 -2,991Balance on current accoumt -1,260 -1,780 -1,071 -1,010 -2,220 -2,369Total medium- and long-term
disbursements on capitalccount A,1. ' 3750) 3, 179 I.4, 0.n 7, 070 6
Financial credits 960 1,550 837 570 2,880 2,225Debt service ratio 16.3 17.3 I 15.6 1 1.6 16.4
Source: World Bank estimates.
2.22 The first of these scenarios (A) adjusts the growth rate of theeconomy doUwnward to J.j percent lor the period ;976 to 19080. If all otherassumptions remain unchanged, the balance of payments situation in 1980 wouldbe fairly close to that of the Plan scenario. However, in contrast to thePlan scenario, the balance of payments situation improves considerably in theensuing plan period (1980 to 1985) due to the somewhat lower growth rate of

- 29 -
6.0 percent during this period (import elasticity of 1.0) as compared to thePlan's long-term growth target of 7.0 percent. If the average growth rate ofthe economy is increased to 6.0 percent for the period 1976 to 1980 (ScenarioB). the balance of navments situation deteriorates raDidlv in both Deriods.and a sharp rise in external financing is required.
2.23 In short, if the Plan assumption about the economy's reduced importdependency is changod anid a higher and more nplusb1e ltevel of imnorts is
assumed, the overall growth rate must be reduced if the external financingrequirements of the economy are not t- enxveed the external borrowing paramPtersestablished by the Yugoslavs in their Plan. An average growth rate of around
-5pr-t for t-hn pnriodn !1976 to 18OR, rising t-o A60 nprrcnt- in t-he 1Q980
would appear to be the upper limit achievable within this external borrowingparameter. ThP.e somewhat loweragrowth r ate duri_Lng the noext AdncandAe seems quiteplausible, and perhaps even acceptable, while the economy adjusts to the poorgro-w-L,h.L prospects for workers' re4-Jttances and thae hi,gher, oil mrt bill. T11 eadifference between the Plan's growth target and these projections is fairlymodest, L rdLU Lthe conULLoJUJy WoUld cine LLLLtU Lg.r aLW a vLy respetOab
percent a year.
Labor Force and Employment Prospects
2.24 Providing adequate employment opportunities has been, and remains,one oL thie principlt isues facing the Yugoslav economy. Despite the rapiddiminution of the agricultural labor force over the past decade, one-third ofthe active labor force continues to work in the agricultural sector. Th-e
extent of underemployment in the agricultural sector cannot be accuratelyassessed, but it is clear that a large portion of the agricultural labor forceis engaged in low-productivity activities and that the average income in thissector is less than half the average in the social sector. In addition to theproblem of underemployment, there has been a tendency for registered unemploy-ment to rise rapidly in recent years. With externai migration no iongerproviding a vent for surplus labor but rather contributing to the supply ofworkers to be absorbed, a crucial question in Yugoslavia will be the extentto which the social sector can generate sufficient employment opportunities.
(i) Labor Supply
2.25 Yugoslavia's total population growth rate is expected to declinegradually between 1976 and 1980, although there will still be considerabledifferences among republic's in population growth. The projected labor forcegrowth rate is slightly lower than the population growth rate between 1976 and1980, but it falls quite dramatically in the 1980 to 1985 period. This sharpdecline principally reflects the growing proportion of the population that isexpected in the marginal age groups, which have lower activity rates. Theregional differences in the growth of the labor force are even more pronouncedthan in population growth; labor force growth rates vary from 3.3 percent ayear in Kosovo to -0.2 percent in Serbia between 1975 and 1980, and from 3.4to -0.6 percent, respectively, for the 1980 to 1985 period. Hence, inter-regional differences will be sharpened and labor surplus regions will have thefastest natural rate of increase in the labor force. -

- 30 -
2.26 In addition to the natural increase in the labor force, the Planforesees two additional sources of demand for employment: a return of 250thousand migrant workers, and a targeted reduction in registered unemploymentof 136 thousand. If these two factors are added to the demographic increaseand if it is assumed that returning migrants go back to their regions of originand that the reduction in unemployment in each republic is proportional toits present share in total unemployment, the increase required in social sectoremployment is considerably greater. Table 5 brings together these elementsand compares the projected growth rates of job seekers with the actual growthrate of employment experienced during the last plan period. The figuresindicate that opportunities for a continued decline in the agricultural laborforce are likely to be limited in all the lesser developed republics, particu-larly in Kosovo and Bosnia-Herzegovina. In all republics other than Kosovo,there are some prospects for reducing the agricultural labor force, but inKosovo it is likely to continue to grow, even with fairly optimistic assump-tions about the growth in social sector employment and interrepublic migration.
Table 5: ABSORPTION OF RETURNING MIGRANT WORKERS AND REDUCEDUNEMPLOYMENT, 1976-80
Actualgrowth Job seekers Required annual growth rate
in social 1976-80 in social sector employmentsector (thousands) (percent)
employment Return- Reduced Return- Reduced1971-1975 ing Un- ing un- Demo-
Region (percent) migrants employed migrants employed graphic Total
Lessdeve lonedregions:
'Bosn iq -Herzegovina 5.5 54 22 1.5 0.6 2.8 4.9Montenegro 5.3 3 4 0.6 0.8 ?6 Z 4.0Macedonia 5.3 21 22 1.2 1.3 2.6 5.1Kosovo 6.7 9 10 1.3 1.4 6.7 9.4
Developed
regions:Croatila 3. 7 Q 18 1.4 1A 0. ).8 2.5
Slovenia 4.4 19 3 0.6 0.1 0.3 1.0Ser Proper 4.IA A A) 43 .7 .7 0.2) 1.
.Jetuia ILIJJ 9 ~~~L -t.I v. I U. I U.Z. I /_
Vojvodina 3.5 19 14 0.8 0.6 1.0 2.4
Total 4.4 250 136 1.1 0.6 1.2 2.9
Source: World Bank estimates.

- 31 -
(li) The Em.ployment Outlook
2.7 T/lhe Flan foresees Lf 3 a gro-wth in lJLpLoLmnt o . percent over the1976 to 1980 period. Comparing the experience during the past decade and• IL WLo-wLng fLor th1e r.ore rapi ud growth in output tLt i sa IeS Expected during the Plan
a growth rate of 3.5 percent appears to be somewhat on the low side. Usingsectoral em-ploymn-m-1t-output elasticities and alloUwiLLg foL the shift in thestructure of production during the period, growth of 4.4 percent in employmentmight De expecte if thne Plan s target GuP grOwth ratet's are aCtieveUd. TWpoints should be noted, however. First, the capital cost per job createdduring the Plan period is expected to rise quite snarply; for example, thedirect capital-labor ratios within the priority branches of industry are twicethe industry average. Second, if the Plan is revised downward by cutting backthe nonpriority sectors, the impact on employment could be quite sharp,because the nonpriority sectors are considerably more labor-intensive than thepriority sectors. Because a lower growth rate than the Plan foresees may benecessary if the degree of import substitution in the Plan cannot be achieved,a 3.5 percent growth in employment would appear to be reasonable.
2.28 Although the social sector employment growth rate appears to beattainable, the planned growth rate of private nonagricultural employmentappears somewhat optimistic. A growth of employment of 5.1 percent during the1980 to 1985 period would imply an employment-output ealasticity of approxi-mately 1.0, which is considerably higher than the historical rate. An increasein the growth rate of private non-agricultural employment is likely to occuras a result of the new institutional arrangements and the growing reflux ofmigrant workers. In the past two years, however, the returning migrants havealready saturated work opportunities in a number of sectors, notably cateringand road haulage. The new institutional arrangements should encourage privateinvestment in new productive sectors, although the novelty of many of thesearrangements is likely to mitigate against any sudden and large increase inemployment in these sectors.
2.29 Table 6 brings together the various elements of the labor supply anddemand. The labor supply indicates the number of additional job seekersthat would have to be provided with work in order to attain the objectivesmade explicit in the Plan. Labor absorption indicates the number of addi-tional jobs expected to be available based on the Plan assumption about growthin social sector employment and a somewhat lower (4.0 percent) growth assump-tion for the private nonagricultural sector. The difference between the laborsupply and the job supply indicates that some reduction of the agriculturallabor force would be possible. The projected 2.0 percent annual decline inthe agricultural labor force would be considerably below the 6.0 declineexperienced between 1970 and 1975, however. At this lesser rate, incomedifferentials between the two sectors, though diminishing, would do so onlymarginally. For the whole period, a growth rate of social sector employmentin excess of 2.4 percent would result in an excess demand for labor and easea gradual reduction in the agricultural labor force; a growth rate below2.4 percent would result either in an increase in agricultural employment oran increase in open unemployment.

Table 6: LABOR FORCE BALANCES 1976-80(Thousands of workers l other-- se noted)
ChangeItem 1975 1980 1976-80
Total labor supply 667
Labor force 9,147 9,424 277graIdtLs 78O JJ3 2Ju
Unemployment 540 400 140
Total labor absorption 954
Social sector 4,667 5,543 876Private non-agriculture 359 438 78
Excess labor demand 287
Reduction in agriculturallabor force (annual percentage) 2.0
Source: World Bank Estimates.
Reducing Regional Disparities
2.30 Regional disparities are likely to persist in Yugoslavia for thecoming decade. Increasingly, they are articulated among Yugoslavs andreflected in official documents. The Long-Term Development Plan lists re-ducing these differences as a national priority, and the Five-Year Planfor 1976-80 has as one of its explicit objectives a higher than the nationalaverage rate of growth in the less developed regions. It also recognizes thataddressing the problem would require a more comprehensive approach than ispresently being taken.
2.31 Previous regional policies supported the less developed republics bytransferring to them large amounts of financial resources. In addition, theless developed republics, themselves, were dedicated to their own economic andsocial development. These policies produced structural change through indus-trial growth and established physical and social infrastructure. As a result,they achieved significant progress in terms of GMP growth and social welfare.In spite of this impressive progress and an overall income distribution patternwhich is favorable by international comparison, major regional disparitiespersist; the most developed region. Slovenia, has a per capita GMP that is sixtimes that of the least developed region, Kosovo. 1/ These differences
1/ This reflects the extreme of the regional income disparities indicators,however. The per capita income differential derived from the householdsurvey data givpe a ratio nf 3.,1 for SlovPni2 and Kosovn_ rpenP -t-ivP1V
largely arise from the fact that, compared to developed regions, the lessdeveloped regions have: (1 ) higher population growth rates and a larger laborforce absorption problem as a result of previous population dynamics; (2) ahigher incidence of intraregional disparties, buecause a large proportion ofthe population is dependent upon private agriculture, which lags significantlybehind the social sector ir. average producivity and personal incomes; (3)greater concentrations of industry in branches with higher capital-output andcaptal-labor ratios and lower profitab`ity; and (4) more institutionalweaknesses--shortages of managerial skills and technical knowhow--and infra-structure deficiencies.
(i) Prospects for Interregional Migration
2.32 The past population dynamics in the less developed republics haveresulted in a labor force absorption problem of major dimensions; conversely,labor shortages are-being experienced in some developed republics. Thisinequality in labor force availability, as well as the opportunities foremployment abroad wnich existed in the past decade, has led to some inter-regional migration; for example, one-fourth Slovenia's present labor force isnon-Slovene. The long-term plan for Yugoslavia stresses the need for familyplanning in some parts of the country, as well as the need to step up internalmigration. Nevertheless, prospects for large-scale inter-regional migration--significantly above previous levels--and the pursuit of a more vigorousmigration policy are still likely to be limited. In the shorter run, theconstraint will be set by the pressures in the developed republics to provideemployment for their own surplus agricultural labor force and their temporarymigrant workers returning from abroad. In the longer term, there are a numberof limitations on interregional migration, including: (1) sensitive nation-alities balances, which are an important feature of the socio-politicalheritage of Yugoslavia, (2) in cases of non-permanent migration, the personaland social hardships connected with temporary separation of families; (3) incases of permanent migration, the additional material and social costs ofsettling workers and their families in new localities; and most significantly,(4) the most mobile workers in the less developed repulblics are likely to bethe young and the better educated and trained, whose migration could lead toa major drain of human resources that merely intensifies the institutionalweaknesses of the less developed regions. Because of these limitations,supplementing the transfer of financial resources with transfers of technicalknowhow is crucial to redressing regional disparities.
(ii) Policies to Redress Regional Differences
2.33 New legislation provides for a somewhat larger flow of financialresources from developed to less developed republics through the two federalmechanisms--The Federal Fund for the Accelerated Development of the LessDeveloped Republics and Kosovo, and budgetary grants. The Federal Fundmechanism is financed by obligatory loans from social sector enterprises,amounting to almost 2 percent of their GMP. The Fund provides concessionaryloans--with a grant element of about 40 to 50 percent--to lesser develonedrepublics to supplement their investment potential in economic activities.

- 34 -
Grants from the federal budget, amounting to another 1 percent of GMP, con-
tribute significantly to republic and communal budgets to support social
services in the poorer areas.
2.34 These transfers entail considerable benefits to less developed
republics and sacrifices to developed ones. Resources from the Federal Fund
would for the present Plan period account for about 20 percent of total eco-
nomic investment in less developed regions--about 75 percent for Kosovo--and
together with budgetary grants, amount to about 10 percent of their GCP. The
developed republics contribute--on a gross basis--about 3 percent of their GMP
to these transfers; this is an even larger sacrifice--about 10 percent--of
their economic investment potential, which represents future GMP foregone.
2.35 Financial transfers are of crucial importance, but as the sole means
for enhancing the development of less developed economies, they have limi-
tations. Yugoslavia recognizes that the growing complexity of the lesser
developed economies requires technical and managerial knowhow as well as
financial support. A new Federal Fund provision allows for one-fifth of
required contributions by social sector enterprises to be transferred to the
lesser developed republics in the form of joint ventures. This is an impor-
tant, though still limited, attempt to share technical and managerial exper-
tise among the republics. The Social Compacts and Self-Management Agreement
provisions of the 1974 Constitution and the new system laws have a similar
orientation. These agreements emphasize (1) the vertical and horizontal
integration of production units (BOALs or enterprises), both inter- and
intraregionally, especially for national priority sectors, and (2) various
forms of joint venture arrangements based on risk and income sharing among
enterprises.
2.36 The effects of these measures, though expected to be positive, are
difficult to assess for the present Plan period. Transferring technical and
managerial knowhow is invariably more difficult and time consuming than trans-
ferring financial resources. Furthermore, the more capital-intensive priority
activities, such as enerev and basic metallurgy, are located in the less
developed republics; efforts to realize growth targets in these areas could
act to reinfnrce the Pxisring unfavorable industrial structure and to dilute
somewhat the less developed republics' own efforts to diversify.
(iii) Issues for the Eighties
2.37 Historically, Yugoslavia has inherited much diversity, and itsregional dispar4ties, are a complex -roblem that recquires a comnrehensive
approach for its resolution. Three important, though increasingly inter-
related, challenges in the field of regional development are likely to remain
with Yugoslavia in the eighties: reducing regional income disparities gener-
ating productive employment and reorienting regional industrial structure
2.38 The Reduction of Ircome Disparities. Although the Five-Year Plan
envisages a higher GMP growth rate for the less developed regions than the
national average, iL the higher rate of population growth is sustained in
those regions, it would dilute the impact, the growth differential might
have on per capita incomes (see Table 7). Thus the reduction of the average

- 35 -
interregional income disparity may be: from 69 to 72 percent of tne nationalaverage for Bosnia-Herzegovina, Montenegro, and Macedconia and only from 33 to34 percent for Kosovo. With existing transter mechanisms, this modest improve-ment is still feasible even if the cverall GMP growth rate is somewhat lowerthan planned and is more nearly that which tnis analysis indicates. Main-taining sufficiently high overall and regional growth rates is, nonetheless,crucial if the necessarily widening absolute income differential is to be mademore bearable for lesser developed regions and if the sacrifices the resourcetransfers entail are to be made more palatable for the developed regions. Therapid growth of social sector employment and the policies for intraregionaldevelopment are necessary to improve, or at least prevent any deteriorationof, the intra-sectoral/intra-regional income inequalities that exist in allregions of Yugoslavia, but with higher incidence in the less developed repub-lics. The continuing extension and improvement of the coverage of socialsecurity and social services for the rural population should also act toimprove the bocial welfare of these people.
2.39 Kosovo constitutes a special case among the less developed regions
and receives special attention under the national plan. The provisions forKosovo, like those affecting all less developed regions, are centered ontransferring a larger-than-proportionate volume of domestic financial re-sources and providing preferential access to foreign borrowing and certainimports. Because institutional weaknesses in Kosovo are very pronounced,however, a special package of technical, managerial, and infrastructurepolicies and provisions should be designed in order to increase the like-lihood that this expected large inflow of financial resources will be usedefficiently.
Table 7: REGIONAL GROWTH TARGETS: FIVE-YEAR PLAN 1976-80
1 9 7 5 1976-80 1980GMP per capita GMP per capita
Population (percent of (percent ofGrowth Yugoslav GMP YugoslavRate average)_ growth rate _ Average)
Less developed regions 1.6 62 8.2 64Bosnia-Herzegovina 1.3 69 8.2 72Montenegro 1.3 70 8.3 73Macedonia 1.5 69 8.0 71Kosovo 2.8 33 9.5 34
Develoned regions 0.6 121 6.7 121Croatia 0.4 124 6.5 124Slnveni2 0.7 201 6.1 195Serbia Proper 0.7 92 7.0 94VOJVOdina 0. 3 121 7.1 126
Yugoslavia0.9 1006.9 100
Sources: Social Plan of Yugoslavia 1976-80; Federal Institute for Planning;Statictirnl Yearbook of Yugoslavia, 1976.
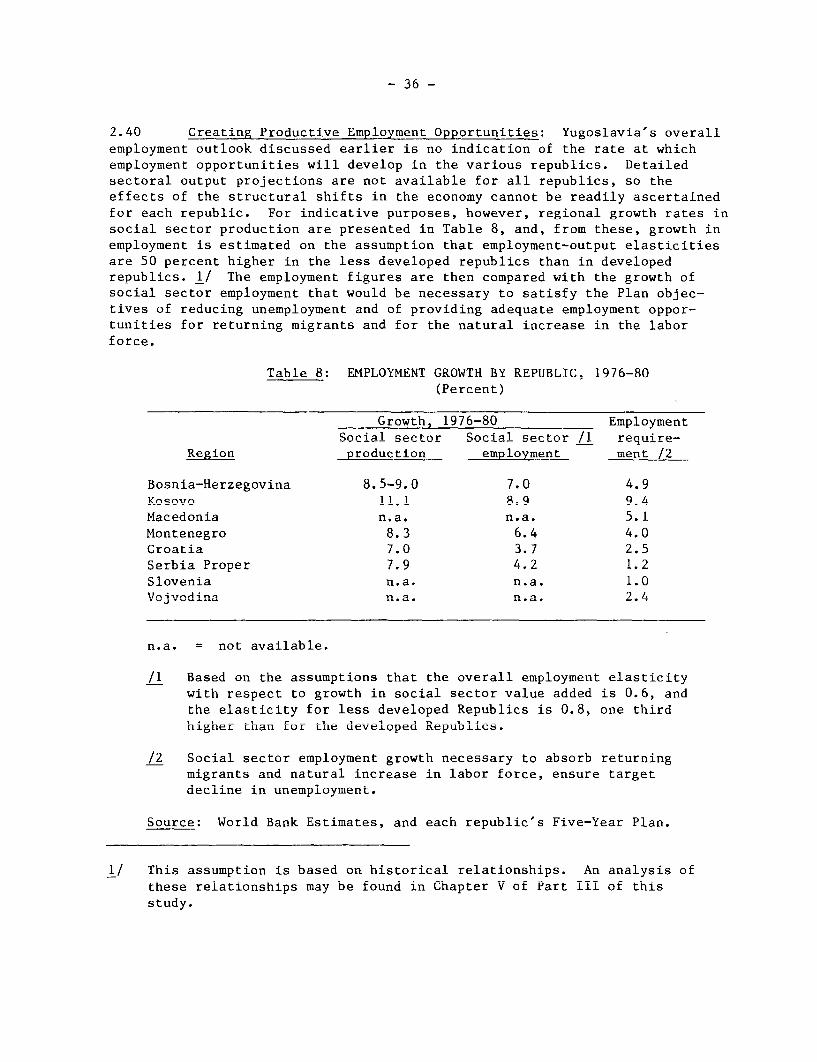
- 36 -
2.40 Creating Productive Employment Opportunities: Yugoslavia's overallemployment outlook discussed earlier is no indication of the rate at whichemployment opportunities will develop in the various republics. Detailedsectoral output projections are not available for all republics, so theeffects of the structural shifts in the economy cannot be readily ascertainedfor each republic. For indicative purposes, however, regional growth rates insocial sector production are presented in Table 8, and, from these, growth inemployment is estimated on the assumption that employment-output elasticitiesare 50 percent higher in the less developed republics than in developedrepublics. 1/ The employment figures are then compared with the growth ofsocial sector employment that would be necessary to satisfy the Plan objec-tives of reducing unemployment and of providing adequate employment oppor-tunities for returning migrants and for the natural increase in the laborforce.
Table 8: EMPLOYMENT GROWTH BY REPUBLIC. 1976-80(Percent)
Growth, 1976-80 EmploymentSocial sector Sorial . se-tnr /1 require-
Region production employment ment /2
Bosnia-Herzegovina 8.5-9.0 7.0 4.9Kosovo 1 1.1 8=L9 94Macedonia n.a. n.a. 5.1Mor.tenegro 8.3 6.4 4.0Croatia 7.0 3.7 2.5Serbia Proper 7.9 4Q2 1.2Slovenia n.a. n.a. 1.0Vojvodina n.a. n.a. 2.4
n.a. = not available.
/1 Based on the assumptions that the overall employment elasticitywiLtI respect to growth in social sector vaLue adUded is 0.6, ar.
the elasticity for less developed Republics is 0.8, one thirdhigher than for the developed Republics.
/2 Social sector employment growth necessary to absorD returningmigrants and natural increase in labor force, ensure targetdecline in unemployment.
Source: World Bank Estimates, and each republic's Five-Year Plan.
1/ This assumption is based on historical relationships. An analysis ofthese relationships may be found in Chapter V of Part III of thisstudy.

- 37 -
it is apparent that the Pian's relatively high growth assumptions would allow
some reduction in the agricultural labor force in most less developed republics.
The only exception is Kosovo, which cannot be expected -- even under optimistic
assumptions -- to absorb the increments to its labor force even if the Plan
growth targets are achieved. In the case of other republics also, the employ-
ment situation may be somewhat less favorable than the table might imply. One
reason is that the overall growth rate for the economy and the rates for the
republics appear to be somewhat optimistic, given the planned investment out-
lays. Another reason is that a relatively high share of industries in the less
developed republics have low labor-output ratios. The Plan's emphasis on basic
industries is likely to affect adversely the employment generating capacity of
these republics. Taking these factors into account, the opportunities for
migration out of the agricultural sector, with the exception of Slovenia and
Serbia, are likely to be fairly limited.
2.41 The Reorientation of Industrial Production Structures. In addition
to the ongoing rural-to-urban shift of population and agricultural-to-industrial
shift of production, the long-term development of the less developed republics
and the reduction in regional disparities may well hinge upon realizing a more
nearly optimal pattern of regional industrial specialization. For a variety
of reasons, the present regional industrial specialization patterns contradict
comparative advantage in terms of relative endowment with the various resources.
The efforts of less developed regions to diversify their industrial production
have also created a considerable degree of duplication and excess capacity. A
more efficient use of national resources would call for corrective measures
that would shift the industrial structure in developed regions towards more
capital- and skill-intensive industries, leaving the more labor-intensive
activities for location in the less developed regions. This fundamental adjust-
ment of the interregional division of labor, painful and complex as it might
be, would be in the long-term interest of all republics. Because of the hard-
ships and adjustment costs to certain enterprises and regions, particularly in
the context of the decentralized decision making that self-management implies,
the process is not likely to proceed at any adequate pace on a voluntary
basis. Tn some cases, structural adiustment may involve transferring an
established enterprise from one republic to another cr even shutting it down;
in other cases, it may require reaching an interregional agreement on the
location of new facilities. Because all regions would realize long-term
benefits from reStructuring industrial patterns, there may be a need for
setting up a compensation mechanism at the federal or republic level to smooth
out the adjustment costs for individual enternrises. Given the ingenuity of
the Yugoslav system in terms of pragmatic adaptation to the needs and concerns
of the society and of national eoheRion, a serious search for a solution is
timely.
Summary
2.42 The medium-term prospects of Yugoslavia inevitably are difficult to
assess, given the significant changes that have recentiy occurred in the system
of economic management. One of the principle objectives of these changes has
been to strengthen the overall macroeconomic management of the economv- The
- 38 -
new planning system provides a novel mechanism for coordinating decision making
in the allocation of resources. Similarly, the use of Social Compacts in other
policy areas will induce various interest groups to consider economic issues
in a broader perspective and to appreciate the tradeoffs involved in coordi-
nating diverse objectives. The management instruments that have been adopted
have many positive features and bear considerable promise. It is significant
that in these changes the Yugoslavs have correctly diagnosed the shortfalls of
their previous system of economic management and have adopted a set of measures
consistent with meeting these deficiencies. Although other policy measures
(of varving degrees of compatibility with Yugoslavia's noneconomic objectives)
could be envisaged, the current measures nevertheless do provide a tenable and
workable resnonse to acknowledged problems. The application of these instru-
ments is also likely to raise a number of important practical questions that
will need to be resolved. Yugoslavia in the nast has exhibited considerableflexibility and pragmatism, a feature that is likely to continue and a factor
that should serve as a warning against an excessively rigid interpretation of
current changes. There will undoubtedly be further changes as the new policy
instruments are elaborated unon or--where necessary--modified; but on balance
the economic implications of the 1974 Constitution are likely to be positive.