world bank document - documents &...
TRANSCRIPT

CIRCULATING COPY FILE COPYTO BE RETURNED TO REPORTS DESK
"%f'E T NT OF INTERNATIONAL BANK FOR RECONSTRUCTION AND DEVELOPMENTINTERNATIONAL DEVELOPMENT ASSOCIATION_______
Not For Public Use39
Vol. 1
Report No. 39a-k'ii
PLE --J' TO
onr mx z:-d v L t -a. 4 ) : 9 E171,
AGRICULTURAL SECTOR SURVEY
PHILIPPINES
(in four volumes)
VOLUME I
THE GENERAL REPORT
May 2, 1973
Regional Projects Department
Asia Regional Office
This report was prepared for official use only by the Bank Group. It may not be published, quoted
or cited without Bank Group authorization. The Bank Group does not accept responsibility for the
accuracy or completeness of the report.
Pub
lic D
iscl
osur
e A
utho
rized
Pub
lic D
iscl
osur
e A
utho
rized
Pub
lic D
iscl
osur
e A
utho
rized
Pub
lic D
iscl
osur
e A
utho
rized
Pub
lic D
iscl
osur
e A
utho
rized
Pub
lic D
iscl
osur
e A
utho
rized
Pub
lic D
iscl
osur
e A
utho
rized
Pub
lic D
iscl
osur
e A
utho
rized

PHILIPPINES
AGRICULTURAL SECTOR SURVEY
Table of Contents
Page No.
THE GENERAL REPORT
Background Data ............ ........................... i-iii
Summary .............................................- i - v
I. INTRODUCTION .................................. 1
II. BACKGROUND .................................. 2
Agriculture and the Economy ...................... 2Physical Setting ................................. 4Structure of Agriculture ......................... 4The Resource Base ................................ 5Regional Distribution of Production .... .......... 7
III. PAST AGRICULTURAL PERFORMANCE ......................... 9
The Rice Self-Sufficiency Program .... ............ 9Output of Other Products ...... ................... 11
IV. DEVELOPMENT PLAN FY 1972-75 AND DEMAND OUTLOOK .... .... 13
Development Plan ................ ................. 13Demand Outlook ................. .................. 13
V. A STRATEGY FOR THE 1970'S .15
Fiscal Policy .. 15Regional Development . .15Grain Production Targets . .15Foreign Trade . .17The Critical Role of Water Investment . .18Potential for New Irrigation . .19Smallholder Credit for Fertilizers and Other
Production Inputs . .20Land Use and Employment Strategy . .20Land Reform and Income Redistribution . .20Government Services and Organization . .21

-2-
Page No.
VI. MAJOR PRODUCTION PROGRAMS ............................. 22
A. Crops . ..................................... 22
Rice . ...................................... 22Corn . ..................................... 23Sorghum ...................................... 24Soybeans ..................................... 25Sugar . ..................................... 25Tobacco ...................................... 26Coconuts ..................................... 27Rubber . ..................................... 28Abaca . ...................................... 29Bananas ............................... 29Cashew ........ ....................... 29
B. Livestock ........... .................... 30
Pigs ............................... 30Poultry and Eggs ............................... 31Carabao and Cattle ............................... 31Dairy ........ ....................... 32
C. Fisheries ........... .................... 33
Development Strategy ............................. 34Conflict between Municipal and Commercial Fishing. 35Trade Deficit .................................... 35
D. Forestry ....................................... 35
Public Forest Management ........ ................. 36Allowable Cut .................................... 37Licensing Policy ................................. 37Integrated Wood Industries ....... ................ 37Pulpwood, Pulp and Paper ........ ................. 38
VII. SUPPORTING SERVICES ................................... 40
A. Research, Extension and Credit ...... ............. 40
Research ..................................... 40Extension ..................................... 40Administration ................................... 40Credit . .................................... 41

-3-
Page No.
B. Land Reform and Settlement ...... ................. 44
Land Reform ............ .......................... 44Land Settlement .......... ........................ 47
C. Irrigation . ....................................... 48
Rehabilitation and Improvement of Systems .... .... 48Future Development of Irrigation ..... ............ 49
D. Marketing and Transportation ..... ................ 50
VIII. MAJOR INVESTMENT OPPORTUNITIES FOR FOREIGN FINANCING .. 51
Irrigation ....................................... 52Projects to Assist Smallholders ........ .......... 55Forestry ......................................... 57Fisheries ........................................ 58Regional Planning and Other Preinvestment Studies. 58Preinvestment Requirements ....... ................ 59
FIGURES
7018 : Structural Chart of Agricultural Services - 19727281 : Philippines, Changes in Area Harvested and Yields
of Major Crops, 1964-66 and 1969-71
MAPS
10133 : Climatic Regions10215 : Relief, Regions and Provinces10397 : Land Use10217 : Transport System10218 : Rice Flow (1968)

-4-
ANNEXES
Volume II1. Physical Environment for Agriculture2. Forestry3. Irrigation4. Livestock5. Fisheries
Volume III6. Rice Production7. Corn and Feed Grain Production8. Sugar and Tobacco Production9. Rice: Estimates of Supply and Disappearance
10. Crops Marketing
Volume IV11. Agricultural Credit12. Tree Crops13. Land Reform and Settleraent14. Production Economics - Rice and Corn15. Statistical Annex

PHILIPPINES
AGRICULTURAL SECTOR SURVEY
BACKGROUND DATA
Currency unit: Peso (t)
Currency conversion: 1 US$ = V 6.5 approx.1 V - US$0.154 approx.
Area
Total Land Area 30.0 million haof which: (i) Forests 15.9 " it
(ii) Farmholdings 9.8 "
(iii) Managed Pastures 0.8 "o
(iv) Other 3.5 "
Population
Total (mid-1971) 38 millionAnnual growth rate (1960-70) 3.1% 2(Density (1971) 128 per km
Net Domestic Product
Total (1971 1/) P 27,854 millionAnnual growth rate, constant 1967
prices (1960-71) 5.4%Per capita NDP 736 (US$113)
Industrial Origin of NDP
Annual Growth Share1966-71 in 1971
Agriculture 4.9% 33.0%Manufacturing 8.4% 19.3%Trade 6.8% 15.6%All other sectors 4.7% 32.1%
Employment
Agricultural Employment (March 1971) 5.6 millionShare of Total Employment 49%
1/ Preliminary.

- ii -
Production of Main Crops in 1961 and 1971 ('000 m tons)
1961 1971
Palay 3,704 5,343Maize 1,210 2,005Sugarcane 1,709 2,980 1/Coconuts (million nuts) 6,195 7,814Logs ('000 m3) 6,596 11,005Fish 455 989 2/
Area Harvested of Main Crops in 1961 and 1971 ('000 ha)
1961 1971
Palay 3,198 3,113Maize 2,046 2,392Sugarcane 232 442Coconuts 1,200 2,048
Annual Growth Rates in Percent for Main Products, 1961-71
Palay Maize Sugarcane Coconuts Logs Fish
Area Harvested 0.1 2.3 5.4 5.1 - -
Yield per ha 3.5 3.2 -1.0 -1.9 3/ - -Production 3.6 5.7 4.2 1.2 7.3 2/ 9.5 2/
Livestock Numbers ('000 heads)
1961 1970
Carabao 3,452 4,432Cattle 1,055 1,679Hogs 6,191 6,456Chicken 49,984 56,999
Agricultural Exports and Imports
Value of Agricultural Exports, 1970 US$744 millionShare of Total Exports 70.1%Principal Agricultural Export Products Logs and Lumber,
Sugar, Copra, Coconut OilValue of Agricultural Imports, 1970 US$172 millionShare of Total Imports 15.8%
1/ Preliminary.
2/ 1970.
3/ Nuts per bearing tree.

- iii -
Principal Agricultural Imports Cereal and Cereal Preparations,Dairy Products, Textile Fibers,Fish and Fish Preparations
Wholesale Price Index in Manila 1971 1955 = 100
All Products 237.7Food 259.8
Consumer Price Index in Manila 1971 1955 - 100
All Products 224.0Food 275.1
Distribution of Farm Holdings by Size (1960)
Percentage DistributionNumber of Farms Area Farms Area
'000 ('000 ha)
Under 1 ha 250 125 11.5 1.6
1 - 1.9 ha 642 796 29.6 10.2
2 - 4.9 ha 864 2,426 39.9 31.2
5 - 9.9 ha 290 1,845 13.4 23.7
10 - 24.9 ha 109 1,396 5.0 10.0
Over 25 12 1,184 0.6 15.3
2,167 7,772 100.0 100.0


PHILIPPINES
AGRICULTURAL SECTOR SURVEY
SUMMARY
i. The major goals of the Government of the Philippines for theAgricultural Sector are self-sufficiency in cereals, particularly rice andcorn, expansion of agricultural exports, intensification of land reform anddistribution, and conservation of natural resources. This report reviewsthe prospects and performance of the sector in relation to these objectivesand looks at the longer run potential for agriculture.
ii. Agriculture is the most important sector in the Philippine economy,accounting for one-third of net domestic product, one-half of total employ-ment and 70 percent of commodity export earnings. Agriculture still employsabout 45 percent of the labor force even though non-agricultural employmenthas grown rapidly over the past decade.
iii. Philippines agriculture is largely made up of small units withlow productivity, yields and income. There is pressure of people on landand migration from densely settled areas is considerable. The missionestimates that there are perhaps 2 to 2.5 million ha of unused farming land,including 1 million ha of cogon grass lands which are difficult torehabilitate. During the decade of the 1960's, the area brought undercultivation increased about 1-1/2 million ha.
iv. To accomplish self-sufficiency in food production and to maintainagricultural exports, the mission estimates the growth rates shown belowwould be realistic:
Rice 4-1/2%Corn 9%Fish 6%Livestock 7-3/4%Sugar 2-1/2%Coconut 3%Logs 2%Woodpulp 7%
Such objectives will require a doubling of recent annual Government expenditureson agriculture and natural resources to about t 700-800 million (in 1972 prices)within 5 years.
v. The Development Plan FY 1972-75 envisions an annual growthiinrice output of 6 percent per annum, as in the late 1960's, but the growthrate probably will be smaller. The high rate in the 1960's came from therapid spread of High Yielding Varieties (HYV) which now blanket the irrigatedrice area. Progress from here on will be slower and will depend largely onextension of irrigation and the spread of IIYV-fertilizer technology on rainfedlowlands as well.

- ii -
vi. The Mission estimates that the irrigated rice area - includingboth regular and palagad (dry season) crops - will need to be expanded byabout 75 percent, or some 640,000 ha by 1980. This can come partly from anextensive program of rehabilitation covering some 260,000 ha of existingirrigation systems which require repair and improvement for dry seasoncropping. The remainder will have to come from new irrigation projectsalso with the same capabilities for dry season production. The NationalIrrigation Administration (NIA) should survey the condition of existingsystems and develop a program for rehabilitating them within 8-10 years.A program to add new irrigated cropland of about 45,000 ha a year will alsobe required. NIA has identified a series of projects which can provide thislevel. Such a program would require greatly increased public expendituresand at least a doubling of the NIA engineering staff.
vii. There are opportunities in other commodities to increase outputand improve the incomes of smallholders in a better regional balance thanheretofore. Corn, in particular, has an immediate large potential,especially in Mindanao and the Cagayan Valley. The recent development ofdowny mildew resistant HYV's which are responsive to fertilizers provide ameans for doubling yields by 1980. This would meet requirements for theexpanding broiler and pig industries and later in the 1970's enable exportsof corn, for which the world outlook is favorable. There is need to establishdrying and storage facilities to accommodate the prospective large productionincrease.
viii. Sorghum and soybeans (to meet an increasing import deficit insoybean meal) also hold promise but assured market outlets for producersare a necessary condition for increased production. For soybeans, equip-ment to defat or heat beans for direct feeding to livestock should beexplored.
ix. For copra, a major export commodity, large areas of overage treesin Western Visayas and S. Tagalog need to be replanted but the world marketprice outlook is relatively unfavorable. Fertilization and intercroppingcan improve yields and reduce costs of production. Better drying equipmentfor copra would improve quality and eliminate the threat of aflotoxin.
x. Export markets are favorable for tobacco, important in Ilocosand Cagayan. But both output and quality have declined. A program toimprove production methods and establish quality control in curing isneeded.
xi. In the past, the Philippines have had difficulty in meeting itssugar quota in the preferential U.S. market, leading to some reductions inquota. Delays in harvesting and milling have reduced the sugar recoveryper ha, particularly in the W. Visayas, the principal producing region.The most immediate way to increase sugar output is to invest in trucks forhauling cane and to reimpose discipline in harvesting and million schedules.
xii. Large swamp areas are available in Mindanao, Samar, Bohol, andPalawan for development of smallholder fishponds. Fish production per ha

- iii -
can be doubled or more within this decade by the technology of fertilization,supplemental feed and management of fish population, as has been demonstratedin Taiwan and by ongoing research in the Philippines.
xiii. Cattle ranching offers a considerable potential, over the long run,for export trade. The Visayas and Mindanao are free of hoof and mouth disease.Under present conditions, grazing is not very productive. Improved piasturesgreatly increase carrying capacity, and grazing can be greatly extended inarea by rehabilitation of cogon lands. Cattle raising also integrates wellwith coconut and sugar enterprises.
xiv. Presidential Decree No. 27, dated October 21, 1972, makes the com-mitment to transform as many as one million share tenants into full owner-cultivators. In the past, progress in implementing land reform programswas slow; only some 50,000 sharecroppers have been converted to leaseholdwith secure rights of occupancy and better sharing arrangements, and about3,400 families accorded full ownership. Details of the new program are stillbeing evolved but it is evident that the administrative and financial capacityof the Philippine Government will be severely tested within the next'few years.In addition to the incentive of ownership, government plans to make availableproduction credit supported by enlarged extension services and improvementsin infrastructure, particularly irrigation facilities, in order to increaseproductivity by HYV-fertilizer technology. An Agrarian Reform Fund of p 2billion has been established to guarantee payments to landlords for land andto credit institutions in the event of default by former tenants.
xv. The land settlement program offers a means for alleviating the pres-sure of people on land and the ills resulting from squatters moving onto hill-sides. Performance of settlements so far has been disappointing. Large areasare available for settlement in Mindanao and the Cagayan Valley, bothi partic-ularly well suited for corn production, and to some extent in Palawan andMindoro. The same constraints for supporting services and infrastructurewhich have weakened land reform programs in the past operate with even moreforce in land settlements, partly due to their location in remote areas. Landsettlement projects must be better planned and supported.
xvi. Extensive forest resources appear to offer good prospects forincreasing export earnings during the 1970's, but they have not been managedwell. Illegal logging activities and squatters have made progressive inroads.Output of areas under licenses has fallen short of the allowable cut level.Government has recently established better management and control of itscommercial forest lands; prohibited further inroads of squatters; and putinto effect licensing policies which encourage more efficient use of theforests and low-cost production in order to compete with other log exportersto Japan.
xvii. A large forest area in Northeast Luzon still remains to be.exploited, although the prevalence of typhoons makes shipping hazardousduring 6 months in the year. The development of wood industries exportcenters in Mindanao, where most forest lands are located, would add 'ignif-icantly to export capabilities as well as provide additional employment.There appears to be an outstanding opportunity to develop a pulp industry

- iv -
for which world demand is rising rapidly. This would involve establishmentof rapid growing softwood plantations on cutover lands and a large investmentin pulp mills. The increasing import deficit for pulp and waste paperindicates that new mills would be required in the next few years.
xviii. The Philippines has made considerable progress in developinginstitutions to provide credit for small farmers, most notably the ruralbanks. But the flow of credit to smallholders is far from adequate andmost have to rely on moneylenders and other noninstitutional sources. Theland reform program will place an additional heavy burden, particularly forsupervised credit, on rural credit institutions which have had little ex-perience in dealing with sharecroppers. Further, there is need for rapidexpansion of facilities since many localities in the land reform area arenot served by rural banks or branches of the Philippine National Bank(institutions mostly for short-term credit) and by the Development Bank ofthe Philippines (for longer-term credit).
xix. Recent steps to reorganize and consolidate agencies and functionsconcerned with agricultural development should do much to improve administra-tion and coordination of agricultural programs. The Philippines has suffereda proliferation of agencies and lines of authority, much of it outside ofthe the Department of Agriculture and Natural Resources (Figure 7018). ThePhilippines Council for Agricultural Research under the Secretary, DANRwill coordinate the scattered research activities which in the past havefor the most part gone their own way. The major part of extension activitieshave been transferred to DANR, thus strengthening the link between researchand extension. (It would also appear desirable to integrate the extensionactivities of the Department of Agrarian Reform as well). Marketing andprice stabilization activities have also been placed under the purview ofDANR. At the same time, the major Bureaus within DANR have been restructuredand given broader responsibility.
xx. To bring new technology to the small farmer, a considerablestrengthening of the research establishment and extension services willbe required. Research has done well in IIYV's of rice and quite recentlyin corn. But the technical base for sorghum and soybeans is not yet inhand, and diseases affecting sugar cane and coconut are widespread.Research on fishpond culture is making progress but research on livestock(and forage), and forestry is still grossly inadequate. Moreover, surveysof land classification and water resources are needed for planning the bestuse of resources and appropriate cropping patterns.
xxi. The large number of small farmers makes for a difficult extensiontask. Present manpower allows roughly for 1 extension agent for 1,400 farmers.To be effective at least a three-fold expansion of well-trained staff isrequired. The need is especially urgent in land reform areas.
xxii. The lack of roads and ports make transport of products difficultand expensive. A large improvement is required to move economically thesubstantial increases expected in production. It is especially importantfor the development of new areas.

xxiii. Section VIII, Major Investment Opportunities for Foreign Investment,presents an array of potential new projects suitable for foreign financing.These opportunities are in the fields of irrigation; credit, rural dLevelop-ment in land reform areas and land settlement; tobacco, corn, and coconutproduction and processing; forestry products; and fisheries.


I. INTRODUCTION
1.01 The major goals of the Government of the Philippines for theagricultural sector, as outlined in the Development Plan, 1972-75, are:
(a) To be self-sufficient in cereals, particularly rice,the major food staple, and corn both for food andanimal feed;
(b) To expand agricultural exports which provide most ofthe foreign exchange earnings from foreign trade;
(c) To intensify the land reform and land distributionprogram as incentive for increased productivity andto minimize social unrest; and
(d) To conserve natural resources.
1.02 This report reviews the performance and prospects of the sectorin relation to these objectives. It also looks to the longer run potentialof agriculture to achieve rapid growth in the 1970's shared more widelyamong the rural community. Thus, this report is concerned with majorconstraints on agricultural development, measures to overcome them, andthe strategy for development in the 1970's and the priorities which emergetherefrom.
1.03 This report is based on the findings of the Agricultural SectorSurvey Mission which visited the Philippines in February and May, 1972.The mission members were:
Mission Leader N.M. KoffskyDeputy Leader F. LowensteinAgriculturalist H.T. ChangAgricultural Economist C.H. ChungLivestock C.E. Bell, Jr. (Consultant)Agricultural Mlarketing P. Calkin (Consultant)Irrigation R.M. Fagerberg (Consultant)Forestry K. Ileiburg-Iurgensen (Consultant)Tree Crops J.G. Ohler (Consultant)Agricultural Credit E.A. Tenenbaum (Consultant)
In preparing its report, the mission had the assistance of P. Scandizzo ofthe Bank staff.
1.04 The report was reviewed with the Government of the Philippines inJanuary 1973 and updated to take into account developments between May andDecember 1972. However, most of the statistics are those which were avail-able to the mission at the time of its visit in May 1972.

- 2 -
II. BACKGROUND
Agriculture and the Economy
2.01 Agriculture is still the most important sector in the Philippineseconomy, accounting for about one-third of Net Domestic Product (NDP), one-half of total employment and 70 percent of commodity export earnings (Table 1).As might be expected in an economy which is broadening its base, theseproportions have shown reductions in the past decade.
Table 1: AGRICULTURE'S SHARE OF THE ECONOMY
Percent of Percent of Percent ofYear NDP Employment Export Value
1960 35 61 851965 32 57/1 871970 32 49- 70
/1 March, 1971.
Source: National Economic Council, Bureau of the Censusand Statistics; and Central Bank of the Philippines.
2.02 In the first half of the 1960's agricultural output grew slowly,in fact less than the 3 percent annual population increase (Table 2). In thelast half as the improved rice varieties took hold, it accelerated sharplyeven beyond the substantial rate of growth recorded in the non-agriculturalsector.
Table 2: AVERAGE ANNUAL GROWTH RATES
Period Agriculture Non-Agricultural
1960-65 2.4 5.21965-70 6.4 6.1
Source: Statistical Annex, Table 2.2.
2.03 Employment in agriculture, on the other hand, increased duringthe early period of low growth and levelled off during the later years.Although most of the increase in labor force between 1965 and 1970 wasaccommodated in non-agricultural employment, unemployment continued highwith more than half in rural areas (Table 3). Moreover, since the new

- 3 -
rice varieties have not increased total labor requirements over the tradi-tional varieties 1/, underemployment reflecting seasonal slack of farmoperations also remained high.
Table 3: LABOR FORCE AND EMPLOYMENT(in million)
Year Labor Force Employment UnemploymentAgr. Non-Agr.
1960 9.1 5.2 3.3 0.61965 10.8 5.7 4.4 0.71971 (March) 12.3 5.6 6.0 0.7
Source: Labor Force Reports, Bureau of the Census and Statistics.
2.04 With a rapid growth rate in agriculture and little change inemployment, productivity per worker in agriculture increased sharply in1965-70, largely from increases in rice (Table 4). Productivity in thenon-agricultural sector, on the other hand, remained much the same.
/1Table 4: NDP PER WORKER-
(in pesos)
Agr. asYear Agriculture Non-Agriculture % of Non-Apr.
1960 1,065 3,088 341965 1,096 2,990 37/21971 1,646 3,123 53-
/1 In constant 1967 prices.
/2 In 1971 prices, income per worker in agriculture was 63%of non-agricultural workers.
Source: Statistical Annex, Table 2.2 and Table 3 above.
2.05 Thus, the gap in incomes between workers in agriculture and thosein other sectors has narrowed appreciably although incomes in agricultureare still substantially lower. Those who used improved technology, suchas HYV's for rice, shared in the higher agricultural incomes but those inagriculture who continued in traditional ways of farming and fishing werelargely unaffected.
1/ R. Barker and E. Quintana, Farm Management Studies of Costs and Returnsin Rice Production. International Rice Research Institute, Los Banos.

-4-
Physical Setting
2.06 With 7,100 islands, the Philippines is the largest archipelago inthe world. Most of the area (98%) is encompassed in the 45 largest islands.The entire country is situated on a series of stress lines, along whichconsiderable faulting, folding and volcanic activities have resulted in alarge number of mountain ranges dividing the islands further into manyrelatively small watersheds and isolated alluvial plains. Central Luzoncontains the largest plain area (about 750,000 ha) followed by the CotabatoValley in Mindanao of about 500,000 ha. Also, in Mindanao, the uplandplateau of Bukidnon is the third largest integral land area. The CagayanValley in Northeast Luzon ranks fourth (Map IBRD 10215).
2.07 This geographic setting of scattered islands and numerous mountainranges makes transport of commodities to and from the farm difficult andcostly. Thus the Cagayan region has among the lowest prices received byfarmers for palay in the Philippines, whereas adjoining Central Luzon hasthe highest.
2.08 The territorial waters of the Philippines provide fishing groundscovering some 1.6 million sq km. However, the Philippine Islands arecharacterized by an extremely narrow continental shelf and a precipitouscontinental slope so that the more suitable shallow areas for fishing covera much smaller area of about 185,000 sq km.
2.09 The generally north-south alignment of mountain ranges shadowpart of major islands from either the north-east or north-west monsoons,with considerable variation in rainfall regionally from distinct dry/wetseasons to fairly even monthly distributions (Map IBRD 10133). Annualrainfall generally ranges from 1,500 mm to over 4,000 mm. The country,spanning from 5°N to 20°N, lies in the path of tropical typhoons, withthe largest incidence in North Luzon (averaging over 3 a year in 1948-70)and relatively little in southern Mindanao (only 2 in the 23-year period).
2.10 Temperatures vary little as between regions and months, providinga year round growing season throughout the Philippines. Humidity is alsohigh and combined with high temperatures make it difficult to store cropsand their seeds without rapid deterioration.
Structure of Agriculture
2.11 Philippines agriculture is largely made up of small units on whichlow productivity yields low incomes. Even as far back as 1960 (latest dataavailable), 80 percent of the 2.2 million farm units were less than 5 ha insize and covered 43% of the cultivated area; 40% were less than 2 ha andcovered 12% of the cultivated area. This latter group makes up the bulk ofthose with the lowest levels of income 1/. Small holdings primarily produce
1/ "In 1965, about 90% of all families with incomes of less than r 1,000lived in rural areas. These represented some 36% of all rural familiesbut accounted for only 12% of total income received by rural families.(Bureau of Census and Statistics, Family Income and Expenditures, Sur-vey of Households, Bulletin No. 22 July 1968)".

- 5 -
the food grains for domestic use and coconut for export. On the other hand,larger scale operations are involved in sugar, bananas, and pineapple forexport, and are increasingly taking over poultry and swine production. Asimilar contrast prevails in marine fishing where there are some 500,000 smallsubsistence fishermen along with about 30,000 engaged in commercial fishing.
2.12 About half of palay and corn farmers are tenants, almost all ona basis of sharecropping, usually 50 percent of the crop. These latter farmunits average 2.2 ha for palay farmer and 1.6 ha for corn, significanLtlysmaller than the average size held by owners. 1/ There has been scarLtprogress so far in improving their situation under land reform and landsettlement programs.
2.13 There is considerable pressure of people on land in the Philippines.In 1970 the population density was 128 people/sq km compared with the Asianaverage of 86. Lowland areas best suited for rice have been fully oc:cupiedfor over a decade. Migration is heavy from overcrowded regions of CentralLuzon and the Visayas to the Cagayan Valley in Northeast Luzon and Mindanaoin the south. Squatters (Kaingineros) have spread onto hillsides leavingbehind serious problems of erosion or an increasing accumulation of landstaken over by cogon grass which serves no productive purpose. Although itis difficult to clear cogon grass, there are possibilities for rehabilitatingmajor portions of this land.
The Resource Base
2.14 As might be expected from the topography, there is a great varietyof soils ranging from deep alluvial deposits, constantly being augmented, toresidual soils derived from shale and sandstone which are not very fertile.On the whole, the soils are potentially productive if properly managed. Butthe prevailing soil management practices of widespread hill and mountainsideculture without regard to soil conservation, continuous mono-culture withlittle or no fertilizer application, and the lack of drainage systems havegreatly limited their potential.
2.15 Out of a total land area of some 30 million ha, more than half isin forests (Table 5). About one-third is presently under cultivation orin plantations. It is estimated that some 300,000 ha a year are broughtinto cultivation from forest lands and open lands, but there is a substantialoffset in land abandoned by squatters, which is no longer productive.
1/ Based on the 1960 Census of Agriculture. A recent rough estimate placesthe number of tenants at about 1 million averaging about 1.8 ha pertenant.

- 6 -
Table 5: LAND USE, 1971
Area Proportion('000 ha) (%)
ForestProductive 14,114 47.0Unproductive 1,785 6.0
Total 15,899 53.0
Non-ForestOpen Land 2,646 8.8Managed pasture 840 2.8Marsh and Swamps 215 .7Cultivated and Plantation 9,795 32.7
Subtotal 13,496 45.0
Urban and Others 605 2.0
Total 14,101 47.0
GRAND TOTAL 30,000 100.0
Source: Philippines Forestry Statistics, 1971.
2.16 The mission estimates that there are perhaps 1.0 - 1.5 million haof fairly level or slightly rolling lands which might still be suitable forcultivation (Annex 13, para 13). In addition, perhaps 1 million ha of cogongrass lands, which are difficult to rehabilitate, might be in this category.Such information as is available indicates that most of these lands are inthe Cagayan Valley, Mindanao and Palawan. Organized settlement on these landscould do much to alleviate the problems stemming from squatters. Accordingto the Bureau of Fisheries, there are also some 500,000 ha of mangroves andswamp lands which could be developed as fishponds, about three times thepresent fishpond area.
2.17 Even though there is still some flexibility in extending theresource base, this alone will not suffice to meet increasing demands forfood for a population which will approach 50 millions by 1980 or to improveincomes for most farm peoples. These goals can only be realized by improvingthe productivity of the resource base.

-7-
Regional Distribution of Production
2.18 Areas where corn and some important commercial crops are grownare shown on Map IBRD 10397. Palay, which is not shown, is producedthroughout the Philippines. The distribution of palay production and popu-lation by regions indicates that the main surplus region is Central Luzonand the principal deficit areas, E. Visayas and S. Tagalog (Table 6). Thisis reflected in the Rice Flow Map (IBRD 10218).
Table 6: DISTRIBUTION OF POPULATION AND RICE PRODUCTION, 1970
% of % of PalayRegion Population Output
Ilocos 5.0 4.4Cagayan 4.0/1 9.8Central Luzon 17.5L- 27.0S. Tagalog 18.6 11.8Bicol 8.1 10.6W. Visayas 10.3 11.4E. Visayas 14.8 5.4N. & E. Mindanao 8.2 5.3S. & W. Mindanao 13.5 14.3
/1 Includes Manila area with 3.6% of the population.
Source: Bureau of Census and Statistics and Bureau ofAgricultural Economics (BAEcon).
2.19 The most important regions for other commodities and the percentageof the crops in a recent year were as follows:
Corn: S. & W. Mindanao (50%), W. Visayas (10%)and E. Visayas (9%).
Coconut: S. & W. Mindanao (34%), E. Visayas (27%)and N. & E. Mindanao (14%).
Sugar Cane: W. Visayas (72%), Central Luzon (12%).
Bananas: W. Visayas (31%), E. Visayas (18%) andN. & E. Mindanao (14%).
VirginiaTobacco: Ilocos (93%).
NativeTobacco: Cagayan (48%), S. & U. Mindanao (20%).
Abaca: Bicol (37%), W. Visayas (27%) andS. & W. Mindanao (20%).
Soybeans: W. Visayas (72%).

- 8 -
Livestock on farms are more evenly distributed.
Cattle: S. & W. Mindanao (28%), S. Tagalog (13%),Central Luzon (12%).
Hogs: E. Visayas (17%), N. & E. Mindanao (15%)and Tagalog (14%).
Chickens: S. Tagalog (21%), N. & E. Mindanao (20%)and Central Luzon (17%).
2.20 Mindanao Island accounts for 75 percent of logs produced and LuzonIsland 18 percent. Most of the marine commercial fish catch (58 percent)comes from the Sulu Sea alongside Palawan Island, and 24 percent from theVisayas Sea. Fishpond production is heaviest in Central and SouthernLuzon (70 percent).
2.21 There has been a substantial regional concentration of variouscommodities, in line with comparative advantage. In most instances, theregions of heaviest production have the highest yields per ha.

- 9 -
III. PAST AGRICULTURAL PERFORMANCE
3.01 Table 7 indicates the relative importance of the several sub-sectors in Agricultural NDP and their average growth rates in recent years.The growth rates in the mid 60's were, as a whole, more rapid than in thelate 60's and early 70's.
Table 7: CONTRIBUTION OF SUBSECTORS TO AGRICULTURAL NDP
Value /1 Growth Rate 1 /1Added, 1971 - 1965-71 - 1967-71-
Crops 54.5 8.0 6.1Livestock 17.1 - 0.7Fisheries 10.6 6.2 8.9Forestry 17.8 8.2 2.9
Total 100.0 6.0 4.7
/1 In 1967 prices.
Source: OSCAS, NEC and BAEcon (See Statistical Annex Table2.2 and 2.7).
3.02 Most of the expansion took place in crops and fisheries. Amongthe crops, palay (paddy rice), corn and sugar cane provided the major pro-duction increases in the recent period. In fisheries, where high rates ofgrowth were sustained throughout the 1960's, the gains more recently havecome from subsistence fishing and fish pond activities rather than fromcommercial marine fisheries. Forestry output showed rapid growth, butmost of its growth occurred before 1969. The livestock subsector madlelittle progress.
The Rice Self-Sufficiency Program
3.03 The palay area (35% of the total cropped area) has remained muchthe same in the past decade; yields per ha, however, rose about 6% a yearfollowing the spread of the high yielding varieties (HYV's), since themid-1960's (Figure 7281). This was primarily on irrigated lands whichaccount for about 30% of the rice area.
3.04 Despite the sharp rise in yields and the resulting increase inoutput, the Philippines did not attain self-sufficiency in rice, exceptin 1967/68, according to mission estimates. Although imports of rice stoppedfrom 1968/69 to 1970/71, there were declines in stocks of rice in these years(Table 8). Rice imports rose to 635,000 tons in 1971/72. Import requirementsare heavy again in 1972/73. So far imports of 337,000 tons have been arrangedbut this will fall far short of ensuring an adequate stock position for thelean summer months.

- 10 -
Table 8: SUPPLY AND DISTRIBUTION OF RICE, 1965/66 TO 1971/72('000 metric tons)
Year Ending Production Net Change DisappearanceJune 30 Imports in Stocks
1966 2,355 327 - 17 2,6991967 2,368 215 - 75 2,6571968 2,686 119 236 2,5691969 2,644 (27) - 87 2,7041970 3,173 (1) -115 3,2881971 3,239 17 - 94 3,3501972 3,090 635 337 3,388
Source: Annex 9, Table 1.
3.05 In 1971-72, the crop suffered severe damage from Tongro diseaseand hurricanes. In 1972-73, severe floods caused a crop failure in a largepart of Central Luzon. These natural disasters further retarded progresstowards self-sufficiency in rice. Nevertheless, significant progress towardsself-sufficiency has been achieved, even though this goal has remained justbeyond reach for several years.
3.06 There has been an upward trend in yields per hectare since 1957/58.Three factors are involved: greater use of improved varieties; reduction ofthe lower yielding upland rice area; and the expansion of irrigated cultiva-tion. The use of fertilizer on irrigated palay (about 900,000 ha) was about50 kg/ha of N in 1972, but little fertilizer was used on rainfed lowlandpaddy and upland rice.
3.07 The average yield in 1970/71 (39 cavans) was 13% higher than in1968/69 (30.3 cavans). Even with the floods, the average yield in 1972/73is estimated at 36.5 cavans per ha.
3.08 The rapid increase in yields since 1966/67 was caused primarilyby the introduction and expansion of HYV's. The National Food and Agri-cultural Council (NFAC) reported that the total HYV area increased from83,000 ha in 1966/67 to 1.2 million ha in 1970/71. Over the same period,however, the reported average yield/ha of HYV rice decreased from 100 cavansto 66 cavans. NFAC attributed the decline in yield to the following causes:decreasing use of inputs due to rising cost; tight credit; replacementof IR-8 varieties with better taste qualities but lower yield (IR-5, IR-20,IR-22, and C-4); severe rat damage, with an average loss of 3 cavans perha; insufficient supervision by extension workers due to the latter's lack oftransportation facility; inadequate post-harvest facilities; and threemajor typhoons in 1970/71 and 19 minor ones. Over the two-year period,there was a loss in harvested area of about 6.5%.
3.09 As a general rule, the average yield of new varieties for anycrop will decline as the area expands. In the Philippines, HYV plantingbegan initially in irrigated areas. THE HYV area in NFAC's programmed

- 11 -
area (1970/71) of about 1.2 million ha was considerably greater than themission's estimate of less than 900,000 ha irrigated. Therefore, NFACreports suggest that HYV's spilled onto some 300,000 ha of rainfed paddyin 1970/71. While this expansion of HYV area has been the main contribu-tion to the rapid production increase since 1966, continued expansion canno longer be expected to increase the national average rice yield at thesame rate, even though the national average paddy yield is a mere 1.7 MT/ha.
3.10 Past performance for rice production suggests the following coursesof action for the future:
i. More substantial exapnsion of lowland irrigated area,expansion of the HYV area on rainfed paddy in areaswith relatively even distribution of rainfall, andimprovement of drainage of the paddies.
ii. Improving yields on existing irrigated land by anexpanded irrigation rehabilitation program and byinducing the use of more inputs by farmers throughreduction of risks.
iii. Extension of still better HYV's with higher diseaseresistance.
iv. Controlled reduction of the area planted to uplandrice on slopes that are too steep and diversion ofsome rainfed lowland paddy to other crops.
Output of Other Products
3.11 Most of the increase in the output of crops other than palay camefrom expansion of area (Figure 7281).
3.12 The area in corn (28% of cropped area) has increased about 600,000ha since 1960. While yields also show a substantial rise, this was largelya reflection of expansion into areas of Mindanao with better growing con-ditions rather than any advance in crop technology. The average for cornof 0.8 mt/ha is far below the 2 ton yield obtained in Thailand, also underrainfed conditions and traditional farming.
3.13 The coconut area (21% of the total) doubled since 1960, an increaseof about 1 million ha. During this period, however, yields of the bearingarea declined about 20%. Similarly, the area in sugarcane (4% of totalcropped area), increased almost 200,000 ha, almost double from 1960 butsugarcane yields declined almost 10%. The recovery of sugar per ha wasreduced about 30%, reflecting delays in milling as well. For Virginiatobacco, which has a favorable export potential, there has been littleimprovement in yields and the small area involved has been reduced inrecent years.

- 12 -
3.14 Fertilizer use is low, only 5-7% of the consumption per ha ofarable land in Taiwan and the Republic of Korea. Most of it is used onsugarcane land and more recently on the HYV's of rice. Little has beenused so far on corn land; the prevalence of downy mildew disease makesthis a risky venture. Seeds resistant to this disease, however, have beendeveloped recently.
3.15 Most of the commercial forest areas are under license for timbercutting. However, many are not exploited intensively. On fully half ofthe area, production of logs is far below the allowable cut. These arelargely the smaller operations under relatively short-term licenses.
3.16 The territorial waters are fished quite intensively, especiallythose near shore by small fishermen, and sharp increases in marine fishoutput have tapered off in recent years. Fish pond activities, which pro-vide about 10% of the total fish supply, have expanded both in area andyield per ha. Although yields average about twice as high as in Indonesia,they are still less than one-third of those attained in Taiwan under moderntechnology.

- 13 -
IV. DEVELOPMENT PLAN FY 1972-75 -/ AND DEMAND OUTLOOK
Development Plan
4.01 Prior to the recent natural calamities, the government developmentplan for agriculture looked to an increase of 5.7% in the sector in thefirst year, FY-1972, which according to the plan would achieve self-suffi-ciency in food grains; and annual increases thereafter to 1975 of 5.1% tofacilitate agriculture diversification and expansion of exports. With twoyears of poor rice crops, the plan is hardly likely to be realized. Evenbeforehand, there was little likelihood of attaining plan targets by FY-1975of production increases projected for palay (6.1% a year), yellow coln (8.2%),fish (5.8%) and livestock products (6-8%) given the development effortenvisioned in the plan. 2/ By contrast, the plan targets for the majorexport commodities are less ambitious and could well be realized (in thecase of copra it is being exceeded); copra 4-1/2% a year; sugar, 3.8%; andlogs, 2%. On the other hand, projected increases of 10% a year for cigarleaf tobacco are quite out of keeping with the present low state and uncertainprospects of the industry.
4.02 Although agriculture has a high priority in the Development: Plan,projected government expenditures for agriculture and natural resources byFY-1975 would still be only 7-1/2% of total government outlays, about: thesame percentage as in FY-1971. This would not provide for the significantincrease in manpower which a more intensive agricultural development programwould clearly require (see para 5.01).
Demand Outlook
4.03 On the whole, the Philippines need not be concerned that supplieswill outrun demand for food in domestic markets for some years to come.Prices have risen on a broad front extending beyond the impact of the cur-rent shortage of rice. In fact, it will be difficult to meet projectedincreases in demand in the current decade of over 40% for rice; 100% forcorn, mostly for expanding livestock feed requirements; 80% for meat; and60% for fish. For the latter two, the prospects for commensurate increasesin supply are not sanguine and prices will likely continue to rise morerapidly than for other foods.
4.04 Some uncertainties and constraints are attached to the prospectsfor export commodities. Sugar exports are entirely dependent on the pre-ferential U.S. sugar quota, which may be revised for 1975 and beyond. ThePhilippines has had difficulty in meeting its quota, leading to some reduc-tions in the past and domestic use is also expanding. More recently it hasbeen more successful, partly by borrowing from the early harvest of thenext crop.
1/ Four Year Development Plan FY 1972-75, July 23, 1971.
2/ The feasibility of plan targets is examined in some detail in thepertinent annexes.

- 14 -
4.05 Coconut products, of which the Philippines is the world's largestexporter, is encountering increasing competition from substitute products.While the volume of exports is anticipated to rise about one-third by1980, lower prices will be an offsetting factor.
4.06 The export prospects for forest products are quite favorable.Prices are expected to continue firm and, while there is increasing compe-tition from Indonesia, the Japanese market for logs is expanding rapidly.There appear to be favorable opportunities to participate in export marketsfor pulpwood and pulp (a matter for import substitution as well).
4.07 Outside of these major export earners, exports of bananas are notlikely to continue for long their rapid penetration of the Japanese market,with no alternative markets in sight. Exports of abaca for cordage havedeclined because of competition from synthetic fibers; some is being processedfor export as high quality pulp for paper but the prospect for developing alarge outlet is slim.
4.08 There is a significant potential to increase exports of cigar(native) and flue-cured (Virginia) tobacco, for which world prices areexpected to continue favorable. But this can be realized only by greatlyimproving quality and production, both of which have declined sharply.
4.09 World markets are expected to continue strong for feed grains andbeef. Once the domestic needs are met, the Philippines would be in afavorable position to exploit their advantages of location relative to theJapanese market for feed grains and the absence of hoof and mouth diseasein cattle in the Visayas and Mindanao, a rarity in Asia. But these areprospects more for the 1980's than the 1970's. There is some potential fordeveloping rubber exports for which production is expanding rapidly althoughfrom a very small base. However, the outlook is for prices to continue weak.
4.10 To meet the larger requirements, explained above, the productiontargets for agriculture would have to expand between 1972 and 1980 by thefollowing rates:
Rice 4-1/2% /1Corn 9%Fish 6%Livestock 7-3/4%Sugar 2-1/2%Coconut 3%Logs 2%Wood 7%
/1 This would require increases averaging 7-1/2%a year between 1972 and 1975 to attain self-sufficiency and about 2.7% a year thereafterto keep up with population growth.
- 15 -
V. A STRATEGY FOR THE 1970'S
Fiscal Policy
5.01 In fiscal 1970/71, agriculture was more or less self-supporting.Government expenditure for Agriculture and Natural Resources totalledt 306 million. This was just about the collections from the stabilizationof export tax on logs, sugar and coconut products. These taxes under thegoverning legislation were scheduled to phase out by the end of fiscal1974 but their future at this time is uncertain. In any case, lookingahead, Government expenditures on agriculture and natural resources arelikely to substantially exceed revenues obtained therefrom. Given theland and water resources which are still untapped as well as the Government'sdesire to spread the benefits of development throughout the rural popula-tion, this may well be intensified. Specifically, the needs for reha:bilita-tion and expansion of the irrigated area for rice, for a larger and improvedprogram of land settlement, and for the large increase in trained manpowerrequired for these and other agricultural development programs should leadto an increase in annual government expenditures within five years or so ofthe order of f 700-800 million (in 1972 prices), compared with the V .400 mil-lion estimated for FY-1972. It is noted that the National Irrigation Adminis-tration will need to double its engineering staff to mount a significantrehabilitation program (para 7.28) and that the extension worker/farmer ratiois approximately 1:1,400 whereas 1:300-400, or even lower for land reformareas, is needed to be effective (Annex 6, para 23). Yet, considering thetight public finance position, fiscal policy should be such as to raiseconsiderable additional resources within the most prosperous segments ofthe rural population.
Regional Development
5.02 Most islands offer opportunities for development but many havebeen by-passed. With a higher level of resources going into agricultu Ire,it should be possible to implement a more balanced regional developmelntpolicy. Government development activities have largely centered in CentralLuzon and more recently in some parts of Mindanao as well. While there isstill need to increase efforts there, other regions offer considerablepotential for sustained long term agricultural growth. However, substantialoutlays for infrastructure will be required to bring this po'tential intoproduction, particularly in the Cagayan Valley and elsewhere in Mindarnao toaccommodate immigration and land settlement. Development du'ring the 1970'sshould look to a better regional balance; otherwise the disparities amongregions will widen further and agricultural growth will taper off.
Grain Production Targets
5.03 A major goal of the Development Plan FY 1972-75 is to achieve self-sufficiency in rice. Under Philippine circumstances, progress towards thisobjective has merit on several counts. There are large areas well suitedto intensive rice cultivation. Palay is the main product of 50% of all

- 16 -
farmers; predominantly small farmers with limited alternatives. Finally,Government is reluctant to rely on a volatile world market for its staplefood. Table 9 shows mission projections of palay requirements for domesticindicating that production would need to increase by 24% from 1972 to 1975in order to regain marginal self-sufficiency by that year, and by 14% from1975 to 1980 to continue in that state. Risks of weather and blights aside,the mission believes these levels are well within the Philippine capabilities.However, it would require a substantial improvement and expansion of irriga-tion facilities, particularly to provide for dry season cropping, and rapidspread of HYV-fertilizer technology on rainfed lowlands. By 1975, self-sufficiency in rice would require an increase in the irrigated cropped areaof about 280,000 ha from the present 900,000 ha, and the extension of HYV'son rainfed lowlands to 750,000 ha on top of the present level of 300,000 ha.To maintain self-sufficiency in 1975-80 would require an additional 360,000ha of irrigated cropped area and most of the remaining rainfed lowlands inMYV's (Annex 6, Table 18).
Table 9: PALAY REOUIRENENTS(million metric tons)
Year Requirements /1 Production
1971/72 5,720 5,1001974/75 6,320 6,330 /21979/80 7,220 7,250 /2
/1 Based on per capita consumption of 91 kg rice, thefigure used by Government in estimating requirementsfor human consumption. This is slightly higher thanper capita disappearance of 90.6 kg in the peak year1970 (Annex 9, Table 1).
/2 Assuming rice self-sufficiency.
Source: Annex 9, para 7.
5.04 ITnder these circumstances, pricing policy has a key role to playin spreading the new rice technology over wider areas and to smaller farmers.Until fertilizer usage is more widespread, fertilizer prices should not beset so high as to discourage more use. These prices are relatively high byinternational standards (Annex 14, Table 6). It would be quite harmful tothe developmert e£fort if they were increased further.
5.05 As the nation moves from an import position to self-sufficiencywhere small surpluses may be generated from tine to time, pricing policyshould be readjusted. At that time, price support operations and bufferstocks for contingencies will become more sophisticated to manage. In thisrespect, private rice mills or marketing cooperatives can serve as agents ofthe Grain Authority for purchase at the support price or for extending croploans (possiblv financed by the local rural bank). This would require abonded warehouse receipt system which could also serve as the mechanismfor government control over its stocks without actual physical possession.Mismanagement of government stocks in the past has been largely due to abreakdown of the validity of the quedan or warehouse receipt system.

- 17 -
5.06 Corn requirements for the Philippines are expected to increasesharply and most of the increase will be for animal feed. Although sorghumproduction is now very small and will remain small in relation to corn,it is expected to increase and contribute to the future animal feed supply.Food requirements for corn are projected to rise about 18% by 1979/80, butfeed requirements are expected to almost quadruple (Table 10).
Table 10: FEED GRAIN REQUIREMENTS('000 metric tons)
1971/72 1974/75 1979/80
CornFood 1,443 1,490 1,702Feed 396 538 1,569Other 104 346 427
Total 1,943 2,374 3,698
Sorghum (over 90% feed) 14 34 90
Grand Total 1,957 2P408 3,788
Source: Annex 7, Table 12.
5.07 In the short term, incentives are necessary to stimulate thleadoption of the new HYV's of corn and use of fertilizers from which thereis a very large yield potential. As this progresses, however, forwardpolicy should look to gradually lower prices to support expansion of live-stock enterprises, and perhaps by the end of the decade enable the Philip-pines to participate in a favorable export market. The same will holld truefor grain sorghum and soybeans when the technical base for high yieldingproduction is developed.
Foreign Trade
5.08 Rising exports of copper in recent years have somewhat diminishedthe previous overriding importance of agriculture to export earnings. Thevalue of agricultural exports rose over 6% a year from 1960-1965; sinVethen the rate has slowed to 3%. Although exports of bananas and canniedpineapple have increased rapidly in the last few years, coconut produ ts,forest products and sugar still account for 92% of all agricultural exports(Table 11). Exportable supplies of these major products have been a limitingfactor. Export prices for logs and sugar have strengthened since thelmid1960's while those of coconut products, for which the Philippines is themajor world supplier, have weakened in response to increasing competiitionfrom other vegetable oils. I

- 18 -
Table 11: VALUE OF EXPORTS(million dollars)
Year Coconuts Forest Sugar Total AllProducts Products Agriculture Exports
1960 178 101 138 478 5601965 270 191 142 657 7681970 209 280 196 744 1,062
Source: Central Bank of the Philippines.
5.09 Beyond the risks of an export base limited to a few products, thedirection of export trade has been increasingly to the U.S. (coconut oil,sugar and pineapple) and Japan (forest products, bananas and copper con-centrates). Export to those two countries represented 74% of the total in1965 and 81% in 1970.
5.10 Imports of agricultural products (Table 12) represent a fairlysmall proportion of total imports (some 16% in 1970) and vary substantiallywith the need for importing rice. This will again be a large factor in thedata for 1971 and 1972.
Table 12: VALUE OF IMPORTS(million dollars)
Year Food Raw Total AllProducts Textile Agriculture Imports
Fibers
1960 85 20 120 6041965 155 35 209 8081970 104 40 172 1,090
Source: Central Bank of the Philippines.
5.11 Rice aside, there may be profitable opportunities for importsubstitution, particularly for animal feedstuffs which increased from US$2.6million in 1965 to $8.1 million in 1970, for imports of pulp and wastepaper (from $3.4 million to $6.4 million), and possibly for imports of cannedfish (which rose from $13.4 million to $20.4 million).
The Critical Role of Water Investment
5.12 It is clear that the Philippines cannot reach self-sufficiency inrice without irrigation. Yet, the performance of irrigation systems in thePhilippines falls far short of their potential. The mission estimates thatout of a total area of 959,000 ha which could be served, only 630,000 ha

- 19 -
are served in main season and 254,000 ha in the palagad (dry) season(Table 13). This represents a discounting of about 20% from official esti-mates.
Table 13: IRRIGATED AREA, POTENTIAL AND SERVED
Systems Potential Area Cropped Area(000 ha) Regular Palagad Total
--------(000 ha)---------
NIA 407 305 136 441ISU (pumps) 239 110 38 149Communal (NIA) 222 133 53 187Communal (private) 90 81 27 108
959 630 254 884
Source: Mission Estimates.
5.13 The National Irrigation Administration (NIA) gravity system isthe main component. In addition, NIA constructed or rehabilitated a sub-stantial part of small communal operated systems, averaging 250-300 ha. TheIrrigation Service Unit (ISU), now under the administrative supervision ofNIA, is responsible for pump irrigation schemes.
5.14 Operations are generally disappointing. The cropping intensityof the main NIA systems is only 108% 1/, largely as a result of accumulatingneglect of proper maintenance. The record of the pump irrigation schemes iseven less satisfactory; in particular during the palagad season many pumpsfunction on a limited basis, if at all.
Potential for New Irrigation
5.15 The mission estimates that potentially over 1.3 million halof newlands could be brought under irrigation (Table 14). But under exist|ingconditions, continued neglect of proper operation and maintenance, progres-sively reduces the potential benefits from new projects. Rehabilitaition ofeXisting projects and proper operation and maintenance of rehabilita!ted andnew projects are essential to larger rice production.
Table 14: POTENTIAL FOR NEW IRRIGATION('000 ha)
NIA Gravity 815NIA Communal 150Pump Irrigation 385
Total 1,350
Source: Annex 3, Table 4.
1/ Total cropped area as percentage of potential area.

- 20 -
Smallholder Credit for Fertilizersand Other Production Inputs
5.16 HYV-fertilizer technology has the potential to increase yields ofrice and corn, which are low by international standards. About two-thirdsof the rice area (mostly rainfed lowlands) and almost all of the corn areareceive little, if any, fertilizers and plant protection. To exploit thispotential will require a large increase in credit to smallholders forfinancing production inputs, along with an intensive extension program.
Land Use and Employment Strategy
5.17 Government realizes that the use of land must be aligned betterwith land capabilities. Recent reforms of the forestry code prohibit thefurther encroachment of kaingin and cropping of slope lands over 18%.Organized land settlement schemes on arable lands still unsettled offersome opportunities to accommodate migration without the ills associatedwith kaingin. Reforestation with fast-growing species of denuded forestlands to alleviate runoff and flooding and to provide a base for pulp industryis also a matter of high priority. Replanting of prime forest lands afterlogging needs to be emphasized and enforced much better than in the past,especially as the longer term outlook for exports is favorable.
5.18 Cogon lands, covering some 4-5 million ha present a formidableproblem of rehabilitation but at the same time a large opportunity toextend the resource base. Most of it is on slopes which restrict itspotential use to woodlands or grazing, pointing specifically to the develop-ment of pulpwood enterprises and cattle ranching. Perhaps 1 million ha aresuitable for cropping. Preliminary investigations are necessary to deter-mine the feasibility of bringing these lands into productive purposes.
5.19 The potential for increasing employment in agriculture, whichhas been essentially static for some years, depends largely on extensionof activities to lands not presently in use. So far the new rice technologyhas not increased overall labor use, although as cropping during the dryseason expands, underemployment during the slack season can be substantiallyreduced.
Land Reform and Income Redistribution
5.20 Presidential Decree No. 27 provides for transforming perhaps asmany as 1 million sharecroppers into owner-cultivators within the next 4 or4 years. In the past, progress in land reform has been largely to extendleasehold status to a small proportion of tenants. By providing securityof tenure and better sharing arrangements, the lot of the tenant was generallyimproved although productivity of leasehold units remained much the same asthose remaining as share tenants. The challenge of land reform lies notonly in providing the incentive of land titles but also in supplying creditand Government supporting services necessary to improve productivity andincome. Government recognizes that these are essential to success of theland reform program and has begun to strengthen these activities.

- 21 -
Government Services and Organization
5.21 Although the Filipino farmer is generally literate and receptiveto change, as has been evidenced in rice, development and adoption oiimproved technology depends very largely on the research base and the ex-tension activities which bridge research and the cultivator. The research,extension and credit establishments in the Philippines are more advancedthan in most other developing countries but are still quite inadequatein manpower and organization to effectively support a strong developmenteffort. However, recent administrative reforms for consolidating and co-ordinating such activities hold promise for more effective programs in thefuture. (The current state of these activities is discussed in Chapter VIIand in the pertinent annexes relating to crops, livestock, forestry andfisheries.)

- 22 -
VI. MAJOR PRODUCTION PROGRAMS
A. Crops
Rice
6.01 Even if there is rapid recovery from the recent floods, thePhilippines will not find it easy to regain the momentum in rice outputachieved in the latter 1960's. In that period, production rose some 5-1/2%a year, reflecting yield increases averaging about 6% along with some declinein area planted to upland rice. From 1972 to 1980, the mission estimatesthat a growth target for rice averaging about 4-1/2% per annum would berealistic.
6.02 The impressive gain in yields in 1965-70 was due to three mainfactors:
- Introduction and rapid extension of high yieldingvarieties were barely introduced only five years ago,by 1971 they covered over 50% of the lowland area. Mostof the irrigated area and part of the non-irrigatedlowlands are now covered.
- Expansion of the irrigated rice area, including bothwet and dry season crops, for which the new varietiesare best adapted. However, little fertilizer is used.Perhaps one third of the lowland rice area receivesfertilizer applications, usually in less than recommendedquantities.
- The low-yielding upland rice area has been reduced about athird since 1965 which has had the effect of raisingaverage yields.
6.03 Even with this very significant progress in high yielding varieties,yields average only 1.7 tons of palay per hectare, still among the lowestin Asia. It is clear that a large potential for increasing yields in thefuture is in expansion of the irrigated area both from improvements inpresent irrigation systems and from conversion to irrigation of rainfedlowlands. At the same time, the spread of high yielding varieties onrainfed paddy in areas with relatively even distribution of rainfall shouldbe accelerated. The large gains that can accrue from such shifts areindicated in the differences in yields normally obtained under the severalcategories:

- 23 -
Lowland Palay Metric Tons per Ha
Irrigated, HYV 2.9Rainfed, HYV 1.8Rainfed, Traditional 1.1
Upland
Traditional 0.8
Average 1.7
6.04 There is a further potential for higher yields from increaseduse of fertilizers, particularly where little or none is now applied.Although DANR recommends the use of from 60-100 Kg N per ha on irrigatedlands, the meager evidence assembled on farm costs and returns in Annex 14suggests that rates this high, although still bringing added output, maybe unprofitable to many. Thus, considerable care should be exercised inpressing such recommendations except on lands where there is good irrigationand drainage. This emphasizes the importance of coordination betweenwater engineering and agricultural administration (Annex 6).
6.05 Results of field trials on rainfed lowland paddy involvingcertified HYV seeds, fertilizers, plant protection and rather strictregime of field operations have encouraged hopes for significant yieldincreases on rainfed lowlands. A program has been initiated to cover some50,000 ha this year. If this should prove out, despite the rather demandingrequirements on the cultivator, Government plans to extend the programrapidly on areas with favorable rainfall distribution.
6.06 Should the irrigated crop area be expanded, as appears feasibleto the mission, by close to 650,000 ha by 1980 (370,000 ha regular crop and275,000 ha palagad crop), and most of the rainfed lowlands put under HYV's,some 200,000 ha of upland rice could go to other uses. Some would likelygo to corn, which under current conditions, could yield as much net returnas upland rice (Annex 14). With improved varieties, corn could yield muchbetter than upland rice.
Corn
6.07 Corn production also showed considerable progress, increasingover 50% during 1965-70, a little more than half due to expansion of area(26%) but with yields up as well (22%). Even so, corn yields average only0.8 tons/hectare compared with 2 tons in Thailand. There is thus veryconsiderable room for improvement.
6.08 White corn, used mainly for food, accounts for about 90% of produc-tion and yellow corn, mainly for feed, the remainder. More than half isproduced in Mindanao, mostly in S & W Mindanao, and about 10% in the 'CagayanValley, Northeast Luzon. These are predominantly white corn. SoutheirnTagalog, which produces mostly yellow corn, accounts for about 8%.

- 24 -
6.09 By 1980, requirements for corn are projected to increase to 4million tons, double the current level. Most of the increase willrepresent rising demands for feed, particularly from the expanding pig andpoultry industries.
6.10 The prevalence of downy mildew disease is the central limitingfactor to attaining high yields. This has led to very slow adoption ofhigh yielding varieties (some 13% of the area) and very little use of fer-tilizers (applied to less than 10% of the corn area). Under experimentalconditions, and when the incidence of the disease is low, HYV's have yieldedtwice as much as the traditional varieties even without fertilization, andwith fertilizers have more than doubled again.
6.11 Last year, downy mildew resistant white corn synthetic varietieswere introduced, and this year yellow corn varieties, which open the wayto a major breakthrough, were introduced. As these become firmly established,the practice of fertilization (recommended at about 60 Kg N per hectare whichwould clearly be profitable) is likely to expand rapidly.
6.12 While it would be unrealistic to assume that experimental yieldscan be translated into average farm performance, there is a clear potentialfor meeting domestic requirements by 1980 without requiring additional cornarea. However, feed grain deficits are likely to continue through themid-1970's.
6.13 Beyond 1980, and perhaps before, there is the distinct potentialfor exporting feed grains, particularly for participation in the expandingJapanese market. The pending Magat project area in the Cagayan Valleyappears to be quite suitable for growing corn under irrigation as well asrice and could provide a substantial step up in production by that time.In the meantime, the largest potential continues in Mindanao where thelivestock industry will likely continue to be centered.
Sorghum
6.14 Sorghum was introduced only recently in the Philippines. Researchfindings and farmers' experience are so limited that it is difficult to putits potential in proper perspective. Only some 15,000 tons were producedin 1970/71, almost all in Cotabato, Mindanao. Yields averaged better than2 tons/ha, again with very little fertilizers or plant protection. Prelimi-nary field trials indicate significant response to nitrogen up to 90 Kg Nper ha.
6.15 Because it is a new crop, farmers have experienced difficultiesin seed viability, cultural, practices and threshing as well as in findingmarkets. Nevertheless, there is clearly an optimistic case for integratingsorghum into the feed grain program. It is more tolerant than corn todrought and water logging and may well do better on marginal lands presentlyin corn.

- 25 -
6.16 Further, a thriving world trade has developed for sorghum as forother feed grains and the Philippines' potential to eventually participatein exports would be enhanced if current obstacles can be overcome.
Soybeans
6.17 Soybeans is a minor crop in the Philippines and experience overthe past decade has been disappointing. The area in soybeans and yieldshave declined since the early 1960's and current production - largely inthe Western Visayas - is only 1,000 to 2,000 tons, used mainly as food.
6.18 Recently the poultry and swine industries have created a strongand growing demand for soybean meal. Almost 50,000 tons were imported in1971 and the needs by 1975 may well approach 150,000 tons if local productionremains the same.
6.19 There is practically no market for local soybeans to be processedinto oil and meal. Production is insufficient to support such enterpriseand a duty effectively keeps out imports of soybeans which local productioncould supplement. The most practical solutions appear to be to eliminatethe duty so as to increase supplies for local oil mills to extract oil andproduce meal or to equip feed mills to defat or heat beans, which otherwisecannot be fed to livestock directly.
6.20 High yielding varieties cover about 25% of the relatively simallsoybean area, mostly in Ilocos where yields averaging about 1 ton/ha havebeen reported in 1971/72. Regional trials of HYV's have reported yieldsof 2 to 3 tons/ha in wet season and 1.3 tons/ha in dry season.
6.21 The Philippines has the capability and the need for developmentof soybeans. But to break the present impasse, it is essential to provideprocessing outlets for producers.
Sugar
6.22 Although production of sugar has increased some 60% in the past10 years, it has come about only through almost doubling the sugar canearea. Not only have yields of sugar cane declined but also the sugar re-covery from cane. The result has been a drop of 30% in sugar yield per hafrom the late 1950's, most pronounced in the Western Visayas which accountfor almost three-fourths of production. The decline in yields is bas!icallydue to expansion of sugar cane into marginal lands, particularly slopelands without corrective soil conservation practices, and to delays betweenharvesting and milling which reduce sugar content rapidly after 48 holurs.Disruptions in delivery of cane to mills appear to be related to the idis-organized expansion of sugar mills in areas within adequate sugar canie sup-plies. Additionally, insects and diseases are prevalent, particularly theratoon-stunting disease.

- 26 -
6.23 Thus, sugar has become a high cost industry unable to competein export markets in the past other than under the quotas established in thepreferential U.S. market. Future prospects for the Philippines in the U.S.will depend to a substantial degree on the demonstrated capabilities to supplylarger supplies.
6.24 Under recent high world prices and favorable future price prospects,the Philippines could compete in world markets, but the supplies over andabove domestic consumption and the U.S. market available for export probablycannot be expanded significantly. Rising domestic use will use the largersupplies which could be produced. If the future U. S. import quota for thePhillipines is reduced, larger exports to world markets would be desirable.Such exports would require a larger export quota under the InternationalSugar Agreement (ISA) than the 60,000 ton residual quota now allocated tothe country (the Phillipines can export 60,000 tons to replace shortfallsby other countries). The allocation of larger ISA quota for the Phillipineswill depend principally upon proving that the Phillipines has the productivecapacity to fill a larger quota. The mission estimates that the Phillipinesugar industry will not be able to fill a U. S. import quota of 1-1/2 milliontons and a larger ISA export quota.
6.25 Most producers of sugar cane now use improved varieties, a fairquantity of fertilizers, pesticides and mechanization. To begin recovery toyields which prevailed 10-15 years ago, the most immediate potential is torestore the sugar recovery rate. This would require reimposition ofdiscipline in harvesting and milling schedules, which in turn would meanadditional farm machinery (possibly on a pooled basis for small farm units)to speed up land preparation ahd harvesting, and additional trucks forhandling cane. By this action alone, it would be possible to meet prospectivedomestic and export requirements from some 30,000-40,000 fewer hectares thanat present, an opportunity to divert marginal lands to cattle grazing whichintegrates well with sugar enterprise.
6.26 Over the longer run, if the export outlook warrants, extensionof irrigation facilities in areas with distinct dry season (only 7% ofsugar cane is presently irrigated), further improvement in varietiesespecially those resistant to ratoon-stunting disease, and the adoptionof contour cultivation on hill slopes, which presents no serious techno-logical problems, could well bring complete recovery in yields to previouslevels.
Tobacco
6.27 The Philippines has a considerable potential to increase exportearnings from tobacco, especially Virginia type. However, both area andproduction of Virginia tobacco, produced mainly in Ilocos region, are about40% below the 1960 levels: and show no distinct trend in yields. Native typetobacco, produced largely in the Cagayan Valley has recorded little changein area but with some increase in yields and production in 1971 was about 20%above 1960.

- 27 -
6.28 On the whole the crops are increasingly of low quality, substan-tially due to insects and diseases and improper curing methods. With highproduction costs and low yields, Philippines tobacco does not compete wellwith Indonesia in foreign markets.
6.29 The majority of tobacco growers in the Philippines do not usefertilizers and use of pesticides and soil fumigants is quite limited.Consequently, even though improved varieties are used, much of the potentialgain is lost. There is an urgent need for strong research and extensionprograms which unfortunately do not exist at present.
Coconuts
6.30 The Philippines is by far the largest producer and exporter ofcoconut products. In the last 10 years, copra production rose almost 50%,entirely due to expansion of the bearing area. Yields are among the highestin the world, a testimony more to the very favorable climatic and soilconditions for coconut which prevail in major producing areas of the Phil-ippines than to progressive practices and management. Coconut is ess~entiallya small holder enterprise, largely owner operated. Some 68% of coconut farmsare under 5 ha in size and only 1% are 16 ha and over.
6.31 Substantial regional shifts in production have occurred in 'thepast decade (Table 15).
Table 15: DISTRIBUTION OF COCONUT PRODUCTION
Region 1960 1970
Cagayan /1 /1C. Luzon 1 /1S. Tagalog 40 11Bicol 15 6E. Visayas 11 27W. Visayas 7 8S&W Mindanao 10 34N&E Mindanao 16 14
Total 100 100
/1 Less than 1%.
Source: BAEcon, DANR.
6.32 Most of the expansion in area was in E. Visayas and S&W Mindanao.Nut yields per tree were also highest, some 22% higher than the natiolnalaverage in the former and 57% higher in S&W Mindanao. Yields in 1970 weredamaged in S. Tagalog and Bicol by typhoons. The cadang-cadang disease isprevalent in Bicol and making headway in E. Visayas as well. There is aheavy incidence of old trees (over 60 years) in S. Tagalog (108,000 ha) andin W. Visayas (65,000 ha).

- 28 -
6.33 Overall, about 5% of coconut farms use fertilizer although in Davaoand Cotobato almost one third do. Where it has been used, yields aredoubled or more by the fifth year. However, partly because of the longperiod for trees to react to fertilizers, the principal gain will likelycome from its use on coconuts in connection with intercropping and improvedgrazing.
6.34 The Philippines will probably not lack for supplies in the comingdecade. The expansion of area in the 1960's more or less assures a con-tinued rise in production of 3% a year or more. In view of increasingsupplies of competitive oilseeds, finding outlets for larger supplies ofcopra may become more difficult except at lower prices. Unless costs ofproduction are substantially reduced and the quality of copra, which hascome into some disfavor, is significantly improved, the outlook is notoptimistic.
6.35 Programs of fertilization along with intercropping (and grazing)offer opportunities to increase yields and lower production costs on manyplantations. A major impact over the longer run would flow from a programto rejuvenate the old areas in S. Tagalog and W. Visayas. (The costsof rejuvenating and interplanting a coconut plantation are shown in detailin Annex 12, Appendix B.) Some form of income support would be necessaryuntil new plantings come into production, even though replantings are spacedout over 7 years or so.
6.36 The traditional system for making copra results in uneven drying,high humidity and high free fatty acid contents which stimulate molds,attracts insects and makes the copra susceptible to aflotoxin contamination.Simple, inexpensive copra-drying installations which produce good qualitycopra are used in other countries and could be used in the Philippines.In view of the larger number of smallholders involved, cooperatives maybe the appropriate instrument to operate copra kilns, monitor quality andmarket the copra for individual members.
Rubber
6.37 There are some prospects for rubber as a smallholder crop in thePhilippines although the price outlook in export markets is not optimistic.The area in rubber is now expanding rapidly from a very small base and in1972 is estimated to be at least 29,000 ha. An important part of theincrease has come in smallholder enterprises in the Makilala district ofNorth Cotobato. Recent yields average about 900 kg/ha which compares veryfavorably with yields of Malaysian smallholders. Apparently this is due tothe introduction of high yielding clones in the early 1960's. So farexperiments have not indicated significant results from fertilizing.
6.38 The Development Bank of the Philippines provides financing forsmallholders with the first payment due in the eighth year after planting(after the trees have been tapped two years). In the initial stage onlypart of the land is put in rubber with the rest reserved for subsistence

- 29 -
farming until the rubber comes into production. In the Makilala dist:rict,most farmers can finance the planting of additional rubber area with theproceeds from the first planted rubber.
6.39 Apparently there are considerable areas which could be broughtinto rubber. The Makilala area has about 56,000 ha of suitable soils. Theprovince of Bukidnon and Agusan contain 139,000 ha and 59,000 ha respective-ly of the same soils, about 90,000 ha of similar soils are present in Coto-bato. Others, no doubt, can be identified as well. Presently, smallholderrubber is purchased and processed in factories of the larger estates. As theexpansion of smallholders continues, the establishment of processing andmarketing cooperatives will likely provide opportunities to increase theirtotal return from the crop.
Abaca
6.40 Some 25 years ago, over 500,000 ha were planted to abaca. Sincethen, with better returns from other crops, increasing competition fromsynthetics and other fibers and heavy damage by mosaic disease, the abacaarea has declined to 155,000 ha.
6.41 In the last year or so, prices have firmed up, partly due to renewedinterest in abaca fiber for the pulp and paper industry, particularly forhigh quality stripped fiber. Stripping is a very difficult task unlessdone with stripping machines several of which may be attached to one powerplant such as a diesel or gasoline engine. Thus, this process lends someattraction for smallholders who can organize into some cooperative form.While Bicol and Visayas have traditionally been the main source of abaca,yields and net returns are much higher in Davao (Mindanao), where soilsand climatic conditions are better.
6.42 Demand as yet is still limited and large scale development wouldbe inappropriate for the time being.
Bananas
6.43 A thriving export trade has developed to Japan. Bananas aresubstantially large enterprises which tie in small growers as well bycontractual arrangements for inputs, technical assistance, and marketservices.
6.44 This industry operates with high technology and efficiency. Butthe scope for further rapid expansion in the Japanese market may be limitedby increasing competition from other suppliers.
Cashew
6.45 Although a cashew development program has been established, thereis as yet little information on which to base its potential. The programprojects average yields of 1.5 ton/ha which appear over optimistic. Trialsshould be conducted before large scale plantings are undertaken to ensurethat suitable soils and climatic conditions are available in the selected

- 30 -
areas. Further, there is need for a selection program to identify thebest performing varieties. In view of current limited cashew production, itwould be well to delay heavy investment in processing equipment until theprospects for volume production are clearer. In the meantime, raw nuts couldbe exported to India where there is ample processing capacity and a shortageof nuts.
B. Livestock
6.46 As might be expected, the livestock subsector as a whole has notexpanded as fast as the rest of agriculture. The subsector contributed 17%of value added (in constant prices) in the agricultural sector in 1970 com-pared with 23% a decade earlier. Per capita consumption of fresh meat (asdistinct from fish) declined some 10% during the 10 year period 1/. However,fairly sharp gains were recorded for eggs and for milk, the latter verylargely from imports of dry skim milk and powdered whole milk.
6.47 Total demand for meat is projected to rise some 80% by 1980reflecting population growth and the effect of rising consumer incomes.Concurrently, the demand for eggs and the demand for milk are projected torise about 65%. Government production targets in the current agriculturaldevelopment program (FY 1972-75) are generally consistent with the longerrun requirements. For the immediate years ahead, government places priorityon poultry and pigs (pork accounts for 60% of total meat consumption) asthe most rapid way of increasing the meat supply. These industries havemodernized and expanded rapidly in recent years while beef output hascontinued more or less unchanged and remains characterized by inefficientland use and poor management.
Pigs
6.48 The prospects for continued rapid expansion in pork productionare quite favorable. Commercial piggeries, which range up to 2,000 sows andare highly efficient, now account for about 10% of pork output and arerapidly increasing their share. Even so, there is room for many smallerproducers with units of 25 sows and over, if they are provided credit andtechnical assistance.
6.49 However, the potential for expansion of the pig industry (andof poultry as well) will not be realized without an adequate feed base.The current feed shortage has required substantial imports of yellow cornfrom the U.S. under PL 480. Furthermore while mill by-products now providesome 80% of the grain component in concentrate feeds, by 1980 they will
1/ The official figures are much lower than data from 1971 food consumptionsurveys undertaken by U.P. College of Agriculture.

- 31 -
likely have the capability of supplying less than 50% of the larger grainrequirements (Annex 4, Table 17). Corn or its equivalent will be neededto make up the deficit. Thus, the development of corn (and sorghum)production is an integral part of expanding livestock programs.
6.50 It would be well to locate pig enterprises in those areas whereyellow corn and sorghum are developed. The plains of southern Cotabaitowould appear to offer opportunity in this respect. Mindanao normallyproduces about four times its own needs of corn and ships most to Manilaor Cebu mills. Prices are low and frequently depressed because oftransportation difficulties, especially in times of favorable harvests.On the other hand, local pig growers have difficulty in obtaining cornbetween harvests due to lack of storage facilities. The establishment ofthe pig industry in the Cagayan Valley in northeast Luzon, also suitablefor corn production, would provide another dimension to that area'sdevelopment.
Poultry and Eggs
6.51 Commercial production of broilers and eggs has reached a h;Lghstage of development. Commercial broiler output accounts for about 30%of the nations poultry meat and specialized production units supply about75% of the eggs. The trend is toward large units, contract productionand integration of services under centralized management. At the cernteris the feed industry, a highly competitive business which depends onlarge volume and narrow margins. Experience in other countries, whichapparently is being repeated in the Philippines, is that integrated firmsrapidly dominate the poultry meat and egg market, and that independentgrowers need to secure a contractual arrangement with a firm in order tomarket output. This need not work to the disadvantage of the small producerif he can be assured technical assistance, dependable supply of quality in-puts, and market security. It is doubtful that the alternative of producercooperatives in the Philippine setting would have the management and scaleof operations to compete successfully.
Carabao and Cattle
6.52 The plan target of 6% annual increase in beef production is notlikely to be realized. Some two-thirds of the nation's beef supply comesfrom carabao (water buffalo), primarily a work animal for small farmers.Significant increases from cattle in the next few years could come onlyfrom depletion of cattle inventories and thus, at the expense of productionthereafter. Nevertheless there is a large, latent potential to developa viable cattle industry not only to meet internal demand but also toparticipate in export trade. The Philippines is free of hoof and mouthdisease. in the Visayas and Mindanao regions.
6.53 Cattle ranching in the Philippines is carried out under conditionswhich are not conducive to investment in pasture improvement and equipmentfor improved efficiency. Prior to Presidential Decree No. 7, ranchersoperated on Government-owned land under pasture permits or lease agreementswhich lacked assurance of renewal and usually were not recognized as collateral

- 32 -
for credit. Thus, few cattle ranchers were in a position to adopt bettertechniques. Under the decree, leases will be long-term (25-50 years) andwill be considered as collateral for medium- and long-term loans fordevelopment. There are a number of corporations operating large holdings(up to 10,000-15,000 ha) which are well managed and equipped. Frequently,these also operate other crop or agri-business enterprises which share over-head costs.
6.54 Increases in beef supply will be produced primarily from grass,cultivated forages and waste products from other agricultural enterprises,such as the sugar industry. As population pressures increase, cattleenterprises are likely to be pushed toward steeper and less productiveareas. The need for revision of leasing and credit arrangements to provideincentives for improving productivity of hill grasslands will become evenmore urgent. For this, research on managing and improving hill pasturesis needed. Limited research findings so far have provided a set of interimpasture recommendations. Some 30 pasture extension technicians have beenfielded by the Bureau of Animal Husbandry.
6.55 The practice of grazing cattle under coconuts may well representone of the best potentials for increasing the beef supply. There are some1.8 million ha of coconut plantings. Generally, little fertilizer is usedand the grass undercover has a capacity of only 1/2 to 1 animals per ha.It has been demonstrated that fertilizer applications of 250 to 500 kg/ha peryear not only increase the carrying capacity of some grasses to 2-4 animalsper ha but also increases production of nuts as well.
6.56 Some 40% of commercial coconut area is located in Mindanao and20% in Eastern Visayas. Both regions have areas of favorable rainfalldistribution for grass and legumes, and extensive ranching on naturalgrasslands, which could provide weaners for the coconut growers.
6.57 Negros also has a good potential for cattle production inconjunction with the sugar industry. Considerable marginal sugar landscould be used more profitably in intensive beef production. The soils areamong the best in the Philippines for improved pasture development. Onesugar grower is carrying up to 7 animals per ha on fertilized African Stargrass with overhead irrigation during the dry season. In addition, by-products of the sugar industry could be used for fattening yearlings beforemarketing.
Dairy
6.58 The limited demand for fresh milk and high costs of productionoffer little opportunity for expansion of commercial dairy units. Over

- 33 -
90% of total milk consumed is in the form of canned milk (filled 1/, recon-stituted 2/ or condensed), largely manufactured from imported ingredients.Prices of locally produced milk are much too high to be used in theseproducts, which are widely accepted and provide a relatively cheap sourceof milk proteins. Government policy to encourage local manufacture ratherthan imports of the final products has brought significan,t savings oifforeign exchange. Although it may be, as the Bureau of Animal Industryestimates, that the current population of female carabaos could physicallysupply the nation's milk requirements, the practical problem of coliectingmilk from owners of 1-3 carabao scattered over the islands is a majorlimiting factor.
C. Fisheries
6.59 There is a pressing need to expand fish output. Although thefish catch more than doubled in the past decade (Table 16), domesticdemand outpaced supply. Retail prices of fish, which is the principal sourceof animal protein in the Philippine diet, rose faster than other foods.
6.60 The marine catch represents some 90% of the total with the remain-der from fishponds, mostly of brackish water (Table 16).
Table 16: FISH PRODUCTION AND GROWTH RATES
1970 Average Growth RatesCategory Production 1965-70
('000 tons) %
Marine, Municipal 382 4.9Marine, Commercial 511 10.9 /1Fishponds 96 8.8
Total 989 8.2
Source: Philippines Fisheries Commission.
/1 It is unlikely that this high rate of increasewas realized. Much of the increase was recordedin 1968, when apparently there was improvementin the collection of data.
6.61 Municipal, or subsistence, fishing involving small traditionalcraft (bancas) usually non-mechanized, operating close to shore stil:L supply
1/ "Filled milk" is reconstituted skim milk powder with vegetable oiladded.
2/ Reconstituted skim milk powder with butterfat added.

- 34 -
most of fish production. It is estimated that some 500,000 fishermen engagein this activity although many also work in logging and farming. Thus,output averages about 1 ton per fisherman although with motorized bancasthe average catch is about doubled. Perhaps one-sixth of the bancas arepresently motorized.
6.62 The rate of increase in commercial catch has slowed appreciablysince 1965. In fact, the catch of commercial fishing vessels in 1969 and1970 was below that of 1968, although the tonnage of the commercial fleetcontinued to increase. There are some 31,000 fishermen employed in com-mercial fishing, only slightly more than in 1965, averaging over 12 tonscatch per fisherman. Almost all commercial fishing takes place in theterritorial waters of the Philippines, which while covering an extensivearea, contain limited shallow areas which are more suitable for fishing.
6.63 The increase in fishpond output of about 50% during the past 5years reflected about equally expansion of area and improved yields. Althoughyields of pond milkfish approaching 600 kg/ha in the Philippines are twicethe average yields in Indonesia, they are still far below the 2,000 kg/haobtained in Taiwan where advanced techniques of fertilization, supplementalfeed and intensive management of fish populations are commonly practiced.
Development Strategy
6.64 By 1980, domestic demand for fish is projected to increase about60%, or some 600,000 tons, over 1970. It appears quite unlikely that marinefisheries which provided over 90% of the increase in production during the1960's can contribute as much in the 1970's. The municipal catch appearsto be approaching its potential limit. Catches in many commercial fishinggrounds around Luzon are recording declines, although those off Mindanaocontinue to increase. The potential for further rapid expansion of commercialfishing would appear to be in extension of activities into more remote fish-ing areas of the Sulu Sea, the Northern Celebes Sea and the South China Sea.But in view of fairly intensive fishing by other nationals in these waters,the prospects for the Philippines are quite uncertain.
6.65 The clearest potential for meeting a major part of demands in the1970's appears to be in improving and extending fish farming as rapidlyas possible. It is quite realistic to look for a doubling of yields perhectare in this decade from the technology of fishpond production whichhas been demonstrated in Taiwan and research conducted in the Philippines.Soil, water and climatic conditions of Philippine ponds are extremely favor-able to growth of milkfish and its natural food organisms. Experiments oncatfish in fresh water ponds have yielded as well as milkfish in brackishwater. At the same time, there are some 500,000 ha of mangrove and swamplands available for development which provide a base for expansion of thepresent area of 168,000 ha. Large swamp areas are available in Mindanao,Samar, Bohol and Palawan, thus affording substantial opportunities for morebalanced regional development. It is recognized that many of these swampareas have Very limited access, and a coordinated program of roads andmarket facilities would be required.

- .35 -
6.66 Nor should the commercial fishing fleet be neglected. Most ofthe vessels are over 10 years old and the need for replacement as well asimprovement of existing vessels with modern equipment and machinery isbecoming pressing. Further, experimental exploitation of more distarntfishing grounds will require the addition of some modern larger vessels.
6.67 Some 70% of the commercial catch is landed at Navotas, near Manila.This is being improved as a fishing port and market with full facilitiesunder a loan by the Asian Development Bank. The needs for ports and marketfacilities elsewhere, particularly in the Southern reaches, already pressing,will become more urgent with rising production and demand.
Conflict between Municipal and Commercial Fishing
6.68 Although commercial vessels are licensed by the PhilippinesFisheries Commission to fish beyond the 3-mile limit, there is considerablecrossover into near shore waters reserved for municipal fishermen. In fact,Z. Russek 1/ estimates that 40-45% of the commercial catch comes frPm thesewaters. Enlargement of the commercial fleet could have serious adverseeffects on the small fishermen unless commercial activity in coastaliwatersis progressively limited. By the same token, such action would make roomfor more municipal fishermen or, conversely, by widespread mechanization ofbancas, improve the catch and incomes of those presently engaged.
Trade Deficit
6.69 In 1971, there was a net trade deficit of about US$16 millionrepresenting less than 4% of the total fish supply. Most of the importsare canned mackerel from Japan and fishmeal from Peru which up to now havebeen available at prices low enough to discourage domestic competition. Ifthis situation should be changed, as perhaps might result from risinglabor costs in Japan and from continued interruption of the Peruvian catch,the potential for import substitutions would be enhanced, although in thecase of fishmeal, the availability of other animal protein feeds would bea limiting factor.
D. Forestry
6.70 There are some 14 million ha of productive or commercial forestlands in the Philippines. Almost all are dipterocarp forests, predominantlyof the lauan, or Philippine Mahogany group, which is highly prized inexport markets. The Bureau of Forestry estimates that the commercialforests contain almost 2 billion cu m of sound wood, of which some 11.3billion cu m are in old growth dipterocarps. More than half of the oldgrowths are in Mindanao and almost 30% in Luzon.
1/ FAO/UNDP/SF Deep Sea Fishing Development Project.

- 36 -
6.71 Most of the commercial forest area is under license for timbercutting, although not all are being exploited actively (log production isonly two-thirds of the allowable cut). Some areas in the Sierra Madremountains in northeast Luzon, which are presently inaccessible, are still tobe developed.
6.72 Although production of logs rose rapidly from 6.3 million cu min 1960 to 11.1 million cu m in 1968, it has been essentially stable sincethen (Statistical Annex Table 3.2). 1/ The largest increase occurred inMindanao, which now accounts for about 75% of the total cut. In view ofthe large forest resources available, it is evident that under improvedmanagement and practices, production could be increased substantiallywithout jeopardizing the resource base.
6.73 Some 80% of logs produced are exported, almost all to Japan.Increasing competition for that market has come from Malaysia and morerecently from Indonesia, where substantial Japanese investments in loggingoperations have been made and which is now the largest supplier to Japan.C.I.F. prices for logs from Malaysia and from Indonesia particularly runconsistently below those from the Philippines, although the differentialshave narrowed appreciably in recent years.
6.74 Wood processing operations are still quite small. The Philippinelumber industry is primarily oriented to the domestic market and operateswell below capacity. Production of plywood has not changed much in thepast 5 years and that of veneer dropped sharply. These are largely forexport to the U.S.
6.75 Although the nation is well endowed with wood materials, it isincurring an increasing import deficit in pulp and waste paper. In 1970,some 60,000 tons valued at US$7.5 million were imported as compared withabout 24,000 tons valued at US$3.4 million in 1965. Paper use per capitais relatively low and so far insufficient to support an economic sizemill.
Public Forest Management
6.76 Management and control of the forests have been unsatisfactory butthe situation is likely to improve as a result of recent actions by theGovernment. The commercial forest land area has been reduced about 200,000ha a year partly from the legitimate release of land designated as suitablefor agricultural use but largely from illegal logging operations and theinroads of squatters (kaingineros) who engage in shifting cultivation. Muchof the illegal activity has taken place on lands which, because of steepslopes or other characteristics, should best be left in trees. The resultshave been denuded lands, heavy runoff problems and soil erosion, particularlynoticeable in Central Luzon, and large areas taken over by the useless cogongrass which is difficult to eradicate. It should be noted that some 1.4
1/ Production and exports of logs declined in 1972 reflecting economicrecession in Japan.

- 37 -
million ha of important watershed lands are critically degraded, with re-planting averaging less than 10,000 ha a year in the past decade.
6.77 Under the new Forestry Reform Code, all lands of 18% slope or morewhich have not been titled are declared in the Permanent Forest or ForestReserve. Further inroads of kainging are prohibited and activities of presentsquatters on these slope lands will be controlled to avoid further damagefrom shifting cultivation. Whereas formerly three agencies sharedresponsibility for implementation of control regulations, these have beenconsolidated into a new Bureau of Forestry Development with broad authorityover forest programs.
6.78 This is not to say that the entire public forest area should bepreserved. This would be unrealistic in the Philippine context of consider-able population pressure on land. But there is need to promote efficientland use and to reserve under proper forest management the most productiveareas encompassing some 8.5-9 million ha. So far, only 4.9 million ha havebeen classified as a forest reserve, although almost 4 million ha more hasbeen identified as meeting the criteria for permanent forest land.
Allowable Cut
6.79 As a rule of thumb, the allowable cut for lauan stands has beenestablished at 1% of the standing volume, or I to 1.5 cu m/ha per year.Some evidence is accumulating from experience in Mindanao that net growthrates of 3-5 and sometimes up to 7 cu m/ha per year are quite typical.Although this would need to be verified by further research, there appearsto be a potential, with careful thinnings in which pulpwood is removed,to produce stands of nearly purely lauans with a commercial log volume ofabout 150 cu m/ha in less than 40 years. Under such extensive management,it would be possible to increase the allowable cut.
Licensing Policy
6.80 Government licensing policy has an important bearing on the effectiveuse of the forests and the costs of production. Large-scale operators underlicense agreements running 10-25 years, which presently account for aboutone-third of the licensed area and half of output, cut over 90% of the allowedcut whereas the performance of smaller and shorter term licensees falls con-siderably below. Costs of production of logs to shipboard under large scaleoperations are estimated to be 25-30% less than under average sized operationseither in the Philippines or in Indonesia (Annex 2 Table 13). This is animportant consideration in meeting the increasing competition from Indonesia.Government has recently terminated or suspended activities of most short-termlicensees and declared its intention to convert most into long-termlleasesof up to 25 years in order to provide incentive for more effective use andprotection of the forests.
Integrated Wood Industries
6.81 Under present conditions, it is more profitable to export logs toJapan than to process them in the Philippines for export, thus foregoing the

- 38 -
benefits of employment and income that might accrue from the latter course.Although tariffs on processed products and shipping costs are limiting factors,the essential fact is that Japan's wood industries have the capability ofusing all of the wood, including mill wastes, whereas the Philippines industry,which is quite small and scattered, does not. Thus, Japan's industry canafford to pay generally higher prices for logs than the industries of thePhilippines. While some progress was made in exporting plywood and veneer tothe U.S. in earlier years, since 1968 they have declined. In order for thePhilippines to compete more effectively in world markets for wood products,an important pre-condition would be the establishment of an array of woodindustries in close proximity, which would include as well as reconstitutedboard manufactures and pulp mills.
6.82 The Bureau of Forestry has been studying the potential ofestablishing a wood processing and export center to handle approximately1 mil cu m of wood annually at Casiguran Sound in Northeast Luzon, an areaof unexploited virgin forests. However, the prevalence of typhoons whichwould make shipping hazardous for about 6 months a year represents a consider-able deterrent to such development. Other possibilities for such centers arein Mindanao where most forest activities take place and where some infra-structure exists.
6.83 Expansion of wood processing for export should not be viewed as asubstitute for the important Japanese market for logs which is quite profit-able, but rather as a supplementary activity to provide an outlet for addi-tional production that can be forthcoming from the forests.
Pulpwood, Pulp and Paper
6.84 Perhaps the most promising new prospects for wood materials are inthe pulpwood and pulp industry, not merely for import substitution and meet-ing domestic demands for paper products, which have more than doubled inthe past decade, but more important as an export for which there is strongworldwide demand. In particular, Japan's consumption of paper products hasincreased 12-13% a year in the past 20 years. It is estimated that Japaneseimport needs for pulpwood will be more than twice as large in 1975 as in1969 and more than 5 times larger by 1985. 1/ In the latter year it isfurther estimated that the traditional suppliers of pulpwood to Japan wouldfall short of meeting her requirements for pulpwood by some 16 mil cu m.
1/ Unpublished report of Tuolumne Corporation, 1971.

- 39 -
6.85 The Philippines is in a favorable position to exploit such opportun-ities. Major technical advances have resulted in a rapid increase in theuse of some hardwoods in many paper products. Further, current harvestingpractices discard young growth and softwoods that are suitable for pullping.But to become a major supplier, plantations of fast-growing species (7-15years) - abizza, eucalyptus and pine - should be established. Much of thecut over lands which are unsuitable for cultivation would be best used forthis purpose. The mission estimates that the Philippines has the enormouspotential of producing about 50 mil cu m of pulpwood a year, which could welllead to a dominant position in world export markets.
6.86 Five or six years hence, demand for pulp and paper in thePhilippines is expected to exceed domestic supply by some 200,000 tonls.This would provide immediate opportunity for 1 or 2 economic sized mills,which might well become part of an integrated wood processing center asnoted previously.

- 40 -
VII. SUPPORTING SERVICES
A. Research, Extension, Administration and Credit
Research
7.01 On the whole, the Philippines is building a competent researchestablishment. Its Bureau of Agricultural Economics (BAEcon) is developingincreasing competence to provide data and analyses for agricultural policydecision-makers. The research institutions are well-advanced in HYV riceand quite recently in corn for which downy mildew resistant varieties havebeen developed. Research on sugarcane has had a long and generally fruitfulhistory but varieties resistant to the ratoon stunting disease have not yetbeen developed. Other research is less impressive, particularly for coconuton which the cadang-cadang disease is making substantial inroads. Researchon sorghum and soybeans has not yet had time to make a large contributionto development of a feed base.
7.02 The research community is scattered among various bureaus of theDepartment of Agriculture and Natural Resources (DANR), and universities,and beyond that to numerous independent commodity institutions more or lessgoing their own ways. This has not been conducive to coordination and thecross flow of information or to determining the appropriate priorities andemphasis on research. The recent formation of the Philippine Council forAgricultural Research chaired by the Secretary DANR is an important steptoward correcting these deficiencies.
Extension
7.03 More effective extension services for agriculture and water manage-ment will be required if resource productivity is to be significantly improved.This is of critical importance in the land reform program. Extension activi-ties have been even less satisfactory than research both in manpower andeffectiveness. The mainstream of extension, the Agricultural ProductivityCommission (APC), which was formerly an independent agency, has only recentlybeen integrated as the Bureau of Extension (BAEX) into DANR and the research-base. However, the Department of Agrarian Affairs (DAR) responsible for landreform and land settlement still maintains an extension service in the landreform area which now encompasses much of the nation. Overall, there is aratio of 1 extension worker to perhaps 1,400 farmers, but an extensionagent can hardly deal effectively with more than one-third of that numberand for tenants under land reform more nearly 1 to 200. While it is urgentto expand the supply of trained extension workers severalfold, there is alsothe need to bring extension activities together within the DANR.
Administration
7.04 Until recent administrative reforms authorized by PresidentialDecree No. 1, the problem of fragmented and scattered authorities pervaded

- 41 -
much of the management of agricultural development (see Figure 7018 forthe situation pre-decree). DANR has been strengthened in several particularsto provide for wider authority and more effective coordination and administra-tion of programs. These relate most notably to activities in forestry,fisheries, and livestock development; the transfer of the National GrainAdministration (formerly Rice and Corn Administration) under DANR supervisionas well as the Philippines Virginia Tobacco Administration both of whiich wereformerly independent agencies; and the actions taken with respect toresearch and extension mentioned above.
Credit
7.05 Constraints in agricultural credit represents a formidableobstacle to agricultural development. Not only has the supply of creditbeen inadequate to finance production inputs and farm development but somefunds normally directed to agricultural activities have been diverted toother sectors of the economy. Further, institutional credit has beenreserved for larger commercial operations while the great bulk of smallholdersand tenants (the three-fourths of all farmers with less than 3 ha) have hadto rely heavily on moneylenders and other non-institutional sources.
Table 17: NEW AGRICULTURAL LOANS, 1969-71(billion pesos)
Credit for: 1969 1970 1971
Production 1.9 2.5 2.9Marketing 1.3 2.3 2.8
Total 3.2 4.8 5.7
Production loans as % ofAgriculture NDP 19 21 20
Source: Ad Hoc Committee on Agricultural Credit,1972.
7.06 New production credit from institutional sources has more or lesskept pace with the rise in Agricultural Net Product but still finances only20 percent of such product (Table 17). Even this may be an overstatlementsince new loans also include renewals. The mission estimates that, as ofthe end of 1971, agricultural loans outstanding for both production andmarketing totalled 3.4 billion pesos compared with 3.3 billion at the endof 1970 (Table 18). In view of the rise in prices during 1971 of solme 15percent, credit outstanding declined substantially in real terms.

- 42 -
Table 18: AGRICULTURAL LOANS OUTSTANDING, 1970 AND 1971(million pesos)
Source Dec. 31, 1970 Dec. 31, 1971
Philippine National Bank 973 989Other Commercial Banks 1,274 1,221Development Bank Philippines 396 396Private Development Banks 82 86Rural Banks 502 601Agricultural Credit Administration 54 65
Total 3,281 3,358
Source: Mission estimates.
7.07 Most production credit is granted by rural banks (whose clienteleis prescribed to be farmers with 50 ha or less) and the Philippine NationalBank (the latter the main source of credit for sugar planters). The Agricul-tural Credit Administration, a government agency to provide credit to smallfarmers in land reform areas, accounted for only about 1% of total productioncredit in 1971. Most credit for marketing is provided by the Government-owned Philippine National Bank (PNB) and privately owned commercial banks.Longer-term loans have come largely from the government Development Bank ofthe Philippines (DBP), which also makes funds available to the private develop-ment banks. Altogether longer-term credit from these institutions accountedfor less than 15% of credit outstanding at the end of 1971, a fairly lowlevel for investment in farm improvements.
7.08 The demand for institutional agricultural credit is expected to riserapidly for several reasons. First, spread of HYV technology will requireincreasing expenditures for production inputs, particularly fertilizers.At present, perhaps only 30% of the riceland is fertilized and very littleof cornland is so treated. Together these crops, 3.1 million ha of rice and2.4 million ha of corn, account for more than half of all cropped land inthe nation. Second, the land reform program, which is expected to convertinto owners perhaps as many as a million tenants on 1.8 million ha of riceand cornland, will create an additional need for credit, partly to supplantcredit previously furnished by the landlord, but also for capital improvementsto enhance productivity. Third, long-term development loans will also beneeded especially to exploit the large potentials for smallholder fishponds,cattle enterprises and tree farming.
7.09 Following the Presidential Decree on land reform, Government movedto strengthen the financial resources of the major credit institutionsand to make them more responsive to the needs of smallholders. It isestimated that to provide the production credit needs of the land reformprogram will require expansion of production credit of. about r 350 millionover the next 4 or 5 years. This will place a considerable additional

- 43 -
burden on the private rural banking system, the main source of such creditto smallholders. In 1972, rural banks granted total agricultural loans ofabout 0 725 million.
7.10 Moreover, rural banks have had few dealings with sharecroppers,who generally lacked collateral security. It is recognized that to servicethe new owners will likely involve higher risks than the rural banks havefaced heretofore. Thus, the rural banks have been authorized rediscountingprivileges of 100%, Government guarantees of 85% of the loans made, and low-cost money from the Central Bank (1%) providing the loans are supervised byagricultural technicians.
7.11 Despite fairly rapid expansion, rural banks do not yet providegeographic coverage of the nation. Of some 600 banks, two-thirds are inLuzon while coverage of other islands is quite sparse. PNB is also planningto extend branches to areas whick lack credit facilities, particularly inMindanao. DBP is also expanding its activities. Additional financialresources have been provided to both PNB and DBP.
7.12 Government plans to rely primarily on these institutions - ruralbanks, PNB and DBP - to provide short and longer-term investment creditunder the land reform program rather than on the Agricultural CreditAdministration (ACA), which in addition to cooperative marketing functionshas provided credit to cooperatives and members of cooperatives, particularlyin areas with land reform programs. This decision reflects the poorperformance of ACA relative to rural banks in collection of loans. During1964-71, collections amounted to only 64% of releases; collections fromproduction loans associated with land reform were only about 40% ofreleases.
7.13 An Agrarian Reform Fund, established by Presidential Decree No.85, will finance and/or guarantee payment to landowners for farms acqluiredby tenants as well as guarantee production loans. The Fund has resources ofabout r 2 billion, consisting of securities held by the Central Bank, Govern-ment guarantee funds provided by earlier appropriations, real estate, sharesof stocks of private corporations and other assets of Government controlledfinancial institutions, and peso proceeds of foreign loans. Governmeintexpects a high rate of default in the initial years of the program, arndconsequently a considerable drain on the fund.
7.14 The Land reform program will place heavy operational strain onthe institutions entrusted to provide credit support to the program,particularly the rural banks. A rapid expansion in banking facilities toareas which are inadequately served, if at all, and in the training ofcompetent technicians for credit supervision will be required in order toimprove productivity of the former tenants and minimize defaults on lpans.

- 44 -
B. Land Reform and Settlement
Land Reform
7.15 Share tenants make up perhaps 40% of all farmers in the Philippines;most are engaged in rice and corn production. As a group they rank among thepoorest in the nation. Since 1963, the expressed intent of government hasbeen to convert them into owner-cultivators on economic family - size farms.On the whole land reform and land settlement programs have made very limitedprogress toward this end. By 1971, little more than 50,000 share croppers,only 5% or so of the total, had been converted to lease holders with securetenure on the farms they cultivated and more favorable crop sharing arrange-ments, which increased their incomes although farm productivity was much thesame as under share cropping. 1/ This was the first stage of the program.The second stage of full-ownership has been accorded to only about 3,400 farmfamilies (including those pending court approval). There has been littleconsolidation of holdings into "economic - size" farms.
7.16 Following the declaration of martial law, President Marcos issuedPresidential Decree No. 27 on October 21, 1972, extracts of which arereproduced below:
"This shall apply to tenant farmers of private agriculturallands primarily devoted to rice and corn under a system ofsharecrop or lease-tenancy, whether classified as landedestate or not;
The tenant farmer, whether in land classified as landedestate or not, shall be deemed owner of a portion constitut-ing a family-size farm of five (5) hectares if not irrigatedand three (3) hectares if irrigated;
In all cases, the landowner may retain an area of not morethan seven (7) hectares if such landowner is cultivatingsuch area or will now cultivate it;
For the purpose of determining the cost of the land to betransferred to the tenant-farmer pursuant to this Decree,the value of the land shall be equivalent to two and one-half(2-1/2) times the average harvest of three normal crop yearsimmediately preceding the promulgation of this Decree;
The total cost of the land, including interest at the rate ofsix (6) percent per annum, shall be paid by the tenant infifteen (15) years of fifteen (15) equal annual amortizations;
1/ P. R. Sandoval and B. V. Gaon "An Economic Analysis of the Effects of LandReform in Selected Areas in the Philippines", unpublished data, 1972.

- 45 -
In case of default, the amortizations due shall be paid bythe farmers' cooperative in which the defaulting tenant-faiimeris a worker, with the cooperative having the right of recourseagainst him;
The government shall guarantee such amortizations with sharesof stock in government-owned and government-controlledcorporations;
No title to the land owned by the tenant-farmers under thisDecree shall be actually issued to a tenant-farmer unlessand until the tenant-farmer has become a full-pledged memberof a duly recognized farmers' cooperative;
Title to land acquired pursuant to this Decree or the LandReform Program of the Government shall not be transferableexcept by hereditary succession or to the Government inaccordance with the provisions of this Decree, the Code ofAgrarian Reforms and other existing laws and regulations;
The Department of Agrarian Reform through its Secretary ishereby empowered to promulgate rules and regulations for theimplementation of this Decree."
7.17 At the time, this report was prepared, the development of the programwas at an early stage and handicapped by lack of data on the numbers oftenants and landlords, and the size distribution and location of their holdings.It was estimated that there are about one million tenants on approximately1.8 million ha of rice and corn lands held by some 350,000 landlords. It isalso believed that about 80% of the landlords have holdings of less than 7ha. If this latter group is exempted, a large number of the share tenantswould not be under the program. Further, the exemption of all non-tenantedrice and corn land would place outside of the program an area larger than thetenanted area, although again these lands appear to be largely in smallholdings and the extent to which these are in larger owner-operated unitsis not known. 1/ Thus, the Decree, narrowly interpreted would appear tooffer little opportunity for land redistribution or to enlarge the silze oftenant holdings which now average about 1.8 ha.
7.18 In any case, there is not enough rice and corn land to satisfythe criteria of economic farm units of 3 ha of irrigated land or 5 ha ofnon-irrigated land for all farms whether owner-operated or tenanted. Thetotal number of rice and corn farmers probably exceeds 2 million whereasthe total of rice and corn lands is not much more than 4 million ha,'ofwhich considerably less than 1 million ha are irrigated. While these criteriado not appear to be attainable, it should be voted that rice and corn yields
1/ Landowners holding 100 ha or more have been directed to report theirholdings by January 31, 1973, and those with lesser holdings by June30, 1973.

- 46 -
are low and there is a large potential to increase production on presentsmall holdings from HYV technology, expansion of irrigation and dry seasoncropping. In view of the slim prospects for affecting much in the way oflarger sized units, the main priority for land reform appears to be inimproving the situation for tenants on lands which they presently occupy,although programs of land redistribution and new land settlements can helpalleviate to some extent the situation for those with very small holdings.
7.19 Even if the land reform program is substantially limited overthe next 4 or 5 years to transforming present tenants into owner-cultivators,the administrative and financial capacity of the Philippine government willbe severely tested. To identify tenants, conduct the necessary landsurveys, determine the cooperatives (in which membership has been made aprecondition for a certificate of title to be issued) will require a sharpexpansion of government manpower concerned with these activities. Nor, asthe government recognized, will it be enough to provide land titles withoutproviding the means for the new owner to improve productivity of his holding.This will require production credit, partly to supplant that previouslysupplied by the landlord, effectively supervised to ensure its appropriateuse and a large component of technical advisory extension services which mayrequire perhaps 1 extension technician for 200 farms whereas the overallratio for all farms in the Philippines is at present on the order of 1 to1,400 and the ratio for share tenants even more inadequate. Moreover theinfrastructure program in land reform areas, particularly irrigation, ruralroads and market facilities where these are inadequate, will need to besubstantially accelerated.
7.20 Presidential Decree No 85 dated December 24, 1972 established anAgrarian Reform Fund of some 1 2 billion of government assets and guaranteefunds to finance and guarantee payment to landowners for land acquired bytenants as well as to guarantee lands to former tenants for productionpurposes made by credit institutions, primarily the rural banks but also byother institutions where rural bank services are not available or inadequate.
7.21 Preliminary plans of government are to offer landowners severalpayment options:
(a) Straight 15-year payment at 6% interest. The AgrarianReform Fund will guarantee payment in the event the tenantdefaults;
(b) Cash payment of 10% and balance in 25-year tax free bonds at6% interest;
(c) An annuity of up to 15 years at which time the full purchaseprice is paid. An insurance feature provides for immediatepayment in the event of death of the landlord within thefirst 7 years. In the event of death of the tenant, optionalinsurance could provide relief for his heirs;

- 47 -
(d) A leasehold plan similar to the existing program;
(e) Exchange for shares in portfolio of assets held by the AgrarianReform Fund.
7.22 Based on experience with loans made by the Agricultural CreditAdministration in land reform areas, government anticipates fairly highrates of default at least in the first few years of the program. Requirements for credit on the Agrarian Reform Fund for transfer of all tenantedland area expected to total some r 1.2 billion within the next 5 years.Production credit extended by rural banks and other institutions for tenantedlands is projected to require expansion of 1 350 millions of institutionalcredit by the fifth year, again with high default rates anticipated in theinitial years. In the event of continued defaults other than by reasons offorces beyond the control of the tenant, production credit will be cut off andgovernment will take over the land. W4hether high default rates actuallymaterialize will depend substantially on the effectiveness of the support-ing services of supervised credit and advisory extension activities.
Land Settlement
7.23 By 1972, organized land settlement had covered only about 26,000families, most of whom were already squatters on the land. Experienc:e withland settlements has not been satisfactory, largely a result of limitedsupporting services provided by government and because of location inremote areas difficulties in marketing and transportation. By far most of thenew lands brought under cultivation during the past decade has been developedby squatters, frequently on lands unsuitable for cultivation. There areperhaps a million ha or so of forest and other lands (exclusive of cogon lands)which can be made available for settlement, mostly in Cagayon Valley, Mindanao,Palawan and perhaps Mindoro. This would roughly approximate the area takenover by squatters in the past decade. Thus, the major contribution oforganized land settlement would be to offer better opportunities for 'those whoare migrating while at the same time reducing the ills of erosion and loss ofland to cogon grass which has attended the movement of squatters onto hillsides.Land settlement offers only a very limited potential to restructure Philippinesagriculture into larger sized units.
7.24 The private sector offers a means for greatly improving land settle-ment programs. As an example, in the Ste. Toinas scheme in Davao del Norte,smallholders contract with corporations under long term arrangements tomanage their lands for growing bananas for export. With a guaranteedminimum profit of V 500/ha annually and the option of supplementary work,incomes to the smallholder are assured and are higher than could be obtainedotherwise.
7.25 Similarly, the potential for future land settlements could begreatly enhanced by participation of the private sector in providing cissuredmarkets, financial support and technical services. This should be encouragedfor corn or other feed grains for which demand prospects are good. There

- 48 -
are potential areas in the Cagayan Valley and Mindanao (North Cotobato andareas adjoining Bukidnon for such settlement.
C. Irrigation
Rehabilitation and Improvement of Systems
7.26 Rehabilitation of existing systems is a matter of high priority.It should include repair of facilities, comprehensive improvements fordrainage and water management and control and access roads, as in projects inthe Upper Pampanga and Cotabato. The economic advantage of rehabilitation isquite clear. The present "run-of-river" type new project costs about ' 1,500/ha.A thorough rehabilitation costs about ' 800/ha. Under the latter situation,the present crop intensity of 108% could be increased to 148%. Reports fromfarmers in pilot projects indicate that the rehabilitation program increaseyields of palay an average of about 25%. Thus, there is a potential toincrease output of present NIA irrigated lands by some 70%.
7.27 The date below simulate the increase in output per ha underprogressively intensive stages of gravity irrigation systems.
Table 19: ESTIMATED RESULTS OF INVESTMENT IN VARIOUSSTAGES OF GRAVITY IRRIGATION SYSTEMS
AdditionalCropping Additional Cost of
Stage Yield Intensity Output Output Systemcavans/ha % cavans/ha cavans/ha P/ha
Rainfed lowlands 40 100 40 - -
Run-of-river irrigation 55 108 60 20 1,500
Rehabilitation & Improve-ment 70 150 105 45 800
Rehabilitation, Improve-ment & Storage 87 190 165 60 2,200
Thus, to convert rainfed to run of river irrigation without control andwater management as has been the practice, would involve an investment ofV 75/cavan for the additional annual output; to add on rehabilitation andimprovement would cost g 18/cavan; and to add water storage hereon wouldrequire a further investment of I 37/cavan. To go from rainfed to animproved system either with or without storage would require an investmentof about f 35/cavan. While investment costs per cavan of annual output maybe roughly the same with or without built-in water storage, storage may be

- 49 -
necessary as in the expansion of the Magat irrigation area. Also storageprovides other advantages. The reduction of flooding in wet season andassurance of water supply in dry season would reduce the risks of farming.With assured water supply equitably shared, the collection of water chargeswould be considerably enhanced. Further, in most cases there is usually apower component of the dam project which reduces the investment cost atrributableto irrigation. At the same time, unless these considerations clearly out-weight the benefits obtained without storage, investment priorities shouldgo to the latter since it would affect almost twice as many farmers for thesame investment. Also, it is quite clear that the traditional run of theriver system is quite unsatisfactory despite the social and political aspectsof covering a wider area for the same investment.
7.28 About 260,000 ha under present NIA gravity systems should berehabilitated. This estimate excludes the area under rehabilitation in theUpper Pampanga and small projects under 3,000 ha which should receive somerepaid and turned over to local management and maintenance. Even so, toaccomplish the task within an 8-10 year period would require more than twicethe present engineering staff of NIA.
Future Development of Irrigation
7.29 Even if the rehabilitation program is completed by 1980 increasingthe irrigated cropped rice area by 100,000 ha or so, this would account foronly about one-sixth of the increase in irrigated area necessary to meetrequirements for rice by that time. The remainder would have to come largelyfrom extension of irrigation to new crop land on the order of 45,000 ha a year(at cropping intensity of 150%).
7.30 Pump irrigation offers some potential. But the state of disrepairof existing systems pumping surface water suggests that the major effortover the next several years should be directed towards their reestablishmentrather than to large scale expansion. Pumping water rights and prioritiesneed to be established as well. The UNDP Project for Groundwater Develop-ment has uncovered some potential in the Laguna region, but by and largelittle is known about the availability of groundwater. A thorough surveyof groundwater resources for the entire country is needed.
7.31 Thus, expansion of NIA gravity sytems offers the principal meansfor meeting rice requirements within the current decade. Fortunately, thereare large opportunities to expand irrigation. Only one-third of the lowlandpaddy cropped area of 2.7 million ha is presently irrigated and there is apotential for irrigating an additional 1.3 million ha. Even in CentralLuzon, where the largest concentrations of irrigation exist, irrigatedpaddy lands are less than half of the lowland paddy area in wet season andin dry season extends to only 40% of the area covered in wet season.
7.32 In addition to the Upper Pampanga, Cotobato and Angat-Magatimprovement projects already undertaken, projects proposed by Governmentfor foreign assistance (listed in Section VIII) would provide about half

- 50 -
of the needed expansion of irrigated crop area by 1980. 1/ The Upper PampangaProject (improvement of 46,000 ha existing and addition of 31,000 ha new)is the main element to the mid-1970's. The Magat Dam project (improvement of40,000 ha existing and 60,000 ha new) is the principal project for the later1970's.
7.33 Beyond 1980, a major potential may be in transbasin diversion ofCasecnan River water excess to Cagayan needs to Central Luzon in order toexpand the Upper Pampanga project area of 77,000 ha by an additional 50,000to 75,000 ha. Although irrigable areas have not yet been defined in theCotabato Plain, Mindanao, it is conservatively estimaed that about 100,000ha of land could be put under irrigation.
7.34 With more intensive exploitation of water, the need for a waterresources master plan has beco w more pressing. It is most urgent forCentral Luzon, including an evaluation of the needs of the Cagayan Valleyand the capability of transbasin diversion to Central Luzon. Water resourcestudies of other areas, particualrly in Cotobato, should follow.
7.35 Manpower will be a major constraint to carry on enlarged programsboth for rehabilitation and new irrigation projects. It will require atraining program to develop a staff much larger than the present one. Atraining program staffed with NIA personnel and perhaps a few expatriatesin key positions will be required. Also some training abroad of youngFilipinos might be needed.
D. Marketing and Transportation
7.36 Marketing of agricultural commodities is almost entirely in theprivate sector. Government intervention is largely limited to the purchaseand distribution of rice for stabilization purposes. Operations under theindependent Rice and Corn Administration (RCA) which was recently supersededby the National Grains Authority under the supervison of the Secretary DANR,proved unsatisfactory. During the period of self-sufficiency in rice,1968-70, government purchases of palay were insufficient to maintain farmprices at announced support levels. Thereafter, until the recent rise inworld prices, the large spread between domestic and world prices enabledRCA to import and sell at a profit although at prices still below those ofdomestic rice. Margins of rice millers have been squeezed also by pricecontrols, impeding investment in facilities for more efficient operations.Further, government stocks suffered heavy losses, partly because the quedanor warehouse receipt proved untrustworthy.
7.37 As the nation once again approaches a balance between production andrequirements of rice, the NGA will need to reinforce domestic purchaseoperations so as to provide the security of the support price to palay farmers.
1/ Based on NIA tabulations dated 12/22/72.

- 51 -
Moreover, similar support operations may be necessary to stimulate productionof corn and other feed grains. NGA plans to conduct palay support purchasesthrough a network of private mills acting as agents of NGA. It will beimportant to assure that government maintains control of its stocks.
7.38 NGA is not permitted to sell at a loss. This may make for discon-tinuance of operations as supplies improve and prices fall, a time whenincreased support operations should be forthcoming. The practice of sellingimported rice at less than prices of domestic rice also acts as a disincentiveto the producer.
7.39 Government-sponsored marketing cooperatives for palay have notmade much headway, partly because of high overhead costs which lower thereturns to cooperating farmers below those received from traders. Yet:there is a definite need for cooperatives in some cases which can providedrying and storage facilities as well as other marketing services, especiallyin areas where communication and transport are difficult and competitionamong traders limited.
7.40 Market facilities are poorly geared both in capacity and locationto handle an increasing volume of agricultural products. Rice milling facili-ties are underutilized in many areas although a substantial number are notvery efficient in converting palay into rice. There is a general lack ofdrying facilities, an important factor in a climate of high humidity, forrice and corn. More drying facilities for corn will be especially importantin Mindanao and the Cagayan Valley, where very large increases in output canbe expected in the future. Feed mills are also required in livestockproduction centers, particularly in Mindanao. Navotas, near Manila, is theonly fishing port being constructed with full facilities, although mostfishing takes place in southern waters and future increases in fish catchare expected to come from there.
7.41 The physiography of the islands makes transport difficult betweenisland and intra-island as well, adding substantially to the costs ofmarketing, and thus lowering prices to producers. Roads, especially feederroads, and ports are needed to facilitate inter-island, intra-island, andexport shipment (Map 10217).
VIII. MAJOR INVESTMENT OPPORTUNITIES FOR FOREIGN FINANCING
8.01 Investment opportunities noted below reflect the priorities'ofdevelopment strategy in the 1970's. The principal emphasis is on improvingthe condition of smallholders, most of whom are producers of palay and corn.For palay farmers, improvement and expansion of the irrigated rice areaalong with the continued spread of IYV-fertilizer technology (on rainfedlowlands as well) holds the most promise. For corn farmers, the use ofnew varieties and fertilizers offers the potential to double output by theend of the decade and to begin to participate in favorable export trade.

- 52 -
In order to exploit the potentials of HYV-fertilizer technology, cultivatorswill need credit to finance fertilizers and other inputs. Credit is alsoneeded for draying and storage facilities and feed mills, which otherwisewill be an increasing constraint on such development.
8.02 The land reform program will require a great expansion in productioncredit, partly to supplant credit previously advanced by the landlord butmore important to finance fertilizers and other inputs in order to makeland more productive. A corollary requirement is a rapid strengtheningof supporting extension and credit supervision services. An integratedrural development approach in selected areas which provides infrastructure,credit (both short and long term) and the full range of supporting facilitiesand services appears to be promising. At the same time, opportunities fornew land settlement can help alleviate the pressure of people on land andthe ills which result from the spread of squatters on steep slopelands.
8.03 Large scale development of smallholder fishponds for which thePhilippines is very well suited and for which large areas are available isalso of high priority. While there are also opportunities to assist smallholders in improving coconut and tobacco production and marketing particularlyfor export, these are perhaps not as urgent, partly as a reflection of marketprospects.
8.04 Extensive forest resources, which are presently inadequatelyexploited, can provide the base for development of large scale pump andwood industries to greatly increase export earnings. Oleo-resin productionfrom Benguet pine could increase employment and incomes of forest residents.There is need for reforestation of denuded areas and improved watershedmanagement. Also, the rehabilitation of some 4 million ha of cogon grasslands would provide considerable opportunity for pine plantations, cattlegrazing and some areas suitable for upland crops.
8.05 While potential investments noted below relate to specific projects,general program assistance will also be required, particularly to financeheavy imports of fertilizers and protein animal feed. The Government hasalready begun discussions with external financing agencies on many of theprojects listed below.
Irrigation
8.06 For the foreseeable future, expansion of irrigated rice isclearly a matter of the highest priority. This includes rehabilitation ofexisting irrigation systems to increase the area served in both wet anddry seasons and development of new irrigation projects with the samecapabilities. By 1980, the cropped irrigated rice area will need to beenlarged by some 640,000 ha if the nation is to provide for is minimumrequirements of rice.
8.07 Possible projects at various stages of preparaion and negotiationwith lending agencies include:

- 53 -
(a) Penaranda - Aurora Project in Central Luzon for improvement ofsome 19,000 ha of existing irrigation scheme in Penaranda area,including trans-basin transfer of water from Aurora inCagayan Valley to provide dry season irrigation. IBRD/IDAfinancing has been requested. Preparation of feasibility reportis being financed by IBRD.
(b) Central Luzon Master Water Plan to provide information onavailable water resources so as to identify priority projectsand facilitate preparation of feasibility reports. The studywill also be concerned with potential trans-basin diversionof water from the Cagayan Valley which is excess to its needs.Total estimated cost of study is about US$2.1 million, of whichUS$2.0 million is from foreign assistance. The Governmenthas requested IBRD/IDA to include this in possible loan orcredit for Penaranda-Aurora.
(c) Tarlac Project in Central Luzon for rehabilitation of 30,000ha to provide for dry season irrigation. Feasibility studyis being undertaken by NIA and IBRD financing may be sought.
(d) Groundwater Development in Laguna area of S. Tagalog coveringabout 10,000 ha in both wet and dry seasons pending feasibilityreport being prepared by an UNDP Team. IBRD financing may besought.
(e) Magat Dam Project, Cagayan Valley, to provide water, improve40,000 ha of existing irrigation and extend irrigation onan additional 60,000 ha. Estimated cost US$127 million,including power component, of which about US$60 million isfrom foreign sources. Feasibility studv Is scheduled for com-pletion with USBR assistance, IBRD or ADB financing may besought.
(f) Three packaged projects in Mindanao covering 41,000 ha of newirrigation.
(1) Saug-Compostala 13,300 ha(2) Bunawan-Salvacion 9,300 ha(3) Kabulnan-Labu-Labu 18,500 ha
Estimated total cost U$$8.8 million. Feasibilitystudy is being conducted by NIA-PES team. ADBtechnical assistance and financing may be sought.
(g) Angat-Magat Irrigation Development, to improve a total of63,000 ha of existing irrigation schemes in two areas. ADBfinanced the feasibility study and may finance the project.

- 54 -
(h) Laguna Lake Water Quality and Management, involves qualitativeand analytical study of the Laguna Lake water for use inirrigation, fishery and water supply, including tidal andhydraulic controls. UNDP is financing the study with ADB asthe executing agency. Investment plan pending outcome ofthe study underway.
(i) Irrigation/Electrification Project, using diesel engines inpump irrigation to serve 35,400 ha and to provide electricityto 17,000 homes in 8 provinces (Cagayan, Isabela, N. Viscaya,Ilocos Norte, Abra, Camarines Sur and Capiz). Government isnegotiating with Japan for inclusion of the project in Japanesecommodity loan.
(j) Solana-Baggo Project, for construction of an overflow dam andinstallation of propeller pumps to irrigate about 5,200ha in Baggao and Solana Municipalities of Cagayan Province,Cagayan Valley. A Japanese loan may be sought.
(k) LLDA Irrigation Project, for irrigation of cultivable landaround the Laguna Lake, Laguna and Rizal Provinces of S.Tagalog. Feasibility study is being conducted by Hydrotech-nical Corporation and financed by USAID loan. Investment planpending outcome of study.
(1) Agusan No. 1 Project, construction of a dam to store water ofAgusan River in Davao, Minadnao for irrigation, floodcontrol and hydro-power generation. Preliminary study madeby USBR. Feasibility study to be conducted by Bureau ofPublic Works. Investment plan undecided.
(m) Lake Sebu Project, S. Cotobato, Mindanao, same nature andstatus of study as (1) above.
(n) Matuno River Project, N. Viscaya, Cagayan Valley, same natureand status of study as (1) above.
(o) Polangui No. 4 Project, Bukidnon, Mindanao, same nature andstatus of study as (1) above.
(p) Tago River Project, a multi-purpose project in Mindanao forirrigating 30,000 ha, hydro-power generation, flood control,water supply feeder road and agricultural extension. ADBtechnical assistance for preparing feasibility study may besought.
(q) Jalaur River Project, Iloilo Province, Panay, pre-feasibilitystudy completed by Michael Baker, Jr., Consultants, in 1964 asan irrigation and power project. A re-study is being doneby NIA on feasibility as a single purpose irrigation project.

- 55 -
(r) Balog-Balog Irrigation Project, Tarlac, Central Luzon,construction of dam across Balog-Balog River to irrigate25,000 ha. Land classification completed. Externaltechnical assistance for feasibility study being sought.
(s) Balingtingon Irrigation Project, to harness water resourcesof Sumacbao River in Pampanga River Basin, Central Luzon,for irrigation, hydro power, flood control and other wateruses. Feasibility study is being conducted by the Bureau ofPublic Works.
(t) Casecnan Trans-Basin Diversion Project, to provide waterfrom the Cagayan Valley to expand the Upper Pampanga Projectfrom the prospective 77,000 ha presently underway to120,000 to 150,000 ha. Estimated cost US$150 million(including power component) involving about US$70 millionforeign financing. A reconnaissance study report was preparedby Engineering Consultants, Incorporated in 1971. Sincethis is a major project, its implementation probably will notbegin until after 1980, when the second major project, MagatDam, will hopefully be completed, the first major projectbeing the Upper Pampanga River Project now under construction.
8.08 The above do not exhaust the needs or the possibilities by anymeans. NIA has tentatively identified over 30 project areas, very largelyoutside of Central Luzon, which are presently scheduled to be funded fromlocal sources. Other projects may well be identified after 1975 by theCentral Luzon Master Plan.
Projects to Assist Smallholders
8.09 Other means to improve the situation for smallholders should beconsidered as shown below:
(a) Credit for Fertilizers and Production Inputs is needed toassist smallholders improve productivity of their lands.Only one-third of the rice area is fertilized and verylittle of the corn area. These crops account for over halfof the total cultivated area. Recent findings indicate asubstantial production potential for the spread of HYV-fertilizer technology on rainfed lowland rice and on corn.At the same time, credit for these purposes is an essentialcomponent of the land reform program. Credit will also beneeded to promote the use of fertilizers in fishpond culture.Rural banks, the main credit institutions for small farmers1,had outstanding loans of r 725 million at the end of 1972.If funds are made available, this might well double within5 years. Perhaps 40% or so of the increase would be neededto finance fertilizers.

- 56 -
(b) Rural Development Projects in selected land reform areasoffer a means to provide infrastructure, development creditand comprehensive supporting facilities and services.Projects might well involve about US$10 million eachwith perhaps half to be supplied by foreign assistance.Considering that there are perhaps 1 million sharetenants in land reform areas, there should be scope fora number of such projects.
(c) New Land Settlements in Mindanao, Cagayan Valley, Palawanand Mindanao should be considered. Performance ofexisting settlements has been disappointing. Much moreinfrastructure effective extension services and marketingfacilities are required. Participation by the privatesector to provide core services relating to production andmarketing of products, such as corn, could well enhance thechances for success. A number of such projects might beprepared.
(d) A project to improve production and marketing of tobaccowould benefit many smallholders in Ilocos and Cagayan.A favorable export market exists but both production andquality have declined. The feasibility study should lookto ways to provide better control of plantings, much moreeffective extension services and quality control in curing.A tentative estimate of total cost is about US$10 million.There would probably be needed to support more than theforeign exchange component which would be small.
(e) Credit for expanding corn drying and storage facilities andfeed mills will be needed to accommodate a doubling incorn output by 1980. The principal areas concerned areMindanao and the Cagayan Valley where such facilities arequite meager. Corn is essentially a smallholder crop withthe average farm size smaller than for palay. This mightinvolve about US$15 million, mostly foreign financed, which willbe provided under the current IBRD loan to DBP for rice millswith appropriate modification. Heating units to processsoybeans for animal feed could also be financed in the sameway.
(f) Rejuvenation of coconut holdings, again largely asmallholder crop, is perhaps less urgent from a nationalstandpoint in view of poor price prospects in world markets.Yet there are large areas in Western Visayas and S. Tagalogwith overage trees and low yields. A replanting programinvolving intercropping and fertilization could substantiallyreduce costs of production and improve their cultivationincomes. Quality of copra must be improved by better dryingfacilities throughout the Philippines; otherwise export

- 57 -
markets will be jeopardized. Financing of replantings, andfertilizers, and improved drying equipment might roughlyinvolve about US$20 million of which about one-fourthmight be from the outside.
Forestry
8.10 Of the three major agricultural export commodities, logs and woodproducts appear to have the most favorable long run prospects. There area number of proposed projects for which pre-feasibility studies should beencouraged.
(a) Development of a wood export center at Casiguran Bay innortheast Luzon to tap the largest remaining unexploitedforest resource; providing for financing the necessaryinfrastructure of access roads and port facilities', andcredit for the private sector to establish wood processingfacilities. A rough estimate of total investment mightrun US$50 million or more with a large foreign assistancecomponent.
(b) Integrated wood industries center in Mindanao, also forexport, would provide credit for a full range of woodprocessing facilities in close proximity so as to makefull economic use of wood materials available. This wouldbroaden the export base beyond the export of logs to Japan.While much of the infrastructure is in place, some additionalroads and improved port facilities would be needed. Arough estimate of total investment is perhaps US$30 million:,again with a considerable foreign exchange component.
(c) Development of pulp and paper industry in Mindanao mightwell be part of the integrated center involved in (b)above. Within the next five or six years, the Philippineswill likely require up to 200,000 tons of pulp for papermore than the prospective local supply. This would makeeconomic at least one economic size mill. In the initialperiod, the plant would make use of thinnings of forestsand wastes from log ging and other wood processing industries.But over the longer run further development of the pulpindustry would depend on establishment of quick growingplantations of soft woods as noted in (d) below. Estimatedcredit needs for a pulp and paper mill total US$50 million,largely a foreign exchange item.
(d) Credits for establishment of tree plantations in Mindanaoto provide a base for exports of pulpwood and pulp forwhich there is increasing world demand. Considerableforest areas have been logged over and could well bereplanted with abizza, eucalyptus or pine which mature

- 58 -
usually within 7-15 years. This would lead in time tofurther investment in pulp mills. Pending the pre-feasibilitystudy, no estimate of costs or potential size of the areathat might be involved can be approximated.
(e) Credits for developing oleo-resin production from Banguetpine in Northwestern Luzon would make several contributions:
(i) Alleviate erosion and siltation from areas denudedby logging and squatters, (ii) improve incomes ofhill inhabitants, and (iii) substitute for importsof pine oleo-resin derivatives. There are 214,000ha of Benguet pine forests mainly in the Agno and Cagayancatchment areas. Some tapping is taking place,apparently with favorable income results to participants.A major part of these forests might well be reserved foroleo-resin production. Processing facilities would berequired. (A feasibility study of production andmarket potentials is required.)
(f) An allied study is needed to determine methods for economicrehabilitation of cogon lands which could be used for forestry,pasture for cattle or in some instances for cropping. It isestimated that perhaps 4-5 million ha are in cogon lands.
Fisheries
8.11 Fish provides half of the animal protein in the filipino dietand demand is projected to increase about 60% during this decade. IBRD iscurrently considering a fisheries credit project emphasizing more efficientvessels as replacements in the marine fishing fleet together with supportingsmall operations. Included would be financing for preparation of projectsfor fish marketing and for expansion of smallholder fish ponds. Totalinvestment is estimated at US$18.75 million with a foreign exchange componentof about US$8.4 million.
Regional Planning and Other Preinvestment Studies
8.12 Various annexes of the report stress the importance of landclassification, soil surveys and water resource studies (beyond that forCentral Luzon) as means for promoting better planning and better resourceuse.

- 59 -
Preinvestment Requirements
Study Comments
1. Land Classification NIA and DANR (Annex 3, para 82 to 83 andAnnex 13, para 64).
2. Soil survey Suitable for UNDP and FAO (Annex 1, para67).
3. Survey of condition of NIA (Annex 3, para 19 and 20)existing irrigation systems,rehabilitation
4. Preparation of New Irriga- Suitable for private consultant (Annex 3,tion Projects and Central para 101 ff)Luzon Master Water Plan
5. Feasibility study - Casec- Suitable for private consultant (Annex 3,nan River (trans-basin) para 111).project
6. Rural Development in Land Suitable for FAO/IBRD and others (AnnexReform Area 13, para 34).
7. New Land Settlement Suitable for FAO/IBRD and others (Annex 13,para 34).
8. Corn druing and storage By IBRD in context of modification ofexisting loan (Annex 10, para 78).
9. Tobacco, production andmarketing
10. Copra rejuvenation andmarketing
11. Tree plantations for pulp Suitable for FAO/IBRD (Annex 2, para133, 142 and 144).
12. Pulp and paper mill Suitable for private consultant (JAnnex 2,para 101).
13. Wood industries centers Suitable for private consultant (Annex 2,para 142 and 146).
14. Oelo-resin production Suitable for FAO/IBRD (Annex 2, palra 145)
15. Rehabilitation cogon lands DANR and UNDP/FAO (Annex 2, para 146 and141).
16. Fish marketing Consultants financed under proposed IBRDfisheries loan (Annex 5, para 68).
17. Fish ponds Consultants financed under proposed IBRDfisheries loan (Annex 5, para 67.

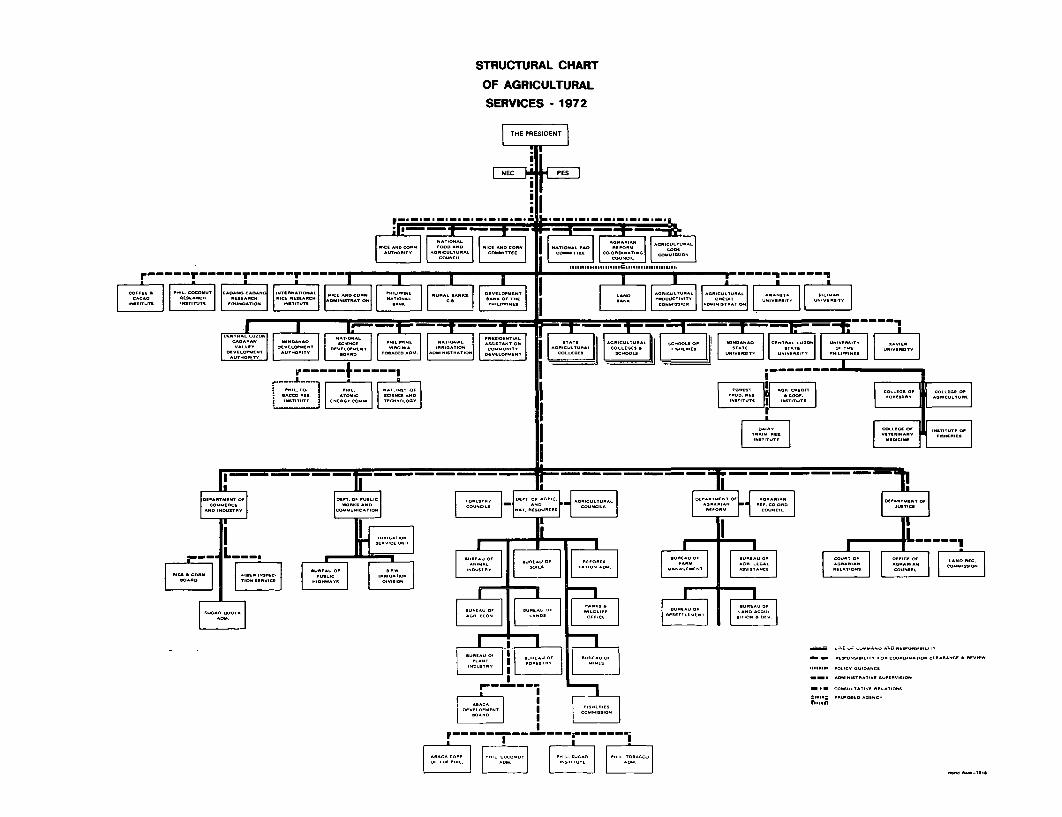
STRUCTURAL CHARTOF AGRICULTURAL
SERVICES - 1972
rTHE PRESIDENT1
1
'I
I
~~~~~~~~~~~~~~~~~~~I .,,r - …e |||0"
L~~~~~~~IATE~~~~~~~~~~ EERTTFORTO [J R AONNTR>A- HLtIE|| ^INL §|A AT0 TATN C|| L ni GIC LTU RJt| OI.or iS i R IAN O J ;ET^tJu
RE |ONLAF-OEET | | D FERT |I oARcoAO | C^MN-RT ON| EESOPNTO | | A CA CUTARALCALLEC | FlNAERleN U {SITA | AT ARV{ TE A SN
_ L.TDICII]C IN RD e O'__ _ -_ _ _ _ - -- __ _ __ __
I A R6 ^ 0 I RNRIAAOR--I
ECREAC OF ERR EAUREAA AT @UR.AUOF EAUECCU *CROR ECO
F~~Z7CRR7II L .CC AIC R A R jSNARN 0 OA ON
I~~~~RI~ ~ ___Cr
EVOAR~~~~~~~~~~~~ .. CT R.. AC AI ! AEACIS NLCR I AA ORl.SI


PHILIPPINES: CHANGES IN AREA HARVESTED AND YIELDS OF MAJOR CROPS
1964 -66 and 1969 - 71
(1959 -61 100)
1964-66
I ~
%1969-71
Corn
1
~ ~~~~~~~~~~~~~~~1964-66
1969-71
Coconut1964 66
1969-71
Sugarcane1964-66
1969-71
Virginia tobacco
1964-66
1969 71
Native tobacco1964.66
1969-71
40 60
8a0
120 140
S Area
Yield
--~~~~~~~~~~~~~~~~Wrici Bank -7281


PHILIPPINES
CLIMATIC REGIONS1201 12152 125
cr °S 20 p NEW SYSTEM 20
IDN O ORIGINAL SYSTEM N (Huke 1972)@ g7 ( Hoinsworh & Moyer 1945 ) r ......0 LONG LOW SU. DRY SEASO;N N OR lMONTHS
ZWITH LESS THAN 2.* OF RAINFALL PERA-ri ~~~~~~~MONTH.
RY- @ INT.RAI..SDDPRO.T D I S ,' INT EMEDIATELOWSUN DRYSEASON4D Y W NER A N D SP RIN G. W E T .STMO N T H S W IT H L ESS T H A N 2A O F R A IN -SUMMER AND FALL
FALL PER MO TH.
cn cr M~~~~~~~~~~~~~~~~SORTH 'RYSESO O O N SOR LOWBSUN DRtY SEASON; ITO 3MONTHSui oc'I MNH ¾¾~WIHLSTHAN 2.4" OFHRAINFALL PER MONTH.
z ~~~~~~~~~~~~NO DRY SEASON, PRONOUNCED WINTER - SHORT HIGH SUN DRY SEASON; I TO 3 MONTHS,. J Wi~~~~~~~~~~~~~~~~ANFL TH LESS THAN 2.4' OF RAINFALL PER
ALL MONTHS WITH 2A'OR MORE RAINFALL:NO DRY SEASON AND NO PRONOUNCED ~~~~~~~~~~~~~~~~~~~WETTEST LOW SUN MONTH WITH AT LEAST 3>- 11) MAXIMUM RAINY ~~~~~~~~~~~~SEASON /ITIMESTHE RAINFALL OPFORYEST HIGH SUN
- ~~~~~~~~~~~~~~~~~~~~~~~~~~~~~~~ALL MONTHS WITH 2A OR MORE RAINFALL:.1 ~~~~~~~~~~~~WETTEST HIGH SUN MONTH WITH AT LEAST
15' 15 THREE TIMES THE RIAINFALL OF ORYEST|. A D
LOWUN MONTH.'_L Nm ~ ~ ~ ~ ~ ~ ~ ~ ~~0 )ALL MONTHS WITH 2A4' OR MORE RAINFALL:
- C' M N LA ~~~~~~~~~~~~~~~~~~~~~~~~~~~~~~~~)THE RAINFALL OF THE DRYEST MONTH.
ALAY (j Ce ebl _ <- < X 17~~~~~~~~~~~~~~~~~~~~~~~~~~.5- .. _,.
U- 0 -
IN~~~~~~~~~~~~~~~~~~~~~~~~~~~~~~~~~~C
I I I - I I I I I .~~~~~~~~~~~~lo- 0,C.
MILES f1M IILE SO 100 200 300 0 so0 200 300 2
0- KILOMETERIS KILOMETERS
50
MALAYSI e C a/b a ,S eoM A LAYSA ~Ce/ees S-eaL ~~~~~~~~~~~~~~125, 125'


IBRDO-10215
CLASSIFICATION OF PROVINC ES, PHILIPPINESBy GEOGRAPHICAL REGIONS. I
197229 RELIEF ,REGIONS AN[) PROVINCESI. CITY OF MANILA VII. WESTERN VISAYAS
35. AMrtr 1I' It. ILOCOS 36. AntArt.
A.ben Ner 38. Cair.s ---- ---- District boutidarIes3 IltsS., 39 Nese- Onni,1neel- Regional botundaries4 Lt Unr- 490. R-rblon 29 M-1 10i International boundaries7. loa II.ESEN IAA ELEVATION IN FEET8. KtIirrptApay.. 41. SnIhol
42. Celo I 50 n Oe III. CAGAYAN VALLEY 43. Nortle-r LeyI. 1 0adOe
5. Stln 44.Srrer et 500 - 1,499II Issbnls ~~~46. Neo Ore9l- . 0 -499
12 .Nrs VrtCtn 472. N'rshern Seeee-
IV. CENTRAL LUZON 48. We.te. S.-,,'
4. Errlsrran IX. NORTHERN & EASTERN " N,rrrtt.ntrrrrrr lirrph
18. P-,pang. 49. Atesan del No--a rr Cr5Irr b, hI7. P-pgasinar 50. Rrrkirrn- IV-nId Atr-k tIlt ru ailw-rIS oss 51. L..:: ~del N,,,e
53 M -6rri OI,cirtnn-l V. SOUTHERN TAGALOG 54. M4,I-er 0,1-.Ia 18 s a 5O IO 155 200
.20 Selot-9. 55. stretgs del Nort E . RLE.EE21. C-oIn 58KILOMEsTeERS 1 X,.. -22. L.gu-o 56. AgS- . del Sur. 23. M mide57tiAtt Io jaSu,
24 . 1Mnrtr Otiletl . Carnigij Rm
25. Ptlstr: S. SOUITH EAN & WESTERN 127. Oreet MINDANAO28 4.tt 59. C-tb-r aifc1
14' 60. Dao- del No-de-VI. BICOL. 6I. Z-rrboent del Nsel 2
25. Albon 62. Ztnrb-anstdeS.,30. C-rtri-e N.-rt 63. SIllcea31 C-rrrri-n Su, 64. Sosrh Cmebab c )Oca32. C.-od-.n.. 65. Gatt del S., 3
34. so-oNe 8.atoOist
4~~~~~~~~~~4
5 o u I h C12 i35n7j G
17 4~~~~~367 /
42v~~~ ~
be0 lo-10
Su/u Sea
50
6'~~~~~~~~~~~~~~~~~~~~~~~~~~~
Cotobotr;
vIEOsARA ~~~~~~~~~~~~~ZoneboonOcean*r 6
nsr.rnn~~~~~~ SOC ~~63 5
,IILF IAR7
I N DO N E: A 110 122' 124' 96~D

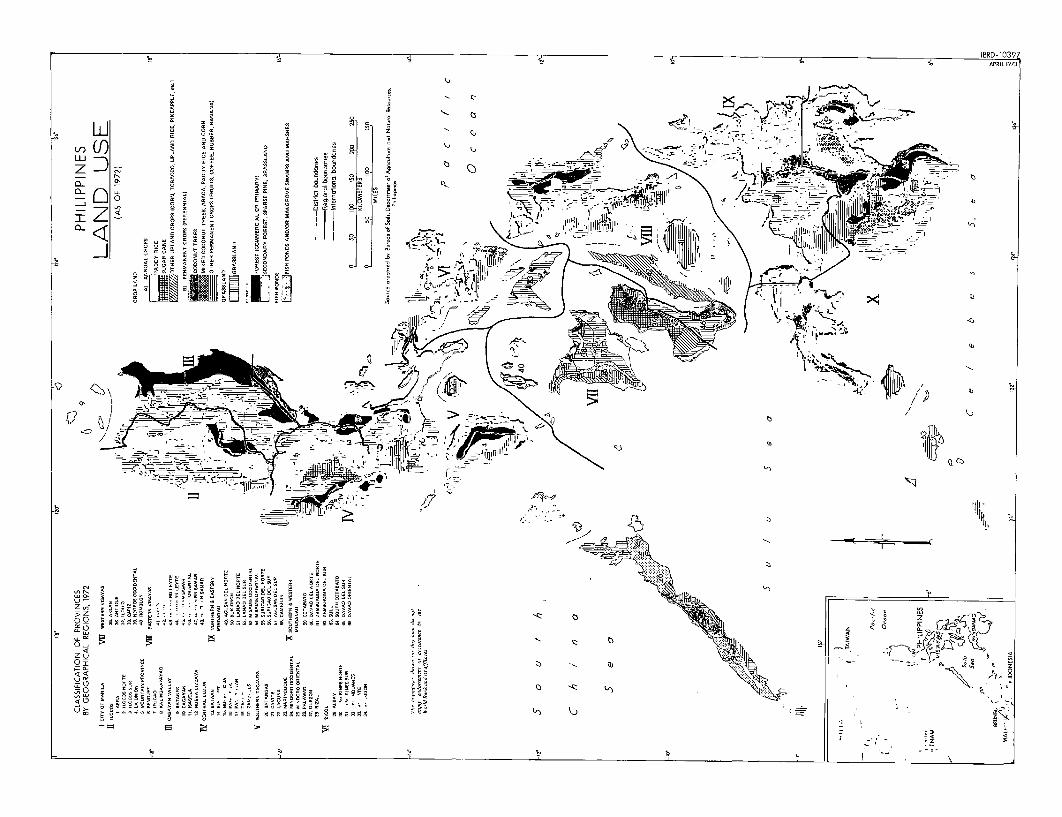
*e *g .1 , IBRD-1039,~~~~~~~~~~~~~~~~~~~~~~~~~~~~~~~~~~~~~~~~~~~~~~~~~~~~~~~ R- 09
L JD , 1
zuvj ¢, .,55,): i '' =' r .'. ^,;52iQ. tv i a < A5
_ = X t > S 1 1 3 .~~~~~~~~~~~~~~ l
o s N o X ~~~~~~~~~~~~~~~~~~~~~~~l a

IBRD-10217R118' 120- IjL>2' 1[24' APRIL 1973
CLASSIFICATION OF PROVINCES. PH ILI PP II'ESBY GEOGRAPHICAL REGIONS.
19729
1. CITY OF MANILA VlI WSESTERN VISAYAS | .7 TRANSPORT SYSTEM-16° 35 AkO - -. ----
A1. ILOCOS 36. A,0;V,-o 4 50n VienlR |GeRS Project Locotian1. Al,, 37 1100 ZS .Vi f
2. boosNo.-o 38 C.n,, A Or y Primory Highvwoys3 lloos SIll :19 Nqg-,, O-icfdtlol [L 0 2o4. La, Solon 40. Romolo,, - A.R. Rol)woys5 Mo--Tl/ P'-`- 1 1 .6 Bengu P Vill, EASTERN VISAYAS -0 4. Principol Porps2. Ilgao 41. B90ho0 | 8 + Tu L .B. K.Ig,.osAp-aoo 42. Co - guegor-O ,' Trunl LIAR Au port
43. N-,h-n L,yl, -1--- District BourdoriesIII. CAGAYAN VALLEY 44. Sorlh-In Ldve- Boundories
3. BaLnes 45. E- l S. - 5 Regionol cOUEhdOrieS
10 CoSOSan ~~~~46 Neg-o O,i-,nI4IlRIIL l o -:Ol, 02 N 4 h S- , InlternaiOlOnal 3oundaries ff
489 7eTr ea r{
IV CENTRAL LUZON Son 6 11-16 13 B9,1,0 IX. NORTHERN & EASTERN Fe n1 I/ 16-
14 Elulaan MINDANAO . el 1B 2 I5 Nu va Ecl,j 49 Aguo- d N.- h ,J 1 5. 7 1 11,1 ,1 I .
16 PnlVong., 50 Bukid-on ... ... I ,,t l n,,',,I,I.l......... I.,'72 P
000 0,,
0SI 5. Lanao del NIolo e P; I 9 2 n \ / f lo,l,ro,E o,,,1kai1,o33ts l/ ll1r
19. V,,,I.,, 52. Ln, dU . MI S, I II9. Z,,n11bal , 53. Misamis Oooidennll I N_ 3: o loe
22. Laguna i17 Ago,ol lolI So, i119 - / _
23. Mo,,l louqo SB. Corogoin , 1X6 N: 14 I d24. MiMdo,o Occ,derlIl 01999000 $ Fe o do \ No
25 MiSUdoEoORNo,y,, X. SOUTHERN l i VESTERN 013 KL Ji8 .271 26. PC.oi5oo MINDANAO 'SMAN.L ZON p
0s
22. 00g0, 59 Ag. Co a Sa.o
20. 900d - 50. Cnoog 4el 90T1
Vl 91COL 5~~1. Zo,obo,ngo dcl Noll 990ag510a tl>'5 aSIOEC /6 '10 Peogooiboo Pa7C i fi/C 14°-29. RICOL 62. Z,orboon o 41d lSo, N ns ugeo .- -21C.lD + C rN .f
29. W I. 05 0 -5dSl-.)'T
31. Co,,,no eS o,T 64. SVot t Co,abooto i , 20 i>_ 3' ON,0c eaon33 Madsboa 56. SOUT oRONiWnTElRN
34. Sotoogr,, ''..opon (oSoCru ) .A'Tlooo
26 ~ ~ ~ ~ tND/7 MINANA co ' -
1424 2 l' - 0 >- d91 N,
61. ~ ~ < ,-'g, d. N- S AZ -o..b G C C
So3C th China . Y 2e ) 'N\ vP2 1
Sea ~~~~~~Son Jose Odo/ >\4 *±5$ 1 y 4"\tsor(9 )12'
'. C:. N.- e , ,,<tC
3 32. C.I-d--3~> ,0 ~ CMA
sE NM<'I W/1WP/r. WO,w-lSn t
vzX Southt Chn C-"A/ so, ( '.\ ; 5
1 K,, S Jos o 4 7 d D . /
7 va Ce/ebes 2ea Ceb
10' EL NER , Mao,f 0
0* 0 Ir o I Sor O N E S I A 122- 124- 126-
~~~~~~~~~~~~~~, ~ ~ ~ ~ ~ ~ ~ ~ ~ ~ ~ ,a' 44/ND A NA'0 . ogo~~~~~~~~~,ao 51 '-~PAAY 3
COIN A Colobor 52 60\:~~~~~~~~Sl, os
010
600CR SOC Job~~~~~~Nes NL-GRS
MALISU I ~~~~~~~~~ ~ ~ SUU eG o 0'
Nob NE016 IM'IN 22 N24A96


IBRD 10218116' ~~~~~~~~~iio*l-2 I'24- I96'
CLASS IFICATION OF PROVINCES,~ HLPIEBY GEOGRAPHICAL REGIONS,RI E F O
I. CITY OF MANILA VIt. WESTERN VISAYAS62IO~1818' ~~~~~~~~~35. A Il,,,9 8)1-
11. I LOCOS 36. Anlino-Ab. Ar 37. 11.110
2. lIn- HoN- 38. Co NA ,r3. loo- S., 39. N,goo. 0. -idnl Scole of flow (in Covans Polay 45 kgs)4. L. Union 40. R..blbIn
S. Mo...ltim P-ooo- -IOATFNVSYS1 Less thon -500,0007. Ilog",o 41. Rohol
S. Koiifng.-Ap,y.o 42, Cab, 500,000-2,000,00043. Norih-,, L.ol,
III. CAGAYAN VALLEY 44. SonWe,- Ley,oC.Roae 45. Ew-or S.-, 2,000,000- 3,500,000
10. C.Sy- 46. Negro O,ion-,I1. -,aIol 47. N-rh-r San-,12. Nuen Vi-oy. 48. Ww-er S 7,- 3,500,000-5,000,000
IV. CNTRALLUI.. IX. NORTHEFRN & EASTERN IV. CENRA LU- O MINDANAO 5,000,000- Over16
4. B.lne 49. Ag.pn, d,l N.r,,16. N.r, Eo.,p 56. "'idoo16 P.,pnooo,. 51. L,n-o 4, Nor--,, --- District boundaries17. P-n6--nn 52. L.n.. d.1Sur14. T.rIan 53. Mi-,sj Oocid.-,I
~~9. Z..b.I., 54. Mi-i, O,i,n,.l ~~~~~~Regional boundoriesSO. Sorig.o d.l Sor-
V. SOUTHERN TAGALOG 56. Sorigan d.1 So,
20. B-1mg,, 57. Agun,o 41 So, Intern___ tionol_ 4onare21. CooP,. SR. Coo,igoio22. Logo- 1923. M6rind.q.. X. SOUTHERN & WESTERN 5, 6 0 G 20 lOG 120 200 N24. Mid-r O.id-eolo MINDANAO i _____________26. Mind.r. Orio-.1 59. Co.b.blo13226. P.)on 607. O.o.. d.1 N.,10 27 oeo 61. Znbo..ng, del N.r,,29. Rj,.l 62. Z=n,o_g, ,dSu,
VI. BICOL 64. So,oh Co-b-l 3029. AIbov 65. Doo- d,1 S.,30. C..ri-rne No.- 66. D.-a OrienI1
32. c-aionUOcnon
34. Soo-g-n
South China-12' Sea 2
26 4~~~~~~~~~~~~~~
-10' o
PtoRG Princeso
6' 6'~~~~~~~~~~~~~~~~~6imply rod__,r,nl 2racpaoe0
CHIN A~~~~~~~~~~~~~~~~~~~~~~~
Pacific* ~~~~~~ocean
Uj ChZn UININP6ES
,ny~ Sea '
AL~
NON, A 90 124' I960