workshop 1: long-range financial planning - · pdf file20 min • what is long-range...
TRANSCRIPT

WORKSHOP 1:
LONG-RANGE FINANCIAL PLANNING
Tuesday, September 19, 2017

Overview of Today’s Session
1
Timeframe Topic/Discussion
20 min • What is long-range financial planning and why is it important?
10 min small groupdiscussion10 min review
• Small Group Discussion #1 – Why Might Your Municipality Undertake a long-range financial plan?
15 min • Long-Range Financial Plan Study Process
10 min small groupdiscussion10 min review
• Small Group Discussion #2 – How does your municipal do long range planning? How can we address the infrastructure gap through funding strategies?
30 min • Common Findings
20 min • Review of Case Studies
10 min • Questions about Case Studies?
20 min • Interactive Discussion of 5 Critical Fiscal Measures
10 min • Key Takeaways
10 min • Final discussion and questions

What is long-range financial
planning and why is it important?
2

Long-Range Financial Planning
GFOA:
“Long-range financial planning (LRFP) is
used to identify future financial
challenges and opportunities through
financial forecasting and analysis, and
then, based on that information, to
devise strategies to achieve financial
sustainability.”
3

What is Financial Sustainability?
Financial sustainability is
when planned service and
infrastructure levels can be
met without resorting to
unplanned increases in rates
or disruptive cuts to services.
Financial sustainability is
achieved when the following
conditions are met:
4
Predictable and stable tax and
utility rate increases in current
and future years
The right generation
pays the costs
Council’s highest priority programs are maintained
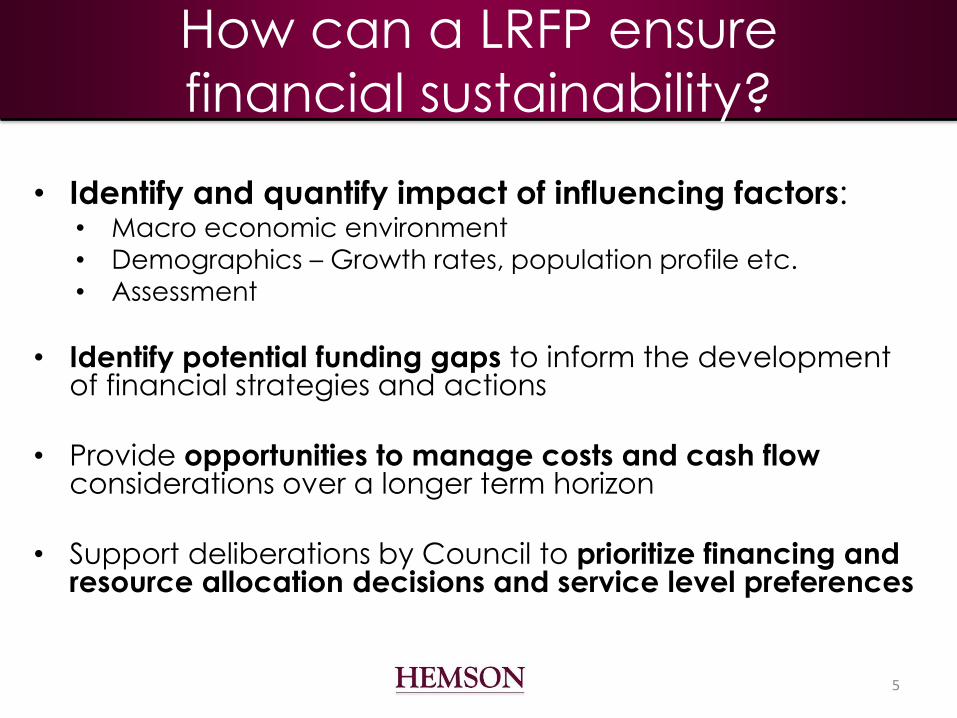
How can a LRFP ensure
financial sustainability?
• Identify and quantify impact of influencing factors:• Macro economic environment
• Demographics – Growth rates, population profile etc.
• Assessment
• Identify potential funding gaps to inform the development of financial strategies and actions
• Provide opportunities to manage costs and cash flow considerations over a longer term horizon
• Support deliberations by Council to prioritize financing and resource allocation decisions and service level preferences
5

Why Undertake a LRFP?
6
Source: GFOA
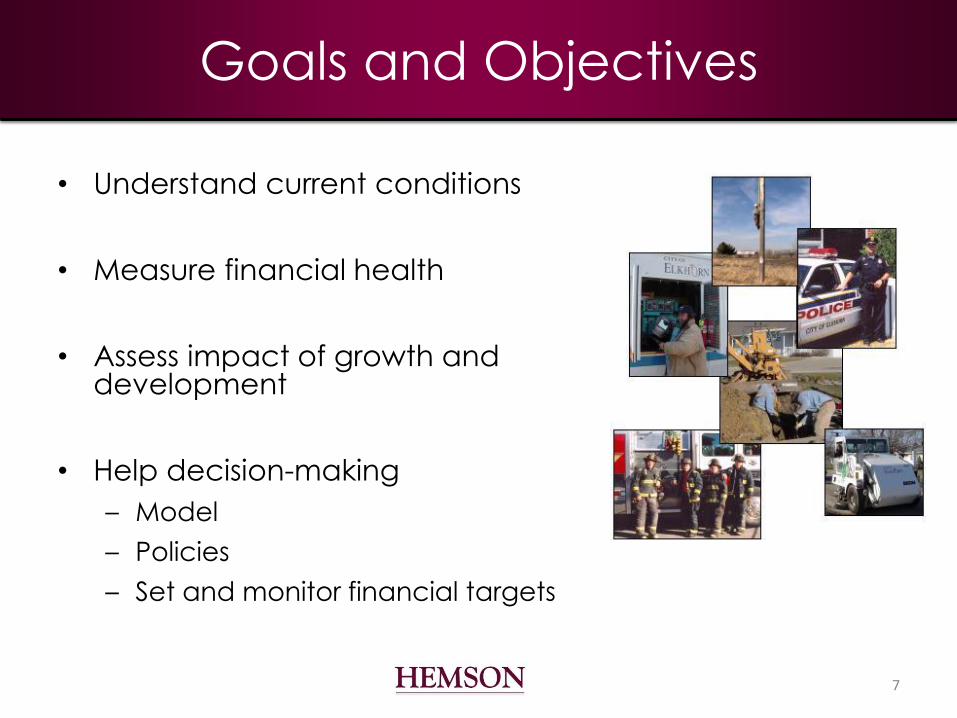
Goals and Objectives
• Understand current conditions
• Measure financial health
• Assess impact of growth and development
• Help decision-making
– Model
– Policies
– Set and monitor financial targets
7

Key LRFP Deliverables
Long-Range Financial
Plan
▪ Written document
▪ Released to public
Fiscal Impact Model
▪ Excel or software
based
▪ Internal use
8

The LTFP is Made Up of
Two Key Deliverables
9
LTFP Report
• Focus on financial viability, management, flexibility and sustainability
• Identification of measurable goals, targets, and objectives
• Overview of financial history and current status
• Overview of 10-year forecast
• Identification of risks, challenges and opportunities
• Key directions and policy recommendations
Fiscal Impact Model
• Tool for staff to:
• Assess the current financial position of the municipality
• Forecast the future financial position over the next 10 years
• Identify overall capital and operating needs
• Assist in the annual budget process
• Undertake sensitivity testing; and
• Provide information and data for updates to the LTFP

Long-Range Financial Planning
Long-Range Financial Plans:
• Present a framework and tools that can be used to guide
Council and Administration in sound financial decision making
and sustainability planning.
• Identify current and future resource requirements necessary to
achieve the municipality’s strategic goals
• Living documents and policies that can be reviewed and
updated regularly, based on significant financial changes,
economic challenges, and/or revisions to acts or standards
10

Fiscal Impact Model Structure
11
Tax and RateImpact Analysis
SensitivityTesting
Base Parameters(Forecasts, Plans,
Policies)
Operating &Capital Forecast
InfrastructureRepair &
Replacement
Assessment, Tax& Rate
Revenue Forecasts
Population, Housing, Demographic & Non-Residential
Projections
Financial Parameters,Assumptions & Drivers
Financial Policies,Objectives &
Measures

Sample Parameters
12
• Asset Management Plans
• Condition assessments
• Master Plans
• Official Plans
• Servicing strategies
• Financial policy documents
• Council strategic plans

What Will The Analysis Tell You?
• Key fiscal indicators:– Tax levy gaps and tax rate impacts
– Utility rate impacts
– Debt capacity
– Reserve and reserve funds
– Performance measures
– Ability to add many more
• Not just numbers:– Financial policies, practices,
strategies
– Fiscal sustainability plan
– Council objectives
13

Group Discussion #1
14

Small Group Discussion #1:
Why Might Your Municipality Undertake a LRFP?
Reason Yes No Somewhat
Financial crisis
Growth management
External (statutory; improve bond ratings & lower cost of borrowing)
Strategic (longer-term perspective for planning & budgeting)
Transparency (better communicate financial information )
Staffing & service delivery (determine futureservice levels)
15

Reasons for a LRFP:
Example New TecumsethReason Yes Somewhat No New Tecumseth Issues
Growth
management
• Upfront infrastructure needs
• Location & staging of
development
• DC exemptions
Strategic • longer-term perspective
for planning and budgeting
Transparency • Better communicate
financial information
Financial pressure • Extensive road
infrastructure needs
• Regional WWTP
• Pressure to provide
recreation and cultural
facilities
External (statutory;
lower cost of
borrowing)
16

The Study Process
17

Setting the Parameters of the Model
18
Structure – Excel based vs. customized software
– Frequency of updates
Scope – Municipal vs. sub-municipal wide geographic focus
– Number of services to be examined
Outputs – Match those shown in budgets
– Measure key financial indicators
– Results can be expressed as cost of service per household or per capita and could distinguish between growth and existing
– Identify capital and operating shortfalls
– Information on asset management requirements, capital development program, reserve fund adequacy, growth and assessment forecasts, debt load/capacity
Scenario testing – Growth rates
– Financial parameters

Who’s Involved
and Who Does What
19
Consultants Other External?City Staff
Council/
Senior
Management
Project Management
Financial Analysis
Financial Model
Reporting
Policy Development
Stakeholders
Roles & Responsibilities
Strategic Direction
Project Management
Data Gathering
Review
Logistics
Input on Model
Training
Strategic Direction
Education
Review of Assumptions
and Policies?
Feedback on Results &
Future Policy
Direction?
Advisory?

Initial Steps
1. Review servicing plans, financial reports and
planning documents
▪ Request additional data and reports not readily
available
2. Meet with department heads
▪ Identify focus areas and anticipated changes to
current service delivery arrangement
20
3. Establish key principles, indicators
and targets
▪ Fiscal and other (e.g. growth targets)

Overview of Initial Steps
✓ Review reserve statements, financial policies, and reports▪ Request additional data where necessary
✓ Hold meetings with key staff▪ Finance and then other departments
▪ Identify focus areas and any anticipated changes
✓ Identify best practices from other municipalities
✓ Identify items for further analysis and
testing
21

Important Existing
Financial Plans and Polices• Budgets and financial statements
• Guidelines for use of reserves and reserve funds
• Service pricing guidelines
• Sustainability Plan
• Current operating and capital financial policy
• Department-specific plans and policies
• Development charges study
• Rate studies
• Growth and development forecasts
• Other?
22

Consultation Process
23
Staff
Council
Stakeholders
• Important to have staff involved throughout
the process
• Key staff include: finance and planning
• Information session with Council is helpful –
what can the model do?
• Can inform decisions
• LRFP may be used to analyze development
scenarios
• Analysis can help provide transparency
Key Inputs for a Long-Range
Financial Plan
24

The Outputs are Only
as Good as the Inputs
25
The Results
Revenues
Development Forecast
Expenditures
• Input data is key
• Building a comprehensive,
dynamic and sustainable
model
• Results:
– Recognizable
– Meaningful
– Useful
– Presentable
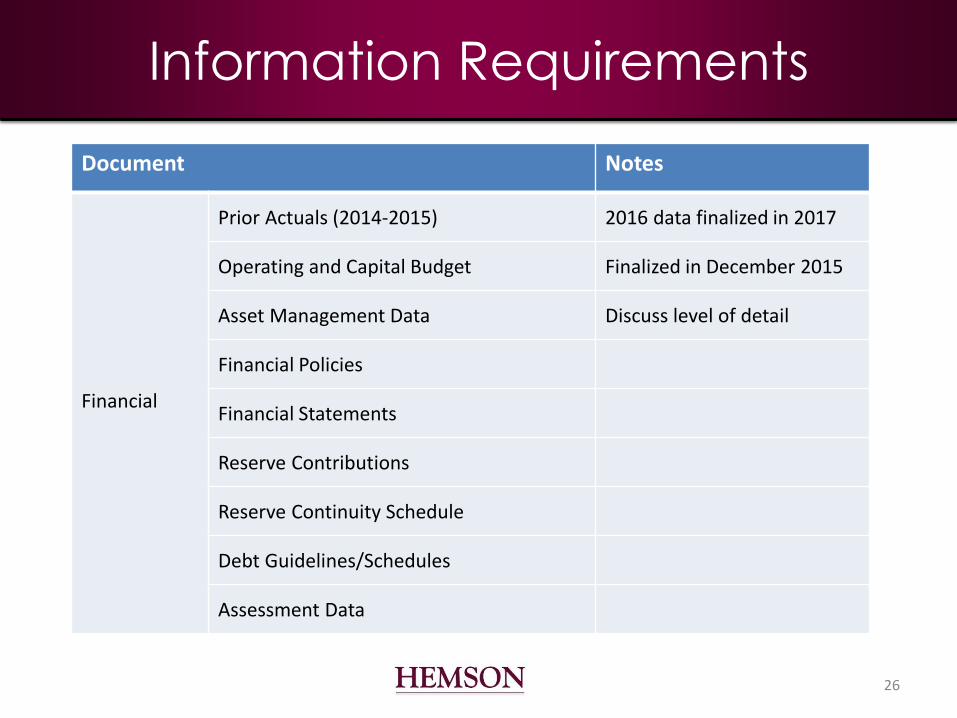
Information Requirements
26
Document Notes
Financial
Prior Actuals (2014-2015) 2016 data finalized in 2017
Operating and Capital Budget Finalized in December 2015
Asset Management Data Discuss level of detail
Financial Policies
Financial Statements
Reserve Contributions
Reserve Continuity Schedule
Debt Guidelines/Schedules
Assessment Data

Revenues
• Assessment – Property taxes
• User fees – Water, wastewater, recreation fees etc.
• Funding from other levels of government – Gas tax, anticipated grants etc.
• Investments – Land
• Relationship to reserves– Transfers to/from
27

Expenditures
• Capital
– New assets and
assumed assets
– Replacements of
assets
28
• Operating – Salaries, wages and benefits
– Contracts and material
– Utilities and fuel
– Insurance
– Professional fees
– Others?

Expenditures
Asset Information
Can generally be split into two categories:
1. Existing assets
▪ Useful life and replacement & rehabilitation cost
provisions
▪ “Minor” repair accounts
2. Future assets (and their annual replacement
rehabilitation provision)
▪ Municipal-funded facilities
▪ Contributed capital
29
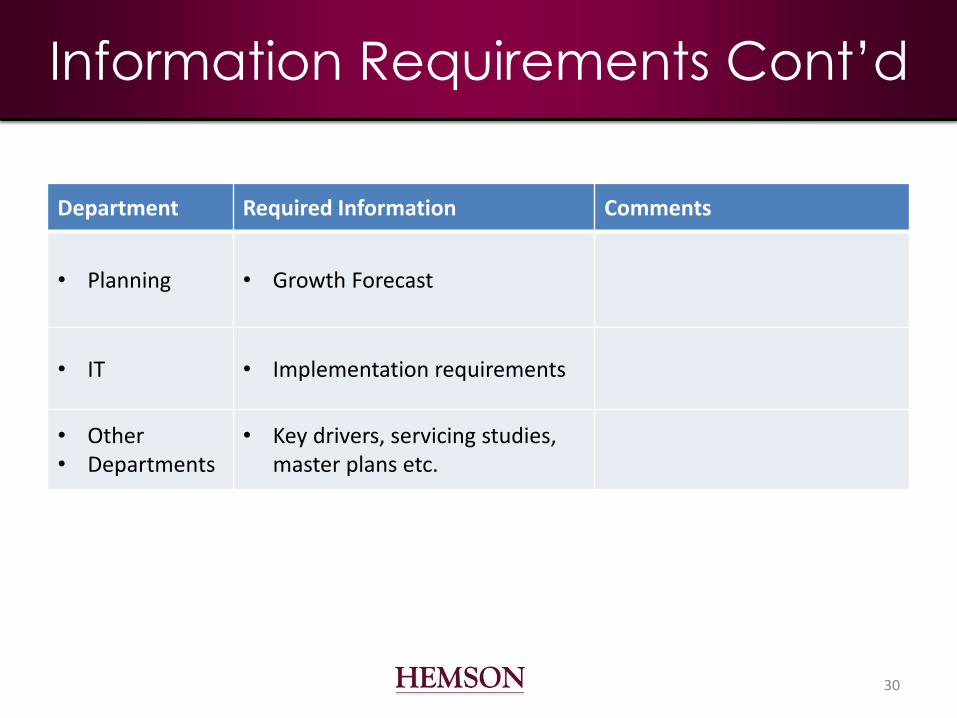
Information Requirements Cont’d
30
Department Required Information Comments
• Planning • Growth Forecast
• IT • Implementation requirements
• Other• Departments
• Key drivers, servicing studies,master plans etc.

Development Forecast
• Population, employment and household growth over an identified period – Typical based on a 10-year or longer
planning period (build-out)
• Ability to incorporate sensitivity testing– Low, medium and high growth scenarios
– Scenarios need to be clearly identified
31

Development Forecast
32
• Growth forecast
is used to inform:
– Assessment
forecast (new
dwelling units
and non-
residential
development)
– DC revenue

The Model
• 10-year demographic, assessment and
utility customer forecast
• Capital Plan
– Growth-related projects
– State of good repair capital
– Regulatory, legislative and strategic projects
• Models based on existing funding methods
and alternative scenarios
• Identify any funding shortfalls
– Mitigating measures
33

Models are Based on Drivers
1. Price or Inflationary Drivers
▪ Increases that occur in the absence of growth
(e.g. salary increases)
2. Volumetric or Demographic Drivers
▪ Incremental increases as new people /
infrastructure are added (e.g. incremental hiring
of new staff due to population growth)
3. Induced Drivers
▪ Shock event due to assumption of major facility or
legislative charge (e.g. Hire 20 firefighters for new
fire station)
34

Modeling the Key Drivers
Cost Centre Drivers:• Growth and demographic-related
factors
• Regulatory and Legislative Changes
• Service Level/Strategic Changes
Account Based Drivers:• Apply to all cost centres
• Often inflationary changes that would
occur in the absence of growth e.g.
salary increases
Capital Induced Drivers: • Often large-scale DC funded projects
• May also be tax supported e.g. Admin
expansion
Debt Based:• Modelling of previous and anticipated
commitments
35
Example: Software Based LRFP

Volume and Capital Induced
Operating Expenditures 2016-2025
36
Operating expenditures associated to new development and population
growth.
Operating
expenditures associated with operation of new facilities.

LRRP Challenges
• Limited tax room available for municipalities
(revenues do not grow with economy)
• Capital replacement competing with increased
operating expenditures (e.g. labour settlements)
• Funding in-year capital works while saving for
future capital replacement
• Which capital projects should be carried out?
• Hard versus soft infrastructure
• Internal and Provincial debt limits
37

Group Discussion #2
38

Small Group Discussion # 2:
LRFP Approaches & Funding Strategies
• Long-Range financial planning
• What is your municipality doing?
• E.g. multi-year capital and operating budgets
• Ways of addressing infrastructure gap
through funding strategies
• What is your municipality doing?
• E.g. dedicated tax levy funding
39

Group Discussion:
How do you do Long Range Planning?
40
Strategy Pros Cons
Multi-Year Budgeting
Excel models
Software models
Needs Studies/Master
plans/Condition Assessments
Strategic Plans

Group Discussion:
Funding Strategies
41
Strategy Pros Cons
Dedicated funding from tax levy or
utility rates
User fee surcharge (e.g. parks and
recreation)
Funds set aside as new assets are
added or replaced
Pay-as-you-go
Debt
Senior grants
Developer contribution (in-kind or
part of planning agreements)
Local Improvement/CIP
Public Private Partnerships

Group Discussion:
How do you do Long Range Planning?
42
Strategy Pros Cons
Multi-Year Budgeting -Helps address long term
needs
- Council buy-in
- Departmental staff time
Excel models - Control
- Easy to administer
- Suitable for small
municipalities
- Staff time
- Typically single user
Software models - Multi-user
- Dynamic
-May not be suitable for
small municipalities
Needs Studies/Master
plans/Condition Assessments
-Helps identify future
requirements and gaps
- Timely process
Strategic Plans - Identify municipal
priorities
- Involves public
consultation
- Timely process

Group Discussion:
Funding Strategies
43
Strategy Pros Cons
Dedicated funding from tax levy or utility rates
- % of tax levy
- % of pure asset management based provisions
-High degree of control -Council and communityopposition
-Timing
User fee surcharge (e.g. parks and rec)
-Main users of facilities contribute higher share of project cost
- Could place higher burden of costs on less fortunate residents
Funds set aside as new assets are added or replaced
- Prevents the funding gap from getting worse
-Optics of putting funds away for new projects when there are many older facilities requiring short-term replacement
Pay-as-you-go -Can work in municipalities where assets were emplaced over a long period of time
- Subject to inconsistent fiscal pressures (e.g. spikes in capital)
Debt- e.g. policy to limit (non-DC) debt to asset replacements
- Can address short-term problems
-Limits ability of municipality to respond to emergencies

Group Discussion:
Funding Strategies
44
Strategy Pros Cons
Senior grants - Reduce local tax/rate
impact
- “Only one taxpayer”
- Unreliable
Developer contributions (in-kind
or part of planning agreements)
- Reduce local tax/rate
impact
- Not guaranteed
- Appealable to OMB in
some cases
- May pass on to new
homeowners
Local Improvements/CIP - Legislative basis
- Long historic use
(recognized)
- Easily implemented
- Is it appropriate for asset
replacement?
- Not applicable for large
municipal infrastructure (i.e.
water treatment plant)
Public Private Partnerships - Cost and risk is distributed
- Operating costs can be
lower in some cases
- Less control over project
- Legal and admin elements

Common Findings
45

Common Findings
Operating Costs:
▪ Salary, wage and benefit drivers tend to dominate all other operating costs
▪ Opportunities for savings/efficiencies is limited without significantly affecting service levels
▪ Cost of providing municipal services tends to grow quicker than the CPI across Canada
46
2017 2018 2019 2020 2021 2022 2023 2024 2025 2026
Consumer Price Index Salaries & Wages
Municipal Price Index

Common Findings:
Property Tax Funding Gap
47
In Year
Funding Gap
Cumulative
Deficit

Town Purpose: Residential Property
Tax Rate
48

Addressing the Funding Gap
49
• Often the current municipal fiscal state is very good
• However if existing property tax rates are not increased, in a real
sense, there would be a funding gap
• Options for addressing short-term funding gap
• Real property tax increases
• Modify the capital program
• increase debt level
• delay capital works
• partnerships (inter-municipal, P3s, developers)
• review fees and development charges

$0
$10,000
$20,000
$30,000
$40,000
$50,000
$60,000
$70,000
$80,000
$90,000
2016 2017 2018 2019 2020 2021 2022 2023 2024 2025
Mill
ion
s
Residential Assessment Non-Res Assessment
Common Findings:
Assessment Base Shifts
50
2015 Assessment Ratio Comparison (Weighted)
Property Class Brampton Mississauga Caledon Markham Vaughan Oakville Burlington Toronto Average
Residential 77% 69% 82% 82% 75% 80% 75% 58% 75%
Commercial/Office 17% 25% 12% 15% 18% 16% 19% 39% 20%
Industrial 5% 6% 6% 2% 8% 4% 6% 3% 5%
Total 100% 100% 100% 100% 100% 100% 100% 100% 100%
Residential
assessment value:
$59.7 billion
Non-residential
assessment value:
$12.6 billion
Anticipated
assessment
growth of approx.
3% per year

Common Findings
Revenue:
▪ Property taxes are overwhelmingly the most important revenue source
▪ New developments tend to have higher assessments than the existing community
▪ Attracting non-residential development, and its higher weighted assessment, is a key objective
51
Figure 10
City of Leduc
Total Assessment and Non-Residential Share
0.00%
5.00%
10.00%
15.00%
20.00%
25.00%
30.00%
$0
$1
$2
$3
$4
$5
$6
$7
$8
$9
$10
Bil
lio
ns
Total Assessment Non-Res Share of Total Assessment
City of Leduc, 2014Assessment Forecast

Sample Policy Recommendations
Assessment Shares
Promote Ongoing Economic Growth
• Set a reasonable residential : non-residential assessment
ratio target and incorporate into all planning and
economic development strategies
• Strengthen and clarify employment land conversion
policies
• Develop a Community Improvement Plan geared toward
identifying and attracting key employment sectors
• Continue to work with local businesses and associations to
identify and address barriers to business activity and
growth
52

Common Findings:
Opportunities to Increase Revenues
53
• User fees are an
important revenue
source:
– Represented $150 million or 25% of total tax supported revenues in 2016
– Transit fares account for the largest proportion of user fee revenues (40%)
• Relatively low recreation
user fee revenues
– Important to consider ability
to pay principles and the qualitative value to residents
Recreation User Fee Revenue Per Capita (2015 FIR)
$28
$35
$60
$41
$31
$44
$58
$20
$0
$10
$20
$30
$40
$50
$60
$70

Common Findings
Capital Costs:
▪ Virtually no municipalities are meeting fully
calculated asset management requirements
▪ Dedicated infrastructure levy tax increases have
received more support from Council and taxpayers
than we anticipated
▪ New development can help address problems in
short-term but may add to problem in long-range
▪ Despite these shortfalls, most Canadian municipalities
are generally fiscally sustainable
54

Example: Infrastructure Gap
55
$-
$10
$20
$30
$40
$50
$60
$70
2016 2017 2018 2019 2020 2021 2022 2023 2024 2025 2026 2027 2028 2029 2030 2031 2032 2033 2034 2035
Mill
ion
s
Required Provisions vs. Cumulative Infrastructure Gap (Tax Funded Services)
Required Capital Provisions Forecasted Provisions Cumulative Deficit
Town of Georgina, 2016 findings:
▪ Infrastructure gap expected to grow
▪ 1% capital tax levy would reduce the infrastructure deficit by
about $9.8 million over the 20-year forecast

Key Findings: Asset Management
56
0
$100M
$200M
$300M
$400M
$500M
$600M
$700M
0
$50M
$100M
$150M
$200M
$250M
$300M
Infr
astr
uct
ure
Gap
($
In M
illio
ns)
Req
uir
ed In
vest
men
t ($
In M
illio
ns)
Investment Year
Total Required Investment Total Planned Budget Total Cumulative Gap
Overall Infrastructure Gap Forecast
Current contribution
levels are inadequate to
fully fund capital
requirements Contributions reach
sustainable level

Sample Policy Recommendations
Asset Management
Maintain the City’s Infrastructure Assets
• At a minimum, maintain infrastructure levy increases of 2%
of the tax levy per year
• Undertake Department Asset Management Plans and define service levels under each service area
• Partner with other private or public organizations where
possible
• Explore opportunities for new Federal, Provincial, or third
party funding
57

Common Findings
Capital Costs (cont.):
▪ Capital forecasts likely have more risk than
operating forecasts
▪ Increasing environmental regulation / climate
change
▪ Requirement for more urban amenities
▪ Emerging technology e.g. automated vehicles
▪ Variability of federal and provincial/state grants
▪ Pressure to front-end infrastructure despite risk of
housing bubble in many Canadian markets
58

Debt and Reserves: Identifying
Capital Impacts and Funding Options• Model allows for
sensitivity testing
of capital funding
options
– Debt, reserves,
grants
• Debt mitigates
impacts on
reserves
• Method helps
identify major capital impacts and how to
address them59
Capital Program
Transfers to
Reserves from
Operating
Debt (Debenture
Proceeds)
External
Contributions
(Gas tax)
Capital Reserves

Example: Debt Capacity Forecast
60
Town of New Tecumseth, 2016

Example: Development Charges
Reserve Fund Forecast
61

Case Studies
62
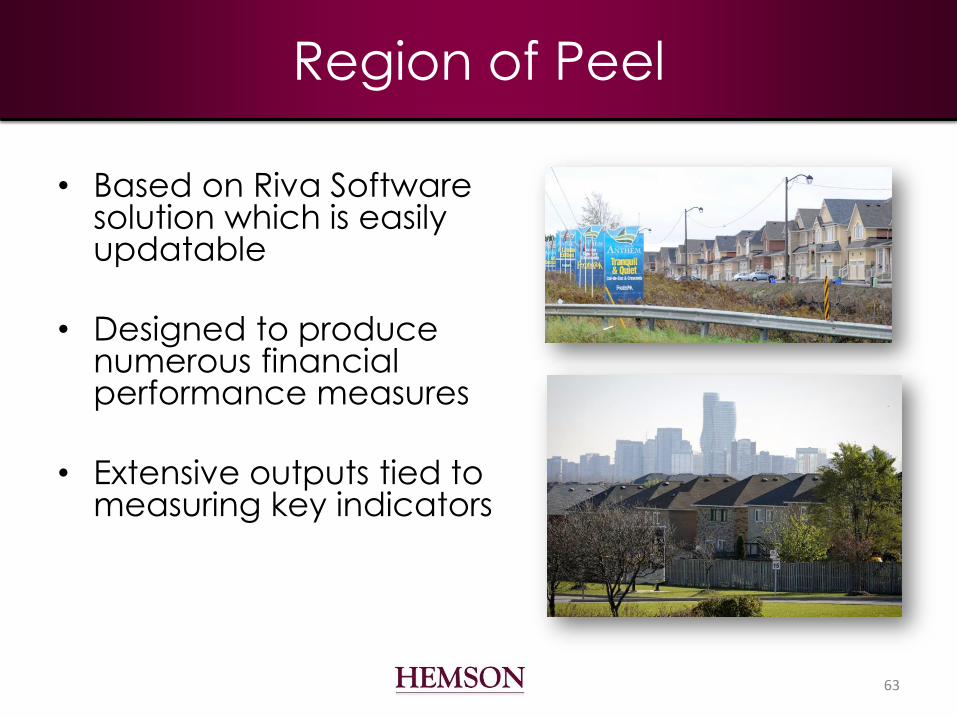
Region of Peel
• Based on Riva Software solution which is easily updatable
• Designed to produce numerous financial performance measures
• Extensive outputs tied to measuring key indicators
63

City of Brampton
Reason for Analysis
• Significant capital investments under consideration:– Higher-order transit projects
– New university campus
– Major parks projects
• Examined over 10-year planning period
64

City of Brampton
Key deliverables • Report
• Financial model
Analysis included• Benchmarking analysis
• Review of current practices
• Anticipated revenue and expenditures
• Debt management practices
65

City of Brampton
Key directions and policy recommendations
• Make decisions on capital investments based on strategic priorities and financial impacts:
– Develop a 10-year capital forecast
– Make use of capital project prioritization metrics
• Continue the use of reserves and reserve funds:
– Consider the use of existing discretionary reserve fund balances to fund major economic development initiatives
• Explore opportunities for alternative revenue tools:
– Work with AMO and other municipalities to secure permissions similar to those provided under the City of Toronto Act
• Consider issuing debt for major long-term assets:
– The City’s very low debt levels provide opportunities to expand on debt in a financially sustainable manner
66

City of Leduc
Deliverables
• Written report
• Excel based financial model
Key findings
• Current identified operating and capital obligations can be funded with manageable tax revenue increases
• City benefits from a relatively strong residential : non-residential assessment ratio, attracting further non-residential growth may be a challenge
• Available debt capacity to address most unforeseen needs
• Expenditures are generally lower than calculated needs
67

City of Leduc
Key Recommendations
• Target Non-Residential Growth
– Encourage all types of non-residential land uses
– Ensure future boundary expansions consider future assessment ratios
• Capital Infrastructure Funding
– set off-site levies annually
– Maximize “local service” recoveries
– Use of debt
• Reserves & Asset Management
– Enhance existing reserve fund policies
– Move toward a condition-based asset management system
68

Case Study:
Town of Innisfil
69
Key Recommendations
• Manage Capital Assets in State of Good Repair
– Make provision for potential OLG funding loss through continued use of 1% capital levy
• Use DC Funds as Planned
– Monitor amount, location and timing of development and make appropriate adjustments to growth-related capital program
– Closely monitor fiscal impact of development in key planning areas
• Continue Strategic Use of Reserve and Reserve Funds
– Regularly review the status, need and policies for reserves and reserve funds

Questions on case studies?
70

Key Performance Measures
71

Critical Performance Measures:
1. Annual Debt Repayment Limit
72
What does it measure? Why is it important?
• Measures the debt capacity available
to a municipality to take on additional
debt relative to the provincially
mandated limit
• Available through Schedule 81 of the
FIR

Critical Performance Measures:
2. Net Debt to Net Own Source Revenue
73
What does it measure? Why is it important?
• Measures the debt capacity currently
in use relative to the provincially
mandated limit of 25% of net revenue
• Available through Schedule 81 of the
FIR

Critical Performance Measures:
3. Current Infrastructure Deficit
74
What does it measure? Why is it important?
• Measures the theoretical current gap
between available funding for capital
and the actual capital expenditure
requirements
• Useful to compare the theoretical
requirement with actual budgeted
spending

Critical Performance Measures:
4. User Fee Revenues as a % of Expenditures
75
What does it measure? Why is it important?
• Measures the fee recovery rate for
services funded through user fees
• Can be used to compare the funding
gap for fee related services such as
transit or recreation services

Other Performance
Measures to Consider
76
Indicators Rationale Examples
Gas Tax Project
Outcomes and
Project Output
Indicators
• Required as part of the
Federal Gas Tax Agreement
• Service level/performance
measures can be used to
measure the effectiveness of
asset management initiatives
• Full list available at
www.amo.on.ca
• Length of paved roads rated
as good and above (lane km)
• Number of residents with
access to new, rehabilitated
or replaced water distribution
pipes
• Number of residents who will
benefit from investment in
recreational infrastructure
Municipal
Performance
Measurement
Program
(MPMP)
• Data is readily available
through budgets and
historical actuals
• Although the MPMP was
discontinued in 2014, historical
data is available
• Full list available at
efis.fma.csc.gov.on.ca
• Operating costs for winter
maintenance of roadways
per lane km maintained in
winter
• Operating costs for treatment
and disposal of wastewater
per megalitre

Key Takeaways
The key value of undertaking a LRFP:
▪ Ties together various financial reports and policies into
one comprehensive plan
▪ Identification of strengths, weaknesses and
opportunities over a long-term horizon
▪ Allows for the ability to test the financial impact of key
Council and staff decisions
▪ LRFP model should be easily updatable to consider
the evolving asset management data and funding
priorities
77

Discussion
Questions?
78