workplace health and safety survey programme · workplace health and safety survey programme: 2005...
TRANSCRIPT
WORKPLACE HEALTH AND SAFETY SURVEY PROGRAMME
2005 EMPLOYER SURVEY FIRST FINDINGS REPORT
S D Clarke PhD, S Webster MMathStat, J R Jones MSc, A J Blackburn PGDip, and J T Hodgson MSc.
WORKPLACE HEALTH AND SAFETY SURVEY PROGRAMME: 2005 EMPLOYER SURVEY FIRST FINDINGS REPORT S D Clarke, S Webster, J R Jones, A J Blackburn, and J T Hodgson
ABSTRACT
The report presents first findings from the 2005 WHASS Employer survey of 966 workplace health and safety managers. The main findings follow. All figures are estimates and some estimates are based only on workplaces with more than 25 workers: this is not highlighted in the bullet points below but is mentioned in the main text.
• Almost all (98%) workplaces kept records of employee accidents and over a third (40%) of workplaces kept records of work-related ill health among their employees. Nearly all workplaces (93%) kept records of employee sickness absence.
• Nearly all (90%) workplaces routinely investigated the causes of work accidents and nearly all (94%) who keep records or are aware of cases, investigated the cause of work-related illnesses. However, there are reasons to believe these may be over-estimates due to social desirability bias.
• Injury rates per 100,000 employees included an estimated 23 fatal injuries, 127 major injuries and a further 604 injuries causing more than 3 days absence from work. The estimated rate of work-related ill health in the last 12 months was 751 cases per 100,000 employees.
• Work-related injuries led to an estimated 18,000 days off work per 100,000 employees and work-related ill health accounted for another estimated 14,000 days off per 100,000 employees in the last 12 months.
• When asked to identify common or severe risks in the workplace, unprompted, two risks stood out as most prevalent: slipping and tripping, and lifting or carrying weights by hand. When prompted, the most common risks identified in the workplace were slipping or tripping (74% of workplaces), lifting or carrying (67%), stress (57%) and PC usage (54%).
• A majority (85%) of smaller workplaces regularly discussed health and safety with their workforce.
• Virtually all larger workplaces (99%), had a written health and safety policy, and nearly all (96%) of these had documented procedures for implementing this policy. Over half of workplaces produced an annual report, which in 71% of cases included a report on health and safety.
• Just over half (52%) of workplaces had arrangements in place to support return to work of workers on long-term sickness absence.
i

For information about health and safety ring HSE’s Infoline Tel: 0845 345 0055 Fax: 0845 408 9566 Textphone: 0845 408 9577 e-mail: [email protected] or write to HSE Information Services, Caerphilly Business Park, Caerphilly CF83 3GG. © Crown copyright This publication may be freely reproduced, except for advertising, endorsement or commercial purposes. First published 11/05. Please acknowledge the source as HSE. A National Statistics publication National Statistics are produced to high professional standards set out in the National Statistics Code of Practice. They undergo regular quality assurance reviews to ensure that they meet customer needs. They are produced free from any political interference.
ii

ACKNOWLEDGEMENTS
We would like to thank the British Market Research Bureau for undertaking this survey.
We would also like to thank all members of the HSE who contributed to the development of the questions for the WHASS survey programme. These included: Ahsan Saleem, Alan Morley, Alan Osborne, Alan Spence, Alan Topping, Alberto Pompermaier, Allan Davies, Allan Sefton, Alun Williams, Amy Holmes, Andie Michael, Andrew Cottam, Andrew Smith, Andrew Strawson, Andy Phillips, Andy Weyman, Ann Brazier, Ann Harrington, Anne Morley, Anne Sharp, Anne Wilson, Arwel Barrett, Bal Chaggar, Baljit Sahota, Bill Gillan, Bill MacDonald, Bob Rajan, Bob Tunnicliffe, Bob Warner, Brian Coles, Brian Fullam, Carol Grainger, Carole Sullivan, Catherine Jones, Cathy Kerby, Chris Collinson, Chris Findlow, Chris Molde, Chris Quarrie, Chris Rowe, Chris Taylor, Chris Willby, Clare McNicholas, Colin Mackay, Colin Potter, Colleen Bowen, Damien McElvenny, Dan Mitchell, Dave Rickwood, David Ashton, David Goodchild, David Legge, David Lewis, David Pascoe, David Pennie, David Sowerby, Delyth Dyne, Donald Goodhew, Edward Marshall, Elizabeth Gyngell, Evan Bale, Fiammetta Gordon, Francis McGuigan, Frank Perkins, Geoff Cox, Gordon Macdonald, Graeme Walker, Graham Collins, Graham Stevens, Graham Watson, Gwyneth Deakins, Harvey Wild, Ian Crawford, Ian Greenwood, Ian Travers, Ingrid Summersgill, Isla Fraser, Jacqui Bailey, Jane Willis, Jane Young, Jayn Johnson, Jeremy Bevan, Jim Skilling, Jim Stancliffe, Jo Walker, John Cullen, John Furlong, John Hampton, John Ives, John McGuinness, John Price, John Thompson, John Worth, Jonathan Russell, Josephine Gravell, Judith Reilly, Julia O'Hara, Julia Soave, Julian Delic, Kate Timms, Kath Martin, Katie Cappello, Keith Broughton, Keith Wiley, Keith Wilson, Kevin Myers, Laura Whitford, Len Morris, Linda Varney, Linda Williams, Liz Gibby, Louisa McNamara, Louise Brearey, Luke Le Rendu, Malcolm Darvill, Marcia Davies, Mark Dempsey, Martin Davies, Martin Holden, Matthew Holder, Matthew McCabe, Maureen Disson, Maureen Meldrum, Max Walker, Mel Draper, Melanie Phillips, Michael Topping, Michele McDermott, Mike Cosman, Mike Cross, Mike Sebastian, Mike Shepherd, Mike Tonge, Monica Smith, Morris Johns, Murray Devine, Neal Stone, Nicholas Booker, Nick Ratty, Nick Sangha, Nick Summers, Norman Byrom, Paul Beaumont, Paul Brereton, Paul Buckley, Paul Evans, Paul Oldershaw, Paul Wilkinson, Paul Wusteman, Penny Barker, Peter Evans, Peter Mullins, Richard Elliott, Robert Hampton, Robert Parkes, Robert Paterson, Roger Nourish, Roger Rawbone, Ron Bell, Ron Gardner, Ron McCaig, Rosanna Cousins, Sally Williams, Shelagh Molloy, Shirley Parry, Simon Pilling, Simon Thornhill, Simon Warne , Stefan Sanchez, Stephen Taylor, Stephen Wright, Steve Coldrick, Steve Fairhurst, Steve Pointer, Steve Walker, Steve Whetton, Steve Wood, Stewart Campbell, Stuart Bristow, Susan Mawer, Taf Powell, Teresa Quinn, Terry Rose, Tim Harris, Tom Taylor, Toni Drury, Tony Bandle, Tony Hetherington, Tony Mulhall, Trevor Allan, Trevor Shaw, Will Pascoe. Plus all not listed who contributed through their programmes or teams.
Thanks to those outside HSE consulted on questionnaire development: Professor David Coggon, Professor Richard Ennals, Dr Mark J Nieuwenhuijsen, Dr Lesley Rushton, Dr Keith Palmer, Professor Raymond Aguis and the THOR team.
Thanks to those involved in the project management and administration: Claire Huxtable, Dave Dillon, Helen Goddard, John Osman, Katharine Abba, Tony Webster, Tracy Hamilton, Vicky Warbrick.
Thanks to members of the Board that steered the WHASS programme: Brian Etheridge, David Riley, John Ewins, Paul Davies, Peter Brown, Phil Scott, Richard Clifton, Vic Coleman, John Ewins, Nick Dyson (DWP).
Thanks to those involved in production of this report: Tracy Vane and Lesley Clark
Most of all we would like to thank employers and their Health and Safety managers who gave their time to take part in this survey.
iii

CONTENTS Page
List of figures and tables
v
1. Introduction 1 2. Work-related injuries and ill health 2.1 Recording 2.2 Investigation 2.3 Estimates 2 3. Sickness absence 3 3.1 Recording 3.2 Use 3.3 Estimates
4
4. Risk prevalence and risk assessment
6
5. Health and safety management
9
6. Rehabilitation and occupational health 10 7. Health and safety climate
11
8. Costs
12
9. Workplace composition
13
Text references 14 Annex A: Detailed tables of statistics 15 Part A1: Univariate tables Part A2: Cross-tabulations by workplace size and sector
(private/public):111
Annex B: Supplementary methodological details 131 Part B1: Derived variables for analysis of WHASS employer
survey
Part B2: Alterations to original weighting and stratification scheme 134 Part B3: Data limitations 137
iv

LIST OF FIGURES AND TABLES Page Figures in text Figure 1 Percentage keeping sickness absence records by workplace
size4
Figure 2 Uses of sickness absence data by sector 4 Figure 3 Percentages reporting more action needed by risk control score 7 Figure 4 Risk control score for prompted and unprompted risks 8 Tables in text Table A Estimated rates of key survey outcome events 2 Table B Estimated rates of days lost by outcome event 5 Table C Estimated percentage of respondents reporting a risk ,
unprompted, as one of the three most common or severe risks in British workplaces
6
Table D Estimated percentage reporting having reviewed risk assessments within given time periods
8
Table E Estimated percentage of respondents consulting various sources of advice and information, by workplace size
10
Table F Estimated percentage of respondents strongly agreeing with statements about health and safety in the workplace, by workplace size.
12
Table G Estimated rate of home and off site workers employed 13
v

1. INTRODUCTION
Workplace Health and Safety Surveys (WHASS) are a suite of employer and worker surveys established by the Health and Safety Executive (HSE) to provide reliable and nationally representative trend information on health and safety hazards, risks and their management in Britain1. These surveys aim to assist measurement of progress towards national health and safety targets2 and provide information that can be used by policy makers and others to improve health and safety in Britain.
This report presents first findings from the 2005 WHASS Employer survey. More detailed analysis and findings from the WHASS Employer survey will be published in 2006, along with findings from the 2005 WHASS Worker survey.
Survey respondents were those with day-to-day responsibility for health and safety at the sampled workplace and a 63% response rate was achieved. Full details of the survey process can be found in the associated survey technical report3. and details of questions are provided in the survey questionnaire4 Supplementary methodological details that differ from, or are in addition to this can be found in Annex B.
The commentary below highlights only central estimates for key findings. Tables of more detailed descriptive statistics with 95% confidence intervals are presented in Annex A. Limitations to these data are outlined in Annex B and where these may influence results brief mention is made in the commentary.
2. WORK-RELATED INJURIES AND ILL HEALTH
2.1 Recording
Almost all workplaces (an estimated 98%) kept records of employee accidents [Table 16], and almost all recorded these in an accident book (90%) [Table 17]. However, only about half (54%) kept records of employee injuries that occurred while an employee was working off site [Table 16].
Records of near misses (defined as hazardous situations not causing injury or ill health but with the potential to do so), were kept by an estimated 63% of those workplaces with 25 or more employees [Table 18].
Over a third (40%) of workplaces kept records of cases of work-related illness among employees [Table 16].
2.2 Investigation
An estimated 90% of those workplaces with over 25 workers routinely investigated the causes of work accidents [Table 19] with most of these (82%) always investigating [Table 20]. Of those workplaces that routinely investigated accidents, a high percentage (82%) had formal structures and procedures to support this investigation [Table 21]. Further, when prompted with a list of actions corresponding with good practice in accident investigation, even higher percentages of these workplaces report undertaking these in their investigation [Table 21].
1

Similarly high percentages of investigation were seen for work-related illness. Of workplaces with over 25 employees that kept records or were aware of cases in the last 12 months, an estimated 94% said they investigate the causes of work-related illness [Table 26]. Again, as for accidents, when prompted with a list of actions corresponding with good practice a high percentage of these workplaces report undertaking these actions in investigation of work-related illness [Table 27].
There are reasons to believe that the estimated proportion of workplaces investigating accidents and ill health and the proportions reporting investigation processes were over estimated in this survey. This is because the proportions appear very high and also because the questions are asked on behalf of the regulator and relate directly to the respondent’s role. Further, with investigation processes, respondents are given a list of obviously good things that should be done. These factors suggest some respondents may be providing a socially desirable response that would bias the estimates upwards.
2.3 Estimates Table A. Estimated rates of key survey outcome events* Outcome events Rate per 100,000
employees(95% Confidence Interval)
Fatal accidents
23 (9, 37)
Major accidents
127 (64, 190)
Over 3 day accidents
604 (499, 709)
Near miss incidents 22,700 (0, 59,600)
Near miss incidents with the potential to cause death or serious injury
245 (149, 340)
Employees with work-related illness in the last 12 months
751 (549, 952)
* Further details of the frequency of these outcome events can in annex A Table 24 (injuries), Table 28 (near miss incidents), and Table 30 (work-related ill health)
Table A. shows the rates of various outcomes estimated from this survey. In total 28 fatal injuries were reported by the 966 workplaces surveyed. This equates to an estimated 23 fatal injuries per 100,000 employees [Table A]. This is much larger than the 2004/05 RIDDOR5 estimate of 0.7 fatal injuries per 100,000 employees. However, fatal injuries are rare and these estimates are sensitive to a small change in reported numbers. It is possible that because of the dramatic and memorable nature of fatal injuries, respondents to the survey are including those that fall outside
2

the survey’s reference frame. For example fatalities that occurred within their organisation but not at this particular workplace, or occurred among staff that were not their direct employees, or those not occurring within the previous 12 months. All these factors could inflate the reported number that would cause an over estimate of the rate.
The estimated rate of major injuries from this survey was 127 per 100,000 employees. This is more comparable to 2004/05 estimates from RIDDOR, which indicate 118 major injuries per 100,000 employees. The estimated rate of over-three day injuries was 604 per 100,000 employees, which is again similar in order to the 2004/05 RIDDOR estimate of 469 minor injuries per 100,000 employees.
Estimates for near miss incidents indicate 22,700 incidents per 100,000 employed, with an estimated 245 of these incidents per 100,000 employees having the potential to cause death or serious injury. It should be noted that there are difficulties with the near miss rate. A near miss could affect more than one employee so the rate is necessarily an underestimate of the risk of any single employee being exposed to a near miss. Further the very wide confidence intervals indicate the estimates are imprecise and less reliable compared to the other rates. This is because a few workplaces reported a very large number of near misses. These may be recording very minor incidents as near misses. This highlights the further problem of no clearly or widely understood definition of a near miss event.
The estimated rate of work-related ill health in the last 12 months from this survey of employers was 751 cases per 100,000 employees. This is considerably lower than the estimated incidence rate of self-reported work-related ill health among those working in the last 12 months from SWI04/056 of 1800 per 100,000 workers. Further, the reported instances of ill health in this survey may include cases for which the ill health began prior to the last 12 months. This would invite a comparison with the SWI04/05 prevalence rate, estimated as 4200 cases per 100,000 workers employed in the last 12 months. Employers not being aware of all cases of work-related ill health and/or, not accepting in many cases the workers view that such cases are related to work could explain the lower estimates from this survey.
In the above rate estimates from this employer survey, some over-estimation is possible because the number of events relates to the last 12 months whereas the numbers of employees is given by the number on the payroll at one point in time, not the number employed over the last 12 months.
3. SICKNESS ABSENCE
3.1 Recording
Nearly all workplaces, an estimated 93%, kept records of employee sickness absence [Table 12]. As shown in figure 1 small single-site workplaces were slightly less likely to keep these records (88%) than large workplaces (99%), medium (98%) and even small multi-site workplaces (97%) [Table C2]. There was no difference in employee sickness absence record keeping between public and private sector workplaces.
3
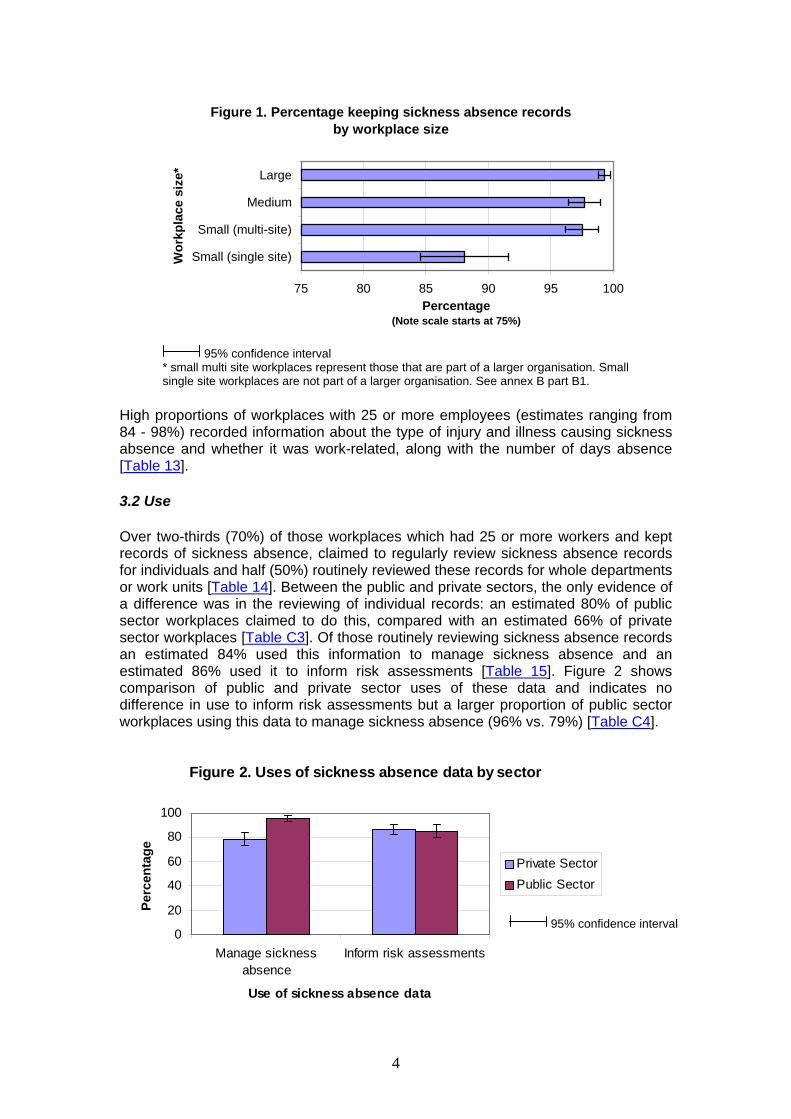
Figure 1. Percentage keeping sickness absence records by workplace size
75 80 85 90 95 100
Small (single site)
Small (multi-site)
Medium
LargeW
orkp
lace
siz
e*
Percentage(Note scale starts at 75%)
High proportions of workplaces with 25 or more employees (estimates ranging from 84 - 98%) recorded information about the type of injury and illness causing sickness absence and whether it was work-related, along with the number of days absence [Table 13].
3.2 Use
Over two-thirds (70%) of those workplaces which had 25 or more workers and kept records of sickness absence, claimed to regularly review sickness absence records for individuals and half (50%) routinely reviewed these records for whole departments or work units [Table 14]. Between the public and private sectors, the only evidence of a difference was in the reviewing of individual records: an estimated 80% of public sector workplaces claimed to do this, compared with an estimated 66% of private sector workplaces [Table C3]. Of those routinely reviewing sickness absence records an estimated 84% used this information to manage sickness absence and an estimated 86% used it to inform risk assessments [Table 15]. Figure 2 shows comparison of public and private sector uses of these data and indicates no difference in use to inform risk assessments but a larger proportion of public sector workplaces using this data to manage sickness absence (96% vs. 79%) [Table C4].
Figure 2. Uses of sickness absence data by sector
0
20
40
60
80
100
Manage sicknessabsence
Inform risk assessments
Use of sickness absence data
Perc
enta
ge
Private SectorPublic Sector
95% confidence interval * small multi site workplaces represent those that are part of a larger organisation. Small single site workplaces are not part of a larger organisation. See annex B part B1.
4
95% confidence interval
As with incident investigation there may be some bias caused by respondents providing socially desirable responses, especially with respect to use of sickness absence data to inform risk assessments. The proportions appearing very high suggest this. Further, the questions are asked on behalf of the regulator and in terms of using sickness to inform risk assessments, they relate directly to the respondent’s role.
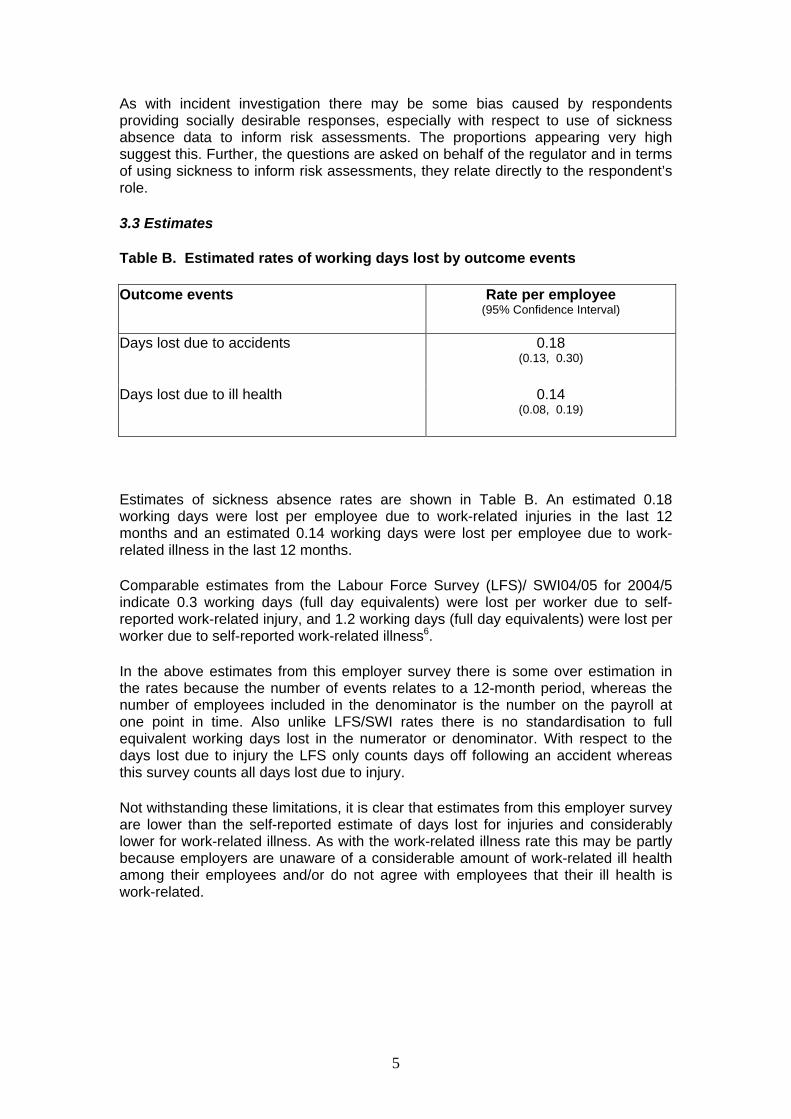
3.3 Estimates Table B. Estimated rates of working days lost by outcome events Outcome events Rate per employee
(95% Confidence Interval)
Days lost due to accidents
0.18 (0.13, 0.30)
Days lost due to ill health
0.14 (0.08, 0.19)
Estimates of sickness absence rates are shown in Table B. An estimated 0.18 working days were lost per employee due to work-related injuries in the last 12 months and an estimated 0.14 working days were lost per employee due to work-related illness in the last 12 months.
Comparable estimates from the Labour Force Survey (LFS)/ SWI04/05 for 2004/5 indicate 0.3 working days (full day equivalents) were lost per worker due to self-reported work-related injury, and 1.2 working days (full day equivalents) were lost per worker due to self-reported work-related illness6.
In the above estimates from this employer survey there is some over estimation in the rates because the number of events relates to a 12-month period, whereas the number of employees included in the denominator is the number on the payroll at one point in time. Also unlike LFS/SWI rates there is no standardisation to full equivalent working days lost in the numerator or denominator. With respect to the days lost due to injury the LFS only counts days off following an accident whereas this survey counts all days lost due to injury.
Not withstanding these limitations, it is clear that estimates from this employer survey are lower than the self-reported estimate of days lost for injuries and considerably lower for work-related illness. As with the work-related illness rate this may be partly because employers are unaware of a considerable amount of work-related ill health among their employees and/or do not agree with employees that their ill health is work-related.
5
4. RISK PREVALENCE AND RISK ASSESSMENT
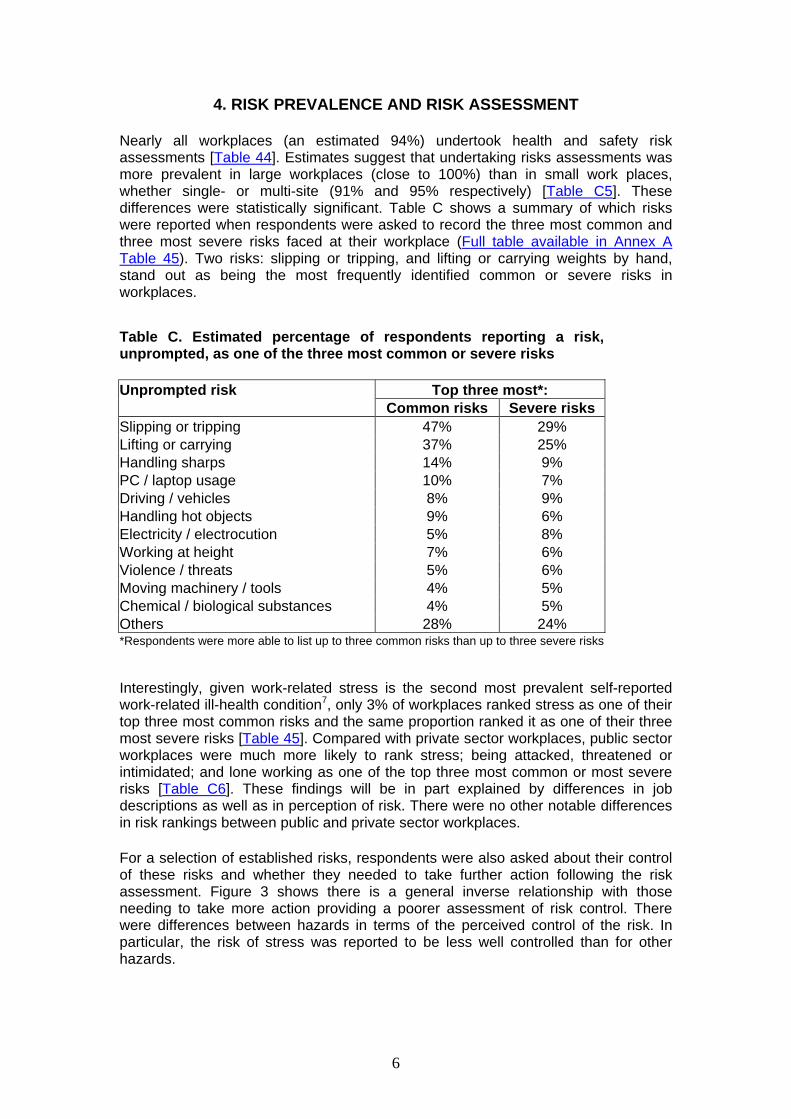
Nearly all workplaces (an estimated 94%) undertook health and safety risk assessments [Table 44]. Estimates suggest that undertaking risks assessments was more prevalent in large workplaces (close to 100%) than in small work places, whether single- or multi-site (91% and 95% respectively) [Table C5]. These differences were statistically significant. Table C shows a summary of which risks were reported when respondents were asked to record the three most common and three most severe risks faced at their workplace (Full table available in Annex A Table 45). Two risks: slipping or tripping, and lifting or carrying weights by hand, stand out as being the most frequently identified common or severe risks in workplaces.
Table C. Estimated percentage of respondents reporting a risk, unprompted, as one of the three most common or severe risks
Top three most*: Unprompted risk Common risks Severe risks
Slipping or tripping 47% 29% Lifting or carrying 37% 25% Handling sharps 14% 9% PC / laptop usage 10% 7% Driving / vehicles 8% 9% Handling hot objects 9% 6% Electricity / electrocution 5% 8% Working at height 7% 6% Violence / threats 5% 6% Moving machinery / tools 4% 5% Chemical / biological substances 4% 5% Others 28% 24% *Respondents were more able to list up to three common risks than up to three severe risks
Interestingly, given work-related stress is the second most prevalent self-reported work-related ill-health condition7, only 3% of workplaces ranked stress as one of their top three most common risks and the same proportion ranked it as one of their three most severe risks [Table 45]. Compared with private sector workplaces, public sector workplaces were much more likely to rank stress; being attacked, threatened or intimidated; and lone working as one of the top three most common or most severe risks [Table C6]. These findings will be in part explained by differences in job descriptions as well as in perception of risk. There were no other notable differences in risk rankings between public and private sector workplaces.
For a selection of established risks, respondents were also asked about their control of these risks and whether they needed to take further action following the risk assessment. Figure 3 shows there is a general inverse relationship with those needing to take more action providing a poorer assessment of risk control. There were differences between hazards in terms of the perceived control of the risk. In particular, the risk of stress was reported to be less well controlled than for other hazards.
6

Figure 3. Unprompted risks: Percentages reporting more action needed and risk control score
0%
20%
40%
60%
80%
Stre
ss
Viol
ence
Rep
etiti
ve a
ctio
nsLi
fting
or c
arry
ing
PCs
Hei
ghts
Slip
ping
or t
rippi
ng
Vehi
cles
Dus
ts &
fum
esC
hem
ical
/bio
logi
cal
Vibr
atio
n to
han
ds
Perc
enta
ge
50
60
70
80
90
Ris
k co
ntro
l sco
re
% needing more action Risk control score unprompted (0=poor control to 100=excellent control)
Rthsidfrtrou
WpSupr
Swismuh
90% confidence interval
espondents were asked when they last reviewed their risk assessments for any risk ey had identified as a common or severe risk in their workplace. Responses were
imilar across types of risk, and differed little according to whether the risk had been entified as common or severe. Table D shows responses for the three most equently reported risks: PC/Laptop usage; lifting and carrying; and slipping and ipping. Risk assessments are reported to be continuously reviewed in around a third f workplaces for lifting and for slips and trips, and slightly less often for PC/laptop sage.
hen prompted with a list of health and safety risks and asked whether these were resent in their workplace, respondents most frequently reported the presence of: lipping or tripping (74%), lifting or carrying (67%), stress (57%), and PC/laptop sage (54%) [Table 51]. Interestingly, stress and PC/laptop usage did not feature rominently as the most frequently identified common or severe risks when espondents were unprompted.
elf-assessed levels of risk control for those risks identified as present in the orkplace when prompted and unprompted are shown in Figure 4. Perceived control worst for stress and best for handling of hazardous chemical and biological aterials. Notably figure 4 demonstrates generally that when the risk is identified nprompted as one of the top three most severe or common its perceived control is igher than when respondents were prompted to assess control of this risk. The one
7
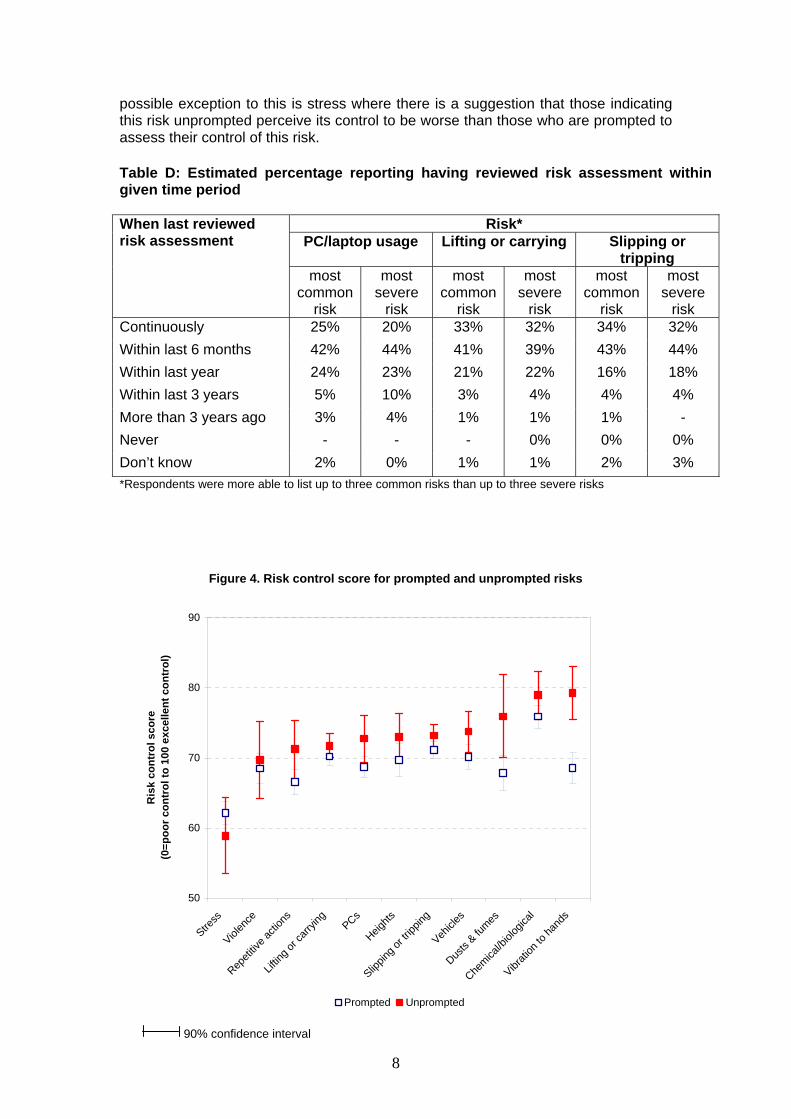
possible exception to this is stress where there is a suggestion that those indicating this risk unprompted perceive its control to be worse than those who are prompted to assess their control of this risk.
Table D: Estimated percentage reporting having reviewed risk assessment within given time period
Risk* PC/laptop usage Lifting or carrying Slipping or
tripping
When last reviewed risk assessment
most common
risk
most severe
risk
most common
risk
most severe
risk
most common
risk
most severe
risk Continuously 25% 20% 33% 32% 34% 32% Within last 6 months 42% 44% 41% 39% 43% 44% Within last year 24% 23% 21% 22% 16% 18% Within last 3 years 5% 10% 3% 4% 4% 4% More than 3 years ago 3% 4% 1% 1% 1% - Never - - - 0% 0% 0% Don’t know 2% 0% 1% 1% 2% 3% *Respondents were more able to list up to three common risks than up to three severe risks
Figure 4. Risk control score for prompted and unprompted risks
50
60
70
80
90
Stress
Violen
ce
Repeti
tive a
ction
s
Liftin
g or c
arryin
gPCs
Heights
Slippin
g or tr
ipping
Vehicle
s
Dusts
& fumes
Chemica
l/biol
ogica
l
Vibrati
on to
hand
s
Ris
k co
ntro
l sco
re(0
=poo
r con
trol
to 1
00 e
xcel
lent
con
trol
)
Prompted Unprompted
90% confidence interval
8

For workplaces reporting less than good control of any risk the perceived barriers to better risk control were wide ranging. [Table 50]. The most common barrier was costs, that was reported as a problem by an estimated 30% of workplaces. This was followed by lack of time (an estimated 20% of workplaces) and worker resistance (16%). Only a small proportion of respondents (an estimated 2%) were unable to identify any barriers.
5. HEALTH AND SAFETY MANAGEMENT
An estimated one third (36%) of workplaces indicated membership of a professional or trade association. [Table 34]. Of these, most were members of a national trade association (73%) with only an estimated 8% specifically members of any health and safety bodies [Table 35].
Among workplaces with 25 or more employees an estimted 52% had a joint committee of managers and workers to discuss health and safety A further 12% had an employee health and safety represenative, but 13% report sole decision-making by a single manager or group mangers without worker consulation [Table 37]. Where joint committees were in place, 87% met regularly while the remainder met only when an issue arose [Table 38]. Where health and safety representatives were appointed, this was directly by workers in 48% of cases, or through a trade union in a further 25% of cases [Table 41]. Training was provided to help them perform their duties in 77% of cases [Table 42]. In workplaces with fewer than 25 employees, most employers (85%) regularly discussed health and safety issues with their workforce [Table 36].
Results from the survey indicate that almost all workplaces with 25 or more employees had a written health and safety policy (99%) and nearly all (96%) had documented procedures for implementing this policy [Table 43].
Employers consulted a wide range of external sources for information and advice on health and safety in the previous 12 months [Table 53]. Generally medium and larger workplaces were more likely to seek advice or information from a range of sources than small workplaces, whether single- or multi-site [Table E]. There was also a general trend for fewer private sector workplaces to have consulted these sources in the last 12 months than public sector workplaces [Table C8]. An estimated 8% of workplaces did not consult any external sources of information and advice on health and safety in the last 12 months. Comparisons indicate that private sector workplaces were more likely to have consulted no external sources (9%) than public sector workplaces (2%) [Table C8]. Also small single-site (6%) and multi-site (11%) workplaces were more likely to have consulted no external sources than medium (1%) or large workplaces (2%) [Table E].
An estimated 55% of those workplaces with 25 or more employees produced an annual report [Table 54]. More produced this in the public sector (77%) than in the private sector (47%) [Table C9]. Among those workplaces with 25 or more employees producing an annual report, 71% included a report on health and safety [Table 54] and this estimate did not differ between public and private sector organisations [Table C9]. For those workplaces with 25 or more employees that did not include a health and safety report within their annual report, an estimated 80% indicated that they did make health and safety information available to workers, 51%
9

made this information available to customers and 21% made this information publicly available [Table 55].
Table E: Estimated percentage consulting various sources of advice or information, by workplace size
Size of workplace*
Source of advice/info Small
single-siteSmall
multi-site Medium Large Local health and safety inspector 36% 40% 48% 56%
Local authority publications 48% 43% 53% 57%
HSE info-line 29% 39% 45% 67%
HSE publications / website 55% 54% 77% 86%
Websites other than HSE 29% 34% 62% 81%
Publications other than HSE 44% 43% 75% 82%
Insurance company 42% 34% 50% 63%
Trade associations or local/national business groups
31% 24% 40% 47%
Trade unions 6% 13% 26% 48%
Supplier of equipment or materials
49% 51% 69% 72%
Private health and safety consultant
28% 29% 48% 55%
None of these 6% 11% 1% 2%
* small multi site workplaces represent those that are part of a larger organisation. Small single site workplaces are not part of a larger organisation. See annex B part B1.
Under half (40%) of those workplaces with 25 or more employees had targets for health and safety performance and almost all (97%) indicated that health and safety was regularly considered at top of the company [Table 56]. An estimated three-quarters of workplaces (74%) had reviewed their entire health and safety system within the last year [Table 57].
Nearly a third (29%) of workplaces do not use a recognised health and safety system [Table 58], while an estimated 59% of workplaces with 25 or more employees required all their suppliers to work to a recognised health and safety system [Table 59]. This requirement was more prevalent in the public sector (74%) than in the private sector (53%) [Table C11].
6. REHABILITATION AND OCCUPATIONAL HEALTH
Half (52%) of workplaces had arrangements in place to support the return to work of employees on long-term sickness absence [Table 62]. These arrangements were much more prevalent in the public sector (85%) compared to the private sector (44%) [Table C12]. An estimated 39% had no rehabilitation arrangements and had never experienced the need for them. This is inline with a recent CBI survey that estimated 60% of British businesses had rehabilitation arrangements in place8.
10

A very high proportion of workplaces with rehabilitation arrangements indicated good practices when prompted with a list [Table 63]. However, fewer (55%), indicated that they had a written rehabilitation policy. The proportion indicating that they had a policy was much lower than the proportions responding in the affirmative when prompted with a list of good behaviours, it’s probable that the survey may be eliciting socially desirable responses to these items. This would result in an over-estimation of the prevalence of established rehabilitation practices. Of those with rehabilitation arrangements, fewer private sector workplaces (47%) had a written policy on rehabilitation compared to the public sector (66%) [Table C13].
An estimated one third (34%) of all workplaces used occupational health or general health professionals in the last 12 months [Table 66]. Private sector workplaces had a higher use of these professionals (45%) compared to public sector workplaces (31%) [Table C14]. Further, estimates suggest that use of these professionals is higher amongst larger workplaces.
Where workplaces had used the services of occupational health or general health professionals in the last 12 months, the most regularly used groups were: health and safety officers (32%); health and safety practitioners (31%); occupational health physicians (21%); and first-aiders (21%) [Table 67]. These professionals were mostly used to advise on work-related health issues (75%), advise on safety issues (71%) and to identify hazards or risks (71%) [Table 68].
For an estimated three quarters (74%) of workplaces with 25 or more employees, employers provided their employees with access to occupational health services [Table 69], although this was much higher in the public sector (94%) than in the private sector (65%) [Table C15].
7. HEALTH AND SAFETY CLIMATE
An employer view of health and safety climate within the workplace was taken by asking five questions broadly indicative of key climate areas of health and safety managers in the workplace. General scale responses to these questions indicated possible social desirability bias as responses were highly skewed towards portraying the workplace in a positive light.
Table F shows the proportion of respondents who strongly agree with statements about health and safety at their workplace, split according to whether the workplaces have fewer than 25 workers or not.
This suggests little difference for most statements between those that employed fewer than 25 workers and those employing 25 or more workers. However, a lower proportion of those in larger workplaces thought that the workers at their workplace would not take risks. The main value in these data will come from comparisons with workers’ views, which can be made when data from future planned surveys become available.
11

Table F: Estimated percentage of respondents strongly agreeing with statements about health and safety in the workplace, by workplace size
Workplaces with: Summary of statement about workplacea
Fewer
than 25 employees
25 or more employees
Management committed to health and safety at work 47% 52% Workers fully involved when health and safety procedures, instructions and rules are developed or reviewed
39% 36%
Workers clear about health and safety rules and procedures that apply to them
42% 41%
Workers here would not take risks 38% 20% Systems or ways of working always encourage health and safety at work
42% 44%
a These statements varied slightly between those with fewer than 25 employees and those with 25 employees or more and a summary is presented here. Details of the full statements can be seen in Table 60 and Table 61.
8. COSTS
Only around 15% of workplaces report spending more than 10% of their budget on the management of health and safety issues, and 25% didn’t know how much of their budget went to health and safety issues [Table 70], Almost all (90%) reported that the health and safety situation at their workplace was fully in line with legal requirements [Table 71]. The nature of this question and the high proportion of positive responses suggests that this is probably an over estimate caused by socially desirable responses. Of those who stated they were fully in line with legal requirements only 13% indicated that their health and safety expenditure could be reduced [Table 72], and of these most indicated expenditure could only be reduced by up to 10% (an estimated 60%) [Table 73].
Of the small proportion stating that their workplace was not fully in line with legal requirements, an estimated one third (34%) thought an increase in expenditure of up to 10% would enable them to meet legal requirements [Table 74].
An estimated 14% of workplaces that reported any work-related ill health or injury had to bring in permanent or temporary staff to replace staff made sick or injured through work [Table 75]. This represents an estimated 6% of all British workplaces.
A small proportion (4%) had employment liability insurances (ELI) claims settled with respect to their workplace within the last 12 months [Table 77]. Where employment liability insurance was arranged separately for the workplace, i.e. not part of a wider organisational insurance policy, there was little evidence of ELI premiums changing as a result of health and safety performance with an estimated 79% of workplaces reporting no such change [Table 80].
12

9. WORKPLACE COMPOSITION
An estimated 5% of workplaces had some employees on the payroll that worked mostly from home and an estimated 30% had employees on the payroll that spent most of their working time away from the workplace [Table 5]. Table G shows the estimated rate of home workers and offsite workers per 100,000 employees in the workplace. Estimates indicate 780 home workers on the payroll per 100,000 employees, and an estimated 14,000 employees per 100,000 on the payroll working off-site. An estimated 5% of workplaces also had workers working for them from home who were not directly their employees [Table 10].
Table G. Estimated rate of home and off site workers employed Types of employee Rate per 100,000 employees
(95% Confidence Interval)
Home workers
780 (400, 1700)
Off-site workers
14,000 (12,000, 16,000)
Estimates from the Labour Force Survey (LFS) from the summer of 2003, indicate that some 2.5% of all employees and self-employed people worked as home-workers in their main job9. This relates to a rate of 2,500 per 100,000 workers. However this also includes the self-employed who are more likely to be home workers. Set in this context, the figures from this survey do not seem inconsistent with these data.
Some 39% of workplaces indicated that there were some workers working from their worksite that were not their direct employees [Table 7]. The most common type of work undertaken by these workers was cleaning (28%) [Table 6]. Workplaces ensured information was provided on health and safety to over 70% of each type of these workers [Table 9]. For approaching half of these workers responsibility for health and safety was written into the contract [Table 8]. There was variation between groups, although numbers are too small in these sub-analyses to draw any firm conclusions on differences between types of workers. Generally, large workplaces were much more likely to provide information on health and safety risks than small ones [Table C1].
Overall an estimated 68% of workplaces had no trade union members among their employees [Table 33]. The proportion of workplaces reporting no union members was higher in the private sector (79%) compared to the public sector (21%) [Table C18]. Not unsurprisingly the proportion with no union membership tended to get smaller with larger workplace size. However, the data suggest this was not a function of numbers employed alone, since 81% of small single-site workplaces had no union members compared to 65% of small multi-site workplaces that were part of a larger organisation [Table C18].
The 2004 Workplace Employer Relations Survey (WERS) indicated that 64% of all workplaces in Britain with over 10 employees had no union members10. The estimate of 68% from this survey, which includes smaller workplaces, is consistent with the WERS data.
13

Text References
1 For more details of WHASS see: http://www.hse.gov.uk/statistics/live/index.htm#whass2 Revitalising health and safety: Strategy webpage: http://www.hse.gov.uk/revitalising/strategy.htm3 The WHASS employer survey technical report can be found from: http://www.hse.gov.uk/statistics/books.htm4 The WHASS employer survey questionnaire can be found from: http://www.hse.gov.uk/statistics/books.htm5 For more details of RIDDOR see: http://www.hse.gov.uk/statistics/sources.htm#riddor6 For more details of SWI and LFS data sources see: http://www.hse.gov.uk/statistics/sources.htm#lfs7 For more details of stress statistics see: http://www.hse.gov.uk/stress/research.htm8 Who Cares wins: Absence and labour turnover 2005, CBI May 2005. 9 Labour Market trends December 2003, Volume 111 Number 12 p597 Labour Market Spotlight. Available from : http://www.statistics.gov.uk/downloads/theme_labour/LMT_Dec03.pdf10 Kersley, B. Alpin, C. Forth, J. Bryson, A. Bewley, H. Dix, G. Oxenbridge, S. Inside the Workplace: First Findings from the 2004 Workplace Employment Relations Survey (WERS 2004). Available from: http://www.dti.gov.uk/er/insideWPfinalwebJune.pdf
14

Annex A: Tables of Statistics Part one: Univariate analyses Table 1 Whether role includes overall responsibility for health and safety policy Base: All employers Percentage Unweighted (95% C.I.) frequency Unweighted total 966 Don't know 0 3 (0, 2) Yes 71 666 (68, 75) No 28 297 (25, 32)
15

Table 2 Number of workers on Payroll Base: All employers Percentage Unweighted (95% C.I.) frequencyUnweighted total 966 0 1 5 (1, 3) 1-4 1 66 (0, 2) 5-9 10 172 (8, 13) 10-14 29 103 (26, 33) 15-19 15 66 (13, 18) 20-49 9 168 (7, 11) 50-99 22 121 (20, 26) 100-249 6 88 (5, 7) 250+ 4 171 (3, 5) Don’t know 2 6 (2, 3) Mean score 38 Standard Error 2 95% C.I. (34, 43)
16
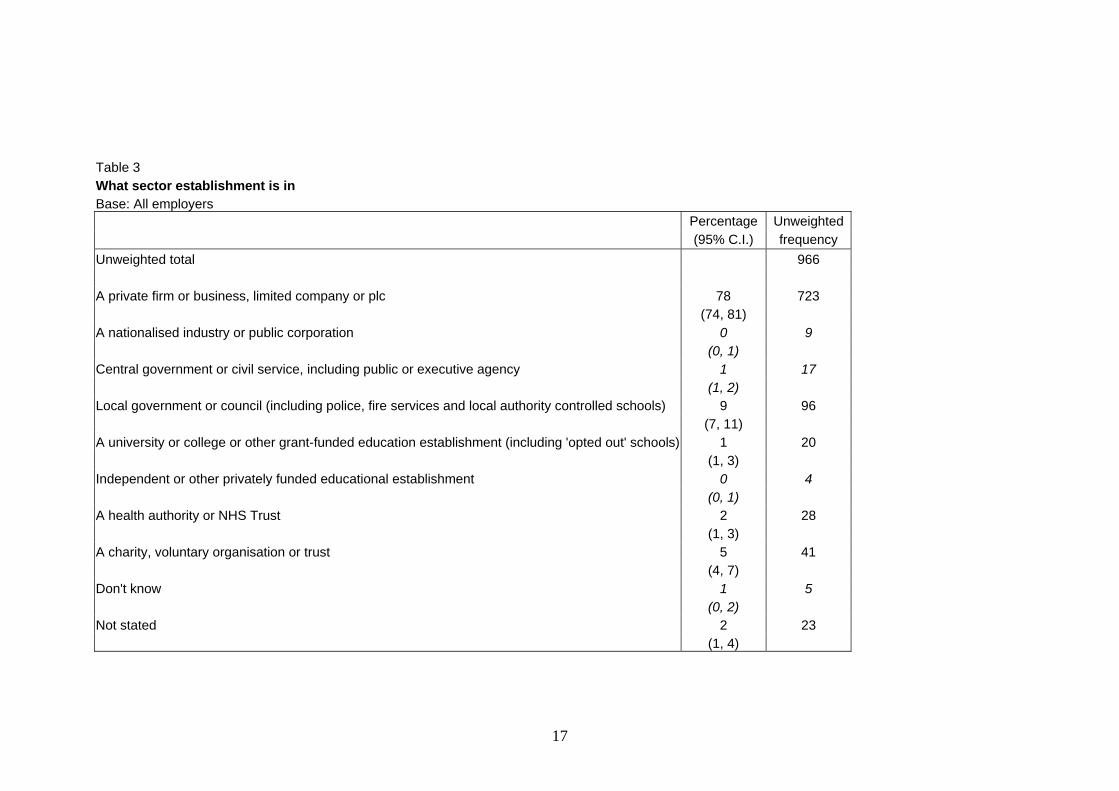
Table 3 What sector establishment is in Base: All employers
Percentage Unweighted (95% C.I.) frequency
Unweighted total 966 A private firm or business, limited company or plc 78 723 (74, 81) A nationalised industry or public corporation 0 9 (0, 1) Central government or civil service, including public or executive agency 1 17 (1, 2) Local government or council (including police, fire services and local authority controlled schools) 9 96 (7, 11) A university or college or other grant-funded education establishment (including 'opted out' schools) 1 20 (1, 3) Independent or other privately funded educational establishment 0 4 (0, 1) A health authority or NHS Trust 2 28 (1, 3) A charity, voluntary organisation or trust 5 41 (4, 7) Don't know 1 5 (0, 2) Not stated 2 23 (1, 4)
17
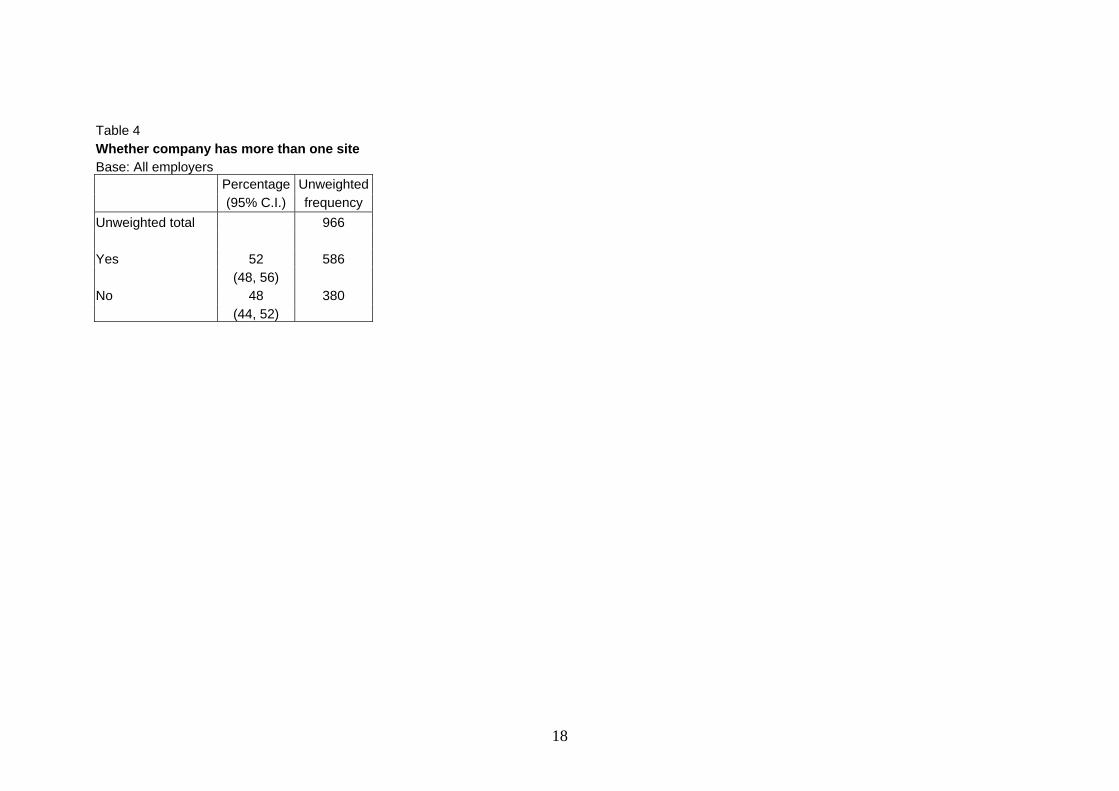
Table 4 Whether company has more than one site Base: All employers Percentage Unweighted (95% C.I.) frequency Unweighted total 966 Yes 52 586 (48, 56) No 48 380 (44, 52)
18

Table 5 Number of workers who spend most of their working hours at home or working off site Base: All employers At home Off Site
Percentage Unweighted Percentage Unweighted (95% C.I.) frequency (95% C.I.) frequency
Unweighted total 966 966 0 94 879 69 562 (92, 96) (65, 72) One or more 5 78 30 389 (4, 7) (27, 34) 1-4 4 43 14 124 (3, 6) (12, 17) 5-9 0 7 6 63 (0, 1) (5, 8) 10-14 1 13 2 33 (0, 1) (1, 3) 15-19 0 1 2 22 (0, 0) (1, 3) 20-49 0 9 4 60 (0, 1) (3, 5) 50-99 0 3 1 29 (0, 0) (1, 1) 100-249 0 1 1 31 (0, 0) (0, 1) 250+ 0 1 0 27 (0, 0) (0, 0) Don’t know 0 9 1 15 (0, 1) (0, 2) Mean score 0 5 Standard Error 0 1 95% C.I. (0, 0) (4, 6)
19
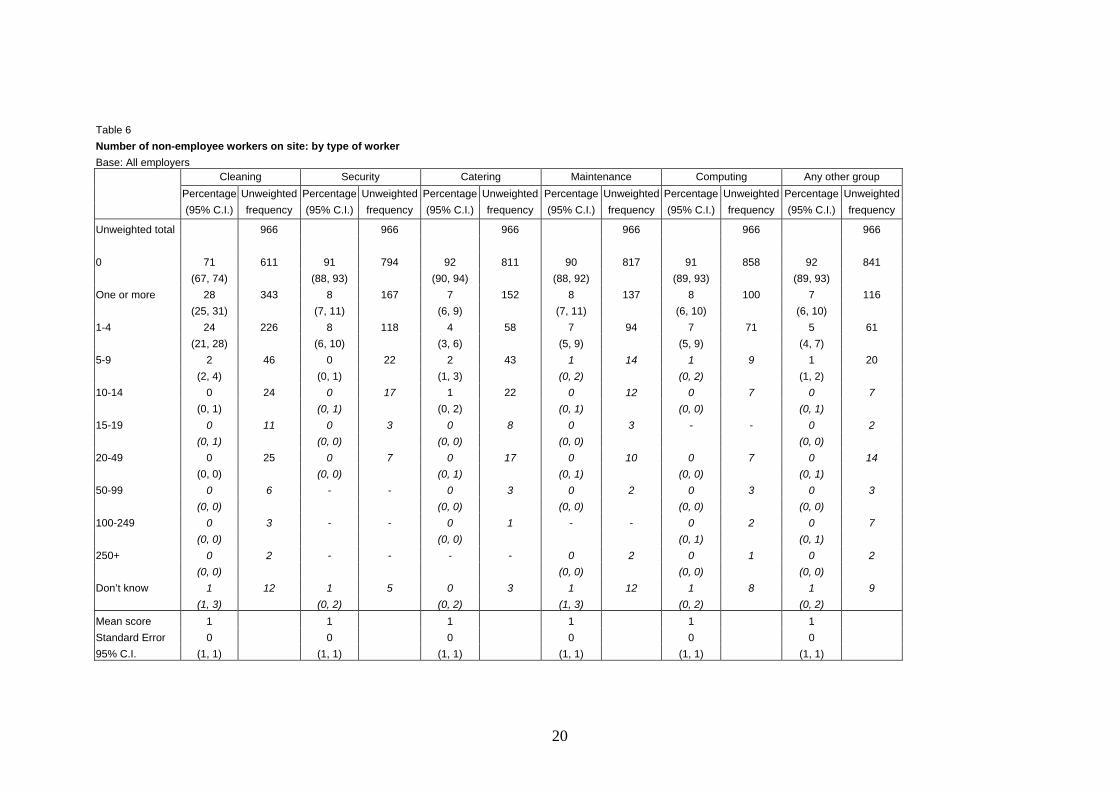
Table 6 Number of non-employee workers on site: by type of worker Base: All employers Cleaning Security Catering Maintenance Computing Any other group
Percentage Unweighted Percentage Unweighted Percentage Unweighted Percentage Unweighted Percentage Unweighted Percentage Unweighted
(95% C.I.) frequency (95% C.I.) frequency (95% C.I.) frequency (95% C.I.) frequency (95% C.I.) frequency (95% C.I.) frequency
Unweighted total 966 966 966 966 966 966 0 71 611 91 794 92 811 90 817 91 858 92 841 (67, 74) (88, 93) (90, 94) (88, 92) (89, 93) (89, 93) One or more 28 343 8 167 7 152 8 137 8 100 7 116 (25, 31) (7, 11) (6, 9) (7, 11) (6, 10) (6, 10) 1-4 24 226 8 118 4 58 7 94 7 71 5 61 (21, 28) (6, 10) (3, 6) (5, 9) (5, 9) (4, 7) 5-9 2 46 0 22 2 43 1 14 1 9 1 20 (2, 4) (0, 1) (1, 3) (0, 2) (0, 2) (1, 2) 10-14 0 24 0 17 1 22 0 12 0 7 0 7 (0, 1) (0, 1) (0, 2) (0, 1) (0, 0) (0, 1) 15-19 0 11 0 3 0 8 0 3 - - 0 2 (0, 1) (0, 0) (0, 0) (0, 0) (0, 0) 20-49 0 25 0 7 0 17 0 10 0 7 0 14 (0, 0) (0, 0) (0, 1) (0, 1) (0, 0) (0, 1) 50-99 0 6 - - 0 3 0 2 0 3 0 3 (0, 0) (0, 0) (0, 0) (0, 0) (0, 0) 100-249 0 3 - - 0 1 - - 0 2 0 7 (0, 0) (0, 0) (0, 1) (0, 1) 250+ 0 2 - - - - 0 2 0 1 0 2 (0, 0) (0, 0) (0, 0) (0, 0) Don’t know 1 12 1 5 0 3 1 12 1 8 1 9 (1, 3) (0, 2) (0, 2) (1, 3) (0, 2) (0, 2) Mean score 1 1 1 1 1 1Standard Error 0 0 0 0 0 095% C.I. (1, 1) (1, 1) (1, 1) (1, 1) (1, 1) (1, 1)
20

Table 7 Whether there are any workers in workplace who are not direct employees Base: All employers
Percentage Unweighted (95% C.I.) frequency
Unweighted total 966 Yes 39 475 (35, 43) No 61 491 (57, 65)
21
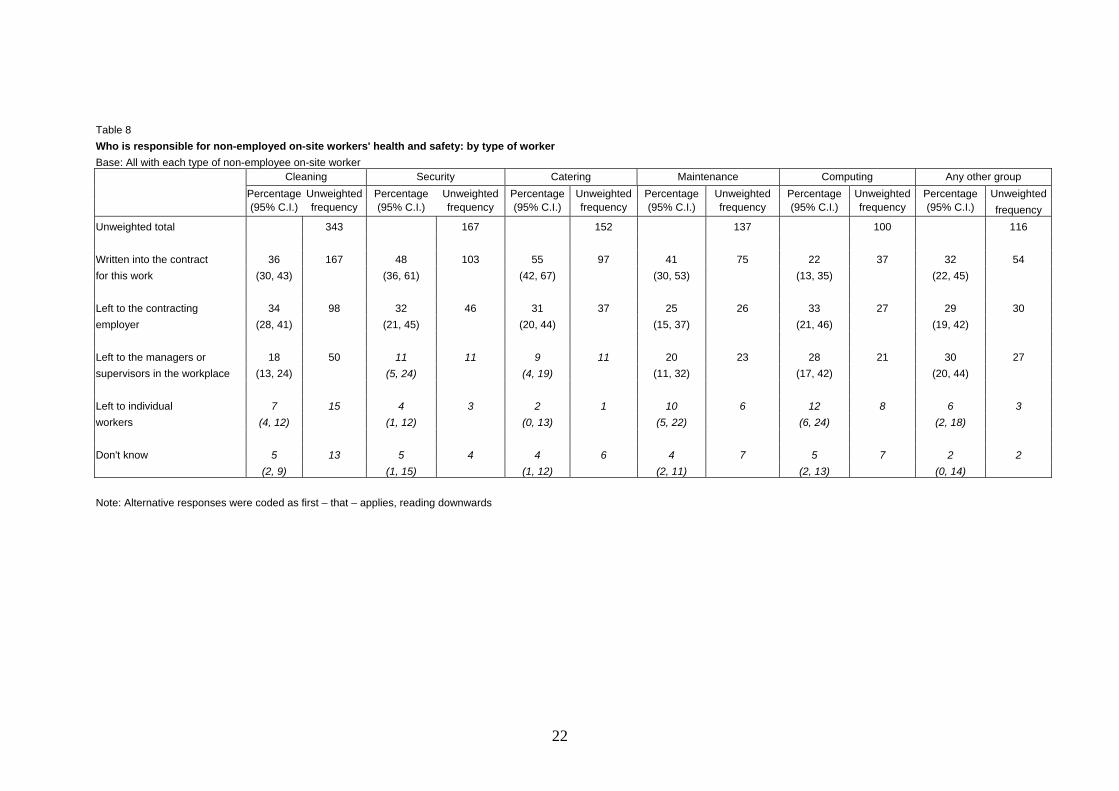
Table 8
Who is responsible for non-employed on-site workers' health and safety: by type of worker
Base: All with each type of non-employee on-site worker
Cleaning Security Catering Maintenance Computing Any other group Percentage Unweighted Percentage Unweighted Percentage Unweighted Percentage Unweighted Percentage Unweighted Percentage Unweighted (95% C.I.) frequency (95% C.I.) frequency (95% C.I.) frequency (95% C.I.) frequency (95% C.I.) frequency (95% C.I.) frequency
Unweighted total 343 167 152 137 100 116 Written into the contract 36 167 48 103 55 97 41 75 22 37 32 54 for this work (30, 43) (36, 61) (42, 67) (30, 53) (13, 35) (22, 45) Left to the contracting 34 98 32 46 31 37 25 26 33 27 29 30 employer (28, 41) (21, 45) (20, 44) (15, 37) (21, 46) (19, 42) Left to the managers or 18 50 11 11 9 11 20 23 28 21 30 27supervisors in the workplace (13, 24) (5, 24) (4, 19) (11, 32) (17, 42) (20, 44) Left to individual 7 15 4 3 2 1 10 6 12 8 6 3workers (4, 12) (1, 12) (0, 13) (5, 22) (6, 24) (2, 18) Don't know 5 13 5 4 4 6 4 7 5 7 2 2 (2, 9) (1, 15) (1, 12) (2, 11) (2, 13) (0, 14)
Note: Alternative responses were coded as first – that – applies, reading downwards
22

Table 9 For which of these types of non-employed on-site workers is it ensured that information on health and safety risks is provided Base: All with non-employed on-site workers Percentage Unweighted (95% C.I.) frequency Unweighted total 475 Cleaning (cleaning of building and premises) 77 283 (71, 83) Security 71 137 (58, 82) Catering 71 125 (58, 82) Maintenance 72 113 (59, 82) Computing (computing services) 86 88 (74, 93) Any other group 78 94 (65, 87)
23

Table 10 Whether establishment has any workers who work at or from their home who are not employees (contract, agency or freelance)
Base: All respondents Percentage Unweighted (95% C.I.) frequency Unweighted total 966 Yes 5 66 (4, 7) No 95 894 (93, 96) Don't know 0 6 (0, 1)
24
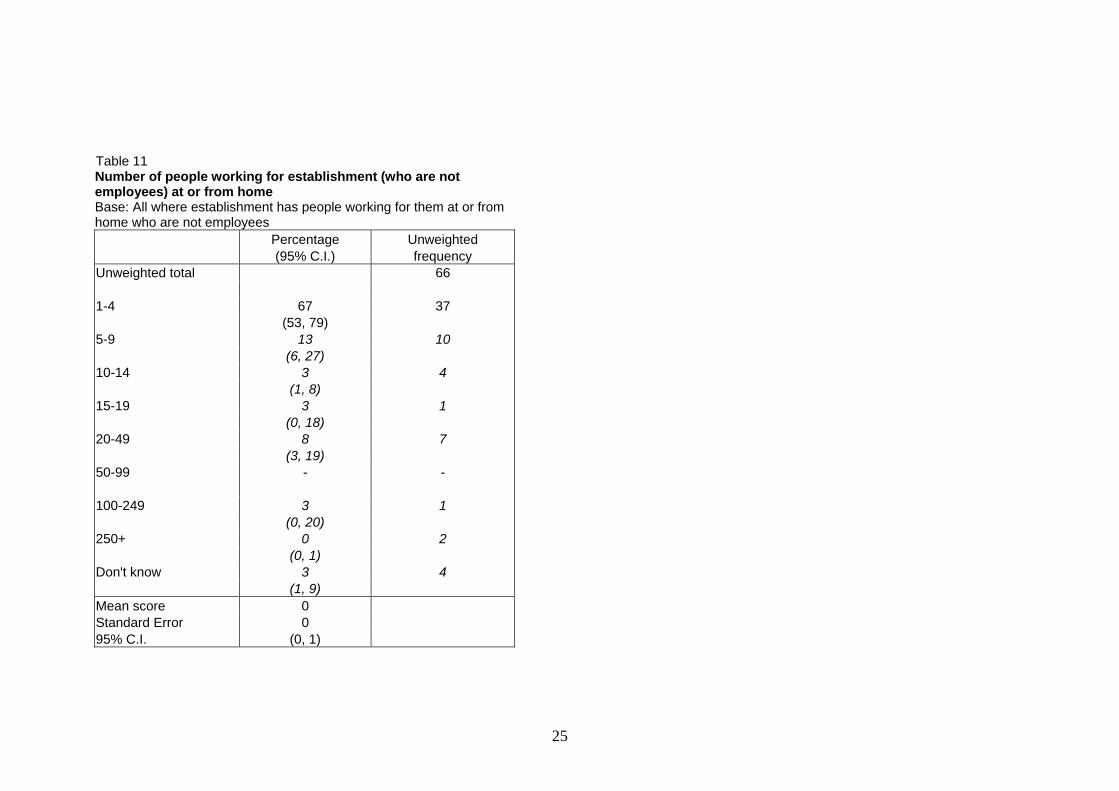
Table 11 Number of people working for establishment (who are not employees) at or from home Base: All where establishment has people working for them at or from home who are not employees Percentage Unweighted (95% C.I.) frequency Unweighted total 66 1-4 67 37 (53, 79) 5-9 13 10 (6, 27) 10-14 3 4 (1, 8) 15-19 3 1 (0, 18) 20-49 8 7 (3, 19) 50-99 - - 100-249 3 1 (0, 20) 250+ 0 2 (0, 1) Don't know 3 4 (1, 9) Mean score 0 Standard Error 0 95% C.I. (0, 1)
25
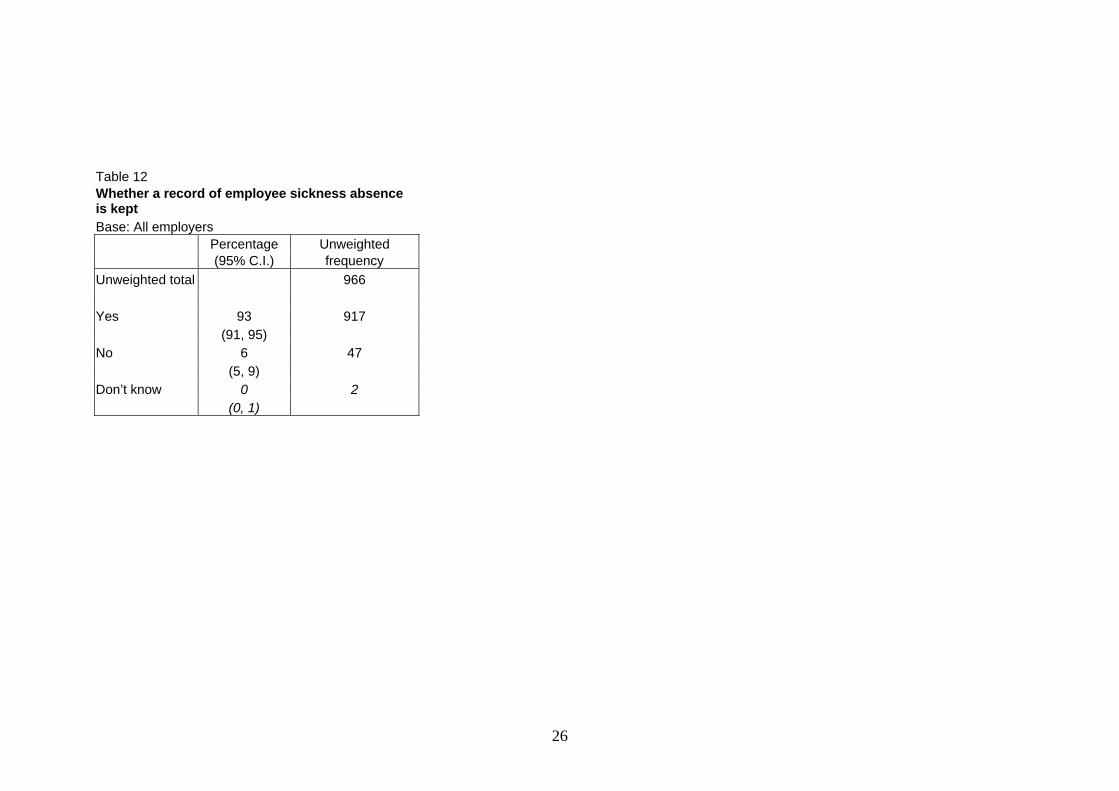
Table 12 Whether a record of employee sickness absence is kept Base: All employers Percentage Unweighted (95% C.I.) frequency Unweighted total 966 Yes 93 917 (91, 95) No 6 47 (5, 9) Don’t know 0 2 (0, 1)
26

Table 13 What is recorded about sickness absence Base: All keeping a record of employee sickness absence, where there are 25+ workers
Percentage Unweighted (95% C.I.) frequency Unweighted total 507 The type of illness causing absence 84 446 (79, 88) The type of injury causing absence 93 479 (89, 95) Whether the illness was caused or made worse by work 85 444 (80, 89) Whether the injury occurred at or in the course of work 98 496 (96, 99) The number of days absent from work 96 490 (93, 98) Whether a doctor's certificate was provided 96 491 (94, 98) None of these 1 2 (0, 3)
27

Table 14 Whether sickness absence data is routinely reviewed for these groups Base: All keeping record of employee sickness absence and where there are 25+ workers Percentage Unweighted (95% C.I.) frequency Unweighted total 507 Individual workers 70 373 (64, 75) Departments or work units 50 292 (45, 56) The whole organisation 72 383 (66, 77) Don't know 3 10 (1, 6) None of these 7 25 (4, 11)
28

Table 15 Whether sickness absence information is used to manage sickness absence or inform risk assessments Base: All where sickness absence is routinely reviewed Manage sickness absence Inform risk assessments Percentage Unweighted Percentage Unweighted (95% C.I.) frequency (95% C.I.) frequencyUnweighted total 472 472 Yes 84 412 86 396 (79, 88) (82, 89) No 14 54 13 67 (11, 20) (10, 17) Don't know 2 6 1 9 (1, 4) (0, 3)
29
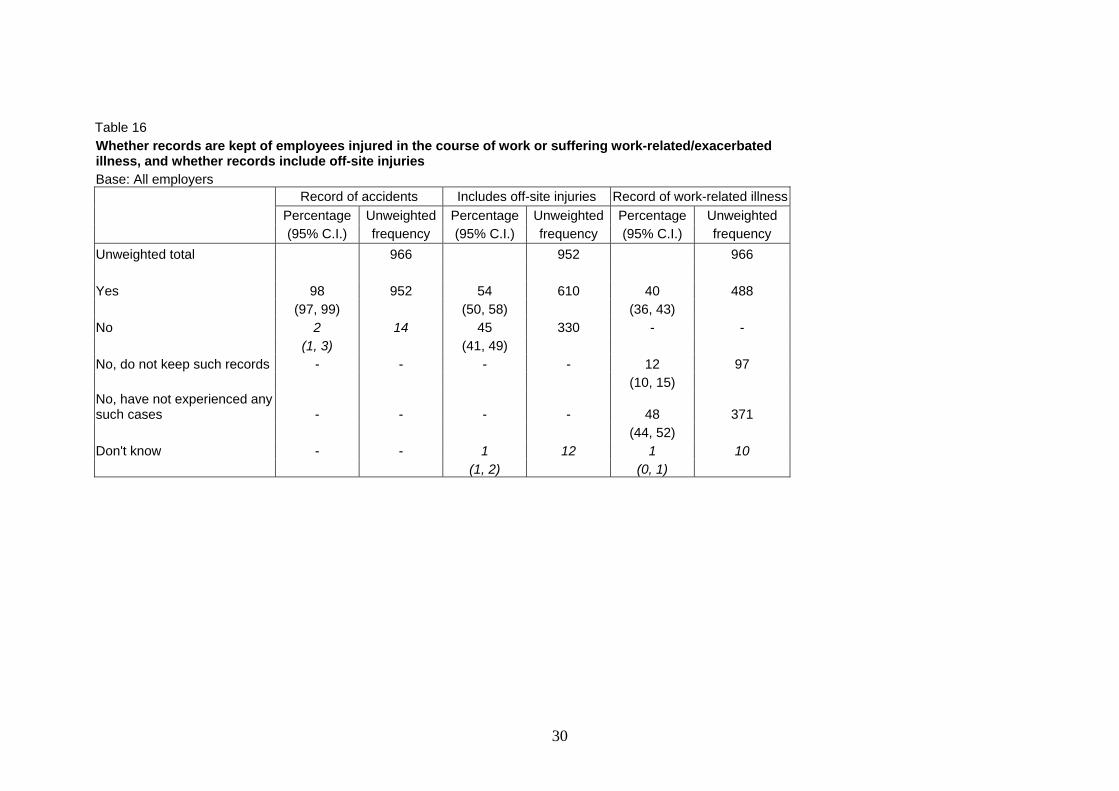
Table 16 Whether records are kept of employees injured in the course of work or suffering work-related/exacerbated illness, and whether records include off-site injuries Base: All employers Record of accidents Includes off-site injuries Record of work-related illness Percentage Unweighted Percentage Unweighted Percentage Unweighted (95% C.I.) frequency (95% C.I.) frequency (95% C.I.) frequency Unweighted total 966 952 966 Yes 98 952 54 610 40 488 (97, 99) (50, 58) (36, 43) No 2 14 45 330 - - (1, 3) (41, 49) No, do not keep such records - - - - 12 97 (10, 15)No, have not experienced any such cases - - - - 48 371 (44, 52)Don't know - - 1 12 1 10 (1, 2) (0, 1)
30
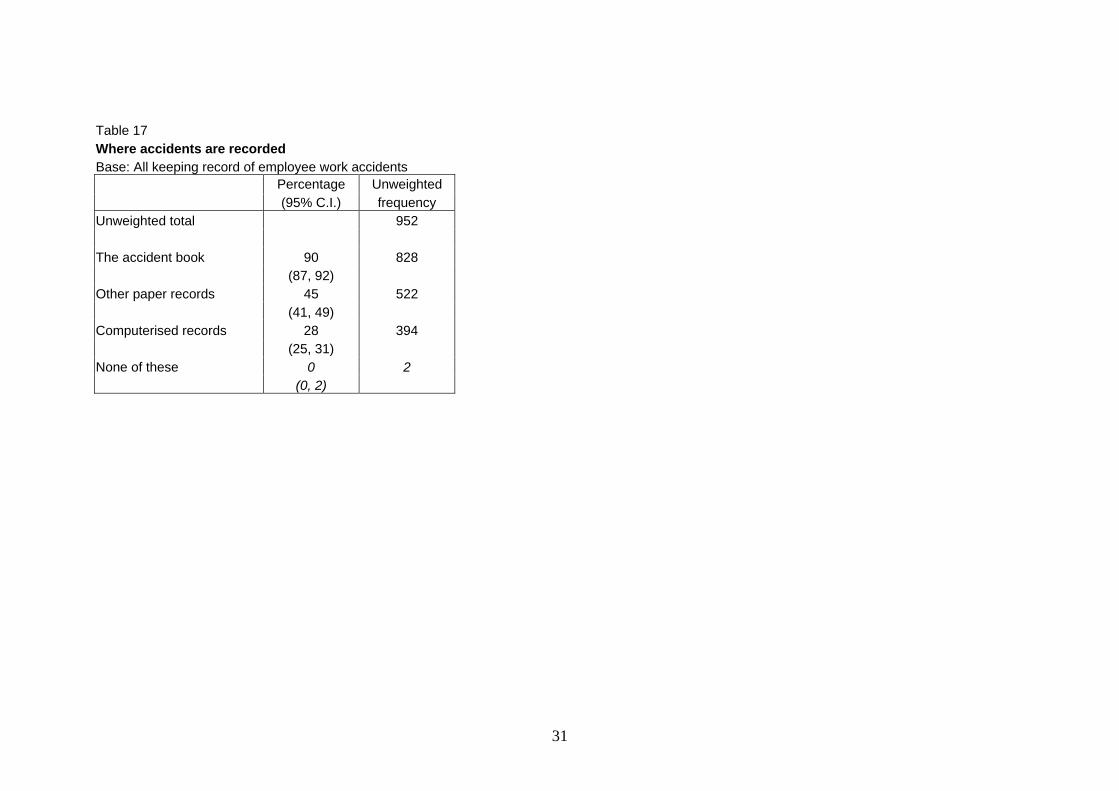
Table 17 Where accidents are recorded Base: All keeping record of employee work accidents
Percentage Unweighted (95% C.I.) frequency Unweighted total 952 The accident book 90 828 (87, 92) Other paper records 45 522 (41, 49) Computerised records 28 394 (25, 31) None of these 0 2 (0, 2)
31

Table 18 Whether a record kept of near misses, and how many recorded in last 12 months Base: Workplaces with 25+ workers
Percentage Unweighted (95% C.I.) frequency Unweighted total 517 Total: Keep records 63 364 (57, 68) Do not keep records 36 147 (31, 42) Don't know if keep records 1 6 (0, 4) Number of near misses recorded: 0 49 135 (42, 56) One or more 42 200 (35, 49) 1 11 31 (7, 17) 2 7 26 (4, 11) 3 3 15 (2, 6) Table 18 continued on next page
32

Percentage Unweighted (95% C.I.) frequency4 4 18 (2, 6) 5-9 7 33 (4, 11) 10-14 2 15 (1, 4) 15-19 2 8 (1, 5) 20-29 2 15 (1, 4) 30-39 2 13 (1, 4) 40-49 - - 50-99 1 10 (0, 2) 100-149 0 2 (0, 0) 150+ 2 14 (1, 5) Don't know how many near misses 9 29 (5, 14) Mean score 45 Standard Error 38 95% C.I. (0, 119)
33
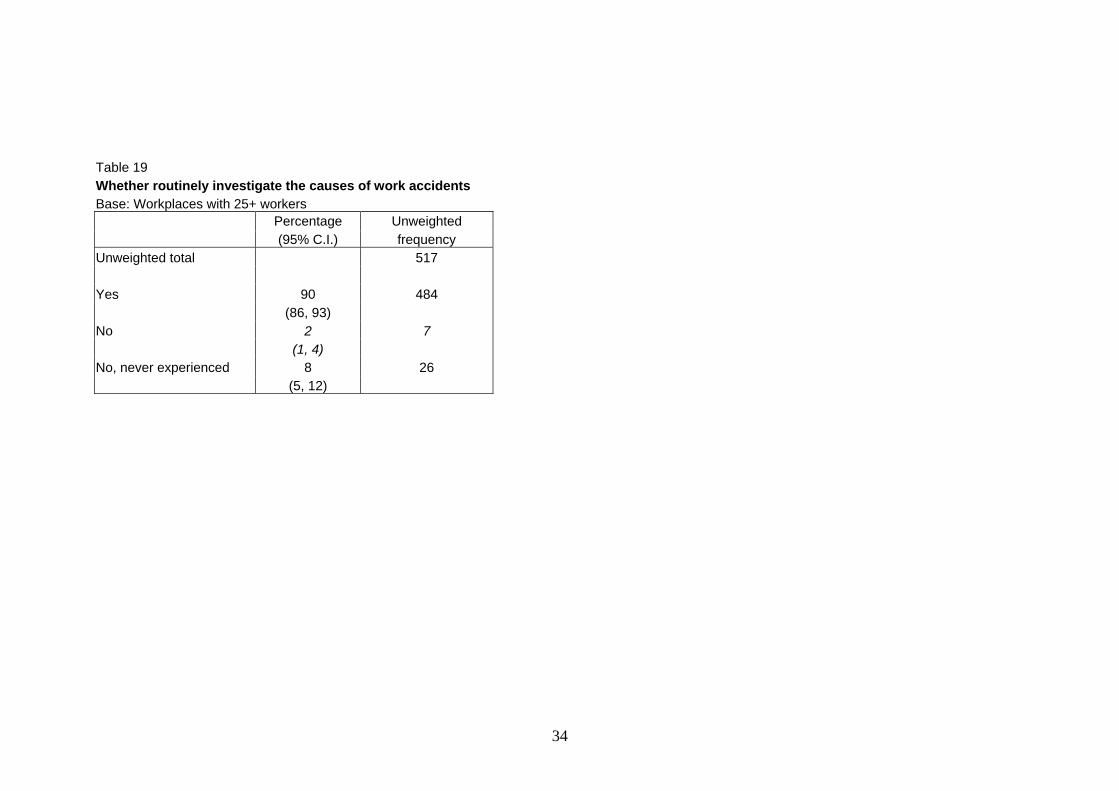
Table 19 Whether routinely investigate the causes of work accidents Base: Workplaces with 25+ workers Percentage Unweighted (95% C.I.) frequency Unweighted total 517 Yes 90 484 (86, 93) No 2 7 (1, 4) No, never experienced 8 26 (5, 12)
34

Table 20 Whether ALWAYS investigate the causes of work accidents Base: All who routinely investigate the causes of work accidents
Percentage Unweighted (95% C.I.) frequency Unweighted total 484 Yes, always 82 387 (77, 86) Investigate major accidents only 15 84 (11, 19) It depends 3 12 (1, 6) Other answer 0 1 (0, 1)
35
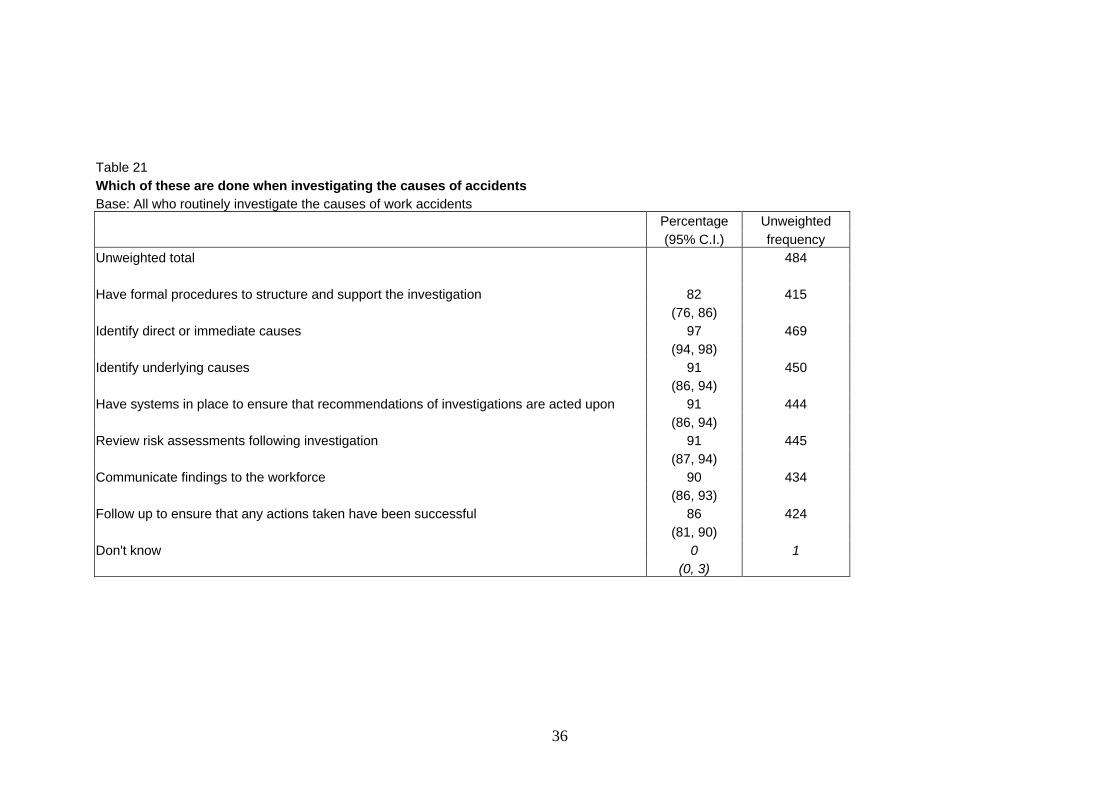
Table 21 Which of these are done when investigating the causes of accidents Base: All who routinely investigate the causes of work accidents Percentage Unweighted (95% C.I.) frequency Unweighted total 484 Have formal procedures to structure and support the investigation 82 415 (76, 86) Identify direct or immediate causes 97 469 (94, 98) Identify underlying causes 91 450 (86, 94) Have systems in place to ensure that recommendations of investigations are acted upon 91 444 (86, 94) Review risk assessments following investigation 91 445 (87, 94) Communicate findings to the workforce 90 434 (86, 93) Follow up to ensure that any actions taken have been successful 86 424 (81, 90) Don't know 0 1 (0, 3)
36

Table 22 Whether investigated causes of workplace injuries Base: Workplaces with under 25 workers where workers have experienced workplace injuries
Percentage Unweighted (95% C.I.) frequency Unweighted total 67 Yes, all 78 52 (66, 86) Yes, some 7 5 (3, 17) No 15 10 (8, 26)
37

Table 23 Whether any workers experienced workplace injuries in last 12 months and whether any injuries have been reported under RIDDOR 1995 Base: All employers / All who have experienced workplace injuries Workplace injuries Reported under RIDDOR Percentage Unweighted Percentage Unweighted
(95% C.I.) frequency (95% C.I.) frequencyUnweighted total 966 413 Yes 27 413 36 242 (24, 30) (30, 42) No 73 547 62 166 (69, 76) (56, 68) Don’t know 1 6 2 5 (0, 2) (1, 6)
38

Table 24 Number of injuries of each type reported in last 12 months Base: All where injuries were reported under RIDDOR '95 in last 12 months
Fatal injuries Major injuries Over 3-day injuries Percentage Unweighted Percentage Unweighted Percentage Unweighted (95% C.I.) frequency (95% C.I.) frequency (95% C.I.) frequency
Unweighted total 242 242 242 0 92 220 79 161 10 22 (86, 95) (71, 85) (6, 18) One or more 8 19 20 75 90 211 (4, 13) (14, 28) (82, 94) 1 7 14 12 41 56 78 (3, 13) (8, 19) (47, 65) 2 0 2 6 17 11 33 (0, 1) (2, 13) (7, 17) 3 1 2 1 3 9 25 (0, 4) (0, 4) (5, 14) 4 0 1 0 4 5 15 (0, 1) (0, 1) (3, 9) 5-9 - - 0 3 5 22 (0, 1) (3, 8) 10-14 - - 1 4 2 11 (0, 2) (1, 4) 15-19 - - - - 0 6 (0, 1)20-29 - - 0 1 1 12 (0, 1) (0, 2) 30-39 - - 0 1 0 3 (0, 1) (0, 1) 40-49 - - - - 0 2
(0, 1)50+ - - 0 1 0 4 (0, 1) (0, 1) Don't know 1 3 1 6 1 9 (0, 3) (0, 3) (0, 3) Mean score 0 1 2 Standard Error 0 0 0 95% C.I. (0, 0) (0, 1) (2, 3)
39
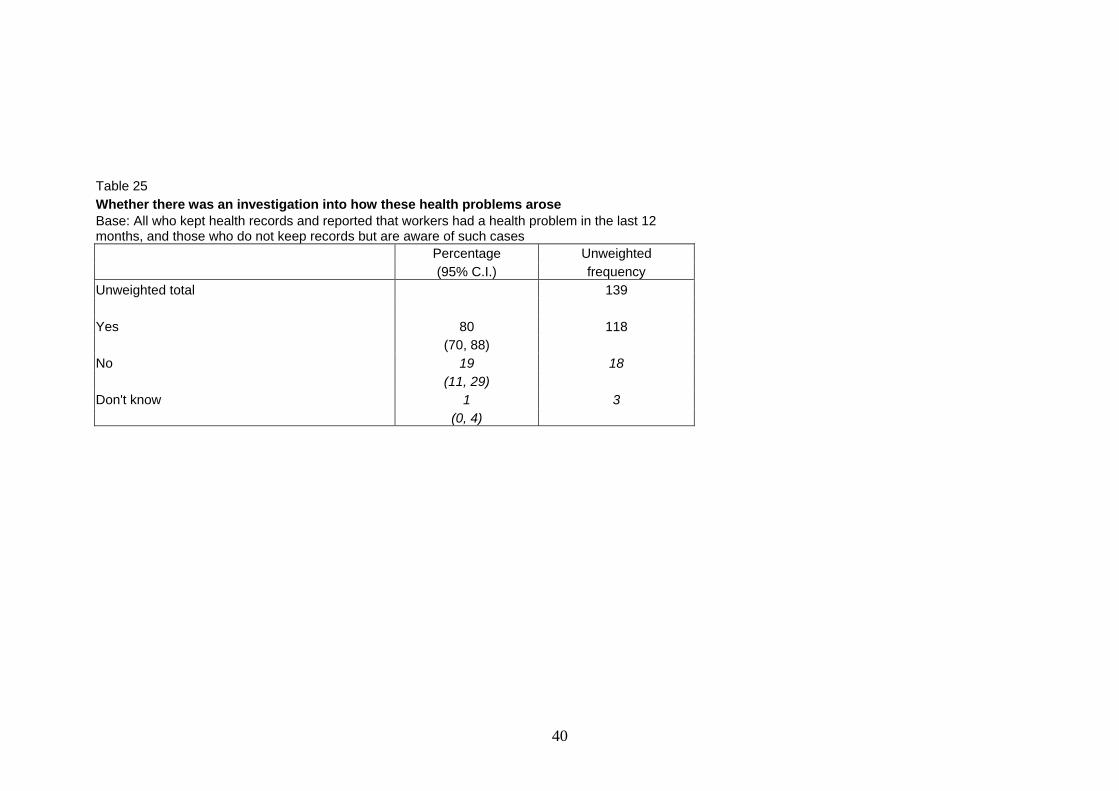
Table 25 Whether there was an investigation into how these health problems arose Base: All who kept health records and reported that workers had a health problem in the last 12 months, and those who do not keep records but are aware of such cases Percentage Unweighted (95% C.I.) frequency Unweighted total 139 Yes 80 118 (70, 88) No 19 18 (11, 29) Don't know 1 3 (0, 4)
40

Table 26 Whether investigate causes of work-related illness Base: Workplaces with 25+ workers who keep records of work-related illness, or who do not but are aware of cases of work-related illness in the last 12 months Percentage Unweighted (95% C.I.) frequency Unweighted total 336 Yes 94 316 (91, 97) No 5 17 (3, 9) Don't know 0 3 (0, 1)
41
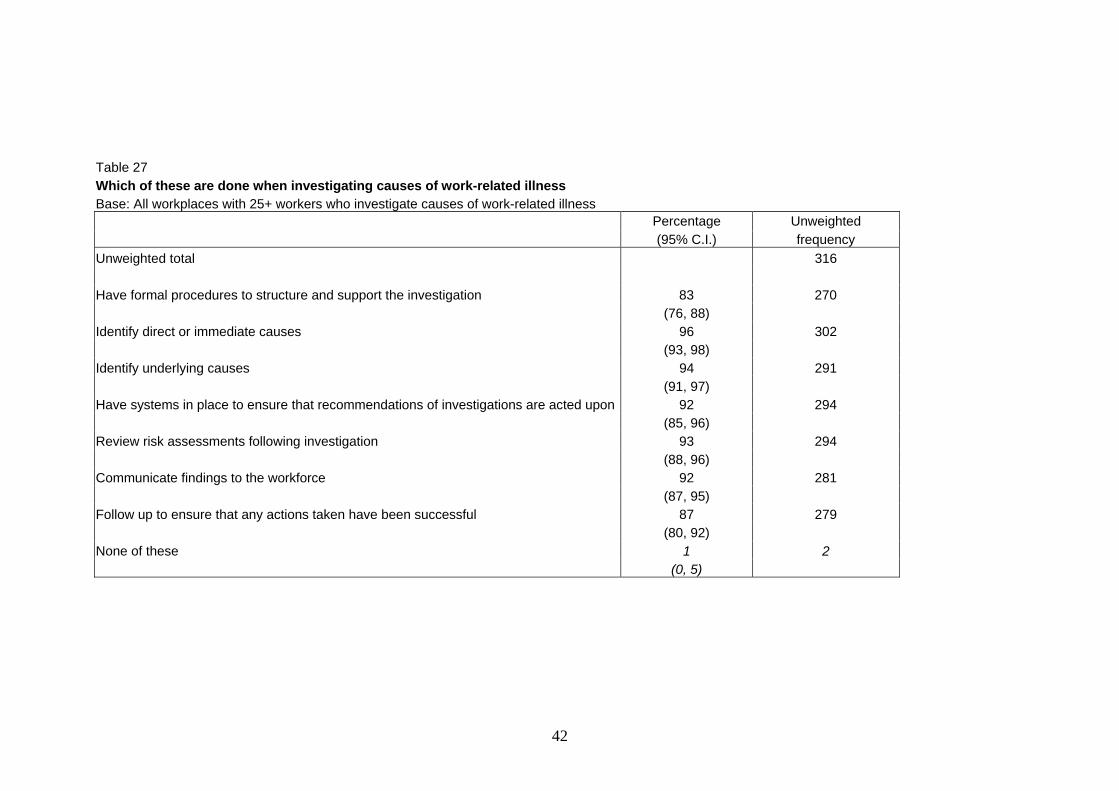
Table 27 Which of these are done when investigating causes of work-related illness Base: All workplaces with 25+ workers who investigate causes of work-related illness Percentage Unweighted (95% C.I.) frequency Unweighted total 316 Have formal procedures to structure and support the investigation 83 270 (76, 88) Identify direct or immediate causes 96 302 (93, 98) Identify underlying causes 94 291 (91, 97) Have systems in place to ensure that recommendations of investigations are acted upon 92 294 (85, 96) Review risk assessments following investigation 93 294 (88, 96) Communicate findings to the workforce 92 281 (87, 95) Follow up to ensure that any actions taken have been successful 87 279 (80, 92) None of these 1 2 (0, 5)
42

Table 28 How many near misses recorded in last 12 months and how many of these had potential to cause death or serious injury Base: All who keep records of near misses Near misses Potential to cause death/serious injury Percentage Unweighted Percentage Unweighted (95% C.I.) frequency (95% C.I.) frequencyUnweighted total 364 200 0 49 135 63 110 (42, 56) (53, 72) One or more 42 200 34 83 (35, 49) (26, 44) 1 11 31 13 28 (7, 17) (8, 21) 2 7 26 7 18 (4, 11) (4, 13) 3 3 15 5 10 (2, 6) (2, 10) 4 4 18 1 5 (2, 6) (0, 3) 5-9 7 33 5 11 (4, 11) (2, 13) 10-14 2 15 - - (1, 4) Table 28 continued on next page
43

Percentage Unweighted Percentage Unweighted (95% C.I.) frequency (95% C.I.) frequency 10+ - - 2 11 (1, 5) 15-19 2 8 - - (1, 5) 20-29 2 15 - - (1, 4) 30-39 2 13 - - (1, 4) 40-49 - - - - 50-99 1 10 - - (0, 2) 100-149 0 2 - - (0, 0) 150+ 2 14 - - (1, 5) Don't know 9 29 4 7 (5, 14) (1, 10) Mean score 45 1 Standard Error 38 0 95% C.I. (-30, 119) (1, 2)
44

Table 29 Number of days off taken by employees in last 12 months due to work-related injuries, or estimated number for small workplaces Base: All respondents. Don't knows from days off column are included in estimated days off column Days off Estimated days off
(larger establishments) (smaller establishments / Don't
know) Percentage Unweighted Percentage Unweighted (95% C.I.) frequency (95% C.I.) frequencyUnweighted total 496 568 0 51 179 86 416 (45, 57) (82, 88) One or more 36 219 9 68 (31, 42) (7, 12) 1 1 7 0 2 (0, 3) (0, 2) 2 4 14 1 3 (2, 7) (0, 2) 3 2 9 0 3 (1, 5) (0, 1) 4 2 8 1 4 (1, 5) (0, 2) 5-9 4 26 2 13 (3, 7) (1, 4) Table 29 continued on next page
45

Percentage Unweighted Percentage Unweighted (95% C.I.) frequency (95% C.I.) frequency 10-14 6 32 2 9 (4, 10) (1, 3) 15-19 2 13 1 7 (1, 3) (0, 2) 20-29 6 37 1 8 (4, 10) (0, 2) 30-39 3 14 1 5 (1, 5) (0, 2) 40-49 0 7 0 1 (0, 1) (0, 0) 50-99 2 17 0 6 (1, 4) (0, 0) 100-149 1 9 0 3 (0, 3) (0, 1) 150+ 2 27 0 4 (1, 4) (0, 2) Don't know 13 98 6 84 (10, 18) (4, 8) Mean score 16 2 Standard Error 3 1 95% C.I. (10, 22) (1, 4)
46

Table 30 Number of employees had work-related illness in last 12 months Base: All who keep records of work-related illness Percentage Unweighted (95% C.I.) frequency Unweighted total 488 0 69 283 (64, 74) One or more 25 135 (20, 30) 1 16 65 (12, 21) 2 5 24 (3, 8) 3 3 18 (1, 5) 4 1 5 (0, 2) 5-9 1 15 (0, 2) 10-14 0 2 (0, 1) Table 30 continued on next page
47

Percentage Unweighted (95% C.I.) frequency15-19 0 2 (0, 1) 20-29 0 1 (0, 0) 30-39 0 1 (0, 0) 40-49 0 1 (0, 0) 50-99 - - 100-149 - - 150+ 0 1 (0, 0) Don't know 6 70 (4, 9) Mean score 1 Standard Error 0 95% C.I. (0, 1)
48
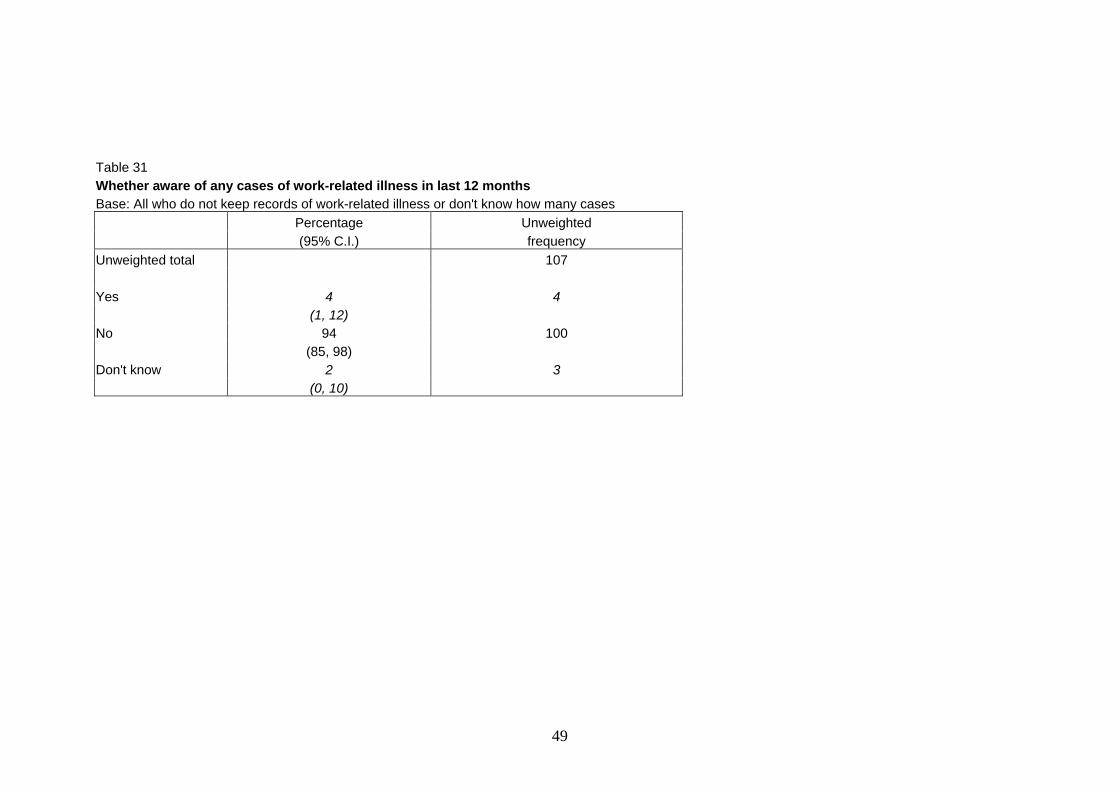
Table 31 Whether aware of any cases of work-related illness in last 12 months Base: All who do not keep records of work-related illness or don't know how many cases Percentage Unweighted (95% C.I.) frequency Unweighted total 107 Yes 4 4 (1, 12) No 94 100 (85, 98) Don't know 2 3 (0, 10)
49

Table 32 Number of days off or estimated number of days off taken by employees in last 12 months due to work-related illness Base: Actual numbers for workplaces with 25+ workers, who keep record of sickness absence, including whether illness was work-related Base: Estimated numbers for workplaces with fewer than 25 workers or who did not know number of days off taken by employees Number of days off Estimated number of days off Percentage Unweighted Percentage Unweighted (95% C.I.) frequency (95% C.I.) frequencyUnweighted total 444 615 0 71 272 81 433 (65, 76) (78, 85) 1 2 6 0 2 (1, 5) (0, 1) 2 1 4 1 4 (0, 3) (0, 3) 3 - - 1 3 (0, 2) 4 0 1 0 1 (0, 2) (0, 1) 5-9 1 2 2 12 (0, 3) (1, 4) 10-14 1 7 2 16 (0, 3) (1, 4) Table 32 continued on next page
50

Percentage Unweighted Percentage Unweighted (95% C.I.) frequency (95% C.I.) frequency 15-19 0 3 - - (0, 2) 20-29 2 15 1 5 (1, 4) (0, 2) 30-39 2 8 0 2 (1, 5) (0, 1) 40-49 1 4 0 2 (0, 4) (0, 2) 50-99 1 10 1 6 (1, 3) (0, 2) 100-149 0 4 0 1 (0, 1) (0, 1) 150+ 2 15 0 1 (1, 5) (0, 1) Don't know 15 93 8 108 (11, 20) (6, 10) Not able to make an estimate - - 2 19 (1, 3) Mean score 11 2 Standard Error 3 1 95% C.I. (5, 17) (1, 3)
51
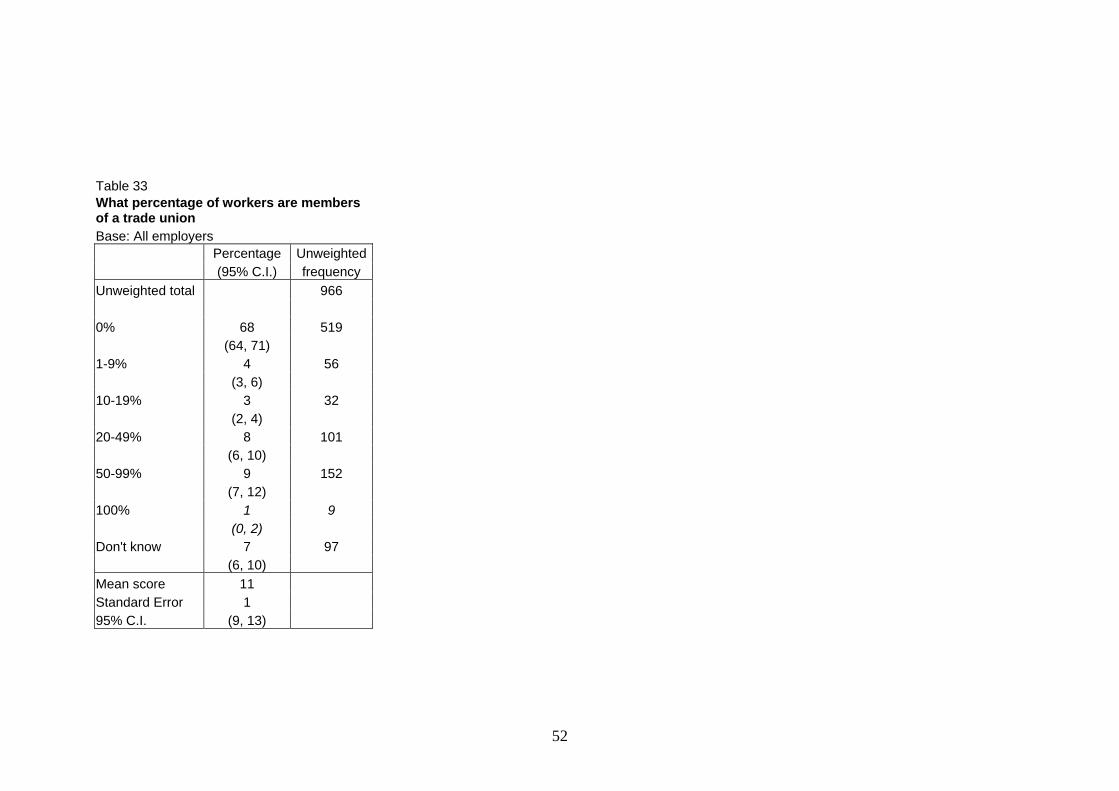
Table 33 What percentage of workers are members of a trade union Base: All employers Percentage Unweighted (95% C.I.) frequency Unweighted total 966 0% 68 519 (64, 71) 1-9% 4 56 (3, 6) 10-19% 3 32 (2, 4) 20-49% 8 101 (6, 10) 50-99% 9 152 (7, 12) 100% 1 9 (0, 2) Don't know 7 97 (6, 10) Mean score 11 Standard Error 1 95% C.I. (9, 13)
52
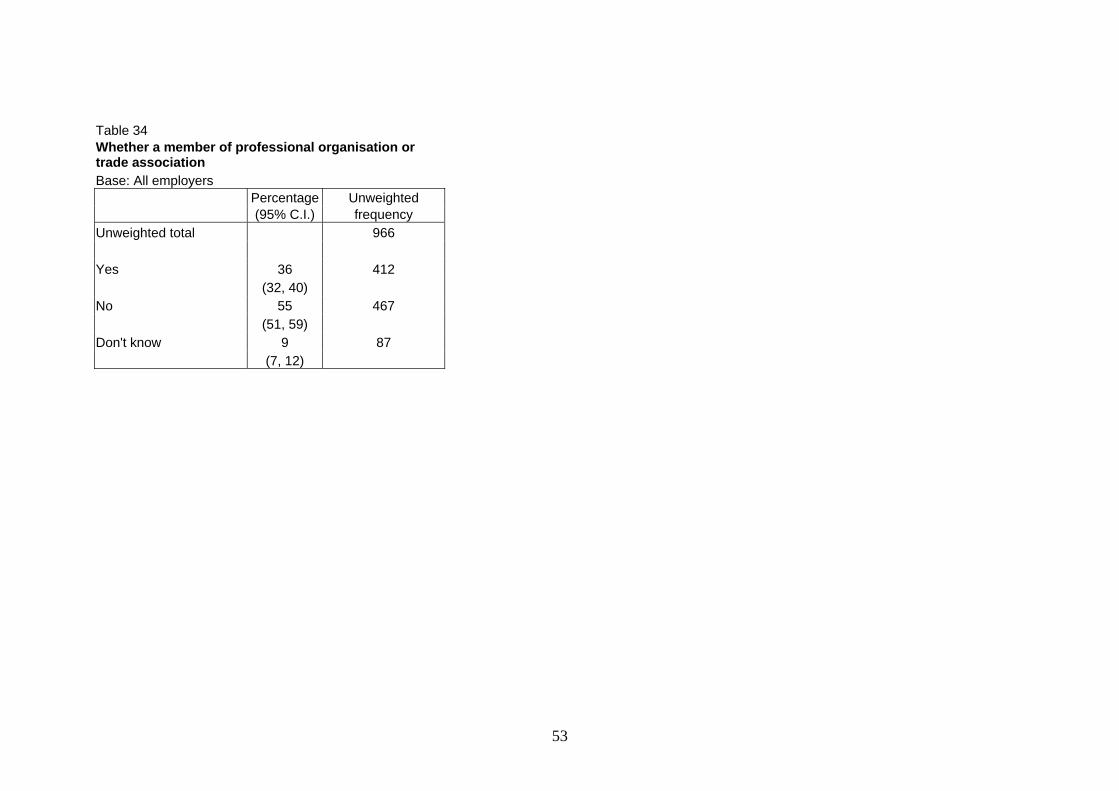
Table 34 Whether a member of professional organisation or trade association Base: All employers Percentage Unweighted (95% C.I.) frequency Unweighted total 966 Yes 36 412 (32, 40) No 55 467 (51, 59) Don't know 9 87 (7, 12)
53
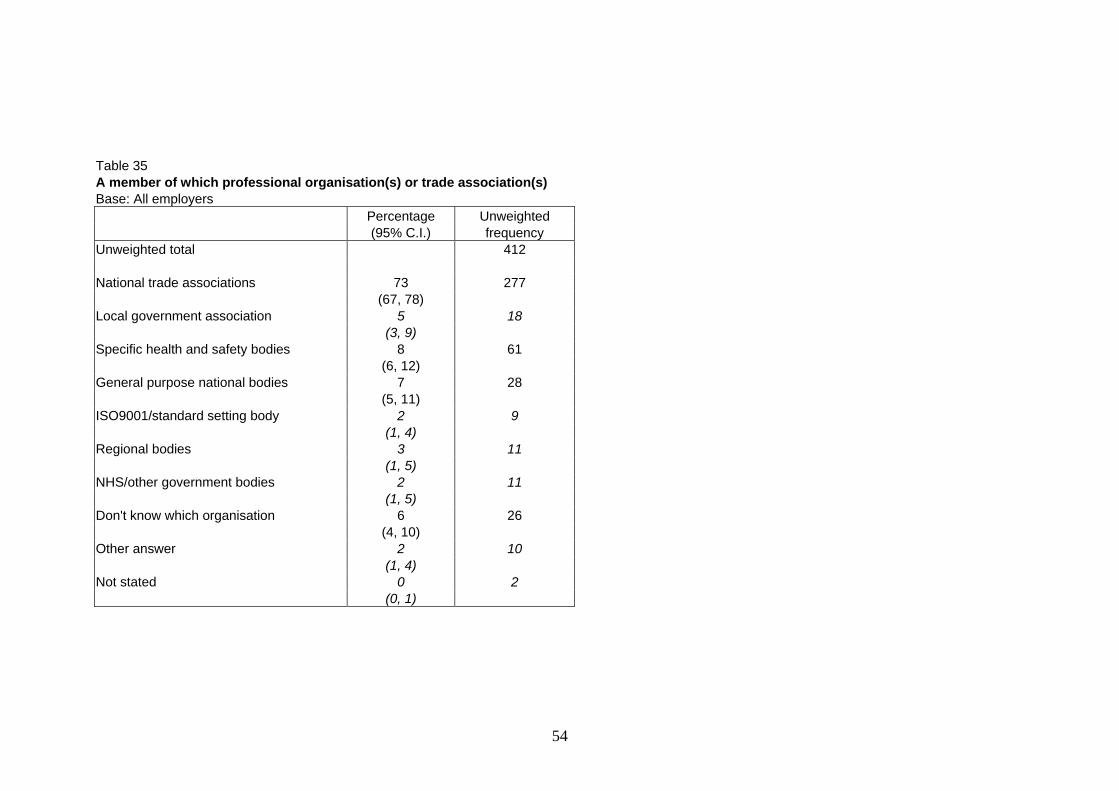
Table 35 A member of which professional organisation(s) or trade association(s) Base: All employers Percentage Unweighted (95% C.I.) frequency Unweighted total 412 National trade associations 73 277 (67, 78) Local government association 5 18 (3, 9) Specific health and safety bodies 8 61 (6, 12) General purpose national bodies 7 28 (5, 11) ISO9001/standard setting body 2 9 (1, 4) Regional bodies 3 11 (1, 5) NHS/other government bodies 2 11 (1, 5) Don't know which organisation 6 26 (4, 10) Other answer 2 10 (1, 4) Not stated 0 2 (0, 1)
54

Table 36 Whether discuss health and safety issues with workforce Base: Workplaces with fewer than 25 workers Percentage Unweighted (95% C.I.) frequency Unweighted total 449 Yes 85 383 (81, 88) No 15 66 (12, 19)
55
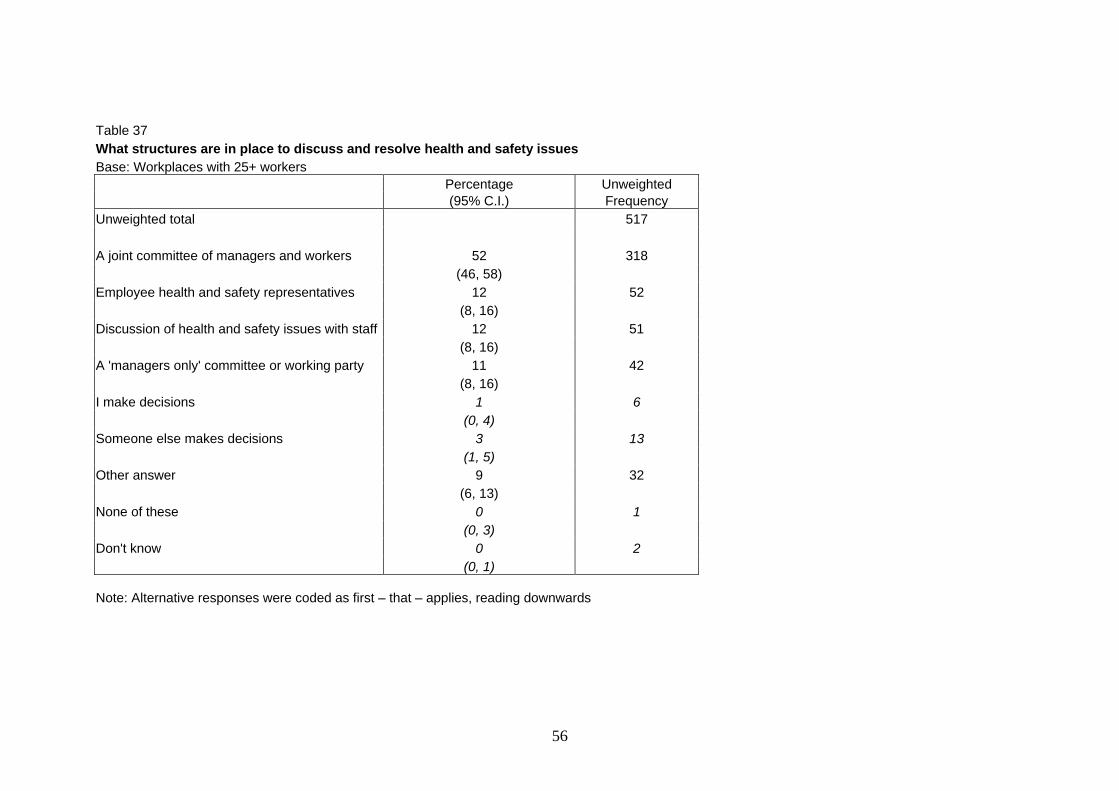
Table 37 What structures are in place to discuss and resolve health and safety issues Base: Workplaces with 25+ workers
Percentage Unweighted
(95% C.I.) Frequency Unweighted total 517 A joint committee of managers and workers 52 318 (46, 58) Employee health and safety representatives 12 52 (8, 16) Discussion of health and safety issues with staff 12 51 (8, 16) A 'managers only' committee or working party 11 42 (8, 16) I make decisions 1 6 (0, 4) Someone else makes decisions 3 13 (1, 5) Other answer 9 32 (6, 13) None of these 0 1 (0, 3) Don't know 0 2 (0, 1) Note: Alternative responses were coded as first – that – applies, reading downwards
56

Table 38 Whether joint committee meet regularly or when issues arise Base: All employers with a joint committee for health and safety Percentage Unweighted (95% C.I.) frequency Unweighted total 310 Meet regularly to discuss health and safety issues 87 284 (81, 92) Meet to discuss health and safety issues only when they arise 12 24 (8, 19)Don’t know 1 2 (0, 2)
57
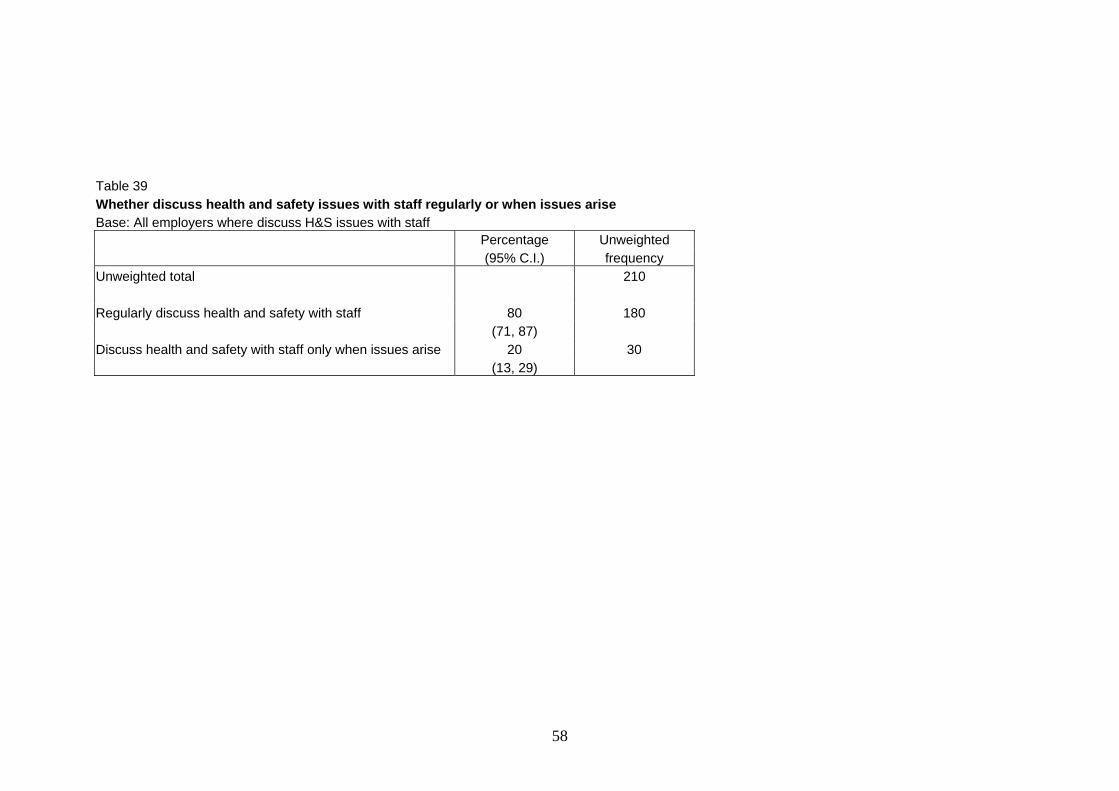
Table 39 Whether discuss health and safety issues with staff regularly or when issues arise Base: All employers where discuss H&S issues with staff Percentage Unweighted (95% C.I.) frequency Unweighted total 210 Regularly discuss health and safety with staff 80 180 (71, 87) Discuss health and safety with staff only when issues arise 20 30 (13, 29)
58

Table 40 Whether decisions made alone or after informal discussion Base: All employers who make decisions about health and safety issues
Percentage Unweighted (95% C.I.) Frequency Unweighted total 100 On your own 8 7 (3, 19) After informal discussion with colleagues/staff 87 91 (74, 94) Don’t know 5 2 (1, 18)
59
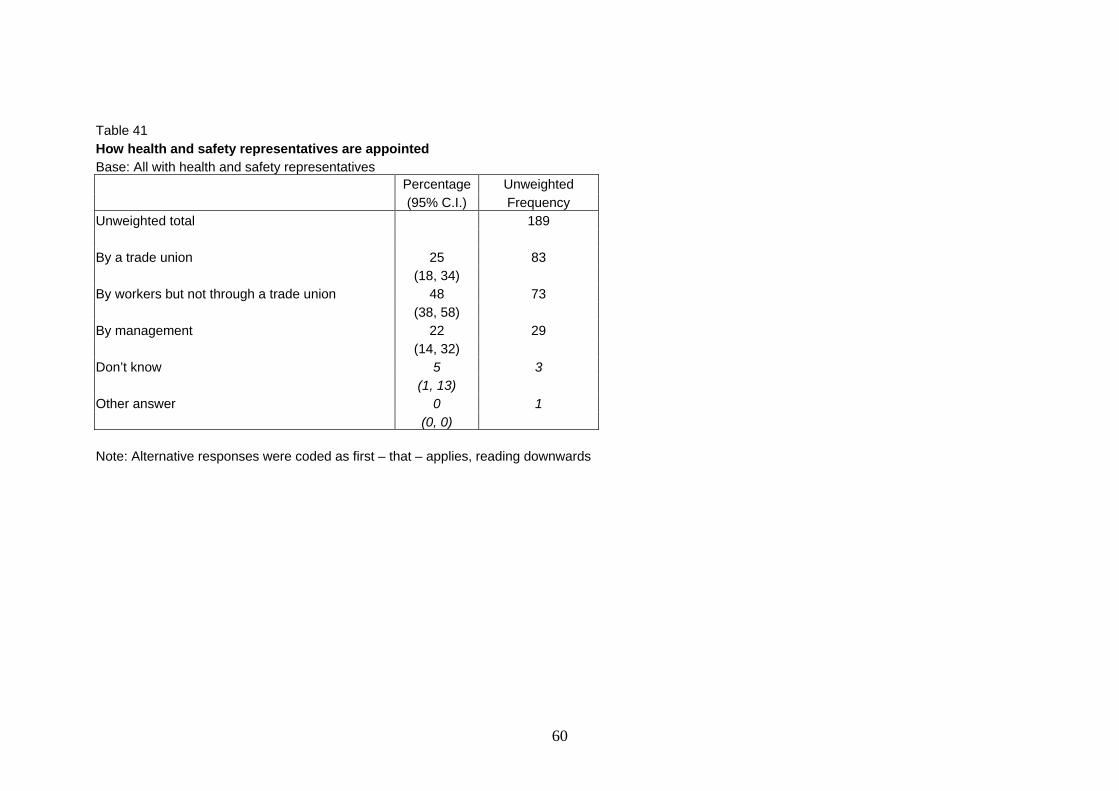
Table 41 How health and safety representatives are appointed Base: All with health and safety representatives Percentage Unweighted (95% C.I.) Frequency Unweighted total 189 By a trade union 25 83 (18, 34) By workers but not through a trade union 48 73 (38, 58) By management 22 29 (14, 32) Don’t know 5 3 (1, 13) Other answer 0 1 (0, 0) Note: Alternative responses were coded as first – that – applies, reading downwards
60
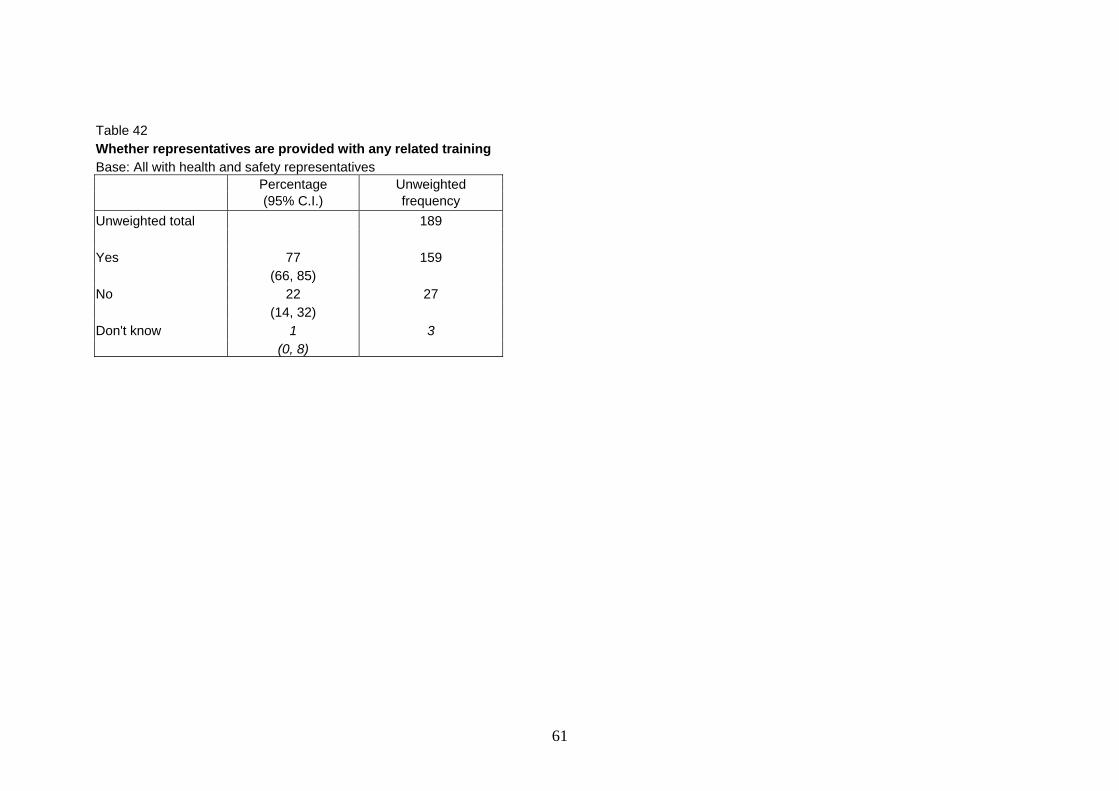
Table 42 Whether representatives are provided with any related training Base: All with health and safety representatives Percentage Unweighted (95% C.I.) frequency Unweighted total 189 Yes 77 159 (66, 85) No 22 27 (14, 32) Don't know 1 3 (0, 8)
61

Table 43 Whether there is a written health and safety policy and whether there are documented procedures for implementing it Base: Workplaces with 25+ workers
Written H&S policy Documented procedures for
implementation Percentage Unweighted Percentage Unweighted (95% C.I.) frequency (95% C.I.) frequencyUnweighted total 517 514 Yes 99 514 96 504 (96, 100) (92, 98) No 1 3 3 8 (0, 4) (1, 6)Don't know - - 1 2 (0, 5)
62
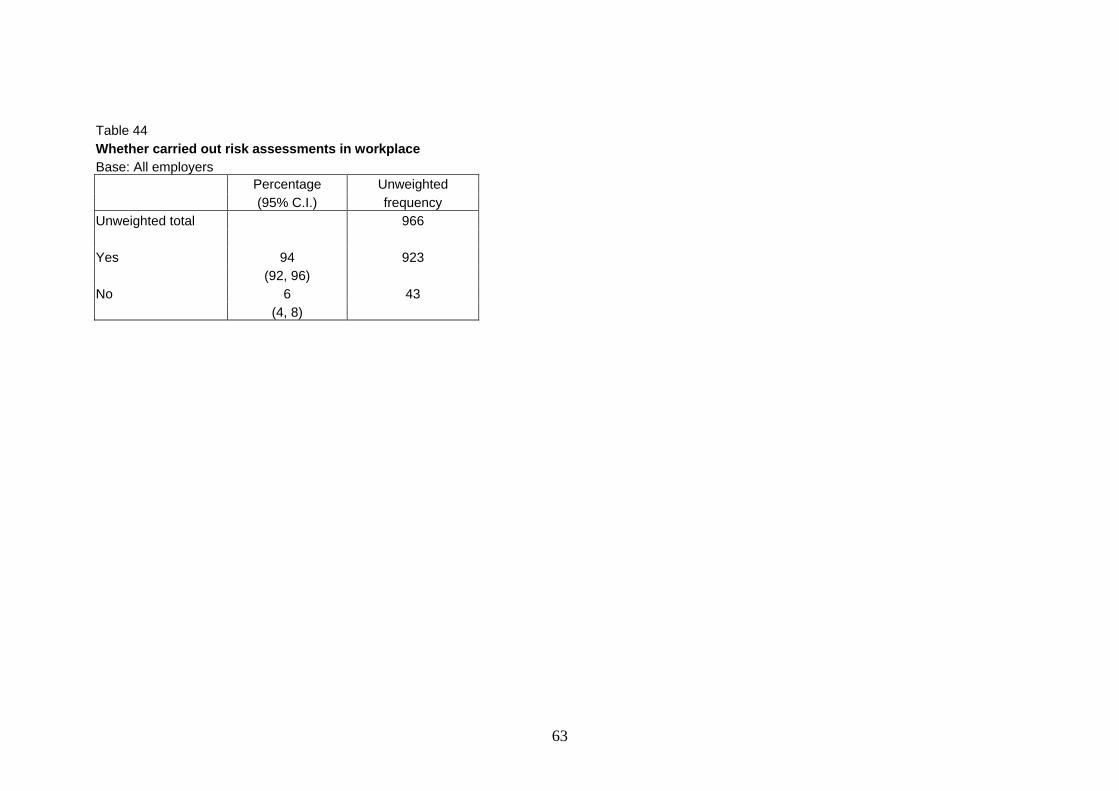
Table 44 Whether carried out risk assessments in workplace Base: All employers Percentage Unweighted (95% C.I.) frequency Unweighted total 966 Yes 94 923 (92, 96) No 6 43 (4, 8)
63

Table 45 Three most COMMON and three most SEVERE risks in workplace Base: All carrying out risk assessments in workplace Common risks Severe risks Percentage Unweighted Percentage Unweighted (95% C.I.) (95% C.I.) frequency frequency Unweighted total 923 923 Stress 3 36 3 30 (2, 4) (2, 5) PC/ Laptop usage 10 115 7 72 (8, 13) (6, 10) Work requiring repetitive movement of upper limbs other than PC-related 4 40 1 22 (3, 5) (1, 3) Work in awkward or tiring positions 4 34 2 22 (2, 5) (1, 3) Lifting or carrying weights by hand 37 390 25 266 (33, 41) (22, 28) Work requiring appreciable force 1 6 1 7 (0, 2) (0, 2) Table 45 continued on next page
64

Common risks Severe risks Percentage Unweighted Percentage Unweighted (95% C.I.) (95% C.I.) frequency frequency Vibration to hands from use of 4 38 3 34 powered tools or machines (3, 6) (2, 5) Vibration or jolting from riding, sitting 1 8 0 3or standing up on vehicles or machines (0, 2) (0, 1) Noise 1 13 1 14 (1, 2) (1, 2) Handling or touching chemical or 4 43 5 56 biological materials or substances (3, 5) (3, 6) Breathing in dusts, fumes, smoke 2 32 2 35 gases or vapours (2, 4) (2, 4) Being threatened, verbally abused, 5 54 6 59 intimidated or physically attacked (4, 7) (4, 8) Working at height 7 76 6 89 (5, 9) (5, 8) Slipping or tripping 47 477 29 287 (43, 51) (25, 32) Driving or working around vehicles 8 100 9 115 (7, 11) (7, 11) Table 45 continued on next page
65

Common risks Severe risks Percentage Unweighted Percentage Unweighted (95% C.I.) (95% C.I.) frequency frequency Contact with moving machinery/ 4 41 5 54 tools (general) (3, 6) (3, 6) Handling sharps (cuts) 14 129 9 74 (12, 18) (7, 12) Handling/contact with hot objects 9 68 6 55 or liquids (burns/scalds) (7, 12) (5, 9) Lone working 1 13 1 11 (1, 2) (0, 2) Fire 3 24 4 42 (2, 5) (3, 6) Electricity/electrocution 5 47 8 73 (4, 7) (6, 11) Falling objects 2 26 2 26 (1, 3) (1, 4) Infection 2 12 1 10 (1, 3) (0, 2) Injuries from animals 1 6 1 7 (0, 1) (0, 2) Table 45 continued on next page
66
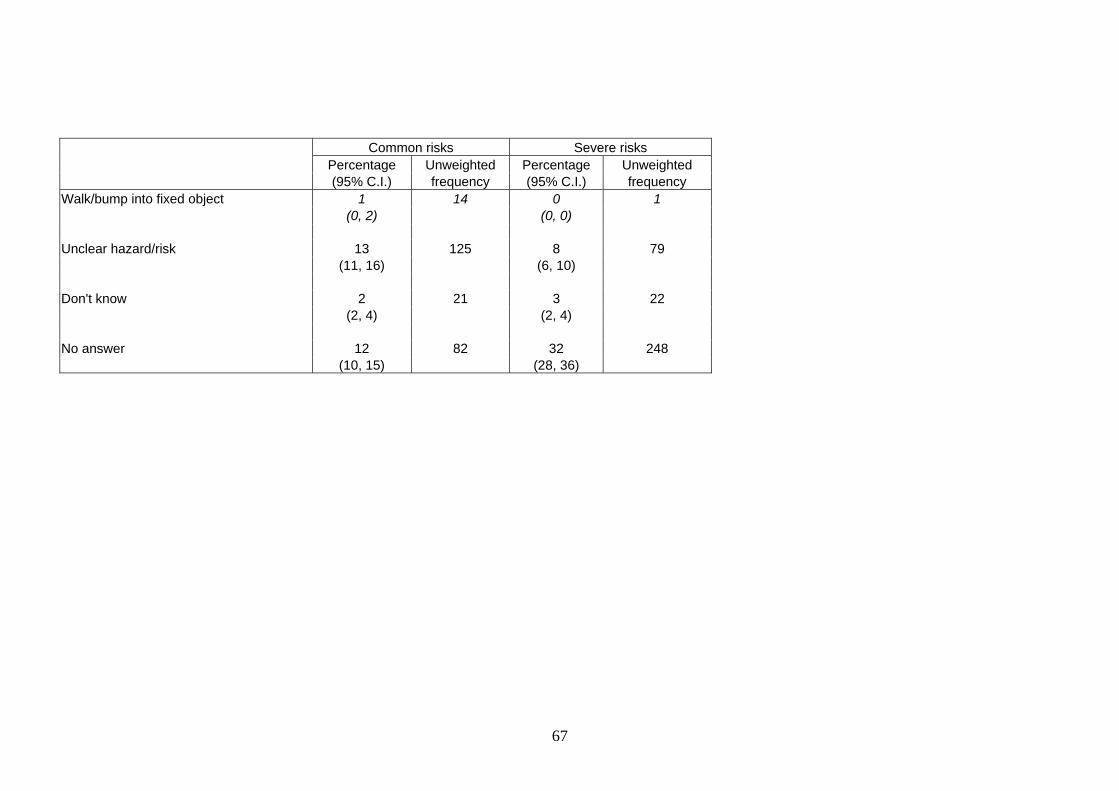
Common risks Severe risks Percentag Percentage Unweighted e Unweighted (95% C.I.) frequency (95% C.I.) frequency Walk/bump into fixed object 1 14 0 1 (0, 2) (0, 0) Unclear hazard/risk 13 125 8 79 (11, 16) (6, 10) Don't know 2 21 3 22 (2, 4) (2, 4) No answer 12 82 32 248 (10, 15) (28, 36)
67
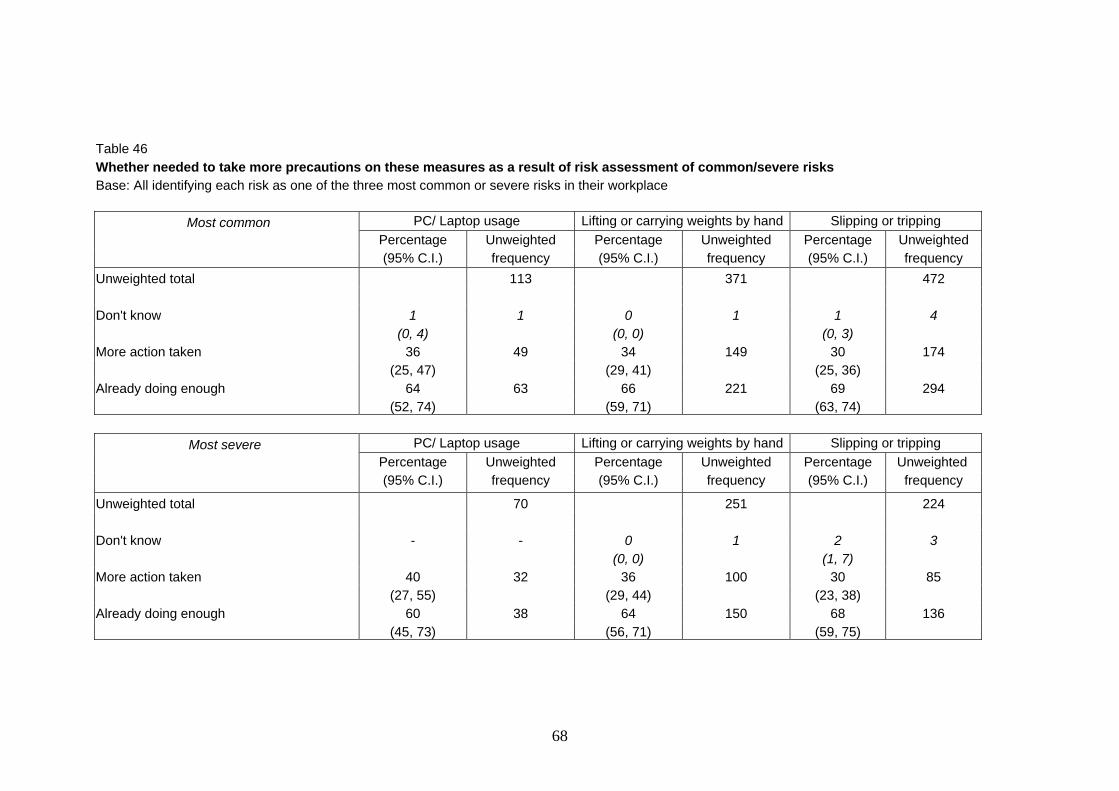
Table 46
PC/ Laptop usage
Whether needed to take more precautions on these measures as a result of risk assessment of common/severe risks Base: All identifying each risk as one of the three most common or severe risks in their workplace
Most common Lifting or carrying weights by hand Slipping or tripping Percentage Unweighted Percentage Unweighted Percentage Unweighted (95% C.I.) frequency (95% C.I.) frequency (95% C.I.) frequency Unweighted total 371 113 472 Don't know 1 1 0 1 1 4 (0, 4) (0, 0) (0, 3)More action taken 36 49 34 149 30 174 (25, 47) (29, 41) (25, 36) Already doing enough 64 63 66 221 69 294 (52, 74) (59, 71) (63, 74)
Most severe PC/ Laptop usage Lifting or carrying weights by hand Slipping or tripping Percentage Unweighted hted Percentage Unweighted Percentage Unweig
(95% C.I.) frequency (95% C.I.) frequency (95% C.I.) frequency
Unweighted total 70 251 224 Don't know - - 0 1 2 3 (0, 0) (1, 7) More action taken 40 32 36 100 30 85 (27, 55) (29, 44) (23, 38) Already doing enough 60 38 64 150 68 136 (45, 73) (56, 71) (59, 75)
68

Table 47 Assessment of current control of these risks Base: All identifying each risk as one of the three most common or severe risks in their workplace
Most common PC/ Laptop usage Lifting or carrying weights
by hand Slipping or tripping
Identified as common risk Identified as on risk comm Identified as common risk Percentage Unweighted Percentage Unweighted Percentage Unweighted (95% C.I.) frequency (95% C.I.) frequency (95% C.I.) frequency Unweighted total 113 371 472 Excellent 17 14 14 37 16 51 (9, 28) (10, 20) (12, 21) Very good 41 47 34 120 39 181 (30, 53) (28, 41) (33, 44) Good 34 45 47 190 42 212 (24, 46) (41, 54) (36, 48) Neither good nor poor 5 5 4 20 3 26 (2, 14) (2, 6) (2, 6)Poor - - 1 4 0 2 (0, 3) (0, 3) Don’t know 3 - 2 - - (1, 12) Table 46 continued on next page
69

Most severe PC/ Laptop usage Lifting or carrying weights by hand Slipping or tripping Identified as common risk Identified as common risk Identified as common risk Percentage Unweighted Percentage Unweighted Percentage Unweighted (95% C.I.) frequency (95% C.I.) frequency (95% C.I.) frequency Unweighted total 70 251 224 Excellent 11 1 6 4 24 15 23 (5, 25) (9, 21) (10, 23) Very good 44 32 33 75 38 89 (31, 59) (26, 41) (30, 46) Good 134 101 37 27 49 42 (24, 51) (41, 57) (35, 51) Neither good nor poor 5 4 3 15 4 11 (1, 18) (2, 7) (2, 9) Poor 3 - 1 0 3 - (0, 17) (0, 1)
70

Table 48: How decided that enough was being done about these risks Base: All identifying each risk as one of the three most common or severe risks in their workplace
Slipping or tripping
PC/ Laptop usage PC/ Laptop usage Lifting or carrying Slipping or tripping
Identified as common risk Identified as common risk Identified as severe risk Identified as severe risk Identified as severe risk
Percentage Unwe Percentage Unweighted Percentage Unweighted ighted Percentage Unweighted Percentage Unweighted
frequency (95% C.I.) frequency (95% C.I.) frequency (95% C.I.) (95% C.I.) frequency (95% C.I.) frequency
Unweighted total 39 63 298 150 137 Took advice from external expert 5 15 10 11 27 13 11 15 13 14 (4, 32) (7, 30) (7, 16) (6, 19) (7, 22) Quantitative risk assessment used 40 41 28 42 139 18 36 66 36 58 (27, 57) (36, 49) (23, 60) (27, 45) (27, 47)Made a personal judgement 14 6 23 63 8 3 18 24 20 23 (6, 31) (18, 30) (2, 28) (13, 30) (12, 27)Provided training 0 3 1 8 - - 0 2 - (0, 1) (1, 6) (0, 2) Compared with good practice 24 17 31 84 35 14 31 52 26 31 (14, 40) (25, 38) (19, 55) (23, 41) (18, 36)Followed policy/legislation 1 8 5 0 - - - - - (3, 20) (0, 3) Review/monitor accident levels 2 3 4 18 - - - - - (0, 13) (2, 8) Discussed with staff / 8 - - - 1 10 2 8 - 1 advised internally (4, 22) (1, 5) (0, 4) Provided extra equipment/ 6 - - - 4 3 11 5 1 -implemented procedures (2, 17) (2, 7) (1, 28) Other answer 0 1 1 - - - 5 - 0 1 (0, 1) (0, 5) (0, 2) Had no/few accidents 14 - - - 4 - 1 1 - - (2, 7) (0, 8) Don't know - - 2 2 - - - - 4 2 (0, 7) (1, 14) No answer - 13 26 - - - 8 25 35 40 (5, 30) (17, 35) (18, 35)
71
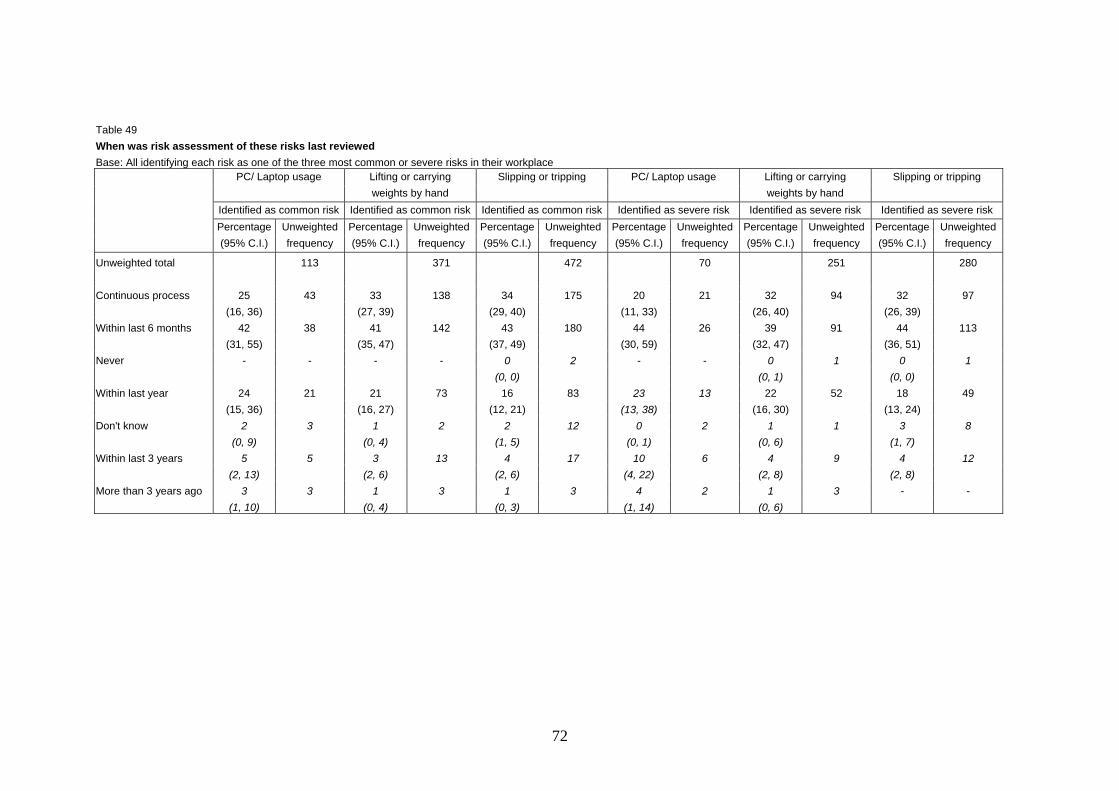
Table 49 When was risk assessment of these risks last reviewed
Base: All identifying each risk as one of the three most common or severe risks in their workplace Slipping or tripping
Slipping or tripping PC/ Laptop usage Lifting or carrying PC/ Laptop usage Lifting or carrying
weights by hand weights by hand
Identified as common risk Identified as common risk Identified as common risk Identified as severe risk Identified as severe risk Identified as severe risk
Percentage Unweighted Unweighted Unweighted Percentage Unweighted Percentage Unweighted Percentage Percentage Percentage Unweighted
frequency (95% C.I.) frequency (95% C.I.) frequency (95% C.I.) frequency (95% C.I.) (95% C.I.) frequency (95% C.I.) frequency
Unweighted total 251 113 371 472 70 280 Continuous process 4 1 5 25 3 33 138 34 7 20 21 32 94 32 97 (26, 39) (16, 36) (27, 39) (29, 40) (11, 33) (26, 40)Within last 6 months 38 42 41 142 43 180 44 26 39 91 44 113 (30, 59) (32, (31, 55) (35, 47) (37, 49) 47) (36, 51)Never - - - - 0 2 - - 0 1 0 1 (0, 0) (0, 1) (0, 0)Within last year 83 24 21 21 73 16 23 13 22 52 18 49 (15, 36) (16, 27) (12, 21) (13, 24) (13, 38) (16, 30)Don't know 2 3 3 1 2 2 12 0 2 1 1 8 (0, 9) (0, 4) (1, 5) (0, 1) (0, 6) (1, 7)Within last 3 years 5 5 9 12 3 13 4 17 10 6 4 4 (2, 13) (2, 6) (2, 6) (4, 22) (2, 8) (2, 8)More than 3 years ago - 3 3 1 3 1 3 4 2 1 3 - (1, 10) (0, 4) (0, 3) (1, 14) (0, 6)
72

Table 50 Barriers to improving risk control Base: All employers identifying any risks where it is thought that current control of any risk is less than good Percentage Unweighted (95% C.I.) frequency Unweighted total 105 Costs 30 35 (19, 43) Lack of communication with managers 6 16 (3, 13) Lack of training 4 8 (2, 8) Lack of time 20 16 (11, 32) Lack of staff 12 13 (6, 24) Paperwork 6 4 (2, 16) Planning difficulties 9 9 (4, 20) Worker resistance 16 13 (8, 29) Working practices 4 9 (2, 11) Lack of resources - general 3 3 (1, 11) No answer 14 11 (7, 27) Don't know 2 2 (0, 12) Other answer 11 13 (5, 22)
73

Table 51 Which of these risks are present in the workplace Base: All employers Percentage Unweighted (95% C.I.) frequency Unweighted total 966 Stress 57 614 (53, 60) PC/ Laptop usage 54 615 (50, 58) Work requiring repetitive movement of upper limbs not PC-related 31 360 (27, 34) Work in awkward or tiring positions 26 292 (23, 29) Lifting or carrying weights by hand 67 706 (63, 70) Work requiring appreciable force 20 244 (17, 23) Vibration to hands from use of powered tools or machines 15 206 (12, 17) Vibration/jolting from riding, sitting or standing on vehicles/machines 7 123 (6, 9) Noise 20 2 3 8 (18, 23) Handling or touching chemical or biological materials or substances 37 4 5 2 (33, 41) Breathing in dusts, fumes, smoke, gases or vapours 23 3 3 0 (20, 26) Being threatened, verbally abused, intimidated or physically attacked 36 360 (32, 40) Working at height 20 281 (17, 23) Slipping or tripping 74 763 (70, 77) Driving or working around vehicles 31 412 (27, 34) Don't know 0 2 (0, 1) None of these 5 3 0 (4, 7)
74

Table 52
rkplace and assessment is provided Assessment of control of these hazards in workplace Base: All where each hazard present in wo Stress PC/ Laptop usage Work requiring repetitive Work in awkward Lifting or carrying Work requiring
movement of upper limbs or tiring positions weights by hand appreciable force
other than PC-related
Percentage Unweighted Percentage Unweighted Percentage Unweighted Percentage Unweighted Percentage Unweighted Percentage Unweighted
(95% C.I.) frequency (95% C.I.) frequency (95% C.I.) frequency (95% C.I.) frequency (95% C.I.) frequency (95% C.I.) frequency
Unweighted total 607 244 601 353 287 703 Excellent 8 37 13 67 8 23 8 17 13 73 11 16 (6, 11) (10, 17) (7, 19) (5, 13) (5, 14) (10, 17) Very good 27 112 25 23 133 30 200 77 32 221 28 60 (19, 27) (25, 34) (21, 33) (19, 31) (28, 37) (21, 36)Good 149 45 277 45 276 52 179 48 149 48 353 51 (40, 49) (40, 50) (45, 58) (40, 55) (43, 53) (43, 59)Neither good/poor 38 47 17 112 9 54 11 16 40 5 9 16 (13, 21) (7, 13) (7, 16) (11, 22) (4, 7) (5, 15) Poor 5 39 2 10 0 1 1 3 1 9 0 3 (4, 8) (1, 4) (0, 0) (0, 4) (1, 3) (0, 2)Very poor 0 3 - - - - 1 1 - - - - (0, 2) (0, 4) Table 52 continued on next page
75

Noise Handling or touching Breathing in dusts Threatened, verbally Working at height Slipping or tripping
chemical or biological fumes, smoke, gases abused, intimidated
materials or substances or vapours or physically attacked
UnweightedPercentage Unweighted Percentage Unweighted Percentage Unweighted Percentage Unweighted Percentage Percentage Unweighted
(95% C.I.) frequency (95% C.I.) frequency (95% C.I.) frequency (95% C.I.) frequency (95% C.I.) frequency (95% C.I.) frequency
Unweighted total 279 420 300 351 280 761 Excellent 9 26 20 72 14 44 12 34 11 34 13 78 (11, 17) (5, 14) (16, 26) (9, 19) (8, 17) (7, 18) Very good 34 27 89 40 184 29 100 35 113 101 36 272 (21, 34) (34, 46) (23, 36) (32, 41) (29, 41) (27, 42)Good 50 130 36 151 42 128 38 153 47 124 43 350 (42, 57) (30, 42) (35, 50) (32, 44) (39, 55) (39, 47)Neither good/poor 10 28 2 10 12 19 10 38 4 16 6 56 (6, 17) (1, 5) (2, 9) (6, 16) (7, 14) (5, 9) Poor 3 5 6 0 1 3 8 3 12 2 5 1 (1, 7) (0, 0) (1, 6) (1, 7) (1, 7) (0, 2) Very poor - - - - 1 1 0 1 - - - - (0, 5) (0, 1) Table 52 continued on next page
76
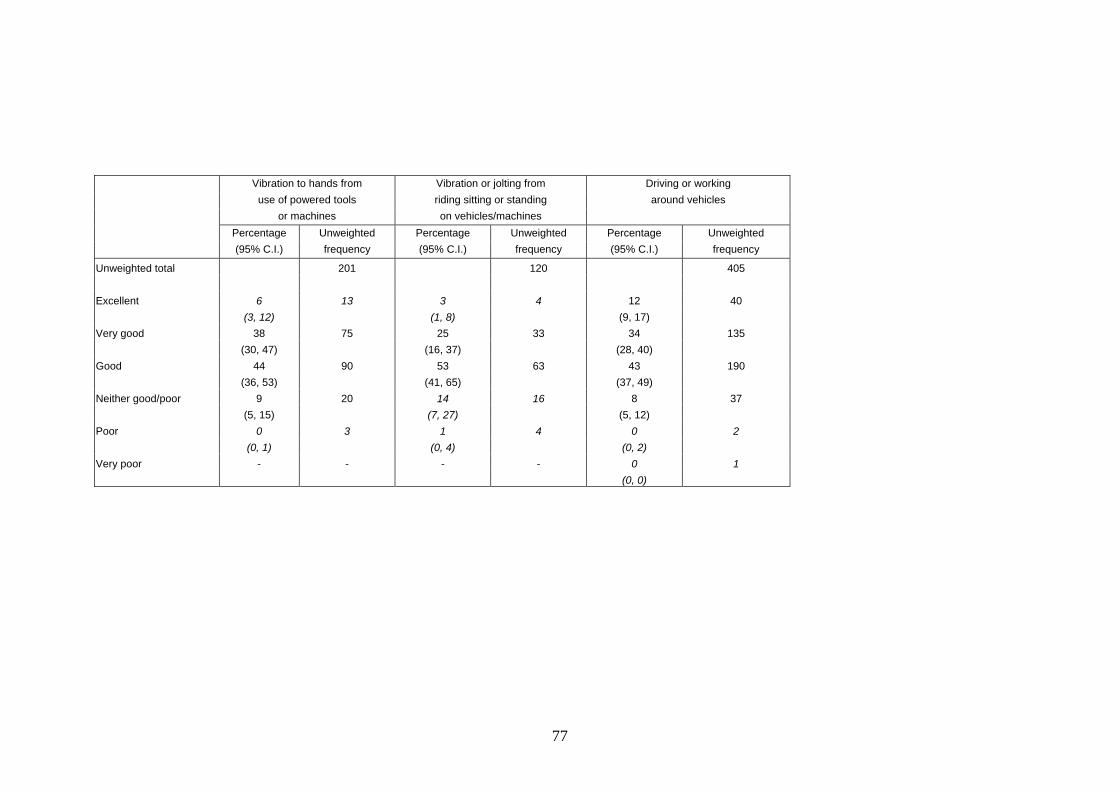
Vibration to hands from Vibration or jolting from Driving or working
use of powered tools riding sitting or standing around vehicles
on vehicles/machines or machines
Percentage Unweighted Percentage Unweighted Percentage Unweighted
(95% C.I.) frequency (95% C.I.) frequency (95% C.I.) frequency
Unweighted total 201 120 405 Excellent 1 4 12 40 6 3 3 (3, 12) (1, 8) (9, 17) Very good 33 38 75 25 34 135 (30, 47) (16, 37) (28, 40) Good 44 90 53 63 43 190 (36, 53) (41, 65) (37, 49) Neither good/poor 9 20 14 16 8 37 (5, 15) (7, 27) (5, 12) Poor 0 3 1 4 0 2 (0, 1) (0, 4) (0, 2)Very poor - - - - 0 1 (0, 0)
77

Table 53 Which external sources of information/advice on health and safety were used in last 12 months Base: All employers Percentage Unweighted (95% C.I.) frequency Unweighted total 966 Local health and safety inspector 39 422 (36, 43) Local authority publications 46 472 (42, 50) HSE infoline 35 416 (32, 39) HSE publications / website 57 651 (54, 61) Websites other than HSE 35 455 (32, 39) Publications other than HSE 47 570 (44, 51) Insurance company 40 437 (36, 43) Trade associations or local/national business groups 29 358 (26, 33) Trade unions 12 188 (10, 14) Supplier of equipment or materials 52 589 (48, 56) Private health and safety specialist or consultant 31 382 (28, 34) Fire brigade 1 8 (0, 2) Internal source 2 26 (2, 4) Training/courses 1 7 (0, 1) None of these 8 49 (6, 10) Don't know 1 6 (0, 2) Other answer 0 6 (0, 1)
78
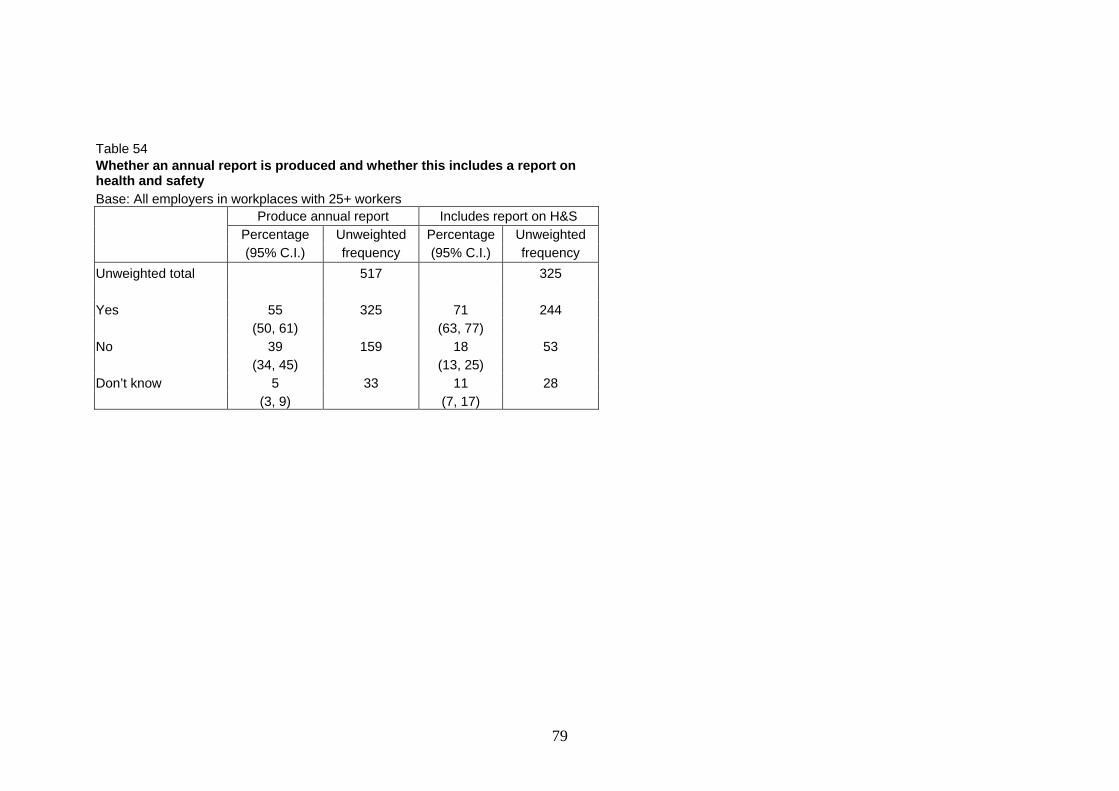
Table 54 Whether an annual report is produced and whether this includes a report on health and safety Base: All employers in workplaces with 25+ workers Produce annual report Includes report on H&S Percentage Unweighted Percentage Unweighted (95% C.I.) frequency (95% C.I.) frequency Unweighted total 325 517 Yes 325 244 55 71 (50, 61) (63, 77) No 39 159 18 53 (34, 45) (13, 25) Don’t know 2 5 33 11 8 (3, 9) (7, 17)
79
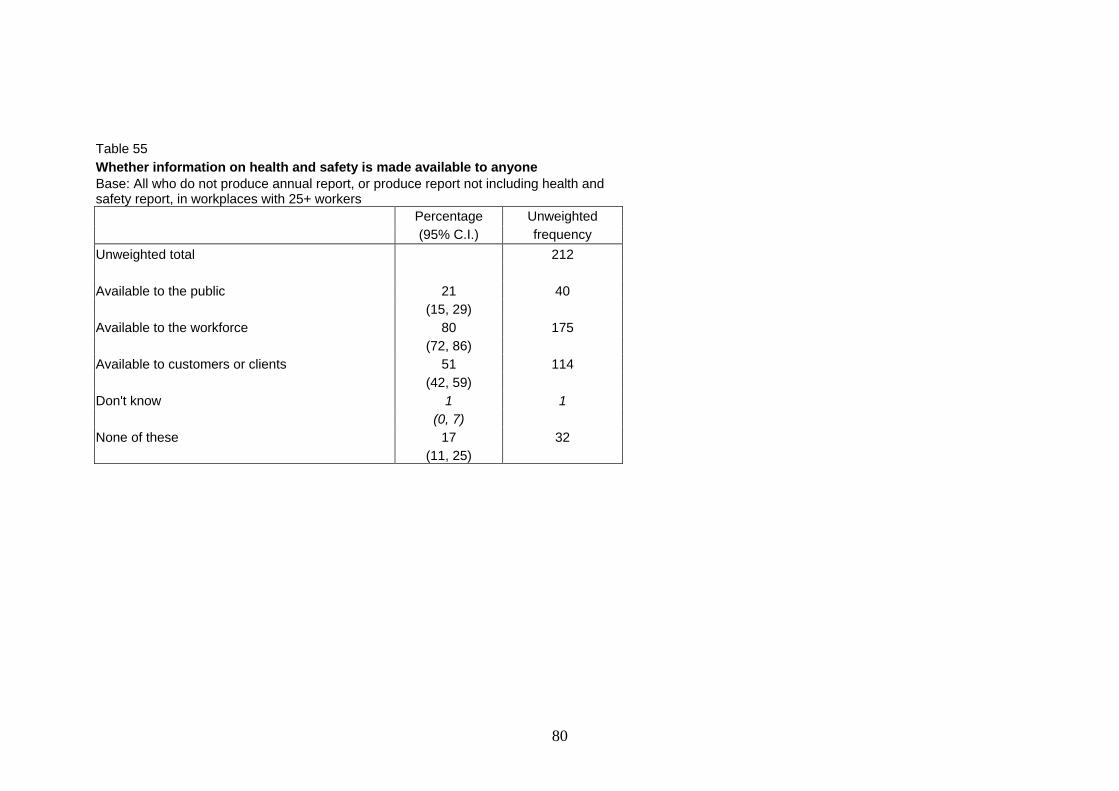
Table 55 Whether information on health and safety is made available to anyone Base: All who do not produce annual report, or produce report not including health and safety report, in workplaces with 25+ workers Percentage Unweighted (95% C.I.) frequency Unweighted total 212 Available to the public 21 40 (15, 29) Available to the workforce 80 175 (72, 86) Available to customers or clients 51 114 (42, 59) Don't know 1 1 (0, 7) None of these 17 32 (11, 25)
80

Table 56 Whether have targets for health and safety performance and whether health and safety is regularly considered at top of company Base: All employers in workplaces with 25+ workers
H&S targets H&S considered at top of company
Percentage Unweighted Percentage Unweighted (95% C.I.) frequency (95% C.I.) frequency Unweighted total 517 517 Yes 97 40 265 503 (35, 46) (94, 98) No 52 227 3 12 (46, 58) (1, 5) Don't know 8 25 0 2 (5, 12) (0, 1)
81

Table 57 How recently health and safety systems and procedures reviewedBase: All employers in workplaces with 25+ workers Percentage Unweighted (95% C.I.) frequency Unweighted total 517 Year 74 369 (69, 79) Two years 15 99 (12, 20) Five years 6 21 (3, 10) Not fully reviewed on this timescale 2 1 8 (1, 4) Don't know 3 10 (1, 6)
82
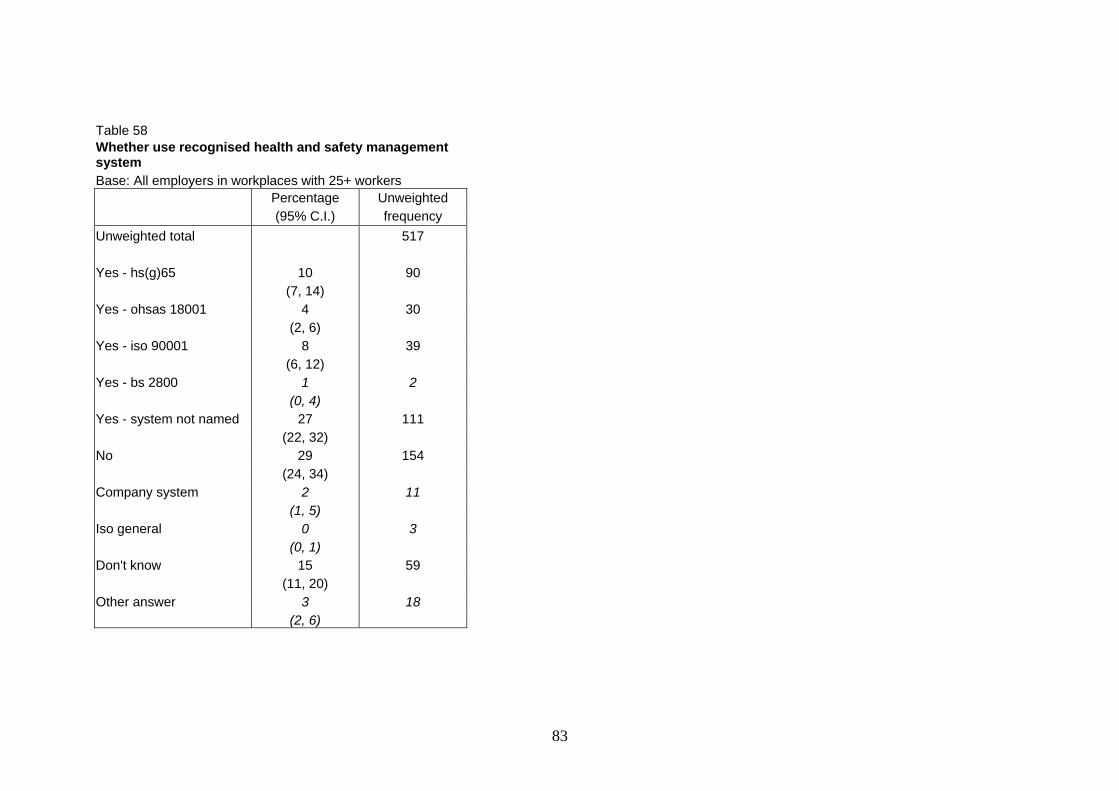
Table 58 Whether use recognised health and safety management system Base: All employers in workplaces with 25+ workers
Un Percentage weighted (95% C.I.) frequency Unweighted total 517 Yes - hs(g)65 10 90 (7, 14) Yes - ohsas 18001 4 30 (2, 6) Yes - iso 90001 8 39 (6, 12) Yes - bs 2800 1 2 (0, 4) Yes - system not named 27 111 (22, 32) No 29 154 (24, 34) Company system 2 11 (1, 5) Iso general 0 3 (0, 1) Don't know 15 59 (11, 20) Other answer 3 18 (2, 6)
83

Table 59 Whether require suppliers to work to recognised health and safety management system or a specified performance standard Base: All employers in workplaces with 25+ workers Percentage Unweighted (95% C.I.) frequency Unweighted total 517 Yes - all 59 323 (53, 64) Yes - some 8 53 (5, 11) No 23 102 ) (18, 28 Not applicable 3 13 (2, 6) Don’t know 8 26 (5, 12)
84
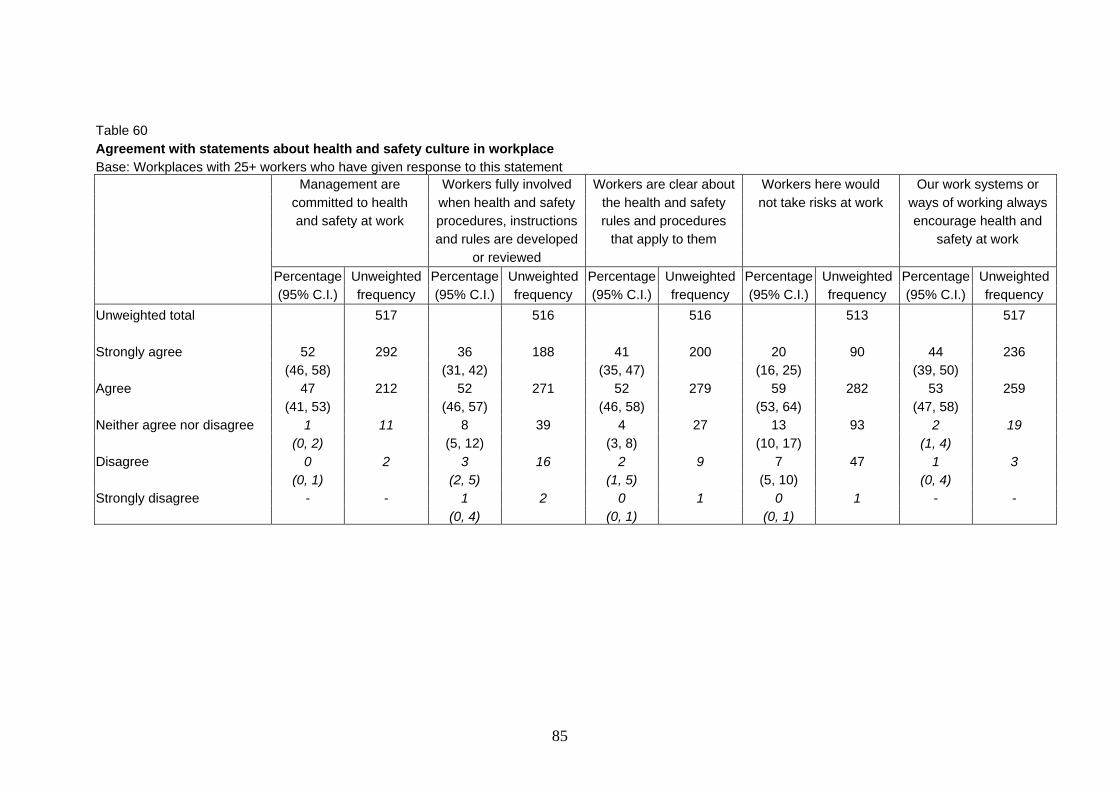
Table 60
Workers are clear about Our work systems or
Agreement with statements about health and safety culture in workplace Base: Workplaces with 25+ workers who have given response to this statement Management are Workers fully involved Workers here would committed to health when health and safety the health and safety not take risks at work ways of working always and safety at work procedures, instructions rules and procedures encourage health and and rules are developed that apply to them safety at work or reviewed Percentage Unweighted Percentage Unweighted Percentage Unweighted Percentage Unweighted Percentage Unweighted (95% C.I.) frequency (95% C.I.) frequency (95% C.I.) frequency (95% C.I.) frequency (95% C.I.) frequency Unweighted total 517 516 516 513 517 Strongly agree 2 2 3 2 6 52 9 6 188 41 200 20 90 44 3 (46, 58) (31, 42) (35, 47) (16, 25) (39, 50)Agree 47 212 52 271 52 279 59 282 53 259 (41, 53) (46, 57) (46, 58) (53, 64) (47, 58)Neither agree nor disagree 1 11 8 39 4 27 13 93 2 19 (0, 2) (5, 12) (3, 8) (10, 17) (1, 4) Disagree 2 1 4 0 3 6 2 9 7 7 1 3 (0, 1) (2, 5) (1, 5) (5, 10) (0, 4) Strongly disagree - - 1 - 2 0 1 0 1 - (0, 4) (0, 1) (0, 1)
85
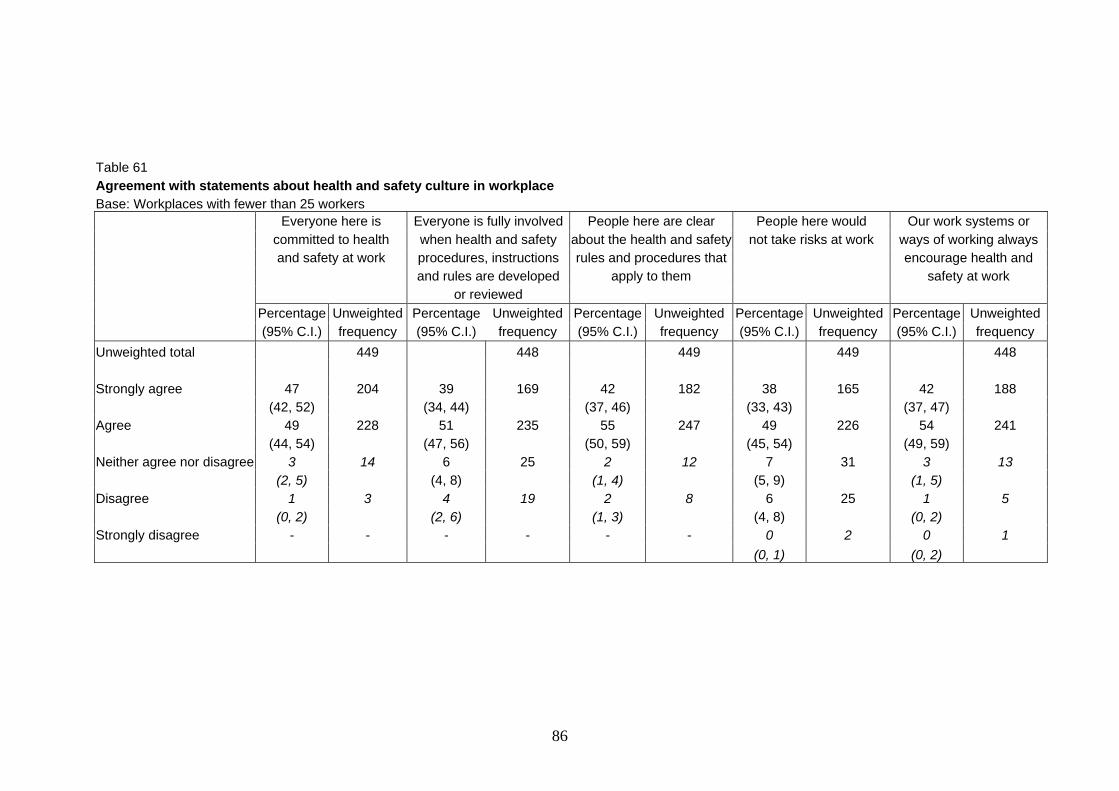
People here are clear
Table 61Agreement with statements about health and safety culture in workplace Base: Workplaces with fewer than 25 workers Everyone here is Everyone is fully involved People here would Our work systems or committed to health when health and safety about the health and safety not take risks at work ways of working always and safety at work procedures, instructions rules and procedures that encourage health and and rules are developed apply to them safety at work or reviewed Percentage Unweighted Percentage Unweighted Percentage Unweighted Percentage Unweighted Percentage Unweighted (95% C.I.) frequency (95% C.I.) frequency (95% C.I.) frequency (95% C.I.) frequency (95% C.I.) frequency Unweighted total 449 448 449 449 448 Strongly agree 47 204 39 169 42 182 38 165 42 188 (42, 52) ) (34, 44 (37, 46) (33, 43) (37, 47) Agree 247 49 228 51 235 55 49 226 54 241 (44, 54) (47, 56) ) (50, 59) (45, 54 (49, 59) Neither agree nor disagree 3 1 14 6 25 2 2 7 31 3 13 (2, 5) (4, 8) (1, 4) (5, 9) (1, 5) Disagree 1 4 3 19 2 8 6 25 1 5 (0, 2) (2, 6) (0, 2) (1, 3) (4, 8) Strongly disagree - - - - - - 0 2 0 1 (0, 1) (0, 2)
86

Table 62 Whether there are rehabilitation arrangements in place Base: All employers Unweighted Percentage (95% C.I.) frequency Unweighted total 966 Yes 52 607 (49, 56) No, no arrangements 7 59 (6, 10) No, have never experienced this 39 283 (35, 42) Don't know 2 17 (1, 3)
87
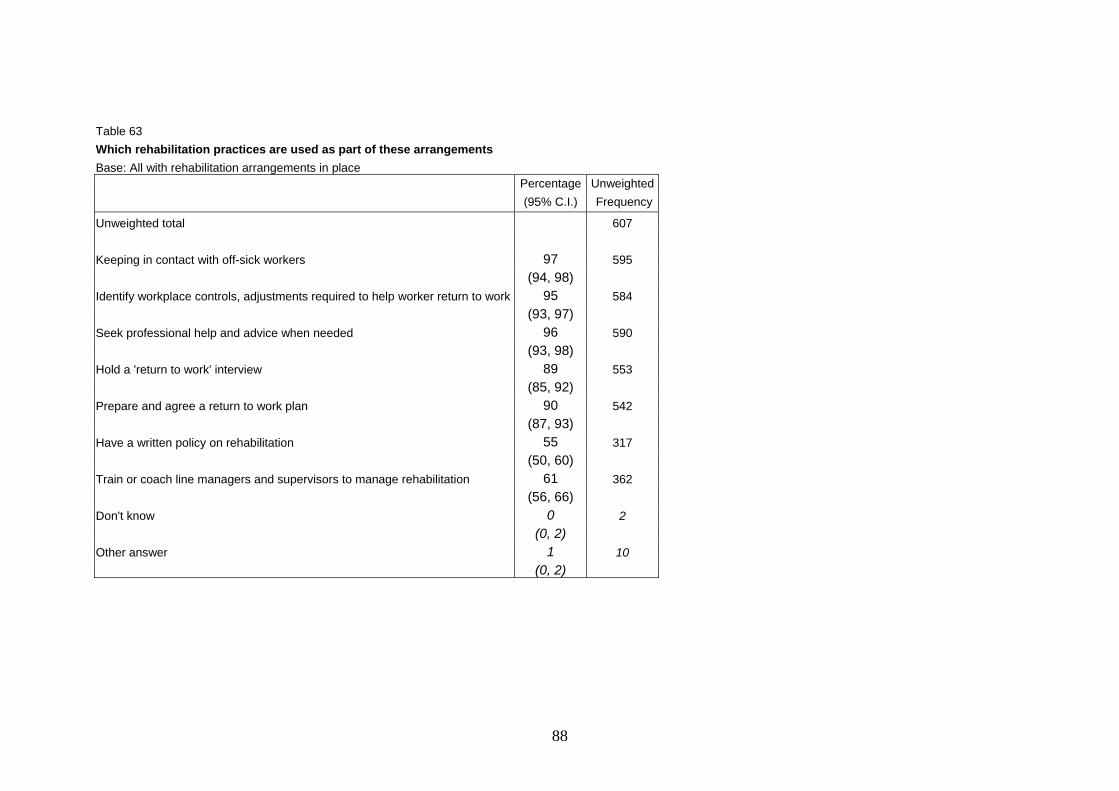
Table 63 Which rehabilitation practices are used as part of these arrangements Base: All with rehabilitation arrangements in place Percentage Unweighted
(95% C.I.) Frequency
Unweighted total 607 Keeping in contact with off-sick workers 97 595 (94, 98) Identify workplace controls, adjustments required to help worker return to work 95 584 (93, 97) Seek professional help and advice when needed 96 590 (93, 98) Hold a 'return to work' interview 89 553 (85, 92) Prepare and agree a return to work plan 90 542 (87, 93) Have a written policy on rehabilitation 55 317 (50, 60) Train or coach line managers and supervisors to manage rehabilitation 61 362 (56, 66) Don't know 0 2 (0, 2) Other answer 1 10 (0, 2)
88
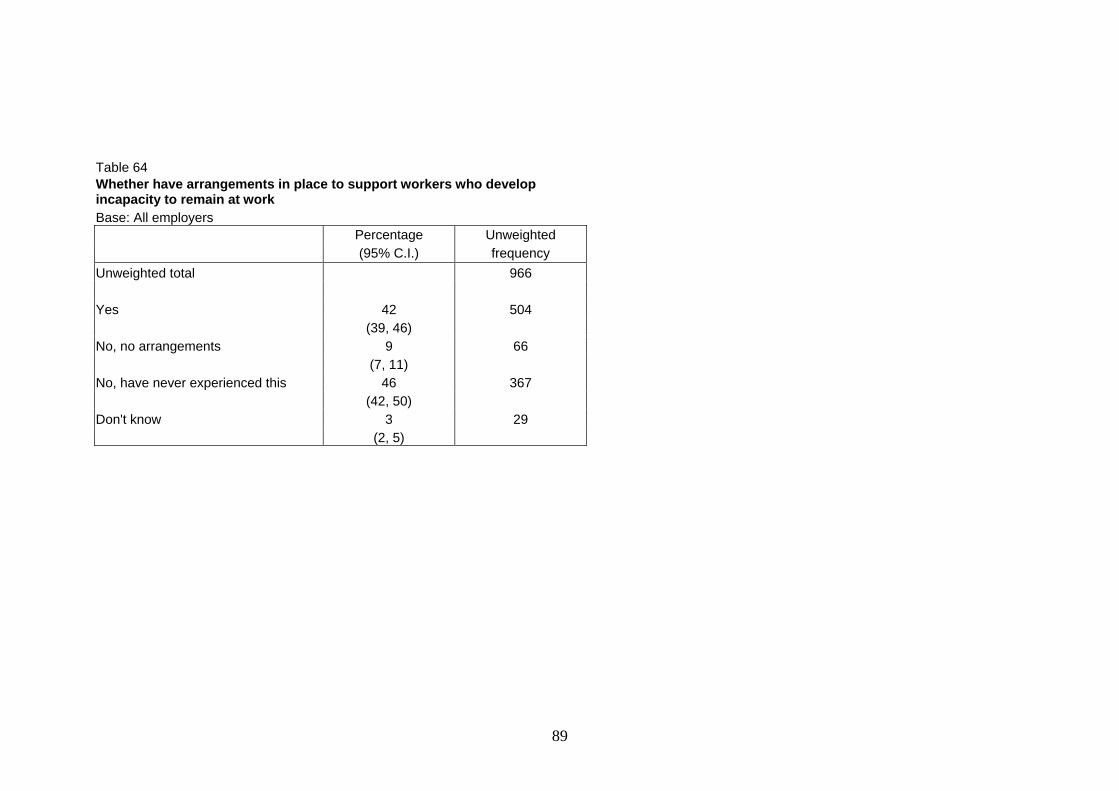
Table 64 Whether have arrangements in place to support workers who develop incapacity to remain at work Base: All employers Percentage Unweighted (95% C.I.) frequency Unweighted total 966 Yes 504 42 (39, 46) No, no arrangements 9 66 (7, 11) No, have never experienced this 46 367 (42, 50) Don't know 3 29 (2, 5)
89
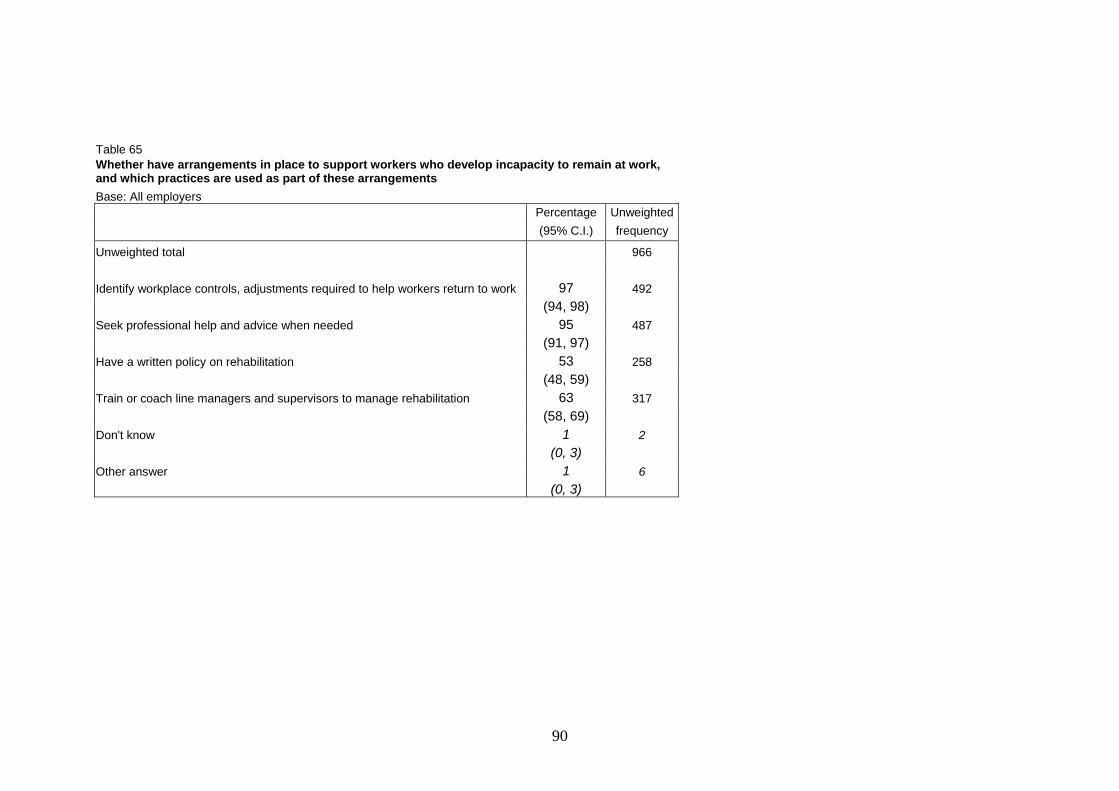
Table 65 Whether have arrangements in place to support workers who develop incapacity to remain at work, and which practices are used as part of these arrangements Base: All employers Percentage Unweighted
(95% C.I.) frequency
Unweighted total 966 Identify workplace controls, adjustments required to help workers return to work 97 492 (94, 98) Seek professional help and advice when needed 95 487 (91, 97) Have a written policy on rehabilitation 53 258 (48, 59) Train or coach line managers and supervisors to manage rehabilitation 63 317 (58, 69) Don't know 1 2 (0, 3) Other answer 1 6 (0, 3)
90

Table 66 Whether used any occupational or general health professionals over last 12 months Base: All employers Percentage Unweighted (95% C.I.) frequency Unweighted total 966 Yes 446 34 (31, 38) No 60 475 (57, 64) Don't know 6 45 (4, 8)
91
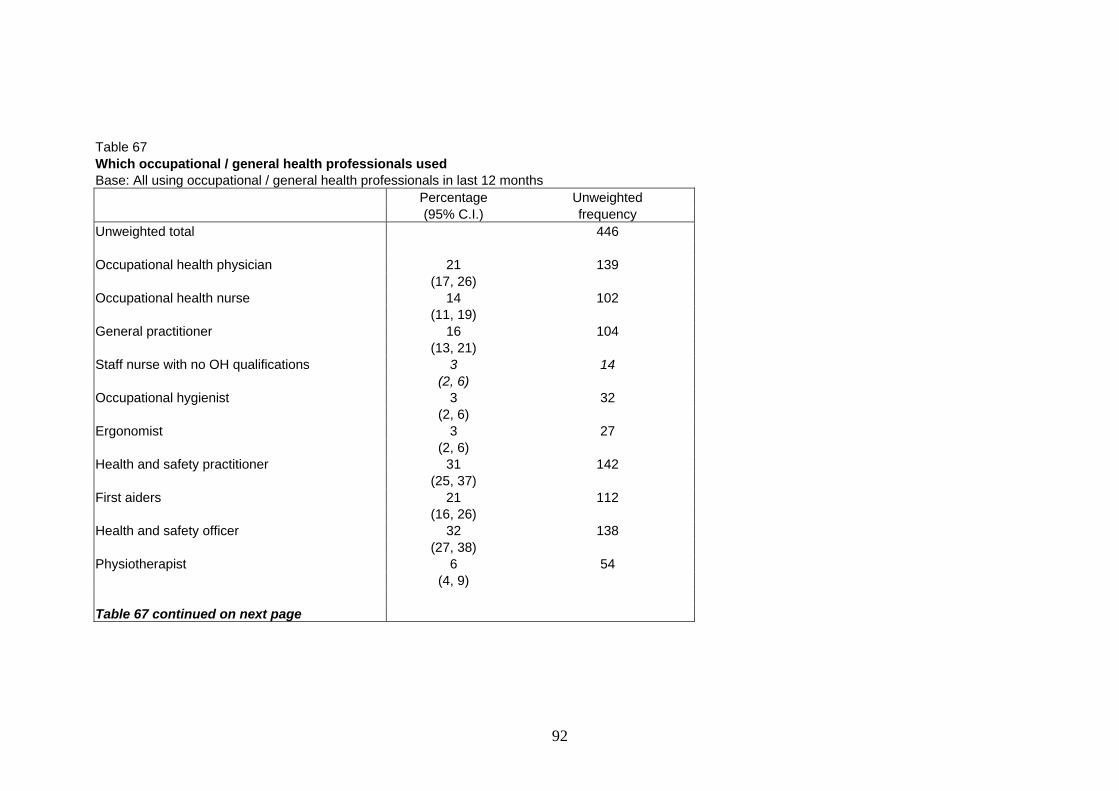
Table 67 Which occupational / general health professionals used Base: All using occupational / general health professionals in last 12 months Percentage Unweighted (95% C.I.) frequency Unweighted total 446 Occupational health physician 21 139 (17, 26) Occupational health nurse 14 102 (11, 19) General practitioner 16 104 (13, 21) Staff nurse with no OH qualifications 3 14 (2, 6) Occupational hygienist 3 32 (2, 6) Ergonomist 3 27 (2, 6) Health and safety practitioner 31 142 (25, 37) First aiders 21 112 (16, 26) Health and safety officer 32 138 (27, 38) Physiotherapist 6 54 (4, 9) Table 67 continued on next page
92
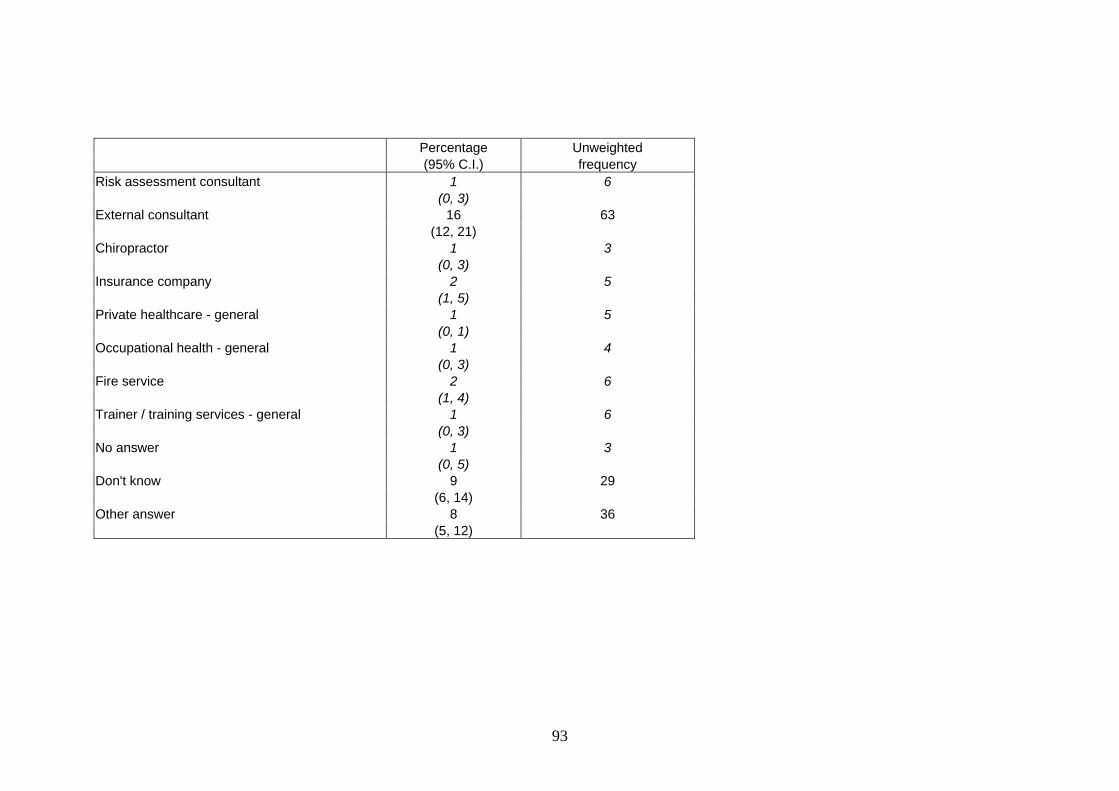
Percentage Unweighted
(95% C.I.) frequency Risk assessment consultant 1 6 (0, 3) External consultant 16 63 (12, 21) Chiropractor 1 3 (0, 3) Insurance company 2 5 (1, 5) Private healthcare - general 1 5 (0, 1) Occupational health - general 1 4 (0, 3) Fire service 2 6 (1, 4) Trainer / training services - general 1 6 (0, 3) No answer 1 3 (0, 5) Don't know 9 29 (6, 14) Other answer 8 36 (5, 12)
93

Table 68 What work these professionals undertook Base: All using occupational/general health professionals in last 12 months
Unweighted Percentage (95% C.I.) Frequency Unweighted total 446 Undertake health checks or medicals 40 240 (34, 45) Monitor sickness absence records 23 117 (18, 28) Attend health and safety meetings 44 197 (38, 50) Advise on work-related health issues 75 360 (70, 80) Advise on general health issues 49 251 (43, 55) Advise on safety issues 71 312 (66, 77) Identify risks/hazards 71 310 (65, 76) Implement health and safety risk procedures 46 190 (40, 52) Treat ill-health/ results of accidents 30 173 (25, 35) Provide support during back to work rehabilitation 33 202 (28, 39) Health and safety training 2 10 (1, 5) Counselling 0 4 (0, 0) Don't know 7 20 (5, 12) Other answer 2 12 (1, 5)
94
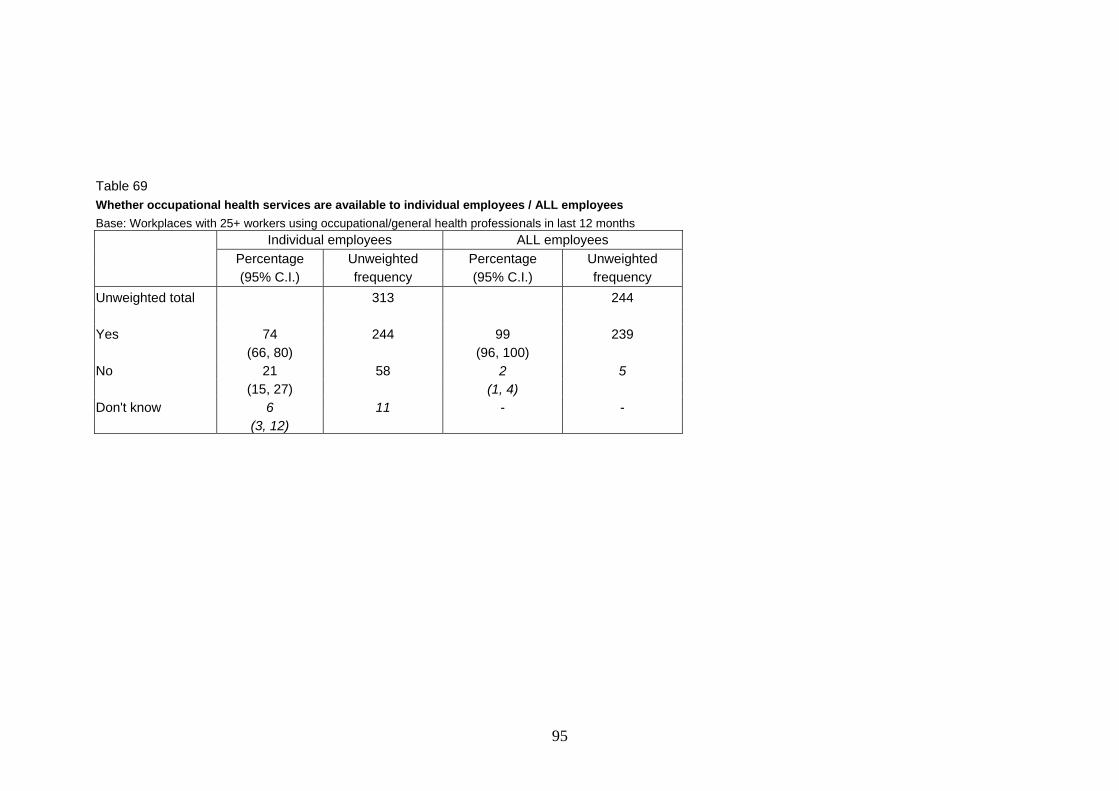
Table 69 Whether occupational health services are available to individual employees / ALL employees Base: Workplaces with 25+ workers using occupational/general health professionals in last 12 months
Individual employees ALL employees Percentage Unweighted Percentage Unweighted (95% C.I.) frequency (95% C.I.) frequency Unweighted total 313 244 Yes 74 244 99 239 (66, 80) (96, 100) No 21 58 2 5 (15, 27) (1, 4) Don't know 6 11 - - (3, 12)
95

Table 70 Proportion of costs spent on management of health and safety Base: All employers Percentage Unweighted (95% C.I.) frequency Unweighted total 966 Up to 10% 60 525 (56, 64) 11 to 20% 9 92 (7, 11) 21 to 30% 3 35 (2, 4) 31 to 40% 1 9 (0, 2) 41 to 50% 1 9 (0, 2) Over 50% 2 25 (1, 3) Don't know 25 271 (22, 28)
96

Table 71 Whether situation is fully in line with legal requirements Base: All employers Percentage Unweighted (95% C.I.) frequency Unweighted total 966 Fully in line 90 846 (88, 92) Falls short 9 108 (7, 11) Don't know 1 12 (1, 3)
97
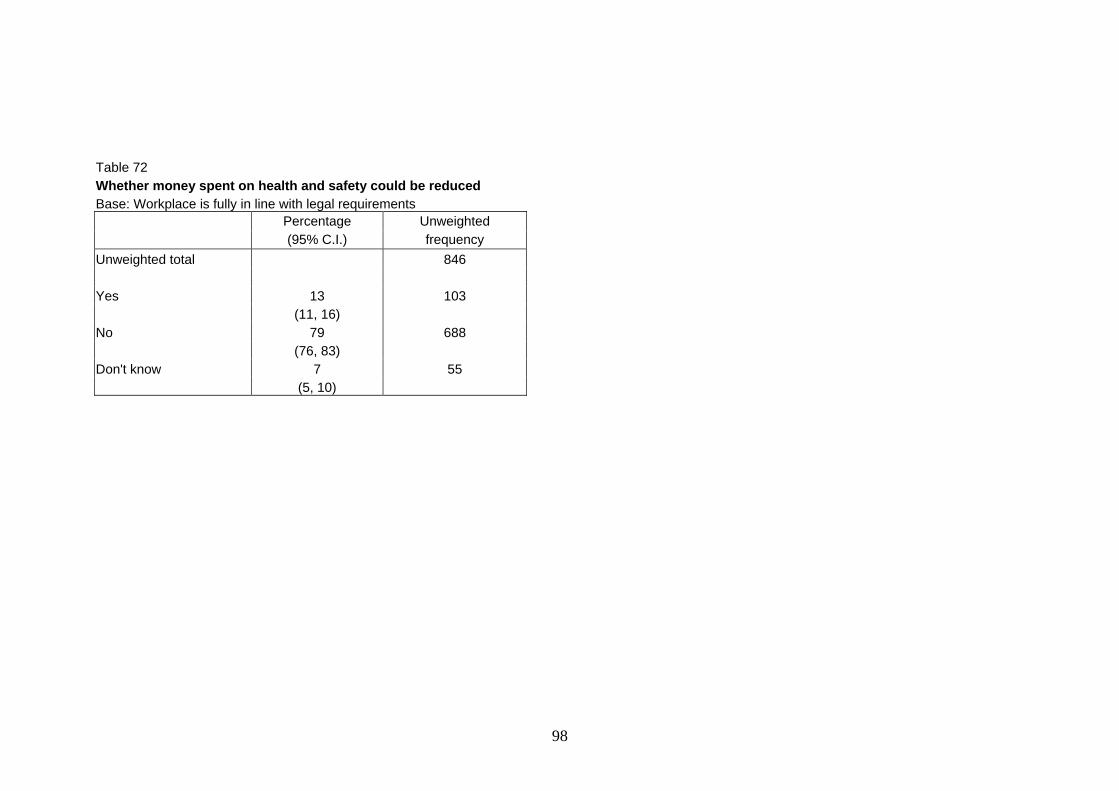
Table 72 Whether money spent on health and safety could be reduced Base: Workplace is fully in line with legal requirements Percentage Unweighted (95% C.I.) frequency Unweighted total 846 Yes 13 103 (11, 16) No 79 688 (76, 83) Don't know 7 55 (5, 10)
98
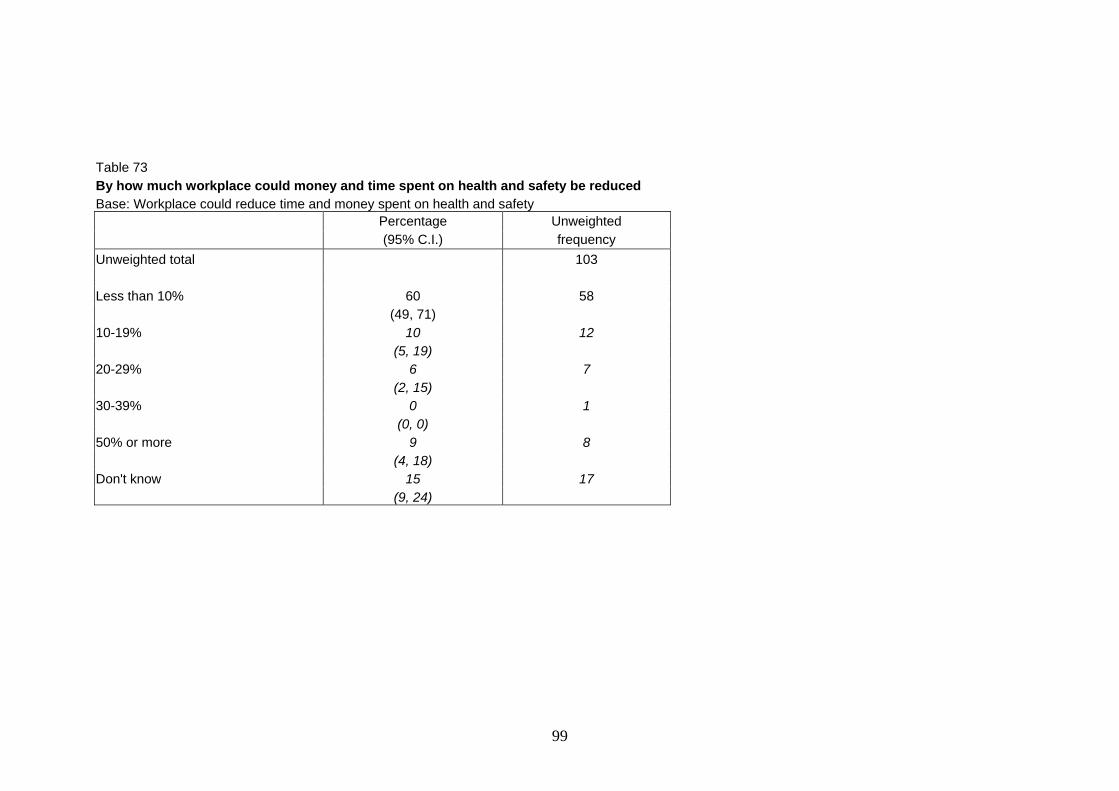
Table 73 By how much workplace could money and time spent on health and safety be reduced Base: Workplace could reduce time and money spent on health and safety Percentage Unweighted (95% C.I.) frequency Unweighted total 103 Less than 10% 60 58 (49, 71) 10-19% 10 12 (5, 19) 20-29% 6 7 (2, 15) 30-39% 0 1 (0, 0) 50% or more 9 8 (4, 18) Don't know 15 17 (9, 24)
99
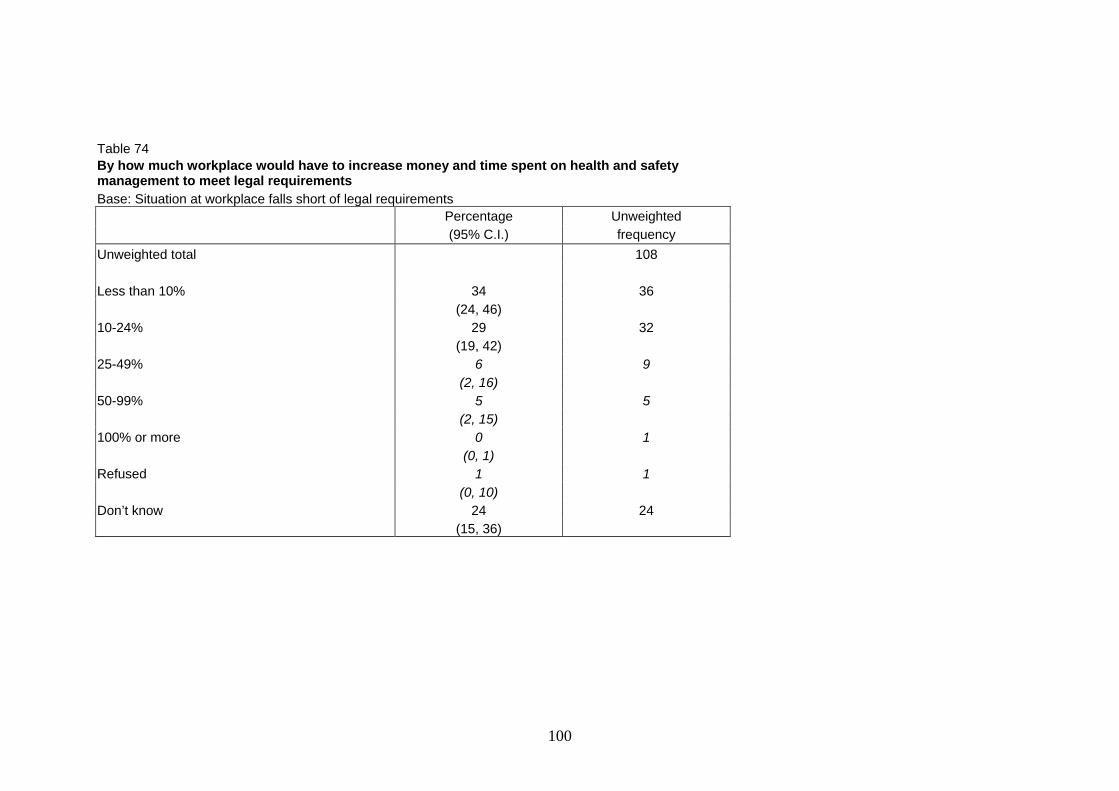
Table 74 By how much workplace would have to increase money and time spent on health and safety management to meet legal requirements Base: Situation at workplace falls short of legal requirements Percentage Unweighted (95% C.I.) frequency Unweighted total 108 Less than 10% 34 36 (24, 46) 10-24% 29 32 (19, 42) 25-49% 6 9 (2, 16) 50-99% 5 5 (2, 15) 100% or more 0 1 (0, 1) Refused 1 1 (0, 10) Don’t know 24 24 (15, 36)
100
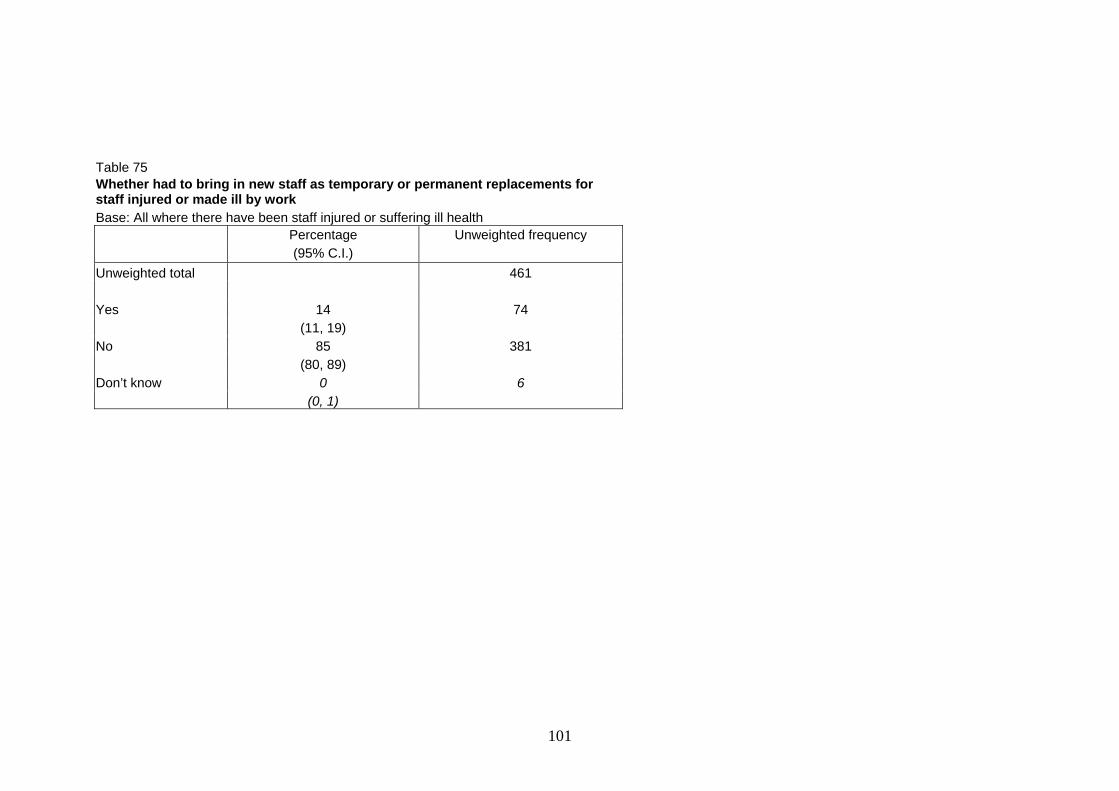
Table 75 Whether had to bring in new staff as temporary or permanent replacements for staff injured or made ill by work Base: All where there have been staff injured or suffering ill health
Percentage Unweighted frequency (95% C.I.) Unweighted total 461 Yes 14 74 (11, 19) No 85 381 (80, 89) Don’t know 0 6 (0, 1)
101
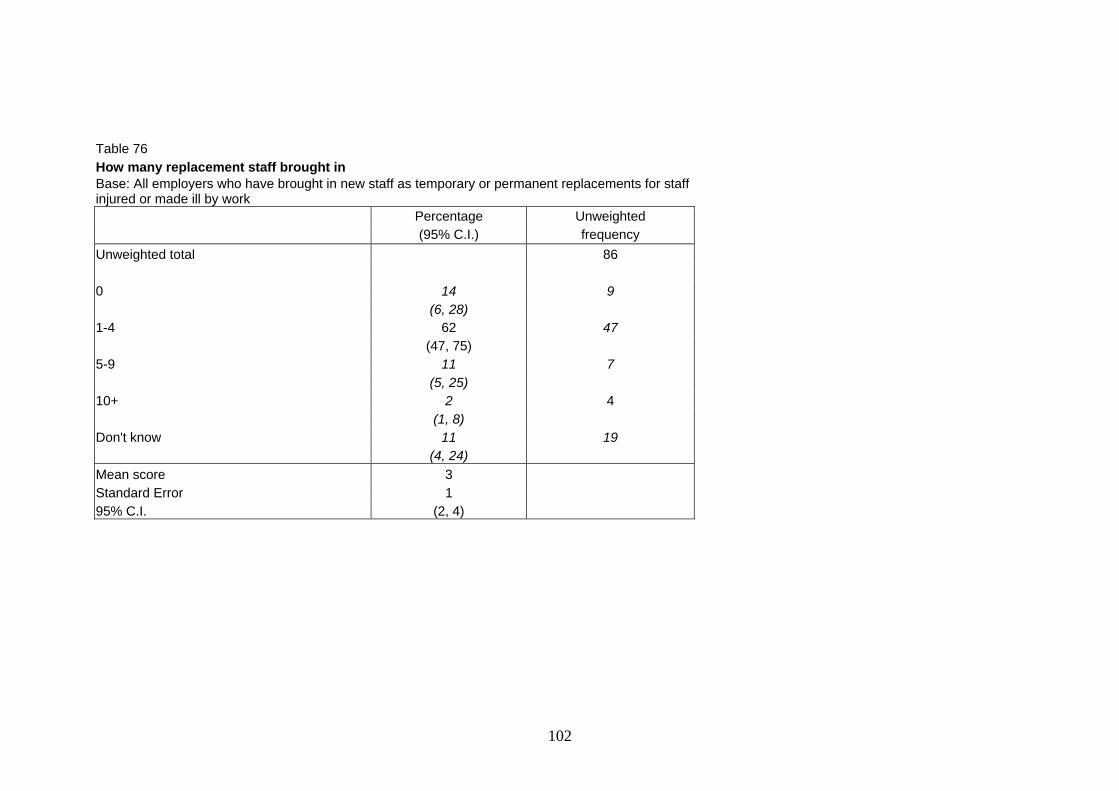
Table 76 How many replacement staff brought in Base: All employers who have brought in new staff as temporary or permanent replacements for staff injured or made ill by work Percentage Unweighted (95% C.I.) frequency Unweighted total 86 0 14 9 (6, 28) 1-4 62 47 (47, 75) 5-9 11 7 (5, 25) 10+ 2 4 (1, 8) Don't know 11 19 (4, 24) Mean score 3 Standard Error 1 95% C.I. (2, 4)
102
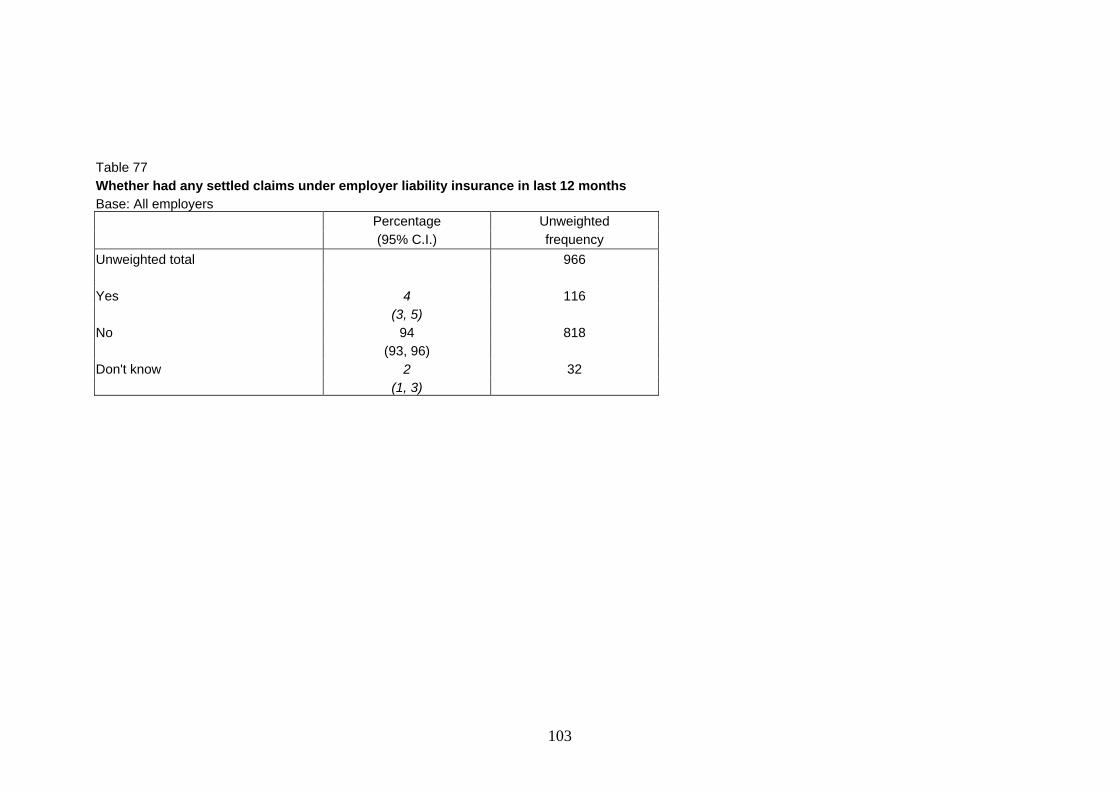
Table 77 Whether had any settled claims under employer liability insurance in last 12 months Base: All employers Percentage Unweighted (95% C.I.) frequency Unweighted total 966 Yes 4 116 (3, 5) No 94 818 (93, 96) Don't know 2 32 (1, 3)
103

Table 78 How many of these claims were due to health and safety claims from employees and how many were other claims Base: All who have had settled claims under employer liability insurance in last 12 months Employees Other claims Unwe Percentage ighted Percentage Unweighted (95% C.I.) y C.I.) frequency (95% frequencUnweighted total 116 116 0 1 9 8 - - (9, 38) 1-10 - - 16 14 (8, 32) 11-20 - - 56 59 (41, 71) 21-30 - - - - 31-40 - - - - 41-50 - - - - 51-60 - - - - 61-70 - - - - 71-80 - - - - 81-90 - - - - 91-100 47 39 - - (32, 62) Don't know 8 1 8 12 25 (4, 16) (7, 21) Not stated 26 51 15 18 (16, 39) (7, 29) Mean score 2 0Standard Error 0 095% C.I. (1, 3) (0, 1)
104

Table 79 Whether employer liability insurance arranged separately for this work site Base: All with more than one site Percentage Unweighted (95% C.I.) frequency Unweighted total 586 Yes 28 150 (24, 33) No 63 396 (57, 67) Don’t know 9 40 (7, 13)
105

Table 80 Whether had change in employer liability insurance premiums related to health and safety performance at this site Base: All single site workplaces, or where employer liability insurance is arranged separately for this site Percentage Unweighted (95% C.I.) frequency Unweighted total 530 Yes - increase 4 21 (2, 6) Yes - decrease 3 20 (2, 4) No 79 400 (75, 82) Don’t know 15 89 (12, 19)
106
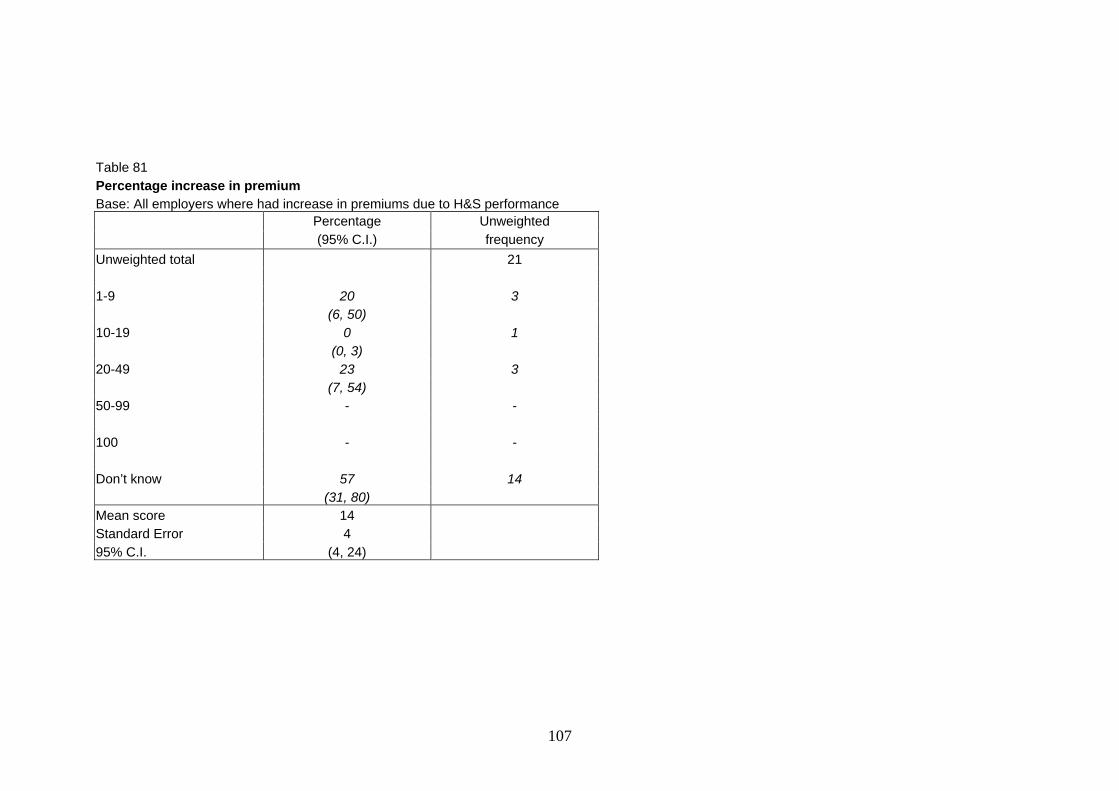
Table 81 Percentage increase in premium Base: All employers where had increase in premiums due to H&S performance Percentage Unweighted (95% C.I.) frequency Unweighted total 21 1-9 20 3 (6, 50) 10-19 0 1 (0, 3) 20-49 23 3 (7, 54) 50-99 - - 100 - - Don’t know 57 14 (31, 80) Mean score 14 Standard Error 4 95% C.I. (4, 24)
107
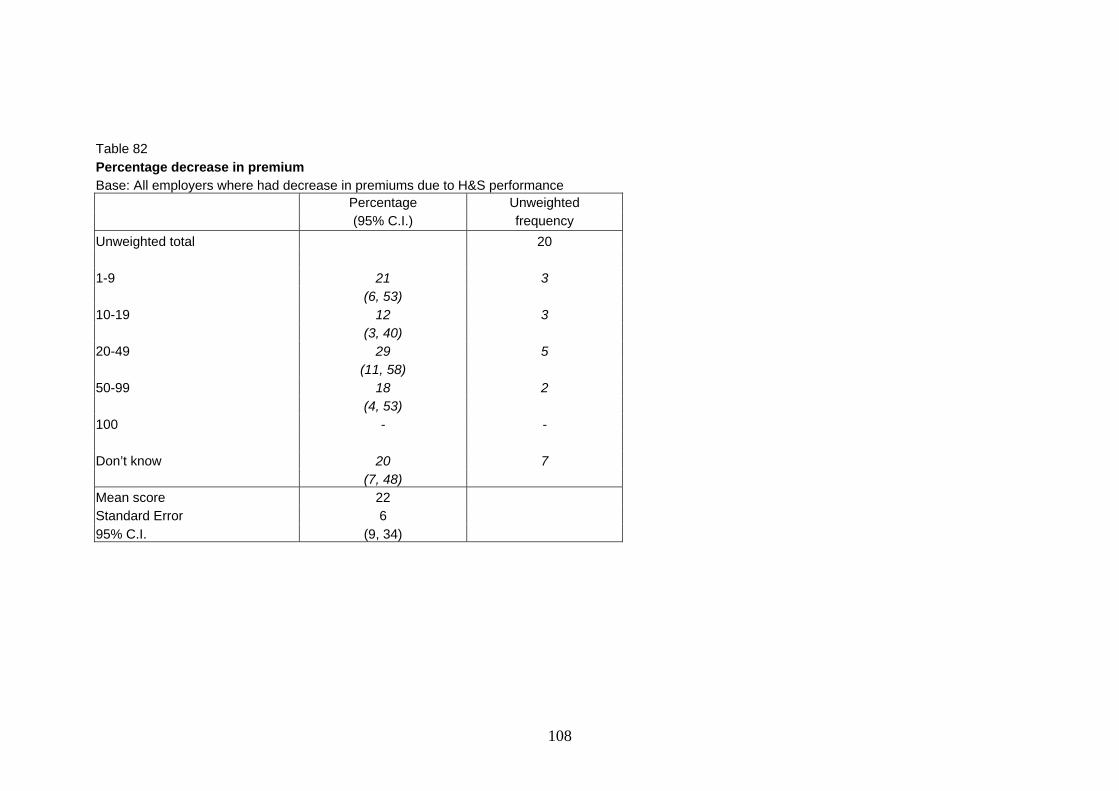
Table 82 Percentage decrease in premium Base: All employers where had decrease in premiums due to H&S performance Percentage Unweighted (95% C.I.) frequency Unweighted total 20 1-9 21 3 (6, 53) 10-19 12 3 (3, 40) 20-49 29 5 (11, 58) 50-99 18 2 (4, 53) 100 - - Don’t know 20 7 (7, 48) Mean score 22 Standard Error 6 95% C.I. (9, 34)
108

Table 83 Annual cost of employer liability insurance for this work site Base: All employers Percentage Unweighted (95% C.I.) frequency Unweighted total 966 0-499 3 23 (2, 5) 500-999 4 27 (3, 6) 1000-4999 13 94 (10, 15)5000-9999 5 50 (4, 7) 10000-19999 3 37 (2, 5)20000-29999 1 11 (0, 2) 30000-39999 1 14 (0, 2) 40000-49999 1 11 (0, 1) 50000-59999 0 4 (0, 1) Table 83 continued on next page
109
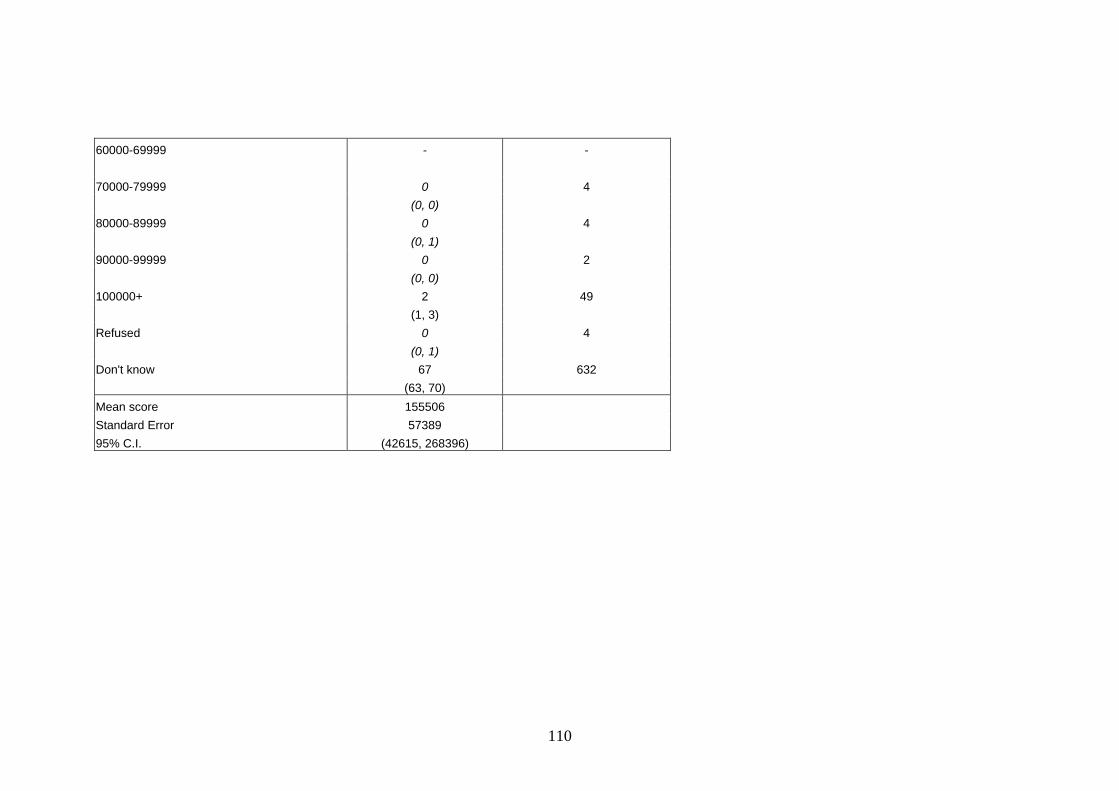
60000-69999 - - 70000-79999 0 4 (0, 0) 80000-89999 0 4 (0, 1) 90000-99999 0 2 (0, 0) 100000+ 2 49 (1, 3)Refused 0 4 (0, 1) Don't know 67 632 (63, 70)Mean score 155506 Standard Error 57389 95% C.I. (42615, 268396)
110
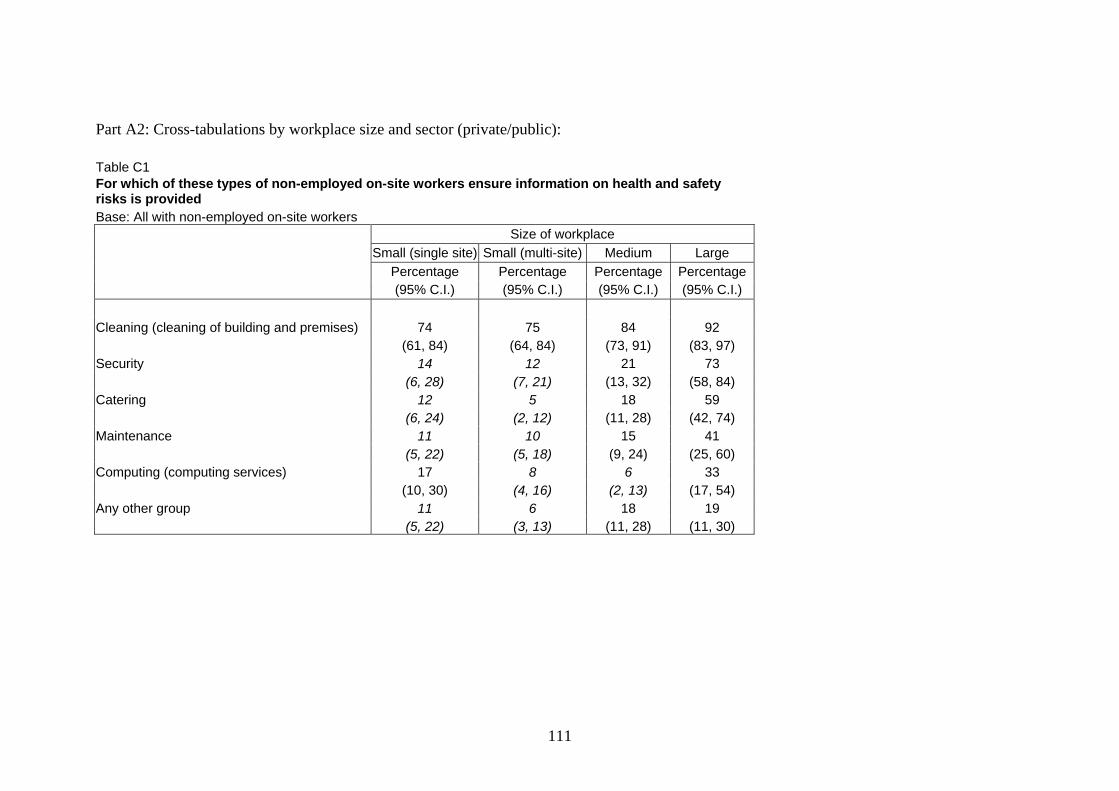
Part A2: Cross-tabulations by workplace size and sector (private/public):
Table C1
Size of workplace
For which of these types of non-employed on-site workers ensure information on health and safety risks is provided Base: All with non-employed on-site workers
Small (single site) Small (multi-site) Medium Large
Percentage Percentage Percentage Percentage (95% C.I.) (95% C.I.) (95% C.I.) (95% C.I.) Cleaning (cleaning of building and premises) 74 75 84 92 (61, 84) (64, 84) (73, 91) (83, 97) Security 14 12 21 73 (6, 28) (7, 21) (13, 32) (58, 84) Catering 12 59 5 18 (6, 24) (2, 12) (11, 28) (42, 74) Maintenance 11 10 15 41 (5, 22) (5, 18) (9, 24) (25, 60) Computing (computing services) 17 8 6 33 (10, 30) (4, 16) (2, 13) (17, 54) Any other group 11 6 18 19 (5, 22) (3, 13) (11, 28) (11, 30)
111
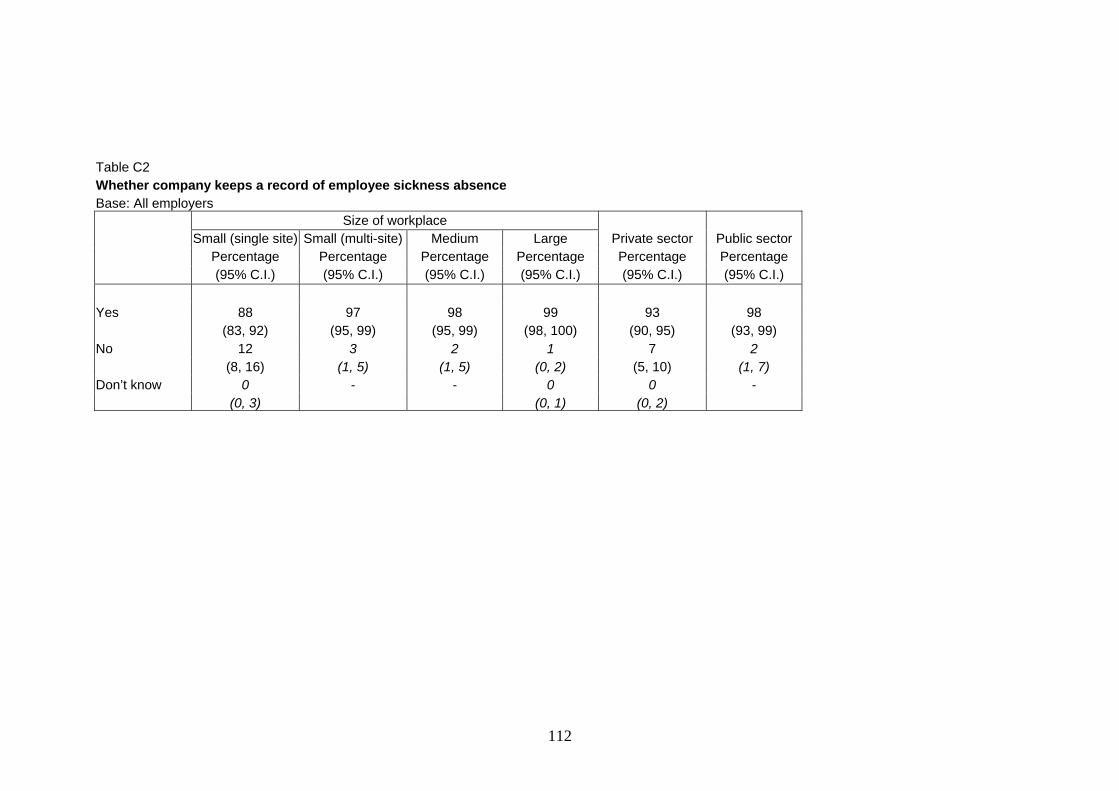
ompany keeps a record of employee sickness absence
Base: All employers
Table C2Whether c
Size of workplace Small (single site) Small (multi-site) Medium Large Private sector Public sector
Percentage Percentage Percentage Percentage Percentage Percentage (95% C.I.) (95% C.I.) (95% C.I.) (95% C.I.) (95% C.I.) (95% C.I.) Yes 88 9 7 98 99 93 98 (83, 92) ) (95, 99) (95, 99 (98, 100) (90, 95) (93, 99) No 12 3 2 1 7 2 (8, 16) (1, 5) (1, 5) (0, 2) (5, 10) (1, 7) Don’t know 0 - - 0 0 - (0, 3) (0, 1) (0, 2)
112
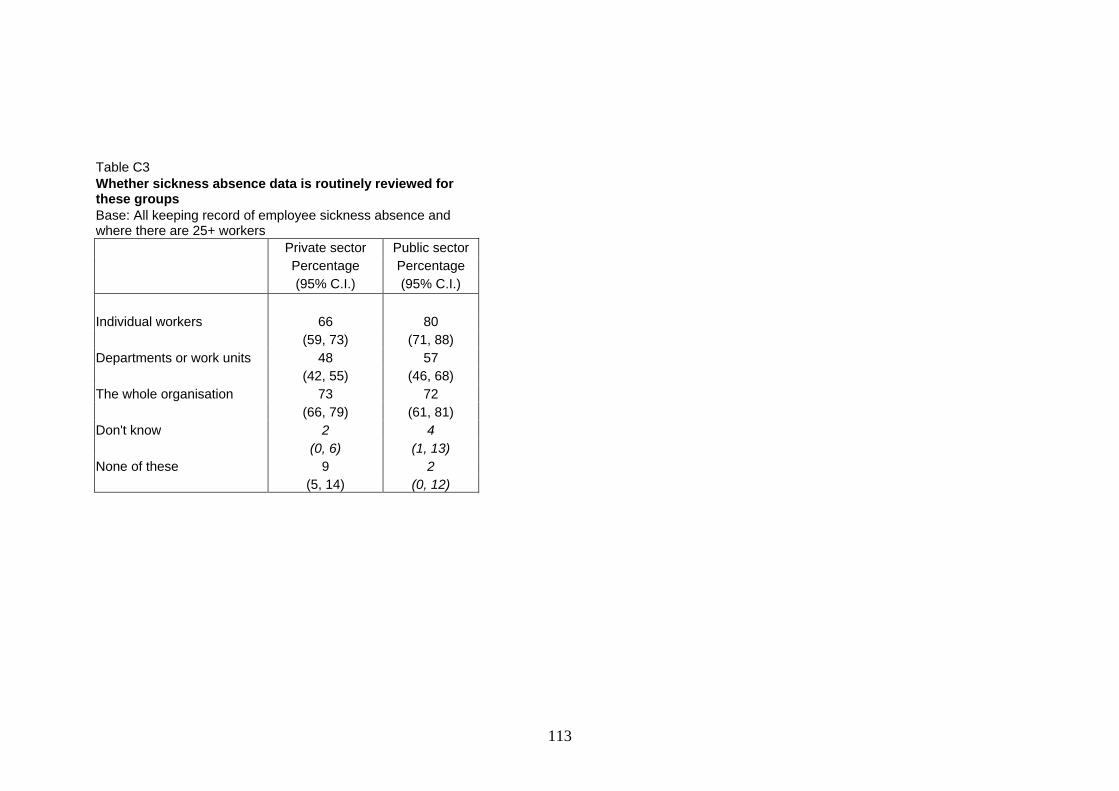
Table C3 Whether sickness absence data is routinely reviewed for these groups Base: All keeping record of employee sickness absence and where there are 25+ workers Private sector Public sector Percentage Percentage (95% C.I.) (95% C.I.) Individual workers 66 80 (59, 73) (71, 88) Departments or work units 48 57 (42, 55) (46, 68) The whole organisation 73 72 (66, 79) (61, 81) Don't know 2 4 (0, 6) (1, 13) None of these 9 2 (5, 14) (0, 12)
113
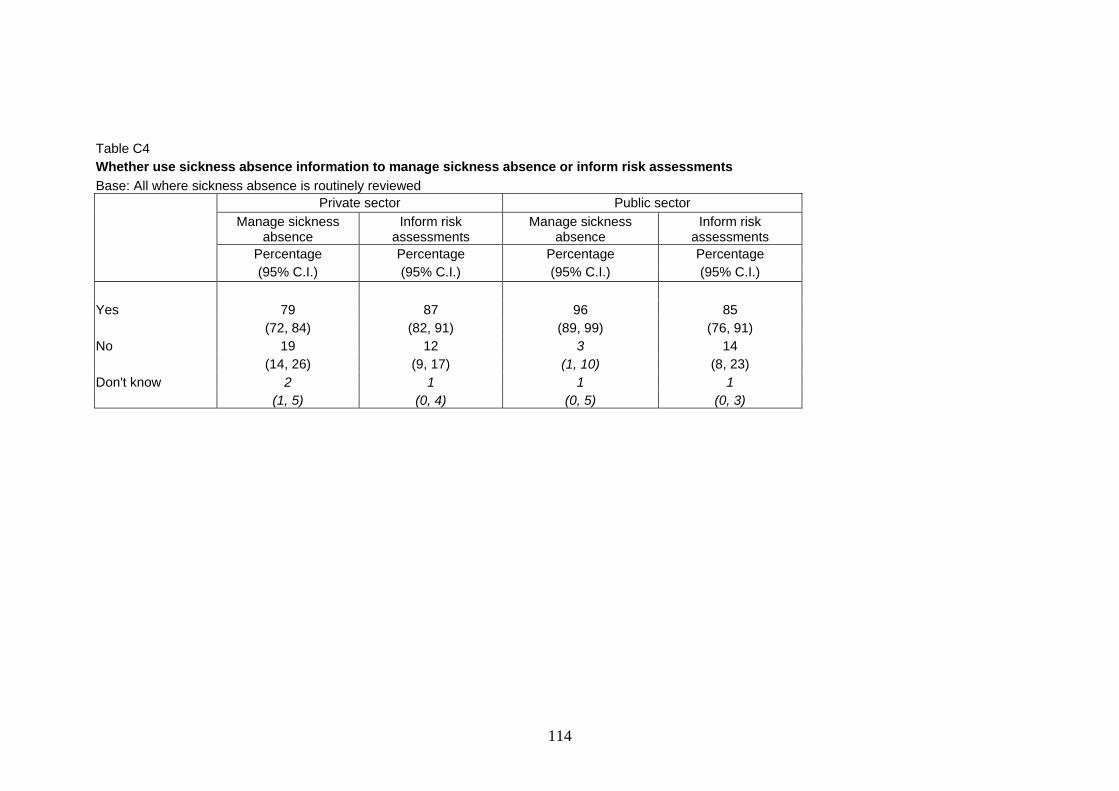
Table C4 Whether use sickness absence information to manage sickness absence or inform risk assessments Base: All where sickness absence is routinely reviewed
Private sector
Public sector
Manage sickness
absence Inform risk
assessments Manage sickness
absence Inform risk
assessments Percentage Percentage Percentage Percentage (95% C.I.) (95% C.I.) (95% C.I.) (95% C.I.) Yes 87 96 85 79 (72, 84) (82, 91) (89, 99) (76, 91) No 12 3 19 14 (14, 26) (9, 17) (1, 10) (8, 23) Don't know 1 1 1 2 (1, 5) (0, 4) (0, 5) (0, 3)
114

Table C5 Whether carried out risk assessments in workplace Base: All employers
Size of workplace Small (single site) Small (multi-site) Medium Large
Percentage Percentage Percentage Percentage (95% C.I.) (95% C.I.) (95% C.I.) (95% C.I.) Yes 91 95 99 100 (87, 94) ) (92, 97) (96, 100 (98, 100) No 9 1 5 0 (6, 13) (3, 8) (0, 4) (0, 2)
115

Table C6 Three most COMMON and three most SEVERE risks in workplace Base: All carrying out risk assessments in workplace
Private sector Public sector Common risks Severe risks Common risks Severe risks
Percentage Percentage e Percentage Percentag (95% C.I.) (95% C.I.) (95% C.I.) (95% C.I.)Stress 1 1 11 12 (0, 2) (0, 2) (7, 17) (7, 19) PC/ Laptop usage 9 7 14 9 (7, 12) (10, 21) (5, 10) (5, 15) Work requiring repetitive movement 4 2 3 1 of upper limbs other than PC-related (2, 6) (1, 3) (1, 8) (0, 5) Work in awkward or tiring positions 3 2 6 1 (2, 5) (1, 4) (3, 11) (0, 4) Lifting or carrying weights by hand 39 26 31 23 (22, 30) (34, 43) (24, 39) (17, 31) Work requiring appreciable force 1 1 - 0 (0, 2) (0, 3) (0, 2) Vibration to hands from use of 5 4 1 2 powered tools or machines (3, 7) (2, 6) (0, 5) (0, 5) Vibration or jolting from riding, sitting 1 0 - -or standing up on vehicles or machines (0, 2) (0, 1) Table C6 continued on next page
116
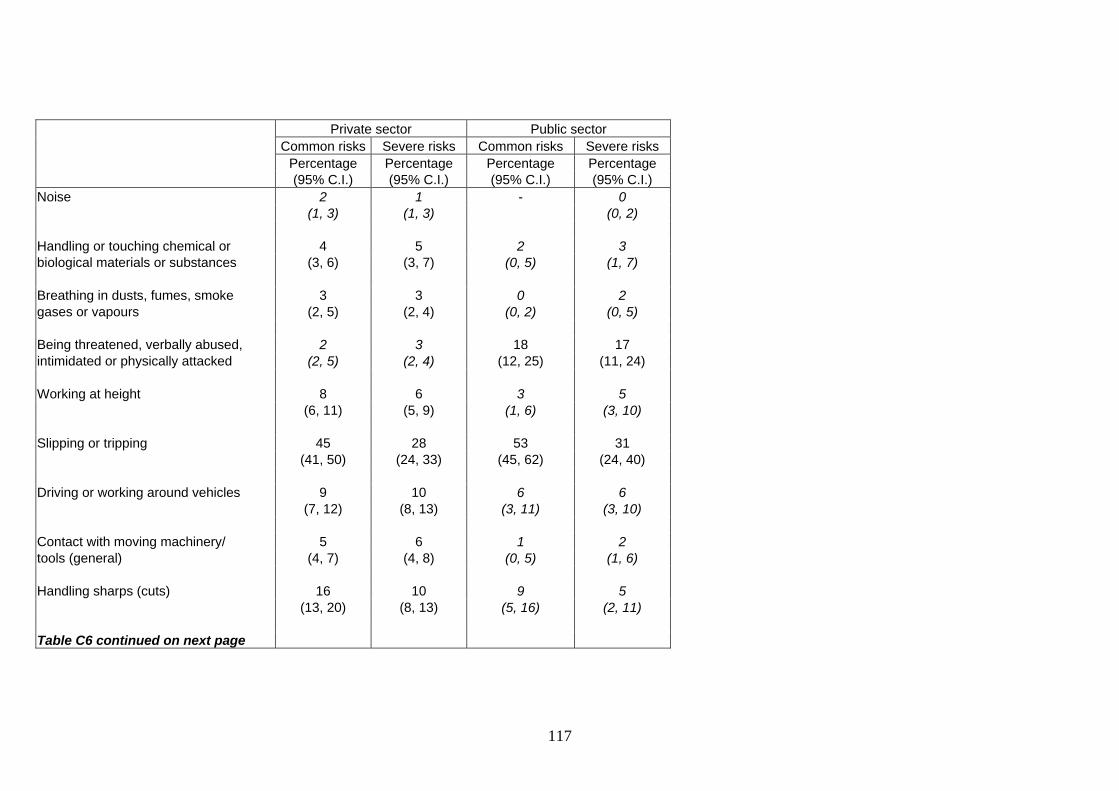
Private sector Public sector Common risks Severe risks Common risks Severe risks
Percentage Percentage Percentage Percentage (95% C.I.) (95% C.I.) (95% C.I.) (95% C.I.)Noise 2 1 - 0 (1, 3) (1, 3) (0, 2) Handling or touching chemical or 4 5 2 3biological materials or substances (3, 6) (3, 7) (0, 5) (1, 7) Breathing in dusts, fumes, smoke 3 3 0 2 gases or vapours (2, 5) (2, 4) (0, 2) (0, 5) Being threatened, verbally abused, 2 3 18 17intimidated or physically attacked (2, 5) (2, 4) (12, 25) (11, 24) Working at height 8 6 3 5 (6, 11) (5, 9) (1, 6) (3, 10) Slipping or tripping 45 28 53 31 (41, 50) (24, 33) (45, 62) (24, 40) Driving or working around vehicles 9 10 6 6 (7, 12) (8, 13) (3, 11) (3, 10) Contact with moving machinery/ 5 6 1 2tools (general) (4, 7) (4, 8) (0, 5) (1, 6) Handling sharps (cuts) 16 10 9 5 (13, 20) (8, 13) (5, 16) (2, 11) Table C6 continued on next page
117
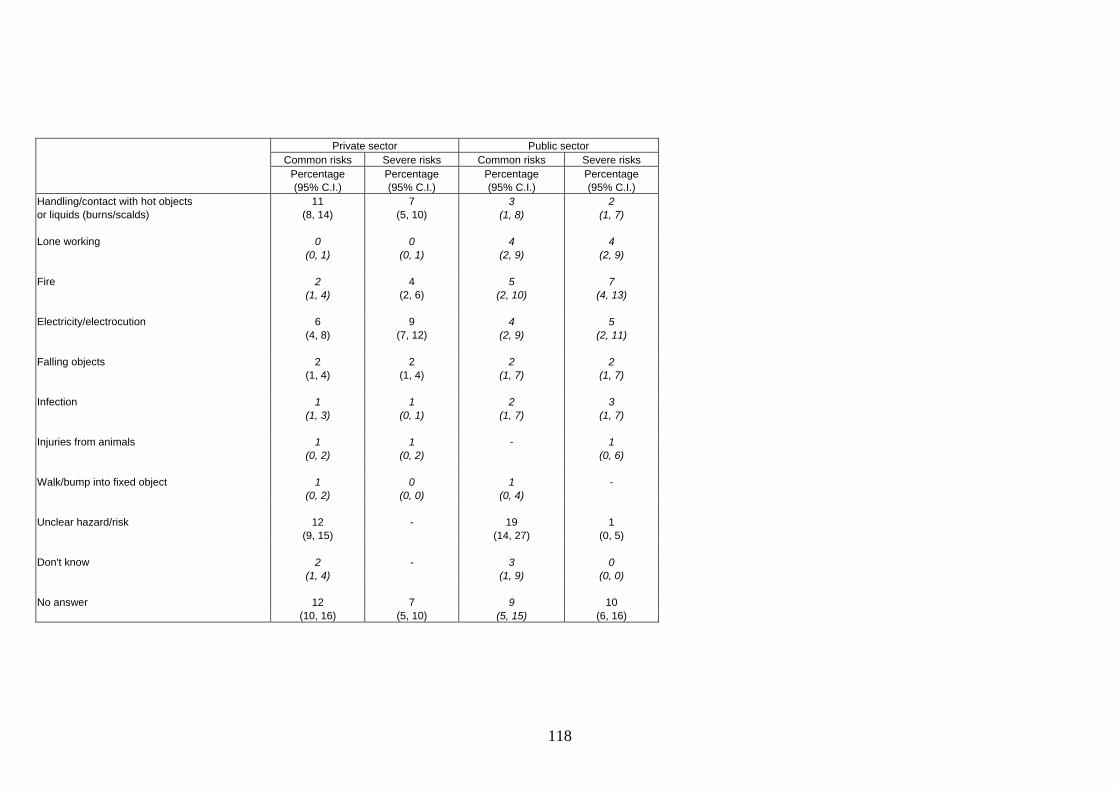
Private sector Public sector
Common risks Severe risks Common risks Severe risks Percentage Percentage Percentage Percentage (95% C.I.) (95% C.I.) (95% C.I.) (95% C.I.) Handling/contact with hot objects 11 7 3 2or liquids (burns/scalds) (8, 14) (5, 10) (1, 8) (1, 7) Lone working 0 0 4 4 (0, 1) (0, 1) (2, 9) (2, 9) Fire 2 4 5 7 (1, 4) (2, 6) (2, 10) (4, 13) Electricity/electrocution 9 6 4 5 (4, 8) (7, 12) (2, 9) (2, 11) Falling objects 2 2 2 2 (1, 4) (1, 4) (1, 7) (1, 7) Infection 1 1 2 3 (1, 3) (0, 1) (1, 7) (1, 7) Injuries from animals 1 1 - 1 (0, 2) (0, 2) (0, 6) Walk/bump into fixed object 1 0 1 - (0, 2) (0, 0) (0, 4) Unclear hazard/risk 12 - 19 1 (9, 15) (14, 27) (0, 5) Don't know 0 2 - 3 (1, 4) (1, 9) (0, 0) No answer 12 7 9 10 (10, 16) (5, 10) (5, 15) (6, 16)
118
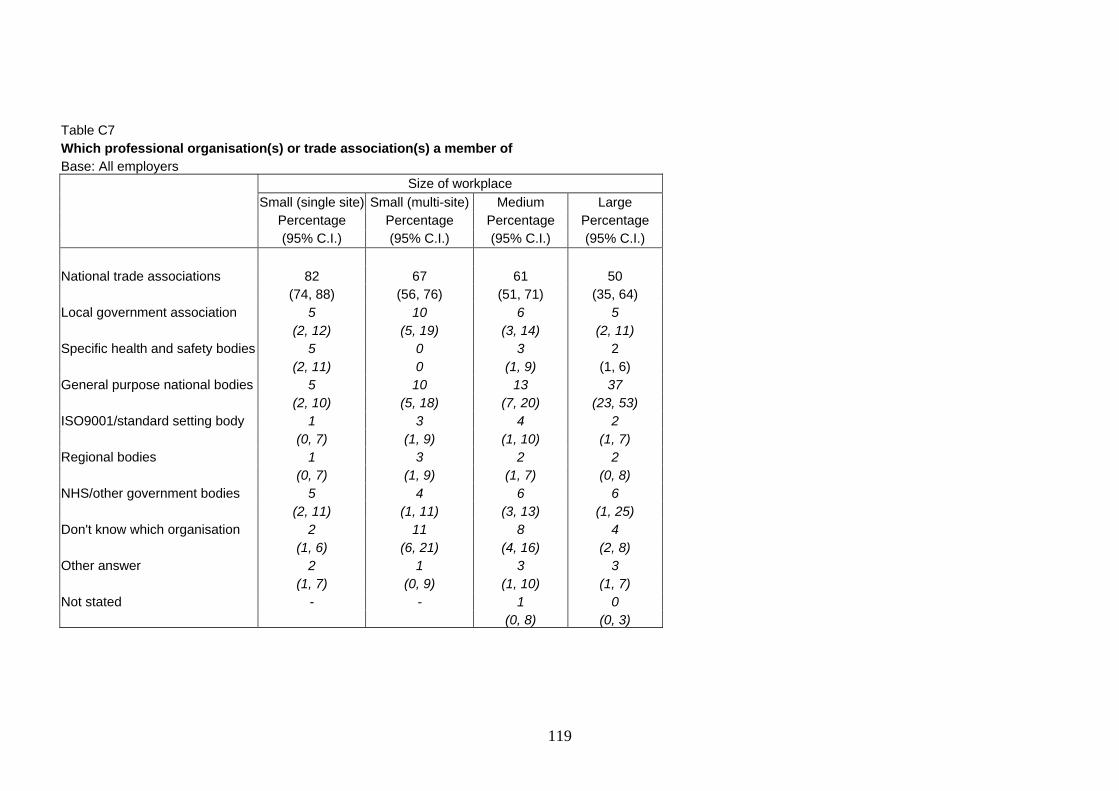
Table C7 Which professional organisation(s) or trade association(s) a member of Base: All employers
Size of workplace Small (single site) Small (multi-site) Medium Large
Percentage Percentage Percentage Percentage (95% C.I.) (95% C.I.) (95% C.I.) (95% C.I.) National trade associations 82 67 61 50 (74, 88) (56, 76) (51, 71) (35, 64) Local government association 5 10 6 5 (2, 12) (5, 19) (3, 14) (2, 11) Specific health and safety bodies 5 0 3 2 (2, 11) 0 (1, 9) (1, 6) General purpose national bodies 5 10 13 37 (2, 10) (5, 18) (7, 20) (23, 53) ISO9001/standard setting body 1 3 4 2 (0, 7) (1, 9) (1, 10) (1, 7) Regional bodies 1 2 3 2 (0, 7) (1, 9) (1, 7) (0, 8) NHS/other government bodies 5 4 6 6 (2, 11) (1, 11) (3, 13) (1, 25) Don't know which organisation 2 11 8 4 (1, 6) (6, 21) (4, 16) (2, 8) Other answer 2 1 3 3 (1, 7) (0, 9) (1, 10) (1, 7) Not stated - - 1 0 (0, 8) (0, 3)
119
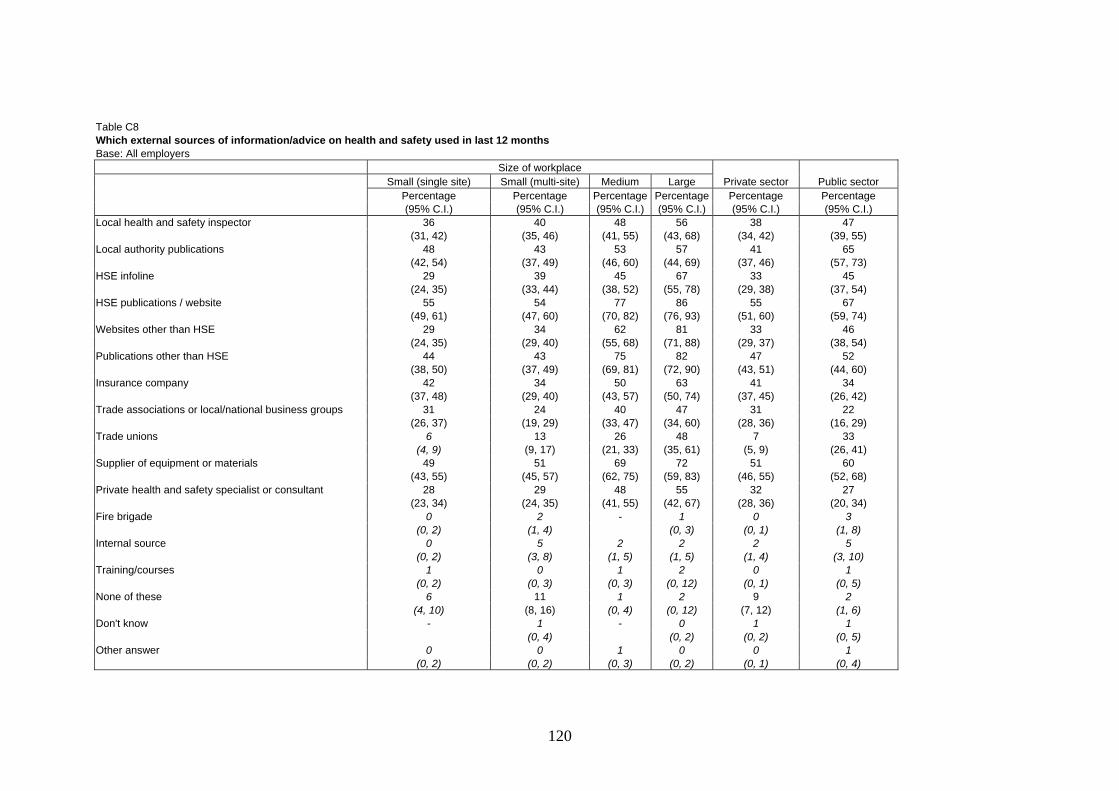
Table C8 Which external sources of information/advice on health and safety used in last 12 months Base: All employers
Size of workplace Small (single site) Small (multi-site) Medium Large Private sector Public sector
Percentage Percentage Percentage Percentage Percentage Percentage (95% C.I.) (95% C.I.) (95% C.I.) (95% C.I.) (95% C.I.) (95% C.I.) Local health and safety inspector 36 40 48 56 38 47 (31, 42) (35, 46) (41, 55) (43, 68) (34, 42) (39, 55) Local authority publications 48 43 53 57 41 65 (42, 54) (37, 49) (46, 60) (44, 69) (37, 46) (57, 73) HSE infoline 29 39 45 67 33 45 (24, 35) (33, 44) (38, 52) (55, 78) (29, 38) (37, 54) HSE publications / website 55 54 77 86 55 67 (49, 61) (47, 60) (70, 82) (76, 93) (51, 60) (59, 74) Websites other than HSE 29 34 62 81 33 46 (24, 35) (29, 40) (55, 68) (71, 88) (29, 37) (38, 54) Publications other than HSE 44 43 75 82 47 52 (38, 50) (37, 49) (69, 81) (72, 90) (43, 51) (44, 60) Insurance company 42 34 50 63 41 34 (37, 48) (29, 40) (43, 57) (50, 74) (37, 45) (26, 42) Trade associations or local/national business groups 31 24 40 47 31 22 (26, 37) (19, 29) (33, 47) (34, 60) (28, 36) (16, 29) Trade unions 6 13 26 48 7 33 (4, 9) (9, 17) (21, 33) (35, 61) (5, 9) (26, 41) Supplier of equipment or materials 49 51 69 72 51 60 (43, 55) (45, 57) (62, 75) (59, 83) (46, 55) (52, 68) Private health and safety specialist or consultant 28 29 48 55 32 27 (23, 34) (24, 35) (41, 55) (42, 67) (28, 36) (20, 34) Fire brigade 0 2 - 1 0 3 (0, 2) (1, 4) (0, 3) (0, 1) (1, 8) Internal source 0 5 2 2 2 5 (0, 2) (3, 8) (1, 5) (1, 5) (1, 4) (3, 10) Training/courses 1 0 1 2 0 1 (0, 2) (0, 3) (0, 3) (0, 12) (0, 1) (0, 5) None of these 6 11 1 2 9 2 (4, 10) (8, 16) (0, 4) (0, 12) (7, 12) (1, 6) Don't know - 1 - 0 1 1 (0, 4) (0, 2) (0, 2) (0, 5) Other answer 0 0 1 0 0 1 (0, 2) (0, 2) (0, 3) (0, 2) (0, 1) (0, 4)
120
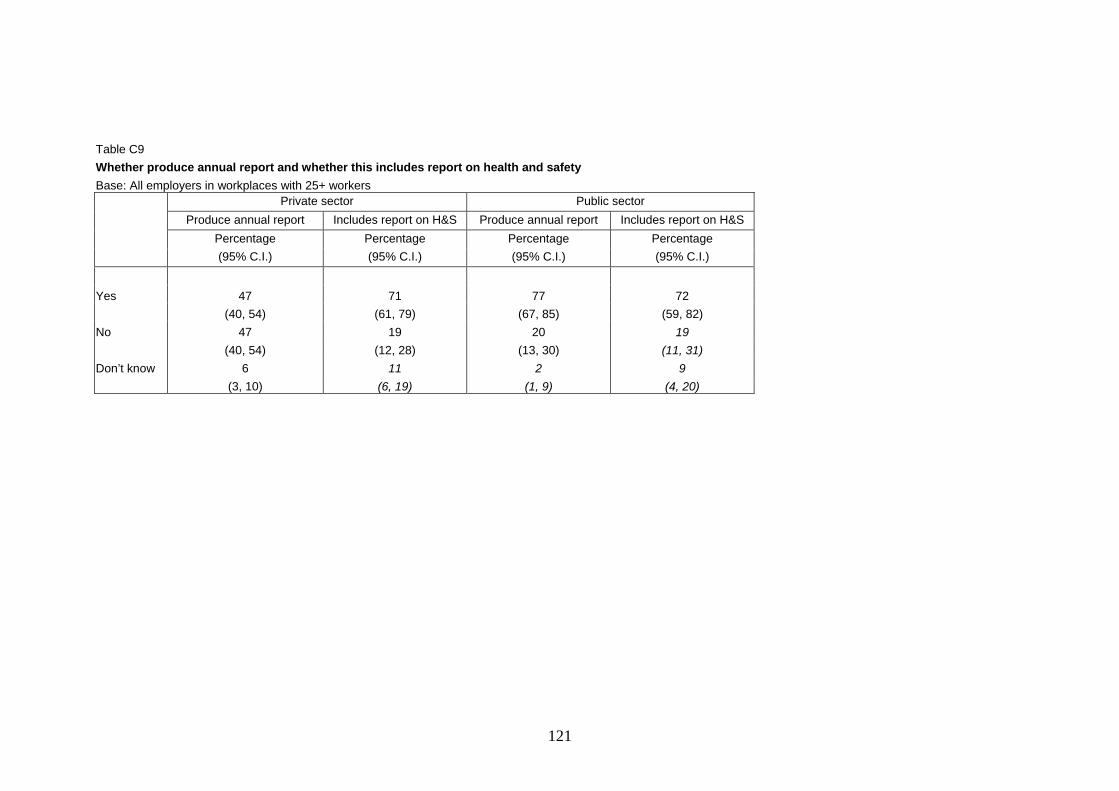
Table C9 Whether produce annual report and whether this includes report on health and safety Base: All employers in workplaces with 25+ workers
Private sector Public sector
Produce annual report Includes report on H&S Produce annual report Includes report on H&S
Percentage Percentage Percentage Percentage
(95% C.I.) (95% C.I.) (95% C.I.) (95% C.I.)
Yes 47 71 77 72 (40, 54) (61, 79) (67, 85) (59, 82) No 47 19 20 19 (40, 54) (12, 28) (13, 30) (11, 31) Don’t know 6 11 2 9 (3, 10) (6, 19) (1, 9) (4, 20)
121
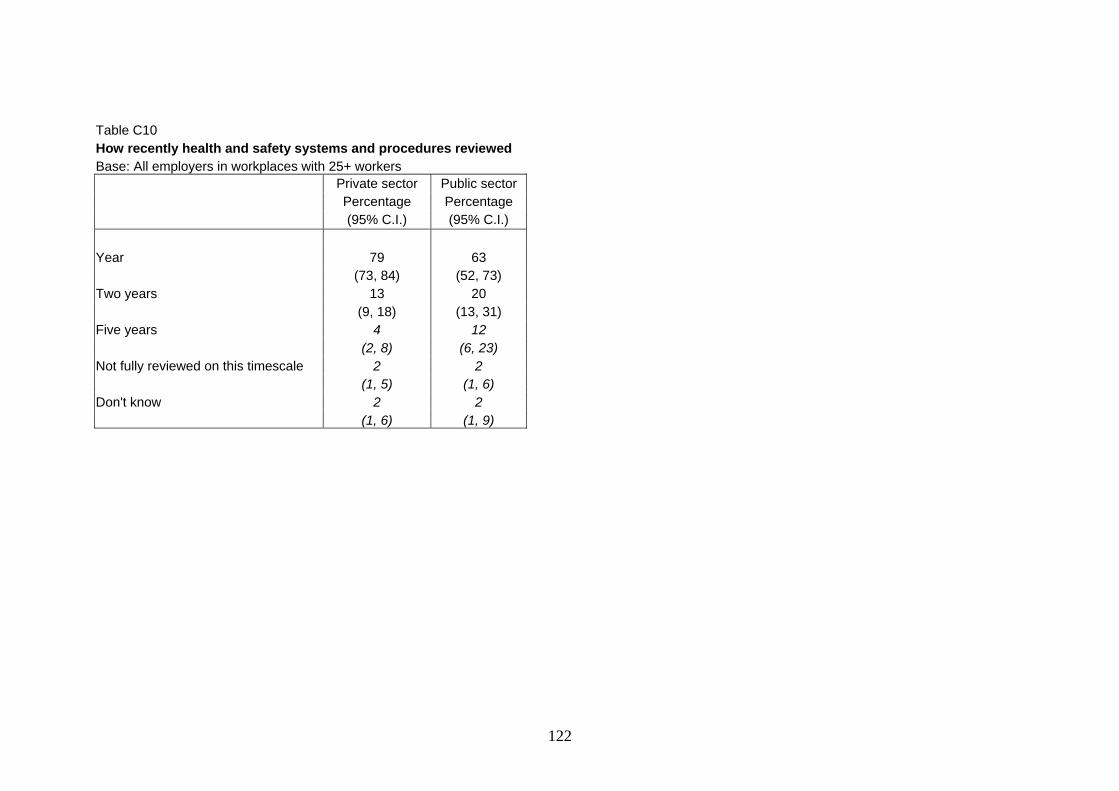
Table C10 How recently health and safety systems and procedures reviewed Base: All employers in workplaces with 25+ workers
Private sector Public sector Percentage Percentage (95% C.I.) (95% C.I.) Year 79 63 (73, 84) (52, 73) Two years 13 20 (9, 18) (13, 31) Five years 4 12 (2, 8) (6, 23) Not fully reviewed on this timescale 2 2 (1, 5) (1, 6) Don't know 2 2 (1, 6) (1, 9)
122

Table C11 Whether require suppliers to work to recognised health and safety management system or a specified performance standard Base: All employers in workplaces with 25+ workers
Private sector Public sector Percentage Percentage (95% C.I.) (95% C.I.) Yes - all 53 74 (46, 60) (63, 83) Yes - some 7 11 (4, 10) (6, 19) No 28 9 (23, 35) (4, 19) Not applicable 4 1 (2, 9) (0, 4) Don’t know 8 5 (4, 13) (2, 14)
123
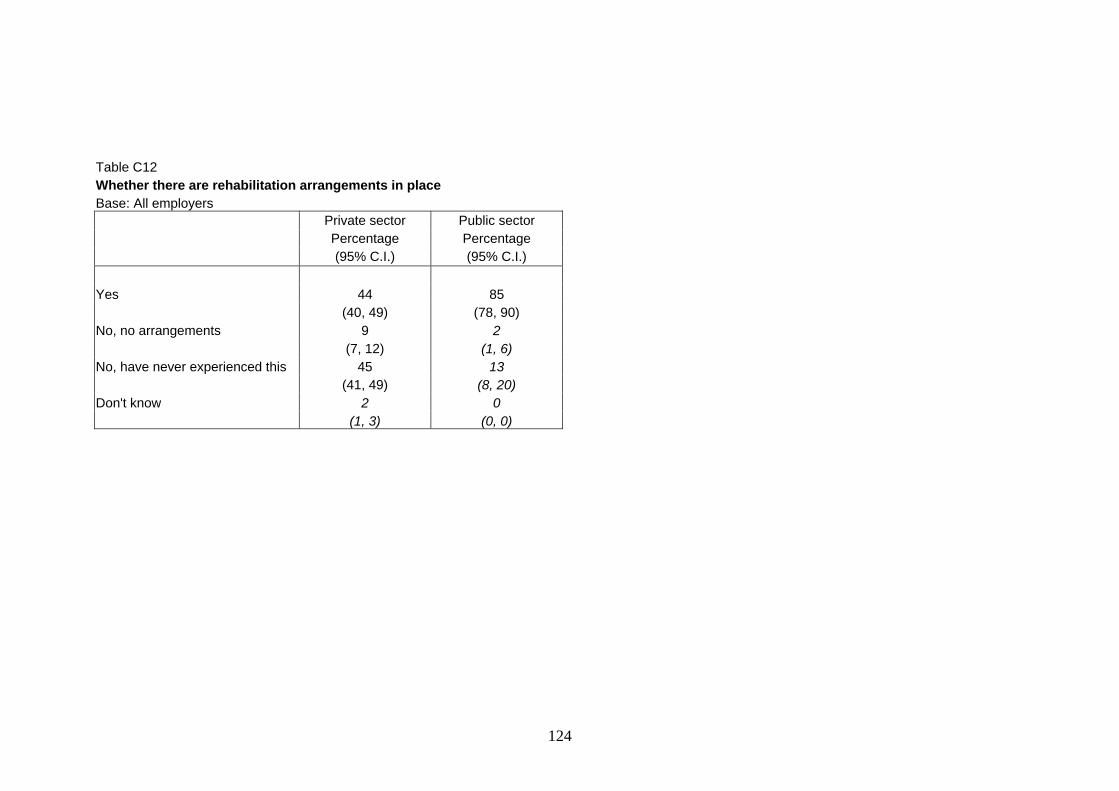
Private sector
Table C12 Whether there are rehabilitation arrangements in place Base: All employers
Public sector Percentage Percentage (95% C.I.) (95% C.I.) Yes 44 85 (40, 49) (78, 90) No, no arrangements 9 2 (7, 12) (1, 6) No, have never experienced this 45 13 (41, 49) (8, 20) Don't know 2 0 (1, 3) (0, 0)
124
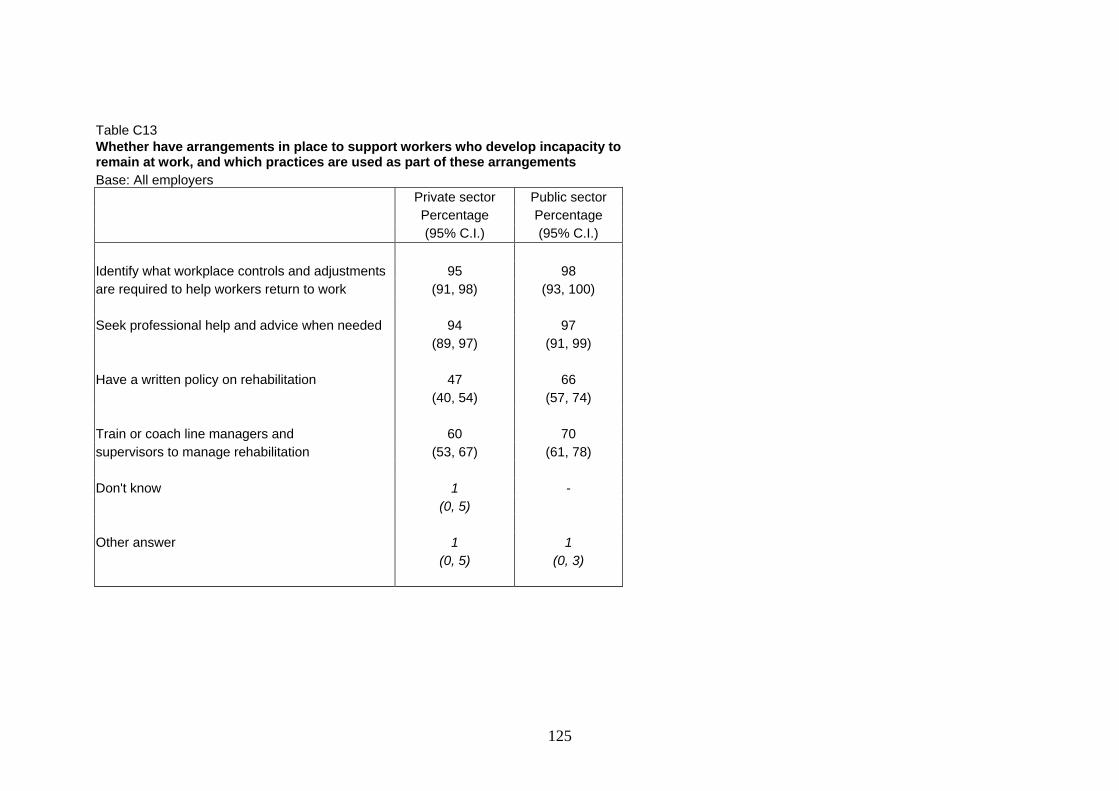
Table C13 Whether have arrangements in place to support workers who develop incapacity to remain at work, and which practices are used as part of these arrangements Base: All employers
Private sector Public sector Percentage Percentage (95% C.I.) (95% C.I.) Identify what workplace controls and adjustments 95 98 are required to help workers return to work (91, 98) (93, 100) Seek professional help and advice when needed 94 97 (89, 97) (91, 99) Have a written policy on rehabilitation 47 66 (40, 54) (57, 74) Train or coach line managers and 60 70 supervisors to manage rehabilitation (53, 67) (61, 78) Don't know 1 - (0, 5) Other answer 1 1 (0, 5) (0, 3)
125
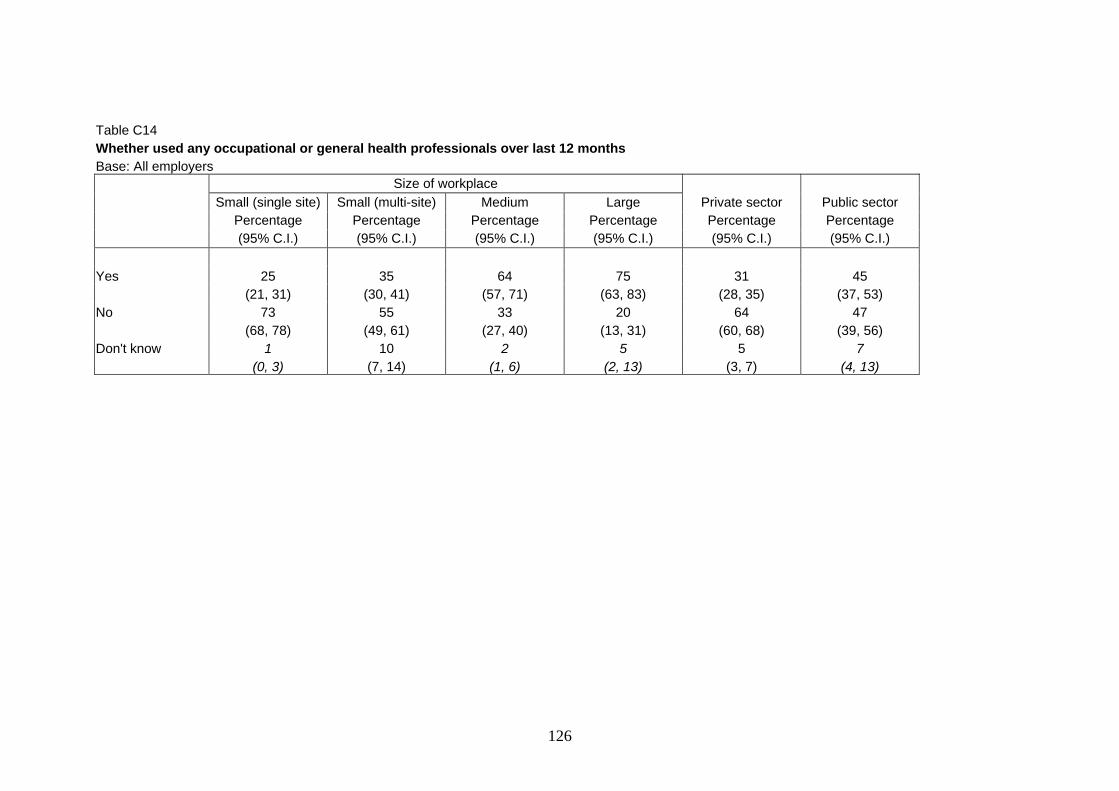
Table C14
Whether used any occupational or general health professionals over last 12 months
Base: All employers Size of workplace Small (single site) Small (multi-site) Medium Public sector Large Private sector
Percentage Percentage Percentage Percentage Percentage Percentage (95% C.I.) (95% C.I.) (95% C.I.) (95% C.I.) (95% C.I.) (95% C.I.) Yes 25 35 64 75 31 45 (21, 31) (30, 41) (57, 71) (63, 83) (28, 35) (37, 53) No 73 55 33 20 64 47 (68, 78) (49, 61) (27, 40) (13, 31) (60, 68) (39, 56) Don't know 1 10 2 5 5 7 (0, 3) (7, 14) (1, 6) (2, 13) (3, 7) (4, 13)
126

Table C15 Whether occupational health services are available to individual employees Base: Workplaces with 25+ workers using occupational/general health professionals in last 12 months
Private sector Public sector Percentage Percentage (95% C.I.) (95% C.I.) Yes 65 94 (55, 73) (86, 97) No 27 6 (20, 36) (3, 14) Don't know 8 0 (4, 17) (0, 1)
127

Table C16 Whether had to bring in new staff as temporary or permanent replacements for staff injured or made ill by work Base: All employers
Private sector Public sector Percentage Percentage (95% C.I.) (95% C.I.) Yes 4 13 (3, 6) (9, 20) No 95 86 (93, 97) (79, 90) Don’t know 0 1 (0, 1) (0, 5)
128

Table C17
Whether role includes overall responsibility for health and safety policy
Base: All employers Size of workplace Small (single site) Small (multi-site) Medium Large Private sector Public sector
Percentage Percentage e e Percentage Percentag Percentage Percentag (95% C.I.) (95% C.I.) (95% C.I.) (95% C.I.) (95% C.I.) (95% C.I.) Don't know - 1 - 0 0 0 (0, 4) (0, 1) (0, 2) (0, 0) Yes 84 60 66 57 74 59 (80, 88) (54, 66) ) ) (59, 72) (43, 70 (70, 78 (51, 67) No 16 39 34 43 26 41 (12, 20) (33, 45) (28, 41) (30, 57) (22, 30) ) (33, 49
129
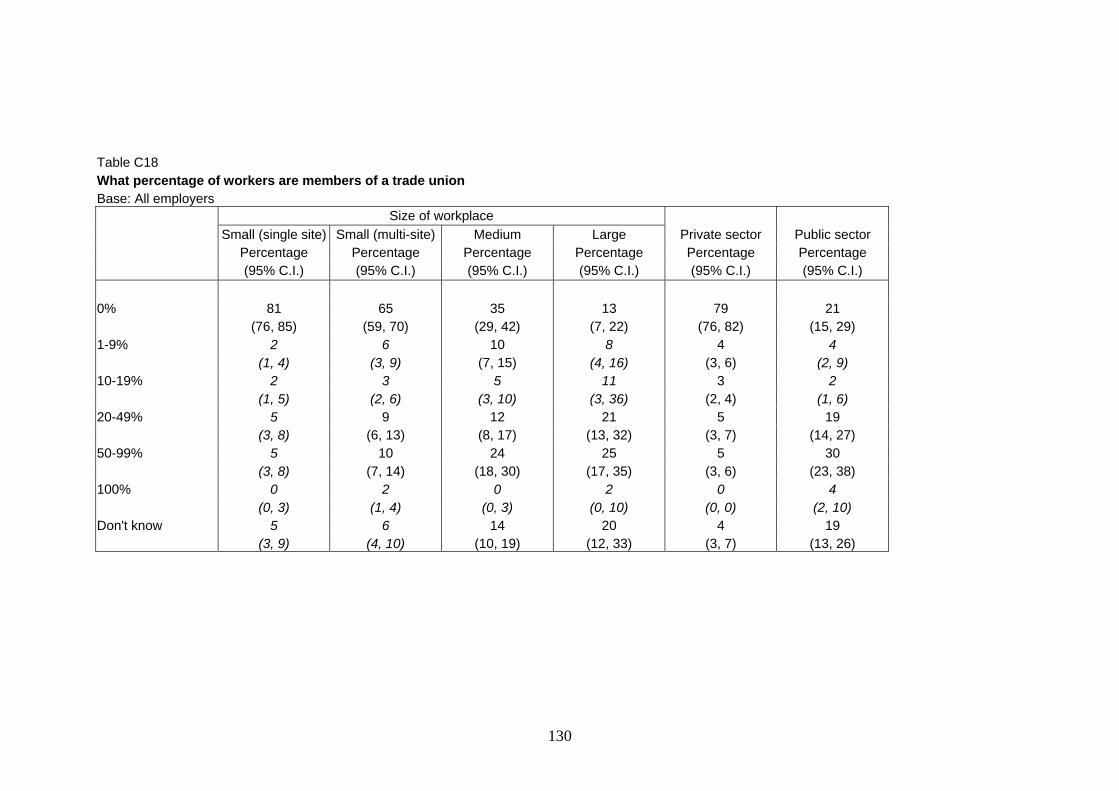
Table C18 What perc
entage of workers are members of a trad
e union Base: All employers
Size of workplace Small (single site) Small (multi-site) Medium Large Private sector Public sector
Percentage Percentage Percentage Percentage Percentage Percentage (95% C.I.) (95% C.I.) (95% C.I.) (95% C.I.) (95% C.I.) (95% C.I.) 0% 81 65 35 13 79 21 (76, 85) (59, 70) (29, 42) (7, 22) (76, 82) (15, 29) 1-9% 2 6 10 8 4 4 (1, 4) (3, 9) (7, 15) (4, 16) (3, 6) (2, 9) 10-19% 2 3 5 11 3 2 (1, 5) (2, 6) (3, 10) (3, 36) (2, 4) (1, 6) 20-49% 5 9 12 21 5 19 (3, 8) (6, 13) (8, 17) (13, 32) (3, 7) (14, 27) 50-99% 5 10 24 25 5 30 (3, 8) (7, 14) (18, 30) (17, 35) (3, 6) (23, 38) 100% 0 2 0 2 0 4 (0, 3) (1, 4) (0, 3) (0, 10) (0, 0) (2, 10) Don't know 5 6 14 20 4 19 (3, 9) (4, 10) (10, 19) (12, 33) (3, 7) (13, 26)
130

Annex B: Supplementary methodological details
The main survey methodology can be found in the Technical note at WEB ADDRESS. This supplement contains additional details and revisions to this methodology.
Part B1: Derived variables for analysis of WHASS standalone employer survey
In addition to the variables created by BMRB social in producing tables of statistics, a number of derived variables have been added or modified. These are detailed below.
sicsec: New coding of industry sector
Sample sizes were small and it was considered that some industry sectors could usefully be combined. SIC sections A and B (‘Agriculture, hunting and forestry’, and Fishing) were combined. SIC section N (‘Health and social work’) was re-formed, after being split into ‘Human health’ and ‘Vet and social work health’ previously.
sizewgt: Alternative coding of size, used during the post-stratification weighting procedure.
Undertaken so workplace size distribution of the sample data could be matched with workplace size distribution for the dataset which was used to define population distribution. Organisations were coded as: Micro (5-10 employees); Small (11-49 employees); Medium (50-299 employees); or Large (300+ employees).
sml_mult: Alternative coding of size used for final analysis.
It was decided that self-reported sizes (number of workers on payroll) were more aligned to the answers respondents gave to other questions, than were the IDBR-based organisation sizes. Also, this variable allows distinction between single- and multi-site workplaces. Organisations were coded as: Small single-site (5-49 employees, single workplace); Small multi-site (5-49 employees at multiple workplaces); Medium (50-249 employees); or Large (250+ employees).
_qesca, _qescb, …, _qesco: Risk responses (excellent, good, etc) coded as scores on a 0-100 scale. The third letter (‘c’ or ‘s’) refers to ‘common’ or ‘severe’ risks. The final letter denotes the type of risk (e.g. ‘a = stress’) and in this sense follows the same naming convention as other related existing variables.
To enable a numerical comparison between risks and across industry/sectors/workplace sizes. Responses were numerically coded as follows:
Excellent = 100
Very good = 80
Good = 60
Neither good nor poor = 40
131

Poor = 20
Very poor = 0
bestwt: New weighting system based on a raking procedure.
See Annex B: Changes to weighting procedure for rationale.
variables _qereps1, …, _qereps7 which asked separately about various possible ways in which health and safety representatives could be appointed.
Weights were derived in Microsoft Excel, following the procedures documented in 1
qenr1, qenr2, qenr3, qenr4, qenr5, qenr6:
A recoding of 36 variables
_qenr1_1, _qenr1_2, …, _qenr1_6,
_qenr2_1, _qenr2_2, …, _qenr2_6
_qenr3_1, _qenr3_2, …, _qenr3_6
_qenr4_1, _qenr4_2, …, _qenr4_6
_qenr5_1, _qenr5_2, …, _qenr5_6
_qenr6_1, _qenr6_2, …, _qenr6_6
into six first-that-applies variables asking who is responsible for various groups of non-employees’ health and safety.
On reflection a first answer that applies coding is more useful for these questions. For six groups of workers the question asks about who is responsible for their health and safety: written into the contract; left to the contracting employer; left to the managers or supervisors in the workplace; left to individual workers. There are also DK and not stated categories. These are now coded (in that order) as first that applies.
qestr: New first-that-applies variable to replace QESTRUC which asked separately about various possible structures workplaces could have in place to discuss and resolve H&S issues
Again it was felt this variable was more sensibly considered as first-that-applies. The original question asks about what structures are in place: a joint committee of managers and workers; employee health and safety representatives; discussion of health and safety issues with staff; managers only committee or working party; sole decision making; someone else makes decisions; and several other categories which have now been combined as ‘other’. In this order, the categories form a best-to-worst description of level of worker involvement. These are now coded (in that order) as first that applies.
qereps: New first-that-applies variable to replace the previous seven
Again it was felt this variable was more sensibly considered as first-that-applies. The original question asks about what method is used: appointed by workers but not through a trade union; appointed by a trade union; appointed by management (and various non-responses,
132

DK etc). In this order, the categories form a best-to-worst description of level of worker involvement. These are now coded (in the stated order) as first that applies.
altqein_1, altqein_2, altqein_3: Replace existing variables showing how many fatal/major/over3day injuries occurred. The difference is that don’t knows are coded as zero.
To produce more sensible rates for number of fatal/major/minor injuries per 100,000 people.
qd: Combination of variables measuring known number of days lost due to accidents and estimated number of days lost for those who did not know.
To allow a greater sample size for estimating days lost.
phca, phcb, …, phco: Numerical versions of the QEHA questions: “assessment of control of this hazard in the workplace”
Poor = 20
qdill: Equivalent to qd for days lost due to ill health
actra_a, …, actra_o: Combines ‘whether needed to take further action after risk assessment’ for risks identified as common or severe. The suffices _a, …, _o represent the different risks and are in the same order as for existing variables.
Allows an overall assessment of whether further action is usually needed for this risk, without the added complication of common/severe breakdown. The actra variables record yes if the respondent has answered that further action needs to be taken after a risk assessment of the relevant risk, if that risk has been identified as either common or severe in their workplace.
rac_a, …, rac_o: Combines assessment of current control of risk for each risk, from their identification as common and/or severe risk. Where a risk has been identified as both common and severe, the lower score is chosen. Again _a to _o represent the type of risk and follow the pattern of existing variables (‘a = stress’ etc).
This allows a single assessment of current control of risk in order to combine risks identified as common or severe.
Undertaken to allow comparison between groups on a numerical scale. Assessment of control is recoded as:
Excellent = 100
Very good = 80
Good = 60
Neither good nor poor = 40
Very poor = 0
133

Part B2: Alterations to original weighting and stratification scheme.
The sample was drawn from the Inter-Departmental Business Register (IDBR) and was stratified by SIC industry code and number of workers on the payroll. A boost sample was also obtained for Scotland and Wales. Larger organisations were over-sampled and smaller organisations under-sampled to compensate for the fact that many employees work for each large organisation. Random sampling was used within each stratum.
The IDBR was used to define workplace size (categorised as micro, small, medium or large). Upon first inspection of the data, however, it became clear that the respondents representing each workplace often had a different idea of the size of their workplace. Further inspection and follow-up phone-calls revealed that this was usually because the respondent was (as instructed) answering questions on behalf of those people for whom they were responsible, whereas the IDBR sizes sometimes reflected the size of the company in a much wider, or sometimes much narrower, sense. Responses to the survey questions were much more aligned to the self-reported workplace size and it was decided this should form the basis of a new size categorisation. This categorisation combined micro and small workplaces but introduced a new distinction, between small workplaces based on a single site and small workplaces on multiple sites.
The sample and stratification:
The final size categories chosen were therefore:
Small single-site: Single site workplaces employing fewer than 50 workers
Small multi-site: Workplaces with multiple sites, employing fewer than 50 workers in total
Medium: Workplaces with 50-249 employees
Large: Workplaces with 250 or more employees
Weighting:
Data was originally weighted according to which stratum an organisation belonged to, with some adjustment for non-response incorporated. However, in order to circumvent the discrepancy between the two size classifications, a post-stratification weighting scheme was chosen. This method has the additional benefit of avoiding the extra variability caused by spreading the sample very thinly across the weighting classes, which was necessarily the case when trying to under- and over-sample particular industries and workplace size categories to such a large extent.
Weights were attached to each data unit (respondent) in a given stratum using a raking procedure1. Raking follows an iterative procedure to match sample and
1 Elliot, D. (1991). Weighting for non-response. A survey researcher’s guide. Office of population censuses and surveys (social survey division). p27-31.
134
population marginal distributions, and for this dataset a total of 3 iterations was enough to match the marginal distributions to within 2 decimal places.
Analysis and estimation:
The svy commands in Stata were used to analyse the data. Use of these commands ensures that confidence intervals and standard errors are estimated using a Taylor series approximation method which properly accounts for the weighting structure. However, for the analysis, the stratification was not directly specified, for two reasons. Firstly, the original stratification used for sampling was not identical to the stratification used in creating the post-stratification weighting – workplace size bands were altered slightly to due to constraints on the availability of population marginal distribution data, and some industries (SIC sections A and B) were collapsed due to low numbers. Secondly, the very small numbers in some strata meant that some collapsing of strata would be necessary for analysis of each question, and on consideration of the structure of the data, it was felt that a consistent approach of collapsing all strata was most sensible, providing that non-specification of strata did not affect estimation of standard errors. A sensitivity analysis (see below) showed that the specification or non-specification of the strata in Stata did not significantly affect the estimated standard errors.
Notes on workplace size:
1. Sampling was based on companies with 5 or more employees, but some companies in the sample report having fewer than 5 workers on the payroll. In computing sample marginal distributions, these organisations are included in the 5-10 category.
2. The size categories used for weighting the data were not exactly the same as those used in the analysis, due to constraints on the availability of population distribution figures. For the purposes of weighting, specifically for matching sample and population marginals, workplace size was split into four categories: 5-10 workers; 11-49 workers; 50-299 workers; and 300+ workers. This should not affect the analyses significantly.
Sensitivity analysis to test the decision not to specify strata in the final analysis:
Some of the most important variables were computed once without specifying the stratification structure and once using the stratification originally used to select organisations (this structure was based on company size as defined by IDBR, SIC code and country).
Annex B Table B1 below shows the estimated number of respondents stating that each of 15 risks is present in their workplace. Annex B Table B2 shows estimated rates for number of fatal, major and over-3-day injuries, number of days lost due to accidents and ill health, and number of workers suffering ill health in the last 12 months.
135

Annex B Table B1:
Estimate without specifying strata
Estimate using strata Risk
% (95% C.I.) % (95% C.I.) Stress 51.00 (45.42 – 56.56) 51.00 (45.38 – 56.60)PC / Laptop usage 54.11 (48.52 – 59.59) 54.11 (48.64 – 59.47)Repetitive movements 29.50 (24.70 – 34.81) 29.50 (24.67 – 34.84)Awkward / tiring work 26.59 (21.98 – 31.77) 26.59 (22.00 – 31.74)Lifting 63.70 (58.01 – 69.02) 63.70 (58.12 – 68.93)Using appreciable force 19.43 (15.59 – 23.96) 19.43 (15.66 – 23.85)Vibration to hands 17.61 (13.99 – 21.92)17.61 (13.83 – 22.15)Vibration to whole body 6.82 ( 4.53 – 10.16) 6.82 ( 4.53 – 10.15)Noise 21.56 (17.40 – 26.40) 21.56 (17.49 – 26.27)Handling chemicals 33.60 (28.62 – 38.98) 33.60 (28.87 – 38.69)Breathing dusts & fumes 22.81 (18.66 – 27.57) 22.81 (18.74 – 27.47)Being threatened 26.79 (22.35 – 31.75) 26.79 (22.75 – 31.26)Working at height 18.85 (14.97 – 23.46) 18.85 (15.03 – 23.38)Slipping and tripping 69.26 (63.71 – 74.30) 69.26 (63.72 – 74.28)Driving 28.73 (24.05 – 33.91) 28.73 (24.01 – 33.95)
Annex B Table B2: Rates per 100,000 workers:
Without using strata Using strata
Fatal injuries 2.64 (0 – 6.48) 2.64 (0 – 6.47)Major injuries 135.87 (14.89 – 256.86) 135.87 (15.04 – 256.70)Over 3-day injuries 705.68 (328.05 – 1083.31) 705.68 (328.39 – 1082.97)Days lost – accidents 33968 (20548 – 47388) 33968 (20278 – 47414)Days lost – ill health 8318 (2721 – 13915) 8318 (2698 – 13931)No. workers ill in last 12m 580.64 (132.9 – 1028.4) 580.64 (134.1 – 1030.5)
136
Part B3: Data Limitations
The data is not representative of all British workplaces as estimates relate to workplaces with 5 or more employees according to the IDBR, although several questions were only asked of those workplaces with 25 or more employees on the payroll. Workplaces are work units within the IDBR and can be defined by the activity of a single employer at a single set of premises. For example, a series of shops that are part of a chain would each represent separate workplaces. A hospital comprising a number of buildings but on a single site would represent a single workplace. Where estimates relate to workers they relate to employees on the payroll within these workplaces unless stated otherwise.
There are some limitations to the data presented. Firstly as with all surveys, estimates become less reliable as the number of respondents answering a particular question becomes smaller. This may happen in the case of a sub-analysis or a follow-up to a question that only related to a small part of the entire population surveyed. To represent this, tabulated estimates considered less reliable are presented in italics. Where the actual number responding to any question was lower than 20 these tables have not been reproduced.
It is also vital to remember that estimates relate to the reports or view of health and safety managers at a site in response to a survey undertaken on behalf of the regulator. Although assurances of respondents’ anonymity were given it is possible that in some cases respondents were influenced by a desire to provide responses that were more favourable with respect to the workplace’s health and safety management. The survey questions aimed to minimise the influence of this social desirability bias although this was not possible for all questions. Where this may be affecting estimates it is highlighted in the text. The text contains reference to statistics considered to be of interest and all statistics mentioned are survey estimates. Many tables of statistics are included in Annex A that were considered of insufficient interest to highlight in this first findings report. These are included for completeness or for those who may have a specific interest.
137