working paper series - ecb.europa.eu · working paper series ... sub-sovereign-bond-purchasing...
TRANSCRIPT

Working Paper Series Politics, banks, and sub-sovereign debt: unholy trinity or divine coincidence?
Michael Koetter, Alexander Popov
Disclaimer: This paper should not be reported as representing the views of the European Central Bank (ECB). The views expressed are those of the authors and do not necessarily reflect those of the ECB.
No 2146 / April 2018

Abstract
We exploit election-driven turnover in State and local governments in Germany to studyhow banks adjust their securities portfolios in response to the loss of political connections. Wefind that local savings banks, which are owned by their host county and supervised by localpoliticians, increase significantly their holdings of home-State sovereign bonds when the localgovernment and the State government are dominated by different political parties. Banks’holdings of other securities, like federal bonds, bonds issued by other States, or stocks, are notaffected by election outcomes. We argue that banks use sub-sovereign bond purchases to gainaccess to politically distant government authorities.
JEL classification: G21, H63, P16.
Keywords: political connections; government-owned banks; sub-sovereign debt.
ECB Working Paper Series No 2146 / April 2018 1

Non-technical summary
Political connections provide numerous benefits to firms, ranging from improved access to credit, to
higher stock returns, to the ability to influence legislation, to a higher likelihood of receiving support
when in distress. Such relationships are particularly valuable to banks, whom the government as
a rule simultaneously regulates, provides a financial backstop to, and expects to serve as a source
of financing. Consequently, banks typically spend a lot of resources trying to influence government
actions by employing influential politicians to the board and by lobbying elected officials.
In this paper, we suggest a novel channel through which banks can bridge the political distance
to state authorities: the purchase of sub-sovereign debt. Because governments can (and do) issue
new debt on a regular basis, also through a private placement, banks’ holdings of such debt can be
adjusted quickly upwards. We argue that this channel can be activated when politically connected
local banks lose their access to politicians at higher levels of government because of democratic
elections. The cost to banks of losing such access can include, for example, a less beneficial treatment
in times of stress if state authorities can influence bailout decisions, or less direct access to state
authorities that are involved in the supervision of local banks. In this paper, we hypothesize that
banks that lost their communication channel along party lines to political authorities after elections,
may be using purchases of sub-sovereign bonds to re-gain ”front-row access” to relevant politicians.
To identify this mechanism, we construct an empirical set-up which exploits the unique dual
institutional setting of the German electoral system and of the German banking system. There are
16 states and 438 counties in Germany, with two major parties—the CDU (Christian Democrats)
and the SPD (Social Democrats)—active at all levels of regional politics. Either one is almost
always at the head of coalitions emerging after state parliament elections. Likewise, they are almost
always the dominant party emerging in county-level elections. State parliament and county-level
elections of mayors and/or councils take place every four to six years, but at different points in time.
Election dates are typically pre-determined, thus leading to a staggered political alignment between
states and the counties within states. All 16 states issue their own government bonds. Crucially,
local (county-level or city-level) politicians are appointed to the supervisory board of local savings
banks. Hence, the staggered and predetermined timing of state and municipal elections ensures
that political (mis)alignment between a sovereign-bond-issuing state government and the board of a
ECB Working Paper Series No 2146 / April 2018 2
sub-sovereign-bond-purchasing local-government-owned bank emerges exogenously from the point
of view of both the state government and the individual bank.
Exploiting our identification strategy for a total of 32 State elections and 600 county elections
between 2005 and 2013, we find that political misalignment is strongly and significantly associated
with an increased propensity by local state-owned savings banks to increase their holdings of state-
issued sovereign bonds. Numerically, an election that causes a state-owned bank to switch its
political status form aligned to misaligned results in an increase in that bank’s holdings of debt
issued by the respective state government of 12 percent of a sample-wide standard deviation, relative
to a similar private bank. This result is robust to measuring exposure to state sovereign debt in
nominal or book value as well as in relation to total assets, the bank’s portfolio, or aggregate fixed
income securities within that portfolio. Importantly, our results are also robust to the inclusion of
bank as well as county×quarter fixed effects.
Three further results point to the fact that we have indeed identified a political mechanism
of sub-sovereign bond holdings. First, we find that after the loss of political connections, state-
owned banks are also more likely to increase government lending. Second, we find that our results
are mostly driven by political misalignment produced by state elections. A possible narrative in
line with this statistical regularity is that incumbent local politicians on the supervisory boards of
state-owned banks aim to bridge the loss of political alignment with state authorities by increasing
own-state debt holdings to reduce political distance. Third, we find that politically misaligned
banks that are distressed receive significantly smaller bailout support relative to risk-weighted
assets compared to distressed banks that are domiciled in aligned counties.
The robust empirical regularity that we have uncovered can be worrisome to policy makers
for at least two reason. For one, higher balance sheet exposures to the sovereign can exacerbate
the bank-sovereign loop in times of heightened sovereign stress, as the recent eurozone sovereign
debt crisis demonstrated. Second, investing in public debt can crowd out private investment, with
negative implications for the local economy. Our paper thus points to additional potential economic
costs associated with the tendency of banks to build political relationships with their sovereign.
ECB Working Paper Series No 2146 / April 2018 3

1 Introduction
Political connections are valuable to firms. The empirical literature has documented numerous
benefits of political ties, such as preferential access to credit (Cull and Xu, 2005; Johnson and
Mitton, 2003; Khwaja and Mian, 2005), higher stock returns (Claessens, Feijen, and Laeven, 2008;
Faccio, 2006; Goldman, Rocholl, and So, 2009), the ability to influence legislation (Kroszner and
Strahan, 1999; Mian, Sufi, and Trebbi, 2010), favorable regulatory treatment (Braun and Raddatz,
2010), and more generous government support when in distress (Faccio, Masulis, and McConnell,
2006; Duchin and Sosyura, 2012). At the same time, while privately beneficial to firms, close
relationships with politicians can be associated with substantial economic distortions (Shleifer and
Vishny, 1994; Cingano and Pinotti, 2013). This concern is particularly applicable to banks, which
the government simultaneously regulates and provides with a financial backstop. Hence, it is
important to document the mechanisms how firms in general, and banks in particular, build political
connections to understand both the private benefits and the social costs of such connections.
It is already well-established that banks invest substantial resources in building political con-
nections. But evidence is restricted to campaign contributions, lobbying, and direct lending (e.g.,
Mian, Sufi, and Trebbi, 2010; Lambert, 2015; Gao, Ru, and Tang, 2016). In this paper, we show
that a link exists between the intensity of banks’ political connections and the composition of their
securities portfolios. We demonstrate a robust new fact: after a loss of political connections due to
regional elections, local government-owned banks in Germany increase substantially their holdings
of bonds issued by their home-State government. The same election event does not lead the same
government-owned banks to adjust their holdings of any other broad class of securities. Our results
thus suggest that the electoral cycle has a material effect on the type of securities banks choose to
hold in their portfolios, and in particular on the home bias in their sub-sovereign bond holdings.
Identifying a politically-motivated portfolio reallocation is challenging because banks can adjust
their securities portfolios for a number of other reasons, such as risk shifting, liquidity management,
or ”moral suasion”.1 We exploit the unique dual institutional setting of the German electoral system
and of the German banking system. To start with, Germany is a federation which comprises 16
States (Bundeslander) and 438 counties (Kreise and kreisfreie Stadte). States and counties hold
1For a detailed discussion of these mechanisms, see Broner, Erce, Martin, and Ventura (2014) and Gennaioli,Martin, and Rossi (2014a), among others.
ECB Working Paper Series No 2146 / April 2018 4

regular elections to determine the political composition of State parliaments and of the local city
councils, respectively. Elections for State parliaments and for local councils take place every four
to six years, but typically at different points in time, thus leading to staggered changes in the
composition of governing coalitions in States and in counties within States. There are two major
parties in Germany, the CDU (Christian Democrats) and the SPD (Social Democrats) that are
active at all levels of regional politics. With few exceptions, one of the two parties is at the head of
a governing coalition emerging at the State level (after State parliamentary elections) and at the
local level (after county-level elections). Crucially for the purpose of our paper, States in Germany
have independent fiscal authority, and all 16 German States issue their own sub-sovereign bonds.
The German banking system, in turn, comprises private banks, cooperatives, and government-
owned banks. The two types of the latter are local savings banks (Sparkassen)—typically one per
county—and nine head institutions (Landesbanken), which operate at the State level. Head insti-
tutions serve as clearing houses and capital market gateways for the local savings banks associated
with them. Taken together, government-owned banks account for around a third of the German
banking market (GCEA, 2014) and are therefore an important player in the banking system. Co-
operative banks resemble Credit Unions in the United States and account for another 14% of the
market. Savings banks and cooperatives are similar in that—unlike private banks—they have no
profit maximizing objectives. Instead their mandate is to provide access to financial services to the
community where they are domiciled. However, they differ substantially in that cooperatives are
free from direct political influence arising from government ownership and supervision.
Specifically, each state’s savings bank law (Sparkassengesetze) features two provisions that are
crucial for our purposes. First, the local (county- or city-level) senior politicians are appointed as
the chairman to the supervisory board (Verwaltungsrat) of local savings banks. As such, they can
influence bank managers considerably. Second, savings bank laws provide the statutory source that
the legal supervision of each state’s entire savings bank sector rests with a ministry at the state
level, usually the ministry of finance or economic affairs. This institutional set-up gives rise to
political ties that do not exist for cooperative banks. And the case of Stadtsparkasse Dusseldorf is
an instructive piece of anecdotal evidence that county and state politics do interact—and at times
interfere—with the management conduct of savings banks (Reisener, 2012; Mussler, 2016).2
2This savings bank with 11 billion euro in total assets realized a substantial profit on the order of 140 million euro
ECB Working Paper Series No 2146 / April 2018 5

Importantly for our purposes, political ties from either channel are determined exogenously
from the perspective of the local savings bank. Local politicians chair supervisory boards ex officio
after winning a local election, but also lose this lever of affecting savings banks’ managers once
their party is no longer in power locally. Likewise, the political orientation of the legal supervisor
changes once a new cabinet is formed after State parliament elections, which entails a change of
guard at the ministry in charge of supervision. Thus, the staggered timing of State and county
elections ensures that political alignment or misalignment between a State government and the
board of a local government-owned bank emerges exogenously from the point of view of both the
State government and the individual bank.
Our identification strategy exploits this staggered timing of State and county elections to study
how local government-owned banks adjust their securities portfolios after becoming politically mis-
aligned from the State government. The control group are cooperative banks for which election
results are irrelevant because neither are local politicians required by law to serve on supervisory
boards nor do state politicians supervise cooperatives. We define ”political misalignment” as a
situation where the majority of votes at the local level are cast for a party that is different from the
one dominating the governing coalition at the State level. With this identification strategy in hand,
we study securities portfolio allocation by 455 government-owned banks and 1,227 cooperatives,
taking advantage of a total of 32 State elections and 600 county elections between 2005 and 2013.
Our main finding is that political misalignment is positively and significantly associated with
the propensity of local government-owned banks to hold sovereign bonds issued by their home State.
Numerically, an election that causes a local government-owned bank to switch its political status
from aligned to misaligned results in an increase in that same bank’s holdings of home-State debt
of up to 42% of the sample mean exposure (corresponding to an increase of around 1.05 million
euro), relative to a similar cooperative bank in the same county. This effect is mostly generated
by political misalignment resulting from State rather than county elections. Apparently, the loss
in 2014. The annual financial report proposed by the CEO Arndt Hallmann to the supervisory board for approvalretained almost the entire profit as reserves for general banking risks according to §340g of the German CommercialCode (HGB) although the bank was very well capitalized. The majority of the supervisory board agreed and approvedthe annual report, in particular the representatives of the conservative political spectrum. The chair of the supervisoryboard, the mayor of Dusseldorf Thomas Geisel from SPD, however, challenged the vote and demanded a dividendfor the city. The confrontation escalated and was ultimately resolved by the ruling of the State Ministry of Financein its capacity as legal supervisor to revoke the approval of the annual financial accounts. At the time, the ministrywas headed by Norbert-Walter Borjans from SPD.
ECB Working Paper Series No 2146 / April 2018 6

of political proximity between local politicians on the boards of local government-owned banks to
home-State authorities induces their banks to hold more home-State debt. At the same time, we
find that local government-owned banks in politically misaligned counties are not more likely to
increase their holdings of any other type of securities, such as German federal bonds, bonds issued
by other German States, or a broad class or traded stocks.
The main result obtains when we include bank fixed effects, which control for unobserv-
able time-invariant motives to hold a particular bond class. It also remains robust to including
County×Quarter fixed effects in order to wash out all unobservable variation in home-State bond
holdings that is common to all banks in the same county at the same point in time. It continues
to obtain when we only compare local savings banks in politically aligned versus misaligned locali-
ties. Thereby, we account for the possibility that local cooperatives are not an appropriate control
group. It also remains intact when we compare individual banks’ bond holdings across 187 con-
tiguous counties for instances when one State-county misalignment occurs at a different time than
in a neighboring county.3 Importantly, the statistical association between political misalignment
and bond buying disappears in placebo tests where we move the timing of State elections by 1, 2,
or 3 years around the true election date.
Our empirical strategy allows us to cleanly eliminate all other alternative mechanisms that
could be leading banks to increase their sub-sovereign bond holdings, by making sure that they are
either unlikely or that they yield the opposite prediction. In particular, our results cannot be driven
by regulatory compliance or by liquidity management considerations as these would lead banks to
pile up on federal German bonds, which are fully risk-free, perfectly liquid, and widely available.
Our results cannot be driven by asset substitution (risk shifting) either because all German states
were very highly rated during our sample period. Finally, our results are inconsistent with the
type of ”moral suasion” that apparently took place during the euro-area sovereign debt crisis (e.g.,
Ongena, Popov, and van Horen, 2016). This mechanism would lead politically aligned banks—i.e.,
local government-owned banks on which the home-State government can exert pressure via the
channel of political party affiliation—to increase their holdings of home-State debt. The totality of
our results thus suggests that we capture a genuine electoral effect whereby local government-owned
3These counties are adjacent neighbors and thus similar in observable and unobservable conditions. Therefore, wecan relate election outcomes and bank bond buying while holding local unobservable background forces constant.
ECB Working Paper Series No 2146 / April 2018 7

banks have an incentive to increase their holdings of home-State bonds after becoming disconnected
from the home-State government along political party lines.
The novel fact we uncover raises two questions. First, what are the costs to local German
savings banks of losing their political connections with the State government? One regularity
emerging from our data is that politically unconnected savings banks receive less capital support
when in distress relative to politically connected savings banks. This finding is commensurate with
the institutional design of savings bank insurance in Germany, which is organized by savings bank
associations that operate safety nets at the State level. These associations operate guarantee funds
where member banks in the association provide support if another member bank is in distress.
The bodies that govern regional savings bank associations include usually representatives from the
individual banks—especially the local politician serving as the chair of the supervisory board of
member banks—and the president of the association. This position is often politically appointed
according to observers (see, e.g., Schieritz and Storn, 2012) and anecdotal evidence.4 Therefore, it
does not seem impossible that the proximity of State and county politicians co-determine the terms
of bailout decisions of individual savings banks through these safety nets just like this interaction
of local and State politics affected other business choices, such as profit distribution and lending.
Not that we do not claim an influence exerted by state politicians ex officio as is the case with
local politicians that are mandated de jure to chair supervisory boards. Instead we limit ourselves
to documenting robust empirical evidence regarding the fact that the capital support routed by
the association are more generous when the involved bank is politically aligned according to our
definition. In fact, this argument relates to prior studies which have found that politically connected
firms are more likely to be bailed out when in distress (Faccio, Masulis, and McConnell, 2006).
The second question is, how larger holdings of home-State bonds compensate for the loss of
political connections along party lines? State debt in Germany is peculiar. Unlike federal debt,
which is placed by public auctions, it is typically placed privately. Indeed, we have inquired with
the fiscal authorities in the individual German States and they have confirmed to us that a private
placement is the preferred arrangement. In practice this means that the Ministry of Finance of a
4Related to the aforementioned case, note for example that the acting president of the association of which theStadtsparkasse Dusseldorf is a member (Rheinischer Sparkassen- und Giroverband)—Michael Breuer—is a formerCDU member of parliament and minister for European and Federal Affairs of the conservative-led government thatwas in power until July 2010. He resigned as a minister and member of parliament in the course of 2007 and waselected president of the association in January 2008.
ECB Working Paper Series No 2146 / April 2018 8
State and a financial institution agree on the amount and the price of a debt placement without
making the terms of the transaction publicly known. Given this arrangement, the first possibility is
that such private placements involve advantageous terms (e.g., below-market prices), constituting
a political favor to the State government on behalf of the individual bank. However, the amounts
involved are small. The difference in home-State bond holdings between a misaligned and a similar
aligned bank is between 400,000 and 1 million euro. Thus, it is unlikely that the State government
extracts sufficient gains from this transaction for it to constitute a political favor that needs to be
returned in the future.
Alternatively, such financial transactions may simply buy banks ”face time” with the politicians
in power. As such, these transaction could fulfill an economic function akin to lobbying to the
extent that Bertrand, Bombardini, and Trebbi (2014) have shown that the main added value
of lobbyists is their access to individual politicians, rather than their expertise in the political
process. Put differently, front-row access to politicians is crucial to private businesses and the case
of Stadtsparkasse Dusseldorf illustrates that gaining access to State politicians is probably fairly
frictionless, perhaps even automatic, if both agents are from the same party. But presenting a
case can be difficult for a local savings bank if it is not politically aligned, especially when the two
main alternative channels—political lobbying and private contributions—are severely limited, as is
the case in Germany. Therefore, access to the relevant politicians obtained so to speak as a by-
product during a financial operation that allows State politicians and local bankers to meet—such
as purchasing State bonds in a private placement—may provide banks with exactly the kind of
access they need.
Our paper adds to the empirical literature on the impact of political factors on bank performance
and business decisions. For example, Agrawal and Knoeber (2001), La Porta, Lopes-de-Silanez,
and Shleifer (2002), Sapienza (2004), Dinc (2005), Khwaja and Mian (2005), Faccio (2006), Faccio,
Masulis, and McConnell (2006), Leuz and Oberholzer-Gee (2006), Micco, Panizza, and Yanez
(2007), Claessens, Feijen, and Laeven (2008), Li, Meng, Wang, and Zhou (2008), Goldman, Rocholl,
and So (2009), Mian, Sufi, and Trebbi (2010), Shen and Lin (2012), Carvalho (2014), Schoors and
Weill (2015), and Englmaier and Stowasser (2017) exploit variation across countries, or across
regions within a country, and show that government ownership reduces bank profitability and that
political favors arise through government banks, either in the form of cheaper lending in politically
ECB Working Paper Series No 2146 / April 2018 9

preferred regions or increased lending in election years. Another strand of this literature deals
with political determinants of bank behavior that are unrelated to direct ownership. For example,
Kroszner and Strahan (1999) document that special interests affected the timing of the removal of
barriers to entry in the U.S. banking industry. Agarwal, Amromin, Ben-David, and Dinc (2012)
show that during the recent financial crisis, banks delayed foreclosures on mortgages located in U.S.
districts whose representatives in Congress were members of the Financial Services Committee. In
addition, a number of papers provide evidence that politicians in power routinely delay bad news
about problems in the banking sector, both in developing and in industrialized countries (e.g.,
Brown and Dinc, 2005; Imai, 2009; Liu and Ngo, 2014). Our paper adds to this literature by
demonstrating that banks have an incentive to load up on sovereign debt in order to compensate
for the loss of a direct political link to the fiscal authority responsible for bailing out banks that
are close to default. Moreover, to the best of our knowledge, ours is the first paper to investigate
local savings banks’ political incentives in the case of sub-sovereign debt.5
Our paper is also related to a large literature on the home bias in portfolio allocation. The
presence of home bias has been documented across countries with diverse institutional environments
(Chan, Covrig, and Ng, 2005), within countries because investors exhibit a preference for domestic
assets (Kang and Stulz, 1997; Coval and Moskowitz, 1999; 2001; Laeven and Giannetti, 2012;
De Haas and van Horen, 2013), and for different assets including bonds (Butler, 2008), and, in
particular, sovereign bonds (Broner, Erce, Martin, and Ventura, 2014; Horvath, Huizinga, and
Ioannidou, 2015). While the presence of home bias in capital allocation has been well documented
in the literature, we are the first to show that home bias in bond holdings varies over time depending
on how elections affect creditors’ access to the center of political power.
Finally, our paper complements a growing empirical literature that studies how bank holdings
of sovereign bonds adjust in times of fiscal stress, and how the real sector is affected by this
adjustment.6 Studying banks active in a large number of countries, Gennaioli, Martin, and Rossi
5See Ohls (2017) for an analysis of the determinants why Landesbanken hold (sub-)sovereign debt.6A number of recent theory papers have modeled the sovereign-bank “doom loop”, arguing that domestic banks
have an incentive to purchase domestic sovereign bonds in times of fiscal stress because they expect to be bailedout, partially or fully, in the event of a sovereign default (e.g., Acharya, Drechsler, and Schnabl; 2014; Broner, Erce,Martin, and Ventura, 2014; Cooper and Nikolov, 2013; Crosignani, 2015; Farhi and Tirole, 2014; and Uhlig, 2013).Alternative theoretical mechanisms for the propensity of domestic banks to hold domestic sovereign debt are proposedin Gennaioli, Martin, and Rossi (2014a) where domestic banks choose to hold domestic sovereign bonds for liquidityreasons, and in Acharya and Rajan (2013) where banks choose to increase their holdings of domestic public debt inthe presence of financial repression in the form of a tax on real investment.
ECB Working Paper Series No 2146 / April 2018 10

(2014b) find that during sovereign defaults banks increase their holdings of sovereign debt and
subsequently tend to lower their lending. Focusing on the European sovereign debt crisis, Popov
and van Horen (2015) show that non-GIIPS banks exposed to impaired sovereign debt contracted
their (cross-border) lending. De Marco (2014) finds that both GIIPS and non-GIIPS banks exposed
to peripheral sovereign debt, contracted their lending more. Acharya, Eisert, Eufinger, and Hirsch
(2014) find that banks’ high balance sheet exposures to impaired sovereign debt had a negative
effect on firm growth. Several papers in this literature have studied the different channels that can
explain why banks increase their holdings of sovereign bonds in times of financial or fiscal stress.
Using bank-level data on banks’ borrowing from the European Central Bank (ECB), Drechsler,
Drechsel, Marques-Ibanez, and Schnabl (2016) find that during the European sovereign debt crisis,
banks from both core and periphery countries engaged in risk-shifting, with weakly capitalized
banks borrowing more and pledging riskier collateral to the ECB. Furthermore, Acharya and Steffen
(2015) show that GIIPS and in particular non-GIIPS banks engaged in carry-trading by funding
themselves short-term in wholesale markets to buy sovereign bonds issued by countries under fiscal
stress. They argue that this behavior can be explained by regulatory capital arbitrage, risk-shifting,
and ”moral suasion” incentives. Buch, Koetter, and Ohls (2016) show that high-risk sovereign debt
exposures increase the risk of commercial banks in Germany. Relative to these papers, we exploit a
set-up where sovereign debt is risk-free, we focus on a political-incentives-based mechanism relating
governments and banks’ securities portfolios, and we look at sub-sovereign rather than sovereign
debt.
The remainder of the paper is organized as follows. Section 2 describes the data. Section 3
presents the empirical methodology. Section 4 provides the main test of the link between political
connections (or the lack thereof) and sub-sovereign bond holdings, alongside an exhaustive battery
of robustness tests. In Section 5, we investigate the benefits of State bond purchases. Section 6
concludes.
ECB Working Paper Series No 2146 / April 2018 11

2 Data: Sources and patterns
2.1 Elections and political power
Data on the outcomes of State parliament election results are readily available from the German
Federal Statistical Office. Figure 1 illustrates the staggered timing of both State- and county-
level elections per Bundesland. The figure also indicates color-wise the lead party of the emerging
coalition forming the states’ governments, as well as the party with the most cumulative votes
during county elections. For each State, the upper band depicts the occurrence of a State parliament
election, which is held every four to five years, yet at different points in time across States. We
show the name or names of the parties winning the election and forming a coalition. The first
abbreviation and the color of the band indicates the senior partner in these coalitions. CDU are
the Christian Democratic Union, a conservative party. SPD abbreviates the Social Democratic
Party. The Green party signature mark is the representation of ecological interests. Other parties
are the liberal party FDP (Free Democratic Party), the socialist party Die Linke, and other regional
interest groups that are occasional part of coalitions at the state level.7
The lower band depicts, in turn, for each state the occurrence of county-level elections. These
elections are held usually in each county within each state at the same time to determine the local
council of politicians. Oftentimes, these elections are also held together with the election of the
mayor of larger cities. We collect data on the votes cast per party from State Statistical Offices for
438 counties and show the party with the most cumulative votes in Figure 1. Given the number of
counties and local elections per State during our sample period, we observe a total of 600 county
elections.8
Figure 2 shows the corresponding map of German counties for each year between 2004 and
2013. It illustrates graphically the change in the distribution of aligned and misaligned counties,
where dark-colored counties are those where the majority of votes at the county level are cast for
the same party that is also in power at the State level, and light-colored counties are those where
7Such as, for example, the Sudschleswigsche Wahlerverband (SSW) in the northern state of Schleswig-Holsteinwho represent the interests of the Danish minority on German territory. Note that the CSU, the Christian SocialistUnion, is the sister party of the CDU and only active in the state of Bavaria. Together, CDU and CSU form one(conservative) faction in the federal parliament (Bundestag).
8For example, there are 26 counties in Hesse, and 2 local elections between 2005 and 2013 (one in 2006 and onein 2011) for a total of 52 county elections. See Figure 1 and Table 1 for details.
ECB Working Paper Series No 2146 / April 2018 12

the party receiving most votes at the county level is a different party than the one in power at the
State level.9
Consider as an example the case of North Rhine-Westphalia, the most populous State in Ger-
many, situated in the mid-West of the country. Figure 1 shows that the State parliament elections
in 2005 were won by the CDU, which formed a coalition with the FDP. In county elections in 2009,
the CDU also received consistently the most cumulative votes, but less so than during the previ-
ous county elections, possibly indicating increasing disagreement among local citizens with State
politics conducted by the conservative cabinet led by Jurgen Ruttgers from the CDU. Accordingly,
the map in Figure 2 shows that during the county elections of 2009, the number of misaligned
counties increased. The subsequent State parliament elections in 2010 were won by the SPD, which
formed a coalition with the Green party. The State election of 2010 then illustrates that the switch
of State government leadership from CDU to SPD renders formerly misaligned, SPD-run coun-
ties aligned, as shown in dark blue in the map of 2010, while formerly aligned, CDU-run counties
become misaligned, as shown in light blue in the map of 2010.
Table 1 shows the number of counties per state, together with the share of misaligned counties,
in each year between 2004 and 2013. The distribution of misaligned counties varies considerably
across both time and geographical regions, from a low of 0 percent (e.g., Schleswig-Holstein in
2006 and 2007) to a high of 100 percent (e.g., Hessen in 2008). On average, 34% of counties are
misaligned throughout the sample period. This high degree of regional variation bodes well for the
identification of the effect of political misalignment on state bond buying by local banks.10
Table 2 confirms that the distribution of aligned and misaligned regional politics is mirrored at
the bank level. The table distinguishes between government-owned savings banks and our control
group of local cooperatives.11 Pooled across all quarters between q4:2005 and q4:2013, the share of
savings banks domiciled in aligned counties is 41.2% compared to 37.4% among local cooperative
banks. As shown by the bank-quarter observations aggregated per year, this share is increasing
9In 2010, the Green party won the largest share of the vote in the State of Baden-Wurttemberg, and formed aruling coalition with the CDU. Because there are is not a single county in Baden-Wurttemberg that is dominated bythe Green party, we classify CDU-dominated counties as aligned, and SPD-dominated ones as misaligned after 2010.
10We acknowledge the fact that the three city-states in Germany—Berlin, Bremen, and Hamburg—cannot bemisaligned by construction (there is only one county in Berlin and in Hamburg and two in Bremen). We address thispoint in a robustness test shown in Appendix Table 6.
11Note that we only consider regional savings and cooperative banks given our focus on the political distancebetween county and State politics and exclude central head institutions of either banking sector.
ECB Working Paper Series No 2146 / April 2018 13

over time, possibly reflecting a more synchronized voting behavior in State and county elections
that are increasingly often held at the same time towards the end of our sample period (see Figure
1).
2.2 Banks’ securities portfolios
To gauge the propensity of local savings banks to adjust their securities portfolios around local
elections, we first need to observe the detailed bond holdings of banks. To this end, we obtain from
Bloomberg all active and inactive fixed income securities issued by German government entities.
Since q4:2005, the quarter in which the security holding statistics of individual banks become
available, there have been 3,021 such securities, of which 793 are federal bonds (Bunds), 5 have
been bonds issued by one or more cities, and the majority of 2,223 bonds have been issued by State
governments.
We combine this information with data from the security holdings statistics (SHS) of Deutsche
Bundesbank (“Depotstatistik”), which provides ISIN numbers, volumes, market and notional values
per security on a quarterly basis. The SHS data includes more than 5,000 government debt secu-
rities.12 Therefore, contrary to previously employed sources of sovereign exposures at the bank- or
country-level, such as the European Banking Authority and the Bank for International Settlements,
we consider the security holdings of all universal banks operating in Germany between 2005:Q4 and
2013:Q4.
The upper panel in Table 3 shows summary statistics on the various types of sovereign bonds as
shares of the bank’s total assets. Overall, the share of home-State debt among German banks is very
small. Relative to gross total assets (TA), both the average savings and the average cooperative
bank hold very little sub-sovereign debt from their home State, namely 11 and 6 basis points,
respectively. This small share reflects in part the lending rather than the investing focus of these
banks’ investment strategies. Also relative to the entire bond portfolio, these shares remain small,
at 63 basis points on average amongst savings banks and 31 basis points for cooperative. These
amounts are comparable to the banks’ holdings of Federal debt (17 basis points in the case of savings
banks, 13 basis points in the case of cooperatives). Holdings of debt issued by other German States
12Note that the term ”book value” used in the SHS database reflects the value according to German accounting rulesin the hold-to-maturity portfolio rather than mark-to-market valuation of financial securities. A detailed descriptionof the SHS database is Amann, Baltzer, and Schrape (2012).
ECB Working Paper Series No 2146 / April 2018 14

are comparably larger (31 basis points in the case of savings banks, 23 basis points in the case of
cooperatives), suggesting that banks hold a wide variety of sovereign and sub-sovereign bonds on
their balance sheets. Finally, banks hold substantially more traded stocks, to the tune of 1.63% of
their total assets in the case of savings banks.13
Two aspects are important to note here. Given the depth of the market for (risk-free) federal
German debt, one might wonder why local banks are holding on to State debt to begin with. State
debt is occasionally rated slightly worse than AAA or not at all (see Appendix Table 2) while not
offering significantly higher coupons., which goes against a simple diversification motive. Thus,
these small shares are plausible in and of themselves and their holdings might in fact very well
capture political motives on behalf of government-owned banks.
The second explanation relates to a fairly skewed distribution of holdings across local govern-
ment and savings banks. Since the start of the sample period in 2005 the share of local savings
banks with some exposure to sub-sovereign debt grew from 20% to 37% at year-end 2013. The
corresponding development amongst local cooperative banks exhibits a similar trend, but is less
pronounced (from 7% to 17%, see Appendix Table 3). Over the entire sample period, the average
local savings bank holds 2.5 million euro in home-State debt, with a mean size in terms of total
assets on the order of 2.5 billion euro. The average local cooperative bank is somewhat smaller,
around 0.6 billion euro in total assets, and also holds only 0.5 million euro in home-State debt
(Appendix Table 4).
In terms of summary statistics, we find that lending to the home-State government is non-
negligible in the case of savings banks (at 3.76% of total assets), and that between 38% and 42%
of the banks in our sample reside in politically disconnected counties.
2.3 Quarterly and annual bank control variables
We also include information on an exhaustive list of standard bank-specific characteristics—such
as assets, capital, stock and cash holdings, etc.—both at the quarterly and the annual level. The
former data are obtained from the monthly balance sheet statistics. Most annual proxies come
from micro-prudential reports on asset quality and funding details, as well as on profit and loss
accounts, which are submitted to the Bundesbank at annual frequency only. The middle and the
13Appendix Table 1 provides information on all variable definitions and sources.
ECB Working Paper Series No 2146 / April 2018 15

bottom panel in Table 3 provide descriptive statistics of these controls. In the empirical tests, all
covariates are lagged by one period.
3 Empirical methodology and identification
The goal of this paper is to study if political alignment between a local bank’s supervisory board and
the State government affects the composition of savings banks’ portfolios. To this end, we exploit
quarterly data on the changes in banks’ stocks of bonds issued by their home-State government, by
the federal government, and by other States, as well as in their shares of publicly traded stocks. The
quarterly frequency of the data allows us to employ a difference-in-differences type of methodology
whereby we compare banks that are more likely to banks that are less likely to be affected by
election outcomes and to react to the loss of political proximity following regional elections.
We exploit three features of the German institutional environment to identify the effect of
political alignment between regional and state governments. First, there are two major parties in
Germany, the CDU and the SPD, which dominate the ruling coalitions at both State and local levels
of government. Second, there are 16 federal States, all of which issue bonds, and 438 counties. State
parliament elections and elections of mayors and/or councils at the county level take place every
four to six years, but at different points in time, resulting in staggered changes in the political
alignment between governing coalitions at the State and at the local level. Third, the German
banking system comprises three segments: private, cooperative, and savings banks. Local savings
banks are owned by the counties where they are domiciled. Local political leaders, in most cases
the mayor or the county commissioner, are in turn appointed by law as the chair of the supervisory
board of local savings bank. The local savings bank sector accounts for 422 out of the 1,669
universal banks in Germany (GCEA, 2014), with an aggregate market share on the order of 14%
under management. In addition, head institutions—so-called Landesbanken—account for another
17% of market share.14 Cooperative banks, on the other hand, have no politicians on their boards,
but they have the same objectives as savings banks, namely, to serve their community rather than
to maximize profit.
14In our empirical analysis, we exclude all Landesbanken. These are very large and they are directly under theinfluence of the State government. As such, they may be subject to political considerations directly at the State level,see Ohls (2017).
ECB Working Paper Series No 2146 / April 2018 16

We start by identifying, for each of the 438 counties nested in the 16 federal States those
instances when a county became politically misaligned as a result of State or county elections that
produced coalitions dominated by different parties at the two levels of government. Regardless if
political misalignment arose following State or county elections, we treat all banks in a county as
aligned if the state government is led by the same party that received the most votes at the county
level. We consider a county—and, accordingly, all banks domiciled in it—as misaligned if the two
governments are dominated by different parties. The 32 State parliament elections and 600 county
elections observed over the period 2005–2013, translate into 1,183 instances in which a county and
its respective State switched their status from aligned to misaligned, or the other way round.
The second step in our identification strategy exploits the idea that unlike cooperatives, local
government-owned banks in misaligned localities have incentives to bridge the political distance to
the State government. One potential reason is that government-owned banks are subject to the legal
supervision executed by the State government, usually the Ministry of Finance or Economic Affairs.
Another channel might be the influence exerted—directly or indirectly—by State governments in
bailout decisions, for example via the presence of former senior politicians in executive positions
of the regional associations of savings banks. These associations, in turn, administer the regional
bank insurance schemes that decide about whether and how to bail out local members in distress.
Cooperative banks do not maintain regional safety nets that would involve de jure local political
representatives and possibly de facto state political interests.
Moreover, a local government-owned bank may be more likely to be bailed out by the State—
either with public funds or through the State-wide insurance scheme—if the governing coalition
in the State and in the local administration, whose members sit on the supervisory board of the
bank, are from the same party. Conversely, political misalignment may reduce the probability that
a local government-owned bank close to default would be bailed out as State politicians may prefer
to ignore or even “punish” local politicians from the opposite party. Therefore, a local government-
owned bank in a misaligned county may have an incentive to adjust its securities portfolio in
reaction to the loss of political connections.
By means of an example, consider the Sparkasse in the county of Duisburg, which is located
in the State of North Rhine Westphalia. During the county-level elections held in 2009, the local
constituency of Duisburg cast most votes for the SPD, thus becoming politically misaligned with
ECB Working Paper Series No 2146 / April 2018 17

the CDU-dominated governing coalition at the State level. In the neighboring county of Dusseldorf,
as in most other counties within the State, the CDU won the local elections in 2009. The next State
parliament elections were held just one year later in 2010, during which the SPD received almost
exactly as many votes as the CDU. Together with the Green party, the SPD formed a coalition
under the leadership of Hannelore Kraft as the new prime minister. From the point of view of our
identification strategy, in 2010 the banks operating in the county of Duisburg switched to aligned,
and the banks operating in the county of Dusseldorf switched to misaligned, given the change of
guard in the State capital.
Our identification strategy is based on a difference-in-difference estimation whereby we compare
the propensity of local government-owned banks to adjust their securities portfolio in response to
changes in political alignment, relative to the control group of cooperative banks. Exploiting this
identification mechanism, we model the total holdings of a range of securities by bank b domiciled
in county k in state s during quarter t as follows:
Securitiesbkst = αb + βkst + γMisalignedkst ×Government− ownedb + δXbkst−1 + εbkst (1)
Securitiesbkst is the ratio, during quarter t, of the total stock of a particular class of securities
(home-State bonds, out-of-State bonds, federal bonds, and publicly traded stocks) held by bank
b in county k in State s, to bank b’s total assets. Misalignedkst is a dummy variable equal to
one if during quarter t, the local government in county k and the state government in State s are
dominated by different parties. The variable equals zero if SPD or CDU are in power both in the
county and in the State at time t. Government− ownedb is a dummy variable equal to one if bank
b is a savings bank owned by the local government. Xbkst is a vector of time-varying bank-specific
control variables, such as assets, cash, loans, capitalization, profitability, etc. Finally, and crucially,
we include a vector of bank fixed effects αb and a matrix of County×Quarter fixed effects βkst.
The former allow us to net out the effect of unobservable bank-level characteristics, such as the
propensity to take risk or managerial quality, that might be fixed over a long period of time and
thus explain a large part of the cross-sectional variation in securities holdings across banks. The
latter wash out any variation in the bank’s propensity to hold different classes of securities that
ECB Working Paper Series No 2146 / April 2018 18

is common to all banks in the same county at the same point in time. Identification therefore
comes from comparing the behavior of government-owned and of cooperative banks in the same
county during the same quarter, in politically aligned relative to politically misaligned counties.
We specify two-way clustered standard errors at the county and quarter level (Petersen, 2009). We
estimate the parameters of Model (1) using OLS, but we also show that the main result in this
paper is robust to employing non-linear regression models (see Appendix Table 5).
Our coefficient of interest is γ. In a classical difference-in-differences sense, it captures the
difference in the propensity to hold a particular class of securities by the State between local
government-owned banks (the treatment group) and local cooperative banks (the control group), in
politically misaligned versus politically aligned counties. A positive coefficient would imply that—
all else equal, and relative to cooperatives—government-owned banks hold more of a particular class
of securities (e.g., bonds issued by their home-State) in counties where the local administration is
dominated by a different party from the one in power at the State level. The numerical estimate
of γ captures the difference in the overall holdings of a class of securities between aligned and
misaligned counties induced by switching from the control group to the treatment group.
4 Politics, banks, and securities holdings: Empirical results
4.1 Main result: Political misalignment and portfolio allocation
4.1.1 Home-State bonds
The headline results of the paper are reported in Tables 4 and 5. We first look at the impact
of the electoral cycle on banks’ holdings of home-State bonds. We start by estimate empirical
model (1) with different combinations of bank-level controls and fixed effects. In column (1),
we report a simplified version of the model, without any control variables and without any fixed
effects. The lack of bank fixed effects and of County×Quarter fixed effects allows us to include
the individual components of the main interaction variable Misaligned × Government − owned.
The results show that local government-owned banks exhibit on average higher home bias at all
times, compared to local cooperatives. Our results also imply that both government-owned banks
and private cooperatives in politically misaligned counties are more likely to hold sub-sovereign
ECB Working Paper Series No 2146 / April 2018 19

bonds issued by their home State. Crucially, the coefficient on the interaction term Misaligned×
Government − owned is positive and significant, suggesting that local government-owned banks
in politically misaligned counties are considerably more likely to load up on home-State bonds,
relative to local cooperatives, than local government-owned banks in aligned counties. This effect
is significant at the 1 percent statistical level.
Clearly, this effect might simply reflect some other unobserved bank traits. In column (2),
we therefore add bank-specific controls observed with quarterly frequency. Crucially, the point
estimate on Misaligned × Government − owned is still positive and significant at the 1 percent
statistical level. Regarding individual covariates’ point estimates, we find the following. Larger
banks, as measured by the log of total assets, are more likely to hold bonds issued by the home
State. One possible explanation is that only the larger local banks have sufficient capacity in their
investment portfolios to hold State bonds (instead of federal bonds) for conventional reasons, such
as demand for collateral, liquidity management, and so forth. Related, we find that banks with
larger shares of completely different asset classes relative to total assets are also less likely to hold
sub-sovereign debt. Specifically, the total asset shares of cash (a store of liquidity) and stocks (an
alternative form of security-driven revenue) are significantly negative as well. Banks with different
approaches to store liquidity and those seeking alternative non-lending sources of revenue but fixed
income are thus less likely to invest in State bond holdings.
At the quarterly level, we also observe for each bank the share of corporate, household, and
foreign non-financial firm lending relative to total non-financial firm lending. The omitted category
are loans to the non-profit and government sector, relative to which all banks are also less likely
to hold home-State’ bonds. The coefficients on these three categories are all statistically negative.
The effect of the foreign lending share is the largest, which might suggest that in particular those
banks with the most non-domestic exposure are also significantly less likely to hold State bonds.
More internationally oriented banks thus seem less inclined to engage in local and State politics,
possibly because such positions do not provide an effective bailout protection anyway.
One limitation of the monthly balance sheet statistics, from which we observe bank-specific
traits, is the lack of profit and loss account reporting of German banks during the year. There-
fore, we specify in column (3) an additional vector of covariates observed with annual frequency.
More core capital, higher profitability, lower fee income, larger liquidity buffers, as well as less
ECB Working Paper Series No 2146 / April 2018 20

inefficient operations all correlate positively with home-State bonds. These patterns would thus
be inconsistent with a lower need for building political connections due to bleak prospects among
banks with more stable financial profiles. An alternative interpretation of these annual covariates’
effect is, however, that banks with larger capital and liquidity buffers lack sustainable investment
opportunities in their local markets. Likewise, the negative effect of a higher fee-income share may
simply indicate that certain banks’ business models, like credit- or advisory-based ones, lead banks
to hold generally fewer securities, including those issued by their home State. And finally, higher
cost-to-income ratios, conventionally interpreted as an indicator of inefficient management, corre-
late positively with home-State bond holdings. The main effect still obtains, as suggested by the
still positive and highly significant effect on the interaction of Misaligned×Government−owned.
In this specification, we find that the difference in home-State bond holdings between government-
owned banks and cooperatives in aligned localities is no longer significantly different from zero. At
the same time, the coefficients on the variables Misaligned×Government−owned and Misaligned
imply that the difference in home-State bond holdings between government-owned banks and co-
operatives in misaligned localities is 4 basis points. This magnitude corresponds to an increase by
37% given a mean share of 10.8 basis points (see Table 3). Thus, even these very small shares
respond markedly in relative terms to the exogenous rupture of political ties between local and
State politics. At the same time, cooperative banks in misaligned localities on average have 1.4
basis points higher holdings of home-State debt, suggesting that the diff-in-diff coefficient should
not be interpreted in the sense of cooperatives reducing their holdings of home-State debt following
political misalignment.
In column (4), we introduce bank fixed effects and quarter fixed effects. The combination of
controls and fixed effects in this regression explains about 47 percent of the variation in state bond
holdings, and the magnitude of the coefficient on the interaction variable, as well as its significance,
are practically unaffected. In column (5), we include quarterly bank controls, in addition to bank
fixed effects and County×Quarter fixed effects. The latter wash out the effect of all unobservable
time-invariant bank characteristics and of local economic conditions common to all banks in a
county at the same point in time. In this fully saturated specification, the point estimate on the
interaction term Misaligned×Government−owned is still positive and significant at the 1 percent
statistical level. Numerically, it declines by 0.9 basis points relative to the estimate in column (4),
ECB Working Paper Series No 2146 / April 2018 21
suggesting that indeed economic conditions at the level of the county that are common to both
government-owned and to cooperative banks explain a substantial portion of the variation in State
bond holdings. We also find that the combination of control variables and fixed effects explains
around 57 percent of the variation across banks in state bond holdings. The magnitude of the
main effect of interest declines further in our preferred specification in column (6) where we add
the annual covariates, but it remains significant at the 5 percent statistical level.15
The estimates reported in Table 4 strongly suggest that local government-owned banks increase—
more than cooperatives—their holdings of home-State debt in order to make up for the loss of
political connections when the local government is dominated by an opposite party from the party
in power at the State level. The main result cannot be explained by the kind of ”moral suasion”
practiced implicitly during the sovereign debt crisis (e.g., Ongena, Popov, and van Horen, 2016).
Under this mechanism, banks in aligned localities should be more likely to purchase additional
State-issued bonds if the authorities at the State level need their fellow party members on the
board of local savings banks to push for the provision of fresh funds for pet infrastructure projects.
The results in Table 4 are also not immediately related to the ”risk shifting” channel whereby banks
bet on risky government debt because they expect to be bailed out, partially or fully, in the event
of a sovereign default (Broner, Erce, Martin, and Ventura, 2014; Farhi and Tirole, 2014). This
is so because even though government-owned banks typically have a higher incentive than private
banks have to shift risk, the assets in question are practically risk-free. Finally, these results are in-
consistent with the ”liquidity management” mechanism: if government-owned banks have a higher
incentive to store liquidity in State bonds, this incentive should not be affected by the political
connections of the bank’s board.
Figure 3 plots the difference between government-owned banks and cooperatives in their propen-
sity to hold home-State sub-sovereign bonds, in misaligned and in aligned localities, and around
election events. It shows that government-owned banks are at all times more likely to hold own-
State bonds. In particular, during periods of political alignment, government-owned banks hold
around a 0.3 higher share of their assets in home-State bonds than cooperatives. However, after
an election that produces political misalignment, this difference jumps to 0.8, while it stays at 0.3
15Appendix Table 5 demonstrates that the main result in this paper is robust to employing non-linear regressionmodels to account for the structure of the bond holding data, such as Tobit, Probit, Logit, and Poisson models.
ECB Working Paper Series No 2146 / April 2018 22
in counties where the election outcome was political alignment.
4.1.2 Other securities holdings
In Table 5, we report estimates from Model (1) for alternative dependent variables: holdings of
federal bonds, holdings of bonds issued by other German States, and holdings of a broad class of
publicly traded stocks. We subject all of these tests to the same empirical strategy as in Table 4, i.e.,
gradually adding bank controls and fixed effects. However, for brevity we report only the estimates
from the preferred specification with quarterly and annual bank controls, which are supressed, with
bank fixed effects, and with County×Quarter fixed effects.
We find that there is no statistical difference in the behavior of local government-owned banks
and of local cooperatives, in aligned versus misaligned localities, with respect to their holdings of
German federal bonds (column (1)). This shows that political considerations do not increase local
government-owned banks’ appetite for sovereign debt per se, because in this case they would increase
their holdings of the safest and most widely available German government bond as well. Moreover,
in column (2), we find that relative to cooperatives, government-owned banks in misaligned localities
are not more likely than government-owned banks in aligned localities to purchase sub-sovereign
debt issued by other German states. This finding lends further support to the idea that political
misalignment is only costly to local government-owned banks when it involves a rupture along
party lines with the government in their home State, which is the legal supervisor and home to
the regional association administering bailouts. Finally, in column (3), we fail to reject the null
hypothesis that government-owned and private banks do not differ, across aligned and misaligned
localities, in their propensity to hold common stocks. The totality of our results suggests that
indeed, elections which change the political alignment between States and individual county do not
affect banks’ incentives to adjust their portfolio beyond home-State debt securities.
4.2 Falsification tests
Our results so far suggest that elections that produce a political misalignment between the local and
the State government lead to a securities portfolio adjustment by local government-owned banks,
relative to local cooperative banks with similar non-profit-maximizing objectives. In particular,
banks appear to increase their holdings of home-State bonds, but leave their holdings of other
ECB Working Paper Series No 2146 / April 2018 23

securities (other sovereign and sub-sovereign bonds and stocks) untouched.
We now want to make sure that this effect is really driven by elections which produce a political
misalignment between the local and the State government. To make sure that we are not mistakenly
identifying an alternative mechanism, in Table 6 we conduct a series of falsification tests. In
particular, we re-date the electoral outcomes in our data set in a number of ways. In column (1),
we pretend that all elections took place a year earlier, and we re-code the Misaligned dummy
accordingly. We also re-date the electoral outcomes by artifically moving all elections by 2 years
(column (2)) and by 3 years (column (3)).
The results in Table 6 show unequivocally that the association between political misalignment
and home-State bond holdings vanishes when we specify placebo elections. These results thus
corroborate that local government-owned banks increase these holdings only when their political
connections to the State government along party lines is ruptured after a regional election.
4.3 Alternative channels
In Table 7, we address the concern that the effect we observe is driven by other shocks to banks
that happen to coincide with particular election outcomes. It is possible that at the same time
when political alignments change as a result of elections, some government-owned banks are facing
concurrent shocks to their propensity to adjust their securities portfolio—unrelated to political
distance—that other banks are not experiencing.
In column (1), we account for the possibility that government-owned banks (the treatment
group) and cooperative banks (the control group) may not be sufficiently similar across observable
characteristics, a hypothesis reinforced by the difference in means reported in Table 3. In prin-
ciple, we control for these differences by including time-varying bank controls and we control for
unobserved bank-specific time-invariant heterogeneity by including bank fixed effects. However, to
account for the fact that variables such as bank size and capital adequacy can potentially predict a
bank’s propensity to load up on sovereign bonds, we also estimate our model using a sample which
is chosen based on a Propensity Score Matching procedure. In practice, we calculate a propensity
score for each bank’s likelihood of being government-owned versus being a cooperative bank, based
on a range of bank-specific controls. We next reduce the sample of cooperatives to the subset that
is most similar to the sample of government-owned banks. The estimates show that even within
ECB Working Paper Series No 2146 / April 2018 24

the matched sample, and compared to cooperative banks, savings banks in misaligned localities
hold a significantly larger stock of State bonds than government-owned banks in aligned localities.
We next note that in 2007 and 2008, five Landesbanken (Sachsen LB, West LB, Bayern LB, and
Landesbank Baden-Wurttemberg, and HSH Nordbank) that had invested substantially in the U.S.
subprime mortgage market before the financial crisis, declared significant losses. Because savings
banks in the respective federal States were required by law to provide support to their respective
Landesbank (for details, see Puri, Rocholl, and Steffen, 2011), they became at the time less likely
to engage in other activities, such as making loans or purchasing securities. In column (2), we
account for this shock by including an interaction between the government-owned dummy and a
dummy equal to one if the bank operates in a State whose Landesbank required public assistance.
We indeed find that our main result still obtains after controlling for this concurrent shock.
In columns (3) and (4), we account for two alternative bank-level shocks that may affect their
propensity to hold sub-sovereign debt beyond the loss of political proximity. In particular, we
include an interaction of the government-owned dummy and a variable capturing the bank’s reg-
ulatory capital (column (3)) and the bank’s share of non-performing loans (column (4)). We find
that such concurrent shocks do not explain away the propensity of local savings banks to load up
on State debt after the loss of political connections.
Finally, in column (5), we find that local government-owned banks are more likely to purchase
home-State debt if it is rated better. This result directly rejects the asset-substitution hypothe-
sis whereby banks strive to acquire a riskier portfolio (e.g., Gennaioli, Erce, Martin, and Rossi,
2014a). Crucially, the effect which captures the mechanism related to political connections is still
statistically significant in this case, too.
4.4 Control group
Our identification strategy is based on the idea that elections, which give rise to governing coalitions
at the State and at the county level that are dominated by different parties, affect savings banks but
not cooperative banks, rendering cooperatives a proper control group. Our strategy thus allows us
to compare a savings bank to a cooperative bank in the same locality by including County×Quarter
fixed effects. These are crucial as they control for unobservable time-varying county-specific factors
that can impact all banks active in a particular county, such as investment opportunities. However,
ECB Working Paper Series No 2146 / April 2018 25

concerns that cooperative banks are not a valid control group for government-owned savings banks
may continue to linger on. We have so far argued that they are a valid control group because, un-
like private banks, and similar to savings banks, cooperatives are driven by non-profit-maximizing
motives, yet their governance structure distances them from local and State political consider-
ations. However, they could in theory have objectives unobservable to the econometrician that
could introduce a political motive for them to adjust their securities portfolios.16
We address this concern parametrically by excluding, in Table 8, cooperative banks from the
sample. We thus modify Model (1) to simply compare the behavior of local savings banks at
the same point in time across aligned and misaligned localities. Because there is typically one
savings bank per county, we can no longer include County×Quarter fixed effects. However, we can
include State×Quarter fixed effects and compare savings banks in misaligned localities to savings
banks in aligned localities, within the same State. The point estimate from this test declines as
we progressively add bank controls and various combinations of fixed effects, but it is uniformly
significant at least at the 5% statistical level. This suggests that relative to savings banks in aligned
localities, savings banks in misaligned localities have larger holdings of home-State bond holdings.
In our preferred specification (column (5)), this difference corresponds to about 8% of the sample
mean in home-State holdings. We conclude that differences in home-State bond holdings across
local government-owned banks must indeed be down to the need to build political connections with
the State government in the face of exogenous shocks to such connections brought about by election
results.
Recall that according to Figure 3 plots the difference between government-owned banks and
cooperatives in their holdings of home-State sub-sovereign bonds increases significantly after an
election that causes a county to change its political status from aligned to misaligned. Figure 4
suggests that this is indeed entirely due to the behavior of government-owned banks. While their
holdings of home-State bonds hover around 0.75 during times of political alignment, they jump to
1.15 in the first year, to 1.25 in the second year, and to 1.6 in the third year after an election that
brings about political misalignment.
16For example, some members of the German federal—not State—parliament (Bundestag) serve on supervisoryboards of local cooperatives banks, usually those from their home county. But in contrast to the State laws onsavings banks (Sparkassengesetze) that require in all 16 states that regional politicians serve on boards ex officio,local cooperative banks’ members are free from any legally binding rules whom to appoint as the chair of thissupervisory body.
ECB Working Paper Series No 2146 / April 2018 26

4.5 Contiguous counties
In our main tests so far, we have compared the composition of bank portfolio in misaligned counties
relative to aligned counties. This empirical strategy can produce biased estimates in the presence of
unobservable trends which differ across counties and which affect different banks in different ways.
Economic conditions can be different in some counties at the time of electoral change resulting in
political misalignment: for example, the quality of retail customers that borrow from government-
owned banks in such localities may be deteriorating, making them less willing to extend loans and
more willing to invest in public debt instead. Model (1) allows us to estimate the average effect of
political misalignment net of the impact of individual bank characteristics. However, our results
can still be contaminated by a host of unobservable factors that make the population of an aligned
county a poor control group.
To assuage such concerns, we adopt a version of the empirical strategy used by Card and
Krueger (1994), Holmes (1998), Black (1999), and Huang (2008). We compare individual banks in
adjacent counties across neighboring German states, one of which is politically misaligned while the
other is not. The assumption is that two neighboring counties are really one economic area when
it comes to observable factors such as economic growth and to unobservable factors such as growth
opportunities. Hence, any discernible differences in the portfolio composition between certain types
of banks can be attributed to changes in political alignment in one county but not in the other.
Table 9 reports the estimates from this test. By focusing on neighboring counties across state
borders, we lose about 60% of all observations, but we still have plenty of variation in aligned and
misaligned localities left. We adopt a number of different procedures; in particular, we use all banks
in a county (column (1)), we only compare local savings banks across contiguous counties (column
(2)), and we choose the control group of banks using a Propensity Score Matching procedure as
in Table 7, column (1)). Our main result still obtains even in these considerably more restrictive
specifications, suggesting that we capture a genuine political misalignment effect uncontaminated
by concurrent unobservable adjustments—at the level of the county—in sub-sovereign or banking
market conditions that affect government-owned and private banks differently. In all cases, the nu-
merical impact of political misalignment is around twice as large compared to the main specification
in Table 4, column (6), and uniformly significant at the 1 percent statistical level.
ECB Working Paper Series No 2146 / April 2018 27

4.6 Robustness
4.6.1 Robust dependent variable
The next two sets of robustness tests shall ensure that our results are not driven by a particular
choice of empirical proxies. So far, the dependent variable is the ratio of the book value of the total
stock of sovereign bonds issued by State s and held by bank b in county k to bank b’s total assets
at time t. In Table 10, we re-run regression Model (1) with three alternative empirical gauges of
bank’s total home-State bond holdings. The first proxy looks at the nominal value, rather than
the market value, of bonds issued by the home State.17 The second proxy scales total holdings of
own sub-sovereign bonds by the total securities portfolio, i.e. including stocks and fixed income of
any issuer, instead of by the bank’s total assets. The final proxy scales the bank’s total holdings
of bonds issued by the home State by the bank’s total holdings of fixed income securities, both
corporate as well as government bonds. The motivation is that fixed income and equity portfolios
might be managed separately. The first three columns of Table 10 clearly show that our main
result—that politically misaligned government-owned banks are more likely, relative to similar
cooperative banks, to increase their total holdings of home-State bonds—is not a feature of any
particular strategy for calculating bank-specific exposure to sub-sovereign bonds.
In column (4), we specify loans to government entities scaled by total assets as a dependent
variable. The coefficient on the interaction variable Misaligned × Government − owned is again
positive and significant at the 1 percent statistical level. Note that the available data does not
distinguish between lending to the home State government, lending to other German State govern-
ments, lending to the federal government, and lending to foreign governments. But it is plausible
that government lending by small local savings banks will be predominantly to the bank’s home-
State government.18 Within the confines of this assumption, this test provides additional evidence
that local government-owned banks try to make up for the loss of political connections by increasing
their funding of those government authorities that can plausibly return the favor in the future.
Finally, in columns (5) and (6), we demonstrate that our results are robust to using growth
rates instead of levels to define home State bond holdings and government lending, respectively.
17Appendix Table 4 shows that the differences between the market value according to German accounting rulesand the nominal value of State bonds is negligible across savings and cooperative banks.
18Related, Gao, Ru, and Tang (2016) show that Chinese government-owned banks tend to lend to local governments.
ECB Working Paper Series No 2146 / April 2018 28
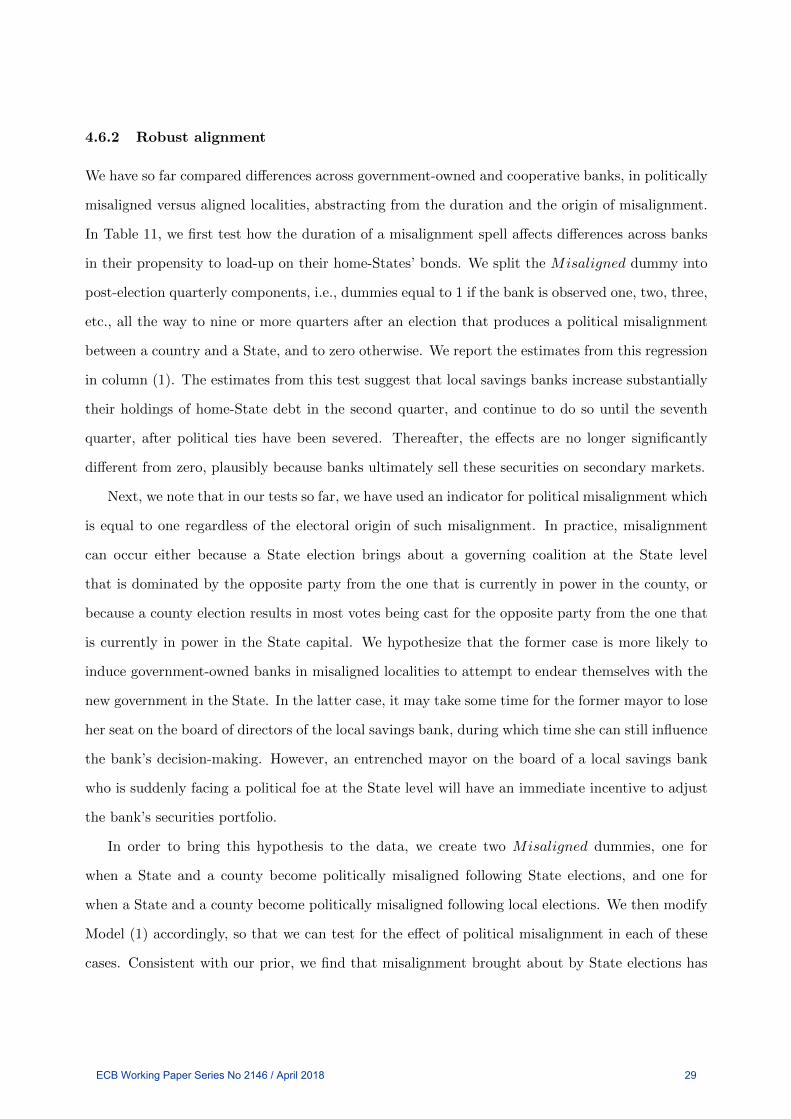
4.6.2 Robust alignment
We have so far compared differences across government-owned and cooperative banks, in politically
misaligned versus aligned localities, abstracting from the duration and the origin of misalignment.
In Table 11, we first test how the duration of a misalignment spell affects differences across banks
in their propensity to load-up on their home-States’ bonds. We split the Misaligned dummy into
post-election quarterly components, i.e., dummies equal to 1 if the bank is observed one, two, three,
etc., all the way to nine or more quarters after an election that produces a political misalignment
between a country and a State, and to zero otherwise. We report the estimates from this regression
in column (1). The estimates from this test suggest that local savings banks increase substantially
their holdings of home-State debt in the second quarter, and continue to do so until the seventh
quarter, after political ties have been severed. Thereafter, the effects are no longer significantly
different from zero, plausibly because banks ultimately sell these securities on secondary markets.
Next, we note that in our tests so far, we have used an indicator for political misalignment which
is equal to one regardless of the electoral origin of such misalignment. In practice, misalignment
can occur either because a State election brings about a governing coalition at the State level
that is dominated by the opposite party from the one that is currently in power in the county, or
because a county election results in most votes being cast for the opposite party from the one that
is currently in power in the State capital. We hypothesize that the former case is more likely to
induce government-owned banks in misaligned localities to attempt to endear themselves with the
new government in the State. In the latter case, it may take some time for the former mayor to lose
her seat on the board of directors of the local savings bank, during which time she can still influence
the bank’s decision-making. However, an entrenched mayor on the board of a local savings bank
who is suddenly facing a political foe at the State level will have an immediate incentive to adjust
the bank’s securities portfolio.
In order to bring this hypothesis to the data, we create two Misaligned dummies, one for
when a State and a county become politically misaligned following State elections, and one for
when a State and a county become politically misaligned following local elections. We then modify
Model (1) accordingly, so that we can test for the effect of political misalignment in each of these
cases. Consistent with our prior, we find that misalignment brought about by State elections has
ECB Working Paper Series No 2146 / April 2018 29
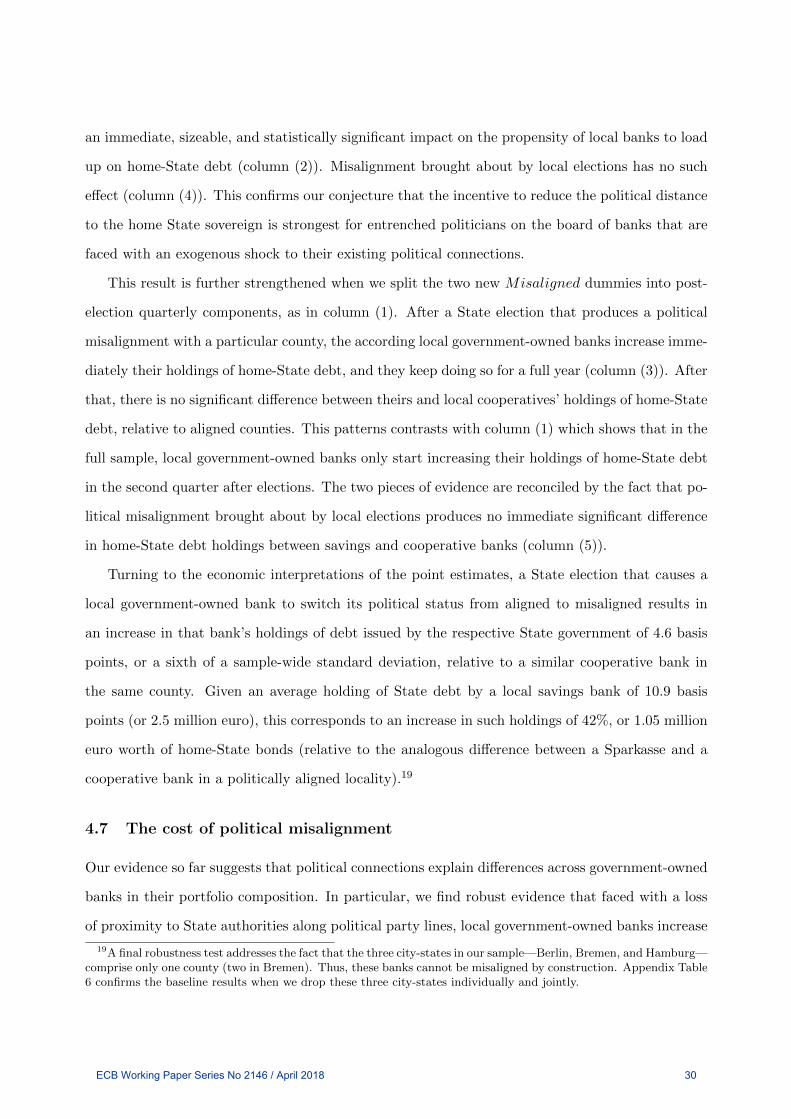
an immediate, sizeable, and statistically significant impact on the propensity of local banks to load
up on home-State debt (column (2)). Misalignment brought about by local elections has no such
effect (column (4)). This confirms our conjecture that the incentive to reduce the political distance
to the home State sovereign is strongest for entrenched politicians on the board of banks that are
faced with an exogenous shock to their existing political connections.
This result is further strengthened when we split the two new Misaligned dummies into post-
election quarterly components, as in column (1). After a State election that produces a political
misalignment with a particular county, the according local government-owned banks increase imme-
diately their holdings of home-State debt, and they keep doing so for a full year (column (3)). After
that, there is no significant difference between theirs and local cooperatives’ holdings of home-State
debt, relative to aligned counties. This patterns contrasts with column (1) which shows that in the
full sample, local government-owned banks only start increasing their holdings of home-State debt
in the second quarter after elections. The two pieces of evidence are reconciled by the fact that po-
litical misalignment brought about by local elections produces no immediate significant difference
in home-State debt holdings between savings and cooperative banks (column (5)).
Turning to the economic interpretations of the point estimates, a State election that causes a
local government-owned bank to switch its political status from aligned to misaligned results in
an increase in that bank’s holdings of debt issued by the respective State government of 4.6 basis
points, or a sixth of a sample-wide standard deviation, relative to a similar cooperative bank in
the same county. Given an average holding of State debt by a local savings bank of 10.9 basis
points (or 2.5 million euro), this corresponds to an increase in such holdings of 42%, or 1.05 million
euro worth of home-State bonds (relative to the analogous difference between a Sparkasse and a
cooperative bank in a politically aligned locality).19
4.7 The cost of political misalignment
Our evidence so far suggests that political connections explain differences across government-owned
banks in their portfolio composition. In particular, we find robust evidence that faced with a loss
of proximity to State authorities along political party lines, local government-owned banks increase
19A final robustness test addresses the fact that the three city-states in our sample—Berlin, Bremen, and Hamburg—comprise only one county (two in Bremen). Thus, these banks cannot be misaligned by construction. Appendix Table6 confirms the baseline results when we drop these three city-states individually and jointly.
ECB Working Paper Series No 2146 / April 2018 30

their holdings of home-State sub-sovereign bonds.
The novel fact we uncover raises the question, what are the costs to local German savings banks
of losing their political connections with the State government? One potential benefit of being a
connected firm (bank) suggested by prior research is access to bailout funds in times of distress
(Faccio, Masulis, and McConnell, 2006). In fact, Bian, Haselmann, Kick, and Vig (2013) study
incidences of local bank bailouts in Germany with public funds and through insurance schemes. In
the vein of their study, we exploit the institutional arrangement of the bailout insurance scheme in
the savings bank sector in Germany as well, since it suggest that this mechanism could be at work
in our setting, too. Individual savings banks in a German State are connected through regional
savings bank associations that operate safety nets at the State level. These associations operate
guarantee funds where member banks in the association provide support if another member bank is
in distress. The bodies that govern regional savings bank associations include representatives from
the individual banks, in particular the local politician serving as the chair of the supervisory board
of member banks. In addition, the president of the association constitutes another important body
in the decision making according to the statutes of regional savings associations. This position is
often politically appointed according to observers (see, e.g., Schieritz and Storn, 2012) and anecdotal
evidence (see, for example, the Rheinischer Sparkassen- und Giroverband). Given the proximity
of State and county politicians within these regional associations, we consider it possible—if not
plausible—that the terms of bailout decisions of individual savings banks are affected.
This institutional arrangement leads us to hypothesize that local government-owned banks
in aligned counties are more likely to receive benevolent bailout conditions compared to similar
government-owned banks in misaligned counties, because in politically aligned counties, the gov-
ernments at the State level and at the county level are dominated by the same party. The State
government should have no political interest to influence decision makers at the regional associa-
tion deciding on the bailout terms towards more generous support in the case of distressed local
savings banks with politicians on their boards that are from a different party. Note that we remain
agnostic as to how such an exchange of arguments concerning business affairs at savings banks
between State and local politicians in the association occurs. This can happen either discretely
through obviously unobservable party and other informal connections or it can sometimes turn out
to be rather outspoken. An example for the latter case is the revokement of the annual report
ECB Working Paper Series No 2146 / April 2018 31

of Stadtsparkasse Dusseldorf for 2014 by the legal supervisor, the State Ministry of Finance in
North-Rhine Westphalia two years later in reaction to a veto by an aligned local party politician
who disagreed with the majority of the supervisory board that initially approved the annual report.
The according press release of the Ministry of Finance (2016) is illuminating as it explicitly confirms
that this ultima ratio decision to revoke the financial statement was preceded by—very sensible—
attempts to reach consensus amongst the management of the bank, supportive supervisory board
members, the dissenting local owner represented by the mayor, but also further stakeholders. We
can only speculate that this last group also involved representatives from the regional savings bank
association, but it does not seem entirely far-fetched given the mandate of the association to guard
the interests of its members.
We limit ourselves here, however, to an empirical test of the hypothesis that significant dif-
ferences in received bailout terms between aligned and misaligned savings banks existed. To this
end, we acquire data on actual bailout disbursements for the entire German banking system over
the sample period 2005–2013. These data are obtained from microprudential supervisory reports,
which feature for each bank—cooperative and savings—the amount of support received from their
respective safety nets, either in terms of outright equity support or in the form of warrants.20 Based
on these information, we create a variable equal to the bailout amount—relative to total assets—in
the quarter in which a bank receives a bailout injection.21 This cross-sectional test relies on a
total of 131 of individual episodes during which a bank received a bailout injection. In our sample,
most capital support observations pertain to cooperative banks, namely 90%. We then relate this
variable to the ownership structure of the bank and to the political alignment between the State
government and the local government.
We report the estimates from this test in Table 12. We run several models, with different
combinations of bank controls, state fixed effects, and time fixed effects. These fixed effects account
for the fact that the generosity of bailout terms may vary across states and/or over time. In all
specifications, we neither find a significant direct effect of misalignment or ownership as such. But
within the group of government-owned banks, the interaction term indicates that savings banks
20These are stock data and thus might also represent historically received support that has not been repaid tothe insurance schemes yet. Our results are robust to the exclusion of the seven savings banks that received capitalsupport prior to our first sample period and thus “inherited” a bailout.
21Bank distress is non-trivial among German banks. Dam and Koetter (2012) report that in each year during the1995–2006 period, 8% of all German banks were in distress. See also Kick, Koetter, and Poghosyan (2016).
ECB Working Paper Series No 2146 / April 2018 32

in misaligned localities receive substantially lower bailout funds, relative to their risk-weighted
assets, than similar savings banks in aligned localities. Numerically, our preferred specification
with quarterly and annual bank controls and with State×Quarter fixed effects (column (5)) suggests
that the difference between the average bailout funds (relative to risk-weighted assets) received by
politically aligned government-owned banks and those received by misaligned government-owned
banks is equal to three-quarters of the interquartile range. The data thus supports the conjecture
that political distance is costly to local government-owned banks in the sense of reduced insurance-
scheme support in times of distress. Of course, this result does not rule out other possibilities which
we cannot test for lack of suitable data, such as laxer supervision of politically connected banks
(Horvitz and Ward, 1987), or career transition by connected politicians between the public and the
private sector (Luca, Seru, and Trebbi, 2014).
4.8 Discussion
The second question that our novel result raises is, how does increasing their holdings of home-State
bonds compensate for the loss of political connections along party lines? We already argued that
our results are unlikely to be driven by the kind of tit-for-tat that is usually associated with ”moral
suasion”, i.e., banks purchasing distressed sovereign debt when no other investors are willing to
do it, in exchange for future political favors (Romans, 1966; Horvitz and Ward, 1987; Ongena,
Popov, and van Horen, 2016). For one, all German states were very highly rated during our sample
period. It is not necessary for governments to press credit institutions to acquire public bonds when
demand for these bonds is robust. Second, even if they had to exert pressure on banks to purchase
State bonds, State governments would find it easier to pressure ”their” banks, i.e., banks to whom
they are connected along party lines.
Another possibility is related to the peculiar mechanics of State debt placement in Germany:
unlike Bunds, State bonds are typically placed privately rather than by means of a public auction.
Indeed, we have inquired with the fiscal authorities in the individual German States and they have
confirmed to us that a private placement is their preferred arrangement. In practice this means
that the State finance ministry and a financial institution agree on the amount and the price of
a debt placement in private, without making the terms of the transaction publicly known. Given
this arrangement, the first possibility is that such private placements involve advantageous terms,
ECB Working Paper Series No 2146 / April 2018 33

e.g., below-market prices are agreed. This is tantamount to the provision of cheap funding to
the State government, and it is fully within the confines of standard capital requirements which
treat sub-sovereign bonds—unlike loans to the State government—as zero-risk-weighted assets.
However, the amounts involved are very small: the difference in home-State bond holdings between
a misaligned and a similar aligned bank is between 400,000 and 1 million euro, depending on the
specification. This makes it unlikely that the State government extracts sufficient financial gain
from this transaction for it to constitute a political favor that needs to be returned in the future.
In combination with the top ratings of the German States throughout our sample period, these
small amounts also make it unlikely that banks are coordinating on acquiring sub-sovereign debt
in order to increase their bargaining position in case the State is close to default, as in Farhi and
Tirole (2012).
Alternatively, such operations may simply buy banks ”face time” with the right politicians,
making them akin to lobbying. Research has recently concluded that the main added value of lob-
byists is their access to individual politicians, rather than their expertise in the legislative process
(Bertrand, Bombardini, and Trebbi, 2014), suggesting that front-row access to politicians is crucial
to private businesses. While gaining access to State politicians is automatic if they are from the
same party, doing so can be difficult if they are not. This is especially true in a country like Ger-
many where the two main alternative channels—political lobbying and private contributions—are
severely limited in scope. At the same time, evidence abounds of the benefits to private businesses
in Germany—in terms of access and rent-seeking—of personal connections through various associ-
ations (e.g., Haselmann, Schoenherr, and Vig, 2017). Therefore, the contacts established during a
legal financial operation which requires the presence of both the State politician and the banker—
such as purchasing State bonds in a private placement—may provide politically disconnected banks
with exactly the kind of access to politicians that they need.
Given the evidence in the previous section, one material benefit from such access to State
politicians could be more generous resolution in case of distress. Another could be laxer supervision
of banks that have established personal connections with State authorities. Both mechanisms would
be consistent with standard theories of regulatory capture (Stigler, 1971; Peltzman, 1976). Under
this view, any favorable treatment of banks with working access to politicians would be a response
by regulators to the rent-seeking pressures and political influence of banks. However, because of the
ECB Working Paper Series No 2146 / April 2018 34

small number of bailed out banks in our sample that hold home-State bonds (e.g., only 3 savings
banks, out of 13 that received a bailout, hold home-State bonds), we cannot properly test the
hypothesis that misaligned government-owned banks that have bought home-State bonds receive
more generous bailout terms. We are therefore forced to hypothesize that any potential future
benefits in terms of bailout treatment, stemming from the efforts of the banks in our sample, are
yet to materialize.
5 Conclusion
Political connections are valuable because they can buy firms preferential treatment, both in good
times and in times of distress. Political relationships are particularly valuable to banks, and they
devote substantial resources to acquiring political access; for example, the U.S. financial sector
spends almost $500 million per year on lobbying elected officials, second only to the health industry
(Lambert, 2015). Using a security-level dataset for around 1,700 German banks between 2005 and
2013, we investigate how government-owned banks’ securities portfolios adjust in response to the
loss of political connections. We exploit changes in the composition of governing coalitions at the
State and at the county level resulting from staggered elections in 16 States and 438 counties.
Because local elected officials sit on the supervisory boards of local government-owned banks, we
define politically connected banks as local government-owned banks in a county where the governing
coalition is dominated by the same party that dominates the State government.
We show a robust new fact: following an election that leads to the loss of their political connec-
tions, local government-owned banks in Germany increase strongly and significantly their holdings
of sub-sovereign bonds issued by their home-State government. This effect is particularly strong
after the emergence of political misalignment due to elections at the State level, a pattern con-
sistent with existing local politicians’ trying to establish connections with a new, but politically
distant State government authority. Cooperative banks (the comparison group) engage in no such
behavior after elections that produce political misalignment, which is consistent with the absence
of local politicians from their governance and management structure. Moreover, the same election
event does not lead the same government-owned banks to adjust their holdings of any other broad
class of securities, such as German federal bonds, bonds issued by other German States, or traded
ECB Working Paper Series No 2146 / April 2018 35

stocks. Our paper is the first to document a link between the electoral cycle and the home bias in
banks’ securities portfolios.
While we cannot (and do not) document the explicit workings of such bridging of political
distance, there are several hypotheses for why this mechanism is effective. For one, sub-sovereign
debt in Germany is typically placed privately, therefore, neither quantities nor prices are publicly
observed. It is possible that in such private placements, and as a political favor, banks offer
to purchase bonds at better-than-market prices. Yet given the small amounts involved in the
transactions analyzed in this paper, a second possibility seems more likely. The documented bond-
purchasing operations may simply initiate a repeated interaction between local politicians and State
politicians who otherwise do not meet along party lines, which makes them akin to the ”face time”
or ”front-row access” that lobbying buys.
The robust empirical regularity that we have uncovered can be worrisome to policy makers for
at least two reason. For one, higher balance sheet exposures to the sovereign can exacerbate the
bank-sovereign loop in times of heightened sovereign stress (e.g., Uhlig, 2013; Acharya, Drechsler,
and Schnabl, 2014; Broner, Erce, Martin, and Ventura, 2014; Cooper and Nikolov, 2014; Farhi
and Tirole, 2014), an argument that easily extends to sub-sovereign entities. Second, the literature
has demonstrated that investing in public debt can crowd out private investment (e.g., Becker and
Ivashina, 2014; Gennaioli, Martin, and Rossi, 2014b; Popov and van Horen, 2015). Investigating
if the propensity of politically misaligned banks to increase their holdings of home-State debt is
associated with lower local lending is beyond the scope of this paper, but it does present itself as
a fruitful avenue for future research.
ECB Working Paper Series No 2146 / April 2018 36

References
[1] Acharya, V., Drechsler, I., and P. Schnabl, 2014. A Pyrrhic victory? Bank bailouts and
sovereign credit risk. Journal of Finance 69, 2689–2739.
[2] Acharya, V., Eisert, T., Eufinger, C., and C. Hirsch, 2014. Real effects of the sovereign debt
crisis in Europe: Evidence from syndicated loans. NYU mimeo.
[3] Acharya, V., and R. Rajan, 2013. Sovereign debt, government myopia, and the financial sector.
Review of Financial Studies 26, 1526–1560.
[4] Acharya, V., and S. Steffen, 2015. The “greatest” carry trade ever? Understanding Eurozone
bank risks. Journal of Financial Economics 115, 215–236.
[5] Agarwal, S., Amromin, G., Ben-David, I., and S. Dinc, 2012. The legislative process and
foreclosures. Federal Reserve Bank of Chicago mimeo.
[6] Agrawal, A., and C. Knoeber, 2001. Do some outside directors play a political role? Journal
of Law and Economics 44, 179–198.
[7] Amann, M., Baltzer, M., Schrape, M. (2012). Microdatabase: Securities Holdings Statistics
A flexible multi-dimensional approach for providing user-targeted securities investments data.
Deutsche Bundesbank. Technical Documentation. Frankfurt am Main.
[8] Becker, B., and V. Ivashina, 2014. Financial repression in the European sovereign debt crisis.
Harvard Business School mimeo.
[9] Bertrand, M., Bombardini, M., and F. Trebbi, 2014. Is it whom you know or what you know?
An empirical assessment of the lobbying process. American Economic Review 104, 3885–3920.
[10] Bian, B., Haselmann, R., Kick, T., and V. Vig, 2013. The political economy of bank bailouts.
Unpublished discussion paper.
[11] Black, S., 1999. Do better schools matter? Parental valuation of elementary education. Quar-
terly Journal of Economics 114, 577–599.
ECB Working Paper Series No 2146 / April 2018 37

[12] Braun, M., and C. Raddatz, 2010. Banking on politics: When former high-ranking politicians
become bank directors. World Bank Economic Review 24, 234–279.
[13] Broner, F., Erce, A., Martin, A., and J. Ventura, 2014. Sovereign debt markets in turbulent
times: Creditor discrimination and crowding-out effects. Journal of Monetary Economics 61,
114–142.
[14] Brown, C., and S. Dinc, 2005. The politics of bank failures: Evidence from emerging markets.
Quarterly Journal of Economics 120, 1413–1444.
[15] Buch, C., Koetter, M., and J. Ohls, 2016. Banks and sovereign risk: A granular view. Journal
of Financial Stability 25, 1–15.
[16] Butler, A., 2008. Distance still matters: evidence from municipal bond underwriting. Review
of Financial Studies 21, 763–784
[17] Card, D., and A. Krueger, 1994. Minimum wages and employment: A case study of the fast-
food industry in New Jersey and Pennsylvania. American Economic Review 84, 772–793.
[18] Carvalho, D., 2014. The real effects of government-owned banks: Evidence from an emerging
market. Journal of Finance 69, 577–609.
[19] Chan, K., Covrig, V., and L. Ng, 2005. What determines the domestic bias and foreign bias?
Evidence from mutual fund equity allocations worldwide. Journal of Finance 60, 1495–1534
[20] Cingano, F., and P. Pinotti, 2013. Politicians at work: The private returns and social costs of
political connections. Journal of the European Economic Association 11, 433–465.
[21] Claessens, S., Feijen, E., and L. Laeven, 2008. Political connections and preferential access to
finance: The role of campaign contributions. Journal of Financial Economics 88, 554–580.
[22] Cooper, R., and K. Nikolov, 2013. Government debt and banking fragility: The spreading of
strategic uncertainty. NBER Working Paper 19278.
[23] Coval, J., and T. Moskowitz, 1999. Home bias at home: local equity preference in domestic
portfolios. Journal of Finance 54, 2045–2073.
ECB Working Paper Series No 2146 / April 2018 38

[24] Coval, J., and T. Moskowitz, 2001. The geography of investment: informed trading and asset
prices. Journal of Political Economy 109, 811–841.
[25] Cull, R., and L. Xu, 2005. Institutions, ownership and finance: The determinants of profit
reinvestment among Chinese firms. Journal of Financial Economics 77, 117–146.
[26] Dam, L., and M. Koetter, 2012. Bank bailouts and moral hazard: Evidence from Germany.
Review of Financial Studies 25, 2343–2380.
[27] Dinc, S., 2005. Politicians and banks: Political influences on government-owned banks in
emerging markets. Journal of Financial Economics 77, 453–479.
[28] De Haas, R., and N. van Horen, 2013. Running for the exit? International bank lending during
a financial crisis. Review of Financial Studies 26, 244–285.
[29] De Marco, F., 2014. Bank lending and the European sovereign debt crisis. University of Bocconi
mimeo.
[30] Drechsler, I., Drechsel, T., Marques-Ibanez, D., and P. Schnabl, 2015. Who borrows from the
Lender of Last Resort? Journal of Finance 71, 1933–1974.
[31] Duchin, R., and D. Sosyura, 2012. The politics of government investment. Journal of Financial
Economics 106, 24–48
[32] Englmaier, F., and T. Stowasser, 2017. Electoral cycles in savings bank lending. Journal of the
European Economic Association 15, 296–354.
[33] Faccio, M., 2006. Politically connected firms. American Economic Review 96, 369–386.
[34] Faccio, M., Masulis, R., and J. McConnell, 2006. Political connections and corporate bail-outs.
Journal of Finance 61, 2597–2635.
[35] Farhi, E., and J. Tirole, 2012. Collective moral hazard, maturity mismatch, and systemic
bailouts. American Economic Review 102, 60–93.
[36] Farhi, E., and J. Tirole, 2014. Deadly embrace: Sovereign and financial balance sheet doom
loops. Harvard University mimeo.
ECB Working Paper Series No 2146 / April 2018 39

[37] Gao, H., Ru, H., and D. Tang, 2016. Subnational debt of China: The politics-finance nexus.
NYU mimeo.
[38] GCEA, 2014. Annual Report 2013/14: Against a backward-looking economic policy: Germany
on its way into a European Banking Union. German Council of Economic Advisors, Wiesbaden,
208–247.
[39] Gennaioli, N., Martin, A., and S. Rossi, 2014a. Sovereign default, domestic banks, and financial
institutions. Journal of Finance 69, 819–866.
[40] Gennaioli, N., Martin, A., and S. Rossi, 2014b. Banks, government bonds, and defaults. What
do the data say? Bocconi University mimeo.
[41] Giannetti, M., and L. Laeven, 2012. The flight home effect: Evidence from the syndicated loan
market during financial crises. Journal of Financial Economics 104, 23–43.
[42] Haselmann, R., Schoenherr, D., and V. Vig, 2017. Rent-seeking in elite networks. Journal of
Political Economy, forthcoming.
[43] Holmes, T., 1998. The effect of state policies on the location of manufacturing: Evidence from
state borders. Journal of Political Economy 106, 667–705.
[44] Horvath, B., Huizinga, H. and V. Ioannidou, 2015. Determinants and valuation effects of the
home bias in European banks’ sovereign debt portfolios. Tilburg University mimeo.
[45] Horvitz, P., and R. Ward, 1987. Monetary Policy and the Financial System. Prentice Hall:
Englewoods Cliffs, NJ.
[46] Huang, R., 2008. The real effect of bank branching deregulation: Comparing contiguous coun-
ties across US state borders. Journal of Financial Economics 87, 678–705.
[47] Imai, M., 2009. Political influence and declarations of bank insolvency in Japan. Journal of
Money, Credit and Banking 41, 131–158.
[48] Johnson, S., and T. Mitton, 2003. Cronyism and capital controls: Evidence from Malaysia.
Journal of Financial Economics 67, 351–382.
ECB Working Paper Series No 2146 / April 2018 40

[49] Kang, J.-K., and R. Stulz, 1997. Why is there a home bias? An analysis of foreign portfolio
ownership in Japan. Journal of Financial Economics 46, 3–28.
[50] Khwaja, A., and A. Mian, 2005. Do lenders favour politically connected firms? Rent provision
in an emerging financial market. Quarterly Journal of Economics 120, 1371–1411.
[51] Kick, T., Koetter, M., and T. Poghosyan, 2016. Bank recapitalization, regulators and repay-
ment? Journal of Money, Credit and Banking 48, 1467–1494.
[52] Kroszner, R., and P. Strahan, 1999. What drives deregulation? Economics and politics of the
relaxation of bank branching restrictions. Quarterly Journal of Economics 114, 1437–1467.
[53] Lambert, T., 2015. Lobbying on regulatory enforcement actions: Evidence from banking.
Rotterdam School of Management working paper.
[54] La Porta, R., Lopes-de-Silanez, R., and A. Shleifer, 2002. Government ownership of banks.
Journal of Finance 57, 256–301.
[55] Leuz, C., and F. Oberholzer-Gee, 2006. Political relationships, global financing and corporate
transparency: Evidence from Indonesia. Journal of Financial Economics 81, 411–439.
[56] Li, H., Meng, L., Wang, Q., and L.-A. Zhou, 2008. Political connections, financing, and firm
performance: Evidence from Chinese private firms. Journal of Development Economics 87,
283–299.
[57] Liu, W.-M., and P. Ngo, 2014. Elections, political competition, and bank failure. Journal of
Financial Economics 112, 251–268.
[58] Luca, D., Seru, A., and F. Trebbi, 2014. The revolving door and worker flows in banking
regulation. Journal of Monetary Economics 65, 17–32.
[59] Mian, A., Sufi, A., and F. Trebbi, 2010. The political economy of the US mortgage default
crisis. American Economic Review 100, 1967–1998.
[60] Micco, A., Panizza, U., and M. Yanez, 2007. Bank ownership and performance: Does politics
matter? Journal of Banking & Finance 31, 219–241.
ECB Working Paper Series No 2146 / April 2018 41

[61] Ministry of Finance NRW. 2016. Sparkassenaufsicht hebt Jahresabschluss 2014
der Stadtsparkasse Dusseldorf auf. Press Release 9. Juni 2016. Available at
https://www.finanzverwaltung.nrw.de.
[62] Mussler, H., 2016.Machtkampf um die Sparkasse. Frankfurter Allgemeine Zeitung, 07.06.2016.
[63] Ohls, J., 2017. Moral suasion in regional government bond markets. Deutsche Bundesbank
Discussion Paper, 33.
[64] Ongena, S., Popov, A., and N. van Horen, 2016. The invisible hand of the government: Moral
suasion during the European sovereign debt crisis. CEPR Working Paper 11153.
[65] Peltzman, S., 1976. Towards a more general theory of regulation. Journal of Law and Eco-
nomics 19, 211–240.
[66] Petersen, M., 2009. Estimating standard errors in finance panel data sets: Comparing ap-
proaches. Review of Financial Studies 22, 435–480.
[67] Popov, A., and N. van Horen, 2015. Exporting sovereign stress: Evidence from syndicated
bank lending during the euro area sovereign debt crisis. Review of Finance 19, 1825–1866.
[68] Puri, M., Rocholl, J., and S. Steffen, 2011. Global retail lending in the aftermath of the
US financial crisis: Distinguishing between supply and demand effects. Journal of Financial
Economics 100, 556–578.
[69] Reisener, T., 2012. Kritik an Sparkassen-Politikern. RP Online.
[70] Rocholl, J., Goldman, E., and J. So, 2009. Do politically connected boards affect firm value?
Review of Financial Studies 22, 2331–2360.
[71] Romans, J., 1966. Moral suasion as an instrument of economic policy. American Economic
Review 56, 1220–1226.
[72] Sapienza, P., 2004. The effect of government ownership on bank lending. Journal of Financial
Economics 72, 357–384.
[73] Schieritz, M. and Storn, A., 2012. Lobbyismus: Die schwarze Macht. Die Zeit 22/2012.
ECB Working Paper Series No 2146 / April 2018 42

[74] Schoors, K., and L. Weill, 2015. Politics and banking in Russia: The rise of Putin. Mimeo.
[75] Shen, C.-H., and C.-Y. Lin, 2012. Why government banks underperform? A political interfer-
ence view. Journal of Financial Intermediation 21, 181–202.
[76] Shleifer, A. and R. Vishny, 1994. Politicians and firms. Quarterly Journal of Economics 109,
995–1025.
[77] Stigler, G., 1971. The theory of economic regulation. Bell Journal of Economics 2, 3–21.
[78] Uhlig, H., 2013. Sovereign default risk and banks in a monetary union. NBER Working Paper
19343.
ECB Working Paper Series No 2146 / April 2018 43

Figure 1. Election patterns in Germany between 2005 and 2013, by State
Notes: This figure shows the timing of both State‐levels and county‐level elections. An election year is marked with a “1”. The resulting State‐level coalition is named in the top line for each State. The first acronym indicates the senior partner in the coalition, also represented by the color of the according bar. The bottom bar indicates the party with the most cumulative votes in county elections; within‐State differences across counties are shown in the maps in Figure 2. CDU (Christian Democratic Union of Germany) is a center‐right party. Its sister party is the CSU (Christian Social Union), which is only active in the state of Bavaria. Together, CDU and CSU form one common parliamentary group in the federal parliament. SPD (Social Democratic Party of Germany) is a center‐left party. FDP (Free Democratic Party) is a liberal party. The party Grüne are officially called the Bündnis 90/Die Grünen (Alliance ’90/The Greens) and represent the ecological political party in Germany. Die Linke are the democratic socialist political party in Germany. The state parliament elections in Hesse of 2008 had to be repeated because no coalition could be formed by the leading party, SPD.
ECB Working Paper Series No 2146 / April 2018 44
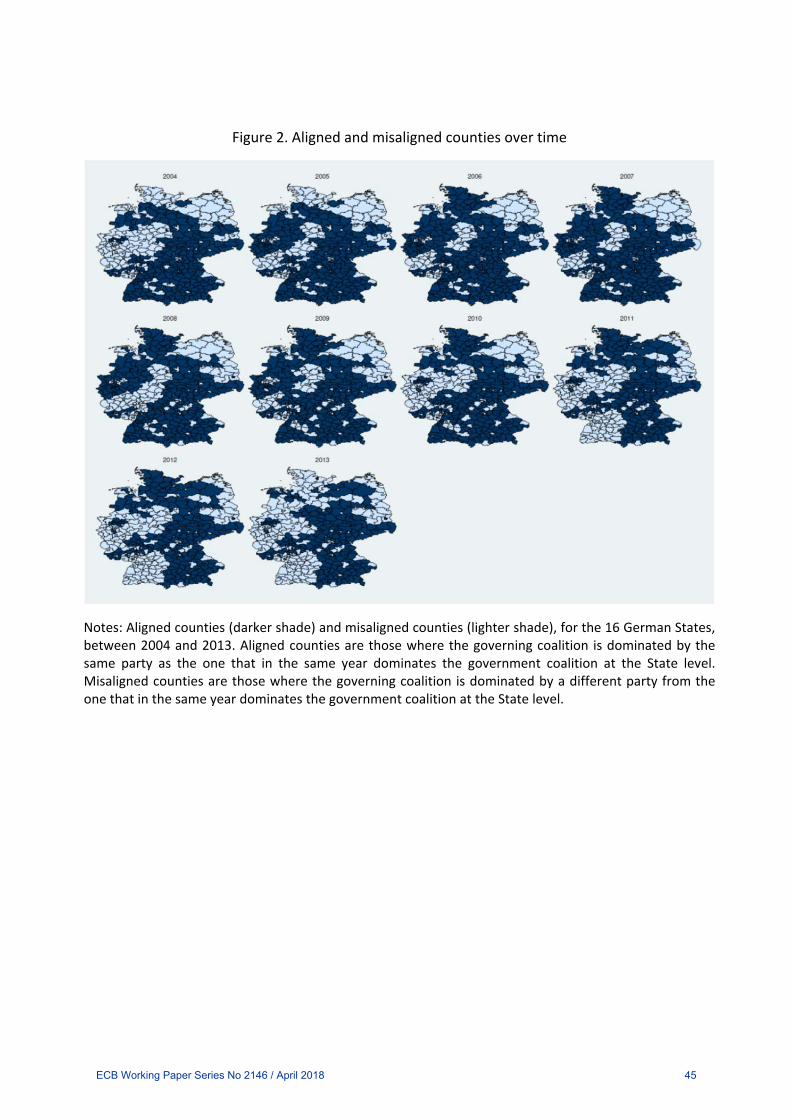
Figure 2. Aligned and misaligned counties over time
Notes: Aligned counties (darker shade) and misaligned counties (lighter shade), for the 16 German States, between 2004 and 2013. Aligned counties are those where the governing coalition is dominated by the same party as the one that in the same year dominates the government coalition at the State level. Misaligned counties are those where the governing coalition is dominated by a different party from the one that in the same year dominates the government coalition at the State level.
ECB Working Paper Series No 2146 / April 2018 45

Figure 3. Difference in average home‐State bond holdings between government‐owned banks and cooperatives, aligned vs. misaligned counties
Figure 4. Average home‐State bond holdings by government‐owned banks, aligned vs. misaligned counties
0.5
11
.5
-10 -5 0 5 10Quarters around election
Aligned difference Misaligned difference
.51
1.5
22.
5
-10 -5 0 5 10Quarters around election
ECB Working Paper Series No 2146 / April 2018 46

Table 1. M
isaligned
counties share
State
# coun
ties
2005
20
06
2007
20
08
2009
20
10
2011
20
12
2013
Baden
‐Württemberg
44
20
20
20
20
32
32
100
100
100
Bayern
96
10
10
10
19
19
19
19
19
19
Berlin
1
0
0
0
0
0
0
0
0
0
Branden
burg
18
83
83
83
83
83
83
83
83
83
Bremen
2
0
0
0
0
0
0
0
0
0
Ham
burg
1
0
0
0
0
0
0
0
0
0
Hessen
26
58
38
38
100
38
38
46
46
46
Mecklen
burg‐Vorpommern
18
94
94
94
94
94
94
44
44
44
Niedersachsen
46
50
52
52
52
52
52
54
54
46
Nordrhein‐W
estfalen
53
19
19
19
19
28
72
72
72
72
Rheinland‐Pfalz
36
89
89
89
89
72
72
72
72
72
Saarland
6
17
17
17
17
17
17
17
17
17
Sachsen
29
14
14
14
7
3
3
3
3
3
Sachsen‐Anhalt
24
8
8
8
8
4
4
4
4
4
Schlesw
ig‐Holstein
15
100
0
0
20
20
20
20
20
87
Thüringen
23
13
13
13
13
17
17
17
17
17
Notes: This table shows the share, in percentage points, of misaligned
counties relative to all counties per State and per year, between 2004 and
2013. The second column provides the total number all counties per State. A
n accompanying summary of misaligned
banks relative to all banks per
State and over time is shown in
Appen
dix Table 7.
ECB Working Paper Series No 2146 / April 2018 47

Table 2. Cooperatives and government‐owned banks: Aligned vs. misaligned localities
Government‐owned banks Cooperatives
Year Aligned Misaligned All Aligned Misaligned All
2005 149 293 442 350 877 1,227
2006 131 311 442 294 933 1,227
2007 131 310 441 293 932 1,225
2008 158 277 435 369 823 1,192
2009 148 281 429 326 827 1,153
2010 190 237 427 442 692 1,134
2011 229 195 424 590 525 1,115
2012 227 193 420 580 518 1,098
2013 227 188 415 608 466 1,074
Note: The table shows the number of banks per year separated according to ownership (Cooperatives vs. Government‐owned) and to political alignment between the strongest party emerging from elections at the county level and the leading coalition party in the government in the respective State. Government‐owned banks are regional savings banks. We exclude head institutions (“Landesbanken”). Cooperatives comprise regional cooperative banks as the control group. The sample is based on quarterly data between q4:2005 and q4:2013.
ECB Working Paper Series No 2146 / April 2018 48

Table 3. Summary statistics
Governm
ent‐ow
ned ba
nks
Coop
eratives
Differen
ce in
means
Mean
SD
Mean
SD
Delta
p‐value
Dep
ende
nt variables and
treatm
ent
38,102 observations
14,563 observations
State bonds / To
tal assets
0.109
0.265
0.062
0.263
0.046
0.000
Federal bonds / To
tal assets
0.170
0.338
0.130
0.569
0.039
0.000
Other State bonds / To
tal assets
0.308
0.415
0.227
0.480
0.081
0.000
Stocks / To
tal assets
1.632
3.274
0.479
2.323
1.153
0.000
State bonds / To
tal assets (Nominal value)
0.107
0.260
0.061
0.255
0.046
0.000
State bonds / To
tal portfolio
0.448
1.179
0.265
1.100
0.183
0.000
State bonds / Bond portfolio
0.634
1.708
0.312
1.262
0.322
0.000
Government lending / To
tal assets
3.764
3.621
0.623
1.300
3.142
0.000
Bailout am
ount / Risk‐weighted assets
2.599
4.453
5.091
8.613
‐2.492
0.000
Misaligned
0.417
0.493
0.377
0.485
0.040
0.000
Qua
rterly ban
k‐level con
trols
Log (Total assets)
14.249
0.932
12.545
1.140
1.704
0.000
Share of stocks of total assets
6.563
5.773
3.240
5.329
3.323
0.000
Share of cash of total assets
1.840
0.722
1.971
0.787
‐0.131
0.000
Share of corporate loans in total len
ding
21.145
7.215
13.321
9.463
7.824
0.000
Share of household lending in total lending
70.560
9.318
84.470
11.568
‐13.910
0.000
Share of lending to foreigners
0.786
0.859
0.434
1.380
0.351
0.000
Annu
al ban
k‐level con
trols
Tier 1 capital ratio
11.157
3.767
11.016
3.656
0.141
0.000
Cost‐income ratio
66.987
8.397
71.397
21.497
‐4.409
0.000
Share of fee income
20.712
3.062
20.806
6.082
‐0.095
0.077
Return on equity
18.530
6.738
15.653
9.034
2.878
0.000
Short‐term assets / short‐term liabilities
2.766
1.147
2.531
1.151
0.235
0.000
Share of non‐perform
ing loans
4.610
2.744
4.674
3.485
‐0.064
0.049
ECB Working Paper Series No 2146 / April 2018 49

Note: The table shows summary statistics of the main and alternative dep
endent variables, as well as annual and quarterly covariates for
governmen
t‐owned
banks and for local cooperative banks, respectively. Governmen
t‐owned
banks are regional savings banks. Cooperatives
comprise regional cooperative banks. The sample is based
on quarterly data between q4:2005 and q4:2013. We report the market value of
bonds, unless otherwise specified. R
WA is short for risk‐w
eighted assets. ROE is short of return on equity. NPL is short for non‐perform
ing loans.
All variables are measured in percentage points, unless noted otherwise. The last two columns provide the difference in m
ean and the
corresponding test statistics for significance from zero. For variable definitions and sources, see
Appen
dix Table 1.
ECB Working Paper Series No 2146 / April 2018 50

Table 4. Politics, banks, and portfolio
adjustmen
t: Home‐state bonds
State bo
nds / To
tal assets
(1)
(2)
(3)
(4)
(5)
(6)
Baselin
e Qua
rterly RHS
Annu
al RHS
Bank
and
qu
arter F
E Co
unty X qua
rter FE
Misaligned × Government‐owned
0.0400***
0.0410***
0.0399***
0.0369***
0.0277***
0.0195**
(0.0056)
(0.0056)
(0.0055)
(0.0063)
(0.0078)
(0.0077)
Misaligned
0.0184***
0.0175***
0.0143***
(0.0032)
(0.0032)
(0.0030)
Government‐owned
0.0274***
0.0081**
0.0024
(0.0031)
(0.0041)
(0.0041)
Quarterly control variables
Log (Total assets)
0.0045***
0.0078***
‐0.0294**
‐0.0360*
‐0.0126
(0.0011)
(0.0011)
(0.0137)
(0.0190)
(0.0161)
Share of stocks of total assets
‐0.0010***
‐0.0011***
‐0.0009**
‐0.0022***
‐0.0019***
(0.0002)
(0.0002)
(0.0004)
(0.0006)
(0.0006)
Share of cash of total assets
‐0.0087***
‐0.0053***
0.0004
‐0.0006
‐0.0020
(0.0014)
(0.0015)
(0.0016)
(0.0018)
(0.0018)
Share of corporate loans
‐0.0004*
0.0006**
‐0.0033***
‐0.0028***
‐0.0026***
in total len
ding
(0.0002)
(0.0003)
(0.0007)
(0.0008)
(0.0008)
Share of loans to households
‐0.0013***
‐0.0005*
‐0.0007
‐0.0000
‐0.0002
in total len
ding
(0.0002)
(0.0002)
(0.0006)
(0.0007)
(0.0007)
Share of lending to foreigners
‐0.0032***
‐0.0024***
‐0.0082***
‐0.0149***
‐0.0139***
(0.0005)
(0.0005)
(0.0020)
(0.0030)
(0.0027)
Annual control variables
Tier 1 capital ratio
0.0055***
0.0048***
0.0059***
(0.0010)
(0.0012)
(0.0015)
Cost‐income ratio
0.0003***
0.0000
‐0.0001**
(0.0001)
(0.0001)
(0.0000)
ECB Working Paper Series No 2146 / April 2018 51

Share of fee income
‐0.0012***
0.0015***
0.0026***
(0.0003)
(0.0005)
(0.0006)
Return on equity
0.0016***
0.0011***
0.0017***
(0.0003)
(0.0002)
(0.0002)
Short‐term assets / short‐term
0.0061***
0.0017
0.0032
liabilities
(0.0011)
(0.0019)
(0.0024)
Share of non‐perform
ing loans
‐0.0005
0.0002
‐0.0009
(0.0004)
(0.0004)
(0.0006)
Observations
53,099
52,704
52,288
52,288
52,704
52,288
R‐squared
0.009
0.012
0.023
0.469
0.574
0.596
Quarter FE
No
No
No
Yes
Absorbed
Absorbed
Bank FE
No
No
No
Yes
Yes
Yes
County × Quarter FE
No
No
No
No
Yes
Yes
Notes: This table presents OLS regression results of State bond holdings on bank‐specific variables and on indicators of political connections. The
dep
enden
t variable in all columns is the market value of the bank’s total holdings of bonds issued
by the State where the bank is headquartered,
divided
by the bank’s gross total assets. M
isaligned
is an indicator variable equal to one if the party with the most votes obtained
during the latest
regional elections in the county where the bank is domiciled is different from the leading party in
the coalition form
ing the State governmen
t after
the latest State parliamentary elections. Government‐owned
is an indicator variable equal to one for banks that are ultim
ately owned
by the local
governmen
t, i.e. local savings banks. The sample period is q4:2005 until q3:2013. Standard errors are two‐w
ay clustered at the county and quarter
level. */**/***
denote significance at the 10%/5%/1% levels, respectively. For variable definitions and sources, see
Appen
dix Table 1.
ECB Working Paper Series No 2146 / April 2018 52

Table 5. Politics, banks, and portfolio adjustment: Other securities
Federal bonds Other States’ bonds Stocks (1) (2) (3)
Misaligned × Government‐owned ‐0.0198 ‐0.0223 0.0592
(0.0157) (0.0159) (0.1313)
Observations 52,288 52,288 52,288
R‐squared 0.557 0.561 0.513
Bank FE Yes Yes Yes
County × Quarter FE Yes Yes Yes
Annual controls Yes Yes Yes
Quarterly controls Yes Yes Yes
Notes: This table presents falsification OLS regression results of State bond and other securities holdings on bank‐specific variables and on indicators of political connections. The dependent variable is the market value of the bank’s holdings of federal government debt as a share of total assets (column (1)); the market value of the bank’s holdings of bonds issued by States other than the bank’s home State, as a share of total assets (column (2)); the bank’s holdings of common stock as a share of total assets (column (3)); and the market value of the bank’s total holdings of bonds issued by the State where the bank is headquartered, divided by the bank’s gross total assets (column (4)). Misaligned is an indicator variable equal to one if the party with the most votes obtained during the latest regional elections in the county where the bank is domiciled is different from the leading party in the coalition forming the State government after the latest State parliamentary elections. Government‐owned is an indicator variable equal to one for banks that are ultimately owned by the local government, i.e. local savings banks. The regressions include all control variables from Table 4 (coefficients not reported for brevity). Standard errors are two‐way clustered at the county and quarter level. */**/*** denote significance at the 10%/5%/1% levels, respectively. For variable definitions and sources, see Appendix Table 1.
ECB Working Paper Series No 2146 / April 2018 53

Table 6. Politics, banks, and home‐State bonds: Placebo elections
State bonds / Total assets (1) (2) (3) 1 year lag 2 years lag 3 years lag Misaligned × Government‐owned 0.0277 0.0068 ‐0.1485
(0.0477) (0.0090) (0.1120)
Observations 52,288 52,288 52,288
R‐squared 0.665 0.665 0.665
Bank FE Yes Yes Yes
County × Quarter FE Yes Yes Yes
Annual controls Yes Yes Yes
Quarterly controls Yes Yes Yes
Notes: This table presents falsification regression results of State bond and other securities holdings on bank‐specific variables and on indicators of political connections. The dependent variable in all columns is the bank’s total holdings of bonds issued by the State where the bank is headquartered, divided by the bank’s gross total assets. Column (1) replicates the regression from Table 4, column (6). Columns (1), (2), and (3) shows a specification with state elections and associated outcomes simulated to occur one, two, and three year earlier than the actual date, respectively. Misaligned is an indicator variable equal to one if the party with the most votes obtained during the latest regional elections in the county where the bank is domiciled is different from the leading party in the coalition forming the State government after the latest State parliamentary elections. Government‐owned is an indicator variable equal to one for banks that are ultimately owned by the local government, i.e. local savings banks. The regressions include all control variables from Table 4 (coefficients not reported for brevity). Standard errors are two‐way clustered at the county and quarter level. */**/*** denote significance at the 10%/5%/1% levels, respectively. For variable definitions and sources, see Appendix Table 1.
ECB Working Paper Series No 2146 / April 2018 54

Table 7. Politics, banks, and home‐State bonds: Sam
ple selection and alternative channels
State bo
nds / To
tal assets
(1)
(2)
(3)
(4)
(5)
Prop
ensity sc
ore
matching
2007
‐08
Land
esba
nken
shock
Tier 1 equ
ity
Non
‐perform
ing
loan
s State ratin
gs
Misaligned × Government‐owned
0.0297***
0.0154**
0.0233**
0.0225***
0.0318***
(0.0086)
(0.0079)
(0.0094)
(0.0084)
(0.0106)
Misaligned
Shock
‐0.0082**
0.0237***
0.7550
‐0.0214**
(0.0039)
(0.0043)
(0.000)
(0.0091)
Shock × M
isaligned
0.0159**
‐0.0032
0.1666
0.0751***
(0.0068)
(0.0096)
(0.000)
(0.0194)
Shock × Governmen
t‐owned
0.0119
‐0.0139
0.0529***
(0.0091)
(0.0088)
(0.0127)
Shock × M
isaligned
× Governmen
t‐owned
0.0028
‐0.0107
‐0.0343**
(0.0141)
(0.0176)
(0.0143)
Observations
40,547
52,288
52,288
52,300
52,288
R‐squared
0.636
0.596
0.595
0.577
0.596
Bank FE
Yes
Yes
Yes
Yes
Yes
County × Quarter FE
Yes
Yes
Yes
Yes
Yes
Quarter FE
No
No
No
No
No
Annual controls
Yes
Yes
Yes
Yes
Yes
Quarterly controls
Yes
Yes
Yes
Yes
Yes
Notes: This table presents OLS regression results of State bond holdings on bank‐specific variables and on indicators of political connections.
The depen
dent variable in all columns is the market value of the bank’s total holdings of bonds issued
by the State w
here the bank is
headquartered, divided
by the bank’s gross total assets. Misaligned
is an
indicator variable equal to one if the party w
ith the most votes
obtained
during the latest regional elections in the county w
here the bank is domiciled is different from the leading party in the coalition
form
ing the State governmen
t after the latest State parliamen
tary elections. Government‐owned
is an indicator variable equal to one for banks
ECB Working Paper Series No 2146 / April 2018 55
that are ultim
ately owned
by the local governmen
t, i.e. lo
cal savings banks. In column (1) we show results for a sample based
on a one‐to‐one
propen
sity score m
atching between local savings banks and cooperative banks based
on both quarterly and annual control variables. In
column
(2), we restrict the sample to local governmen
t‐owned
banks only. Shock corresponds to an indicator eq
ual to one if a local savings bank was
tied
to a Landesbank affected
by the fallout of the US subprime mortgage crisis (column (3)); to the bank’s Tier 1 equity (column (4)); to the
bank’s share of non‐perform
ing loans (column (5)); and to the rating—
by Moodys and/or Standard & Poors—of the respective German
State in
which the bank is domiciled (column (6)). Th
e regressions include all control variables from Table 4 (coefficien
ts not reported
for brevity).
Standard errors are two‐w
ay clustered at the county and quarter level. */**/*** denote significance at the 10%/5%/1% levels, respectively.
For variable definitions and sources, see
Appen
dix Table 1.
ECB Working Paper Series No 2146 / April 2018 56

Table 8. Politics, banks, and home‐State bonds: Excluding cooperatives
(1)
(2)
(3)
(4)
(5)
Misaligned
0.0607***
0.0580***
0.0599***
0.0320***
0.0092**
(0.0053)
(0.0053)
(0.0052)
(0.0065)
(0.0050)
Quarterly control variables
Log (Total assets)
‐0.0085***
‐0.0016
‐0.0680***
‐0.0314
(0.0028)
(0.0029)
(0.0218)
(0.0210)
Share of stocks of total assets
‐0.0009**
‐0.0012***
‐0.0032***
‐0.0011
(0.0004)
(0.0005)
(0.0008)
(0.0008)
Share of cash of total assets
‐0.0058**
‐0.0084***
‐0.0026
‐0.0047
(0.0029)
(0.0031)
(0.0032)
(0.0031)
Share of corporate loans in total len
ding
0.0011***
0.0029***
‐0.0031***
0.0012
(0.0004)
(0.0004)
(0.0011)
(0.0012)
Share of loans to households in total lending
0.0008***
0.0027***
0.0021**
0.0041***
(0.0003)
(0.0004)
(0.0009)
(0.0009)
Share of lending to foreigners
0.0020
0.0076***
‐0.0025
‐0.0036
(0.0025)
(0.0026)
(0.0039)
(0.0037)
Annual control variables
Tier 1 capital ratio
0.0045***
0.0022
0.0069***
(0.0011)
(0.0017)
(0.0016)
Cost‐income ratio
0.0034***
0.0053***
0.0050***
(0.0006)
(0.0012)
(0.0013)
Share of fee income
‐0.0038***
0.0047***
0.0011
(0.0009)
(0.0015)
(0.0014)
Return on equity
0.0049***
0.0073***
0.0051***
(0.0007)
(0.0015)
(0.0015)
Short‐term assets / short‐term liabilities
0.0123***
0.0008
0.0002
(0.0025)
(0.0034)
(0.0034)
Share of non‐perform
ing loans
‐0.0037***
0.0025**
‐0.0018
ECB Working Paper Series No 2146 / April 2018 57

(0.0009)
(0.0012)
(0.0015)
Observations
14,316
14,235
14,186
14,186
14,186
R‐squared
0.012
0.014
0.026
0.423
0.455
Bank FE
No
No
No
Yes
Yes
Quarter FE
No
No
No
Yes
Absorbed
State × Quarter FE
No
No
No
No
Yes
Notes: This table presents OLS regression results of State bond holdings on bank‐specific variables and on indicators of political connections. The
dep
enden
t variable in
all columns is the market value of the bank’s total holdings of bonds issued
by the State where the bank is headquartered,
divided
by the bank’s gross total assets. Misaligned
is an
indicator variable equal to one if the party w
ith the m
ost votes obtained
during the
latest regional elections in the county w
here the bank is domiciled is different from the leading party in the coalition form
ing the State
governmen
t after the latest State parliamen
tary elections. The sample period is q4:2005 until q3:2013. Standard errors are two‐w
ay clustered at
the county and quarter level. */**/*** den
ote significance at the 10%/5%/1% levels, respectively. For variable definitions and sources, see
Appen
dix Table 1.
ECB Working Paper Series No 2146 / April 2018 58

Table 9. Politics, banks, and home‐State bonds: Contiguous counties
State bonds / Total assets (1) (2) (3) Excluding Propensity All banks Cooperatives matching Misaligned × Government‐owned 0.0349*** 0.0440***
(0.0098) (0.0109)
Misaligned 0.0350***
(0.0100)
Observations 22,334 6,127 17,383
R‐squared 0.411 0.450 0.489
Quarter FE Yes Yes Yes
Bank FE Yes Yes Yes
Contiguous FE Yes Yes Yes
Annual controls Yes Yes Yes
Quarterly controls Yes Yes Yes
Notes: This table presents OLS regression results of State bond holdings on bank‐specific variables and on indicators of political connections. The regressions are performed on the sub‐sample of banks residing in contiguous counties, i.e., counties that border each other across State borders. The dependent variable in all columns is the market value of the bank’s total holdings of bonds issued by the State where the bank is headquartered, divided by the bank’s gross total assets. Column (1) shows results for all banks residing in contiguous counties. In column (2), we exclude all cooperative banks, and compare local savings banks across contiguous counties across state borders. Column (3) specifies instead the matched sample of savings and cooperative banks. Misaligned is an indicator variable equal to one if the party with the most votes obtained during the latest regional elections in the county where the bank is domiciled is different from the leading party in the coalition forming the State government after the latest State parliamentary elections. Government‐owned is an indicator variable equal to one for banks that are ultimately owned by the local government, i.e. local savings banks. The regressions include all control variables from Table 4 (coefficients not reported for brevity). Standard errors are two‐way clustered at the county and quarter level. */**/*** denote significance at the 10%/5%/1% levels, respectively. For variable definitions and sources, see Appendix Table 1.
ECB Working Paper Series No 2146 / April 2018 59

Table 10. Politics, banks, and home‐State bonds: Robust dep
enden
t variable
State bo
nds / To
tal assets
Gov. len
ding
/
Total assets
Growth State
bond
s / Total
assets
Growth Gov.
lend
ing / To
tal
assets
(1)
(2)
(3)
(4)
(5)
(6)
Nom
inal
Portfolio
All bon
ds
Misaligned × Government‐owned
0.0195**
0.1337***
0.2026***
0.0536***
5.1986*
6.7892*
(0.0076)
(0.0367)
(0.0491)
(0.0153)
(2.7854)
(3.6804)
Observations
52,288
52,288
51,894
52,288
7,392
38,638
R‐squared
0.596
0.623
0.603
0.983
0.728
0.347
Bank FE
Yes
Yes
Yes
Yes
Yes
Yes
County × Quarter FE
Yes
Yes
Yes
Yes
Yes
Yes
Annual controls
Yes
Yes
Yes
Yes
Yes
Yes
Quarterly controls
Yes
Yes
Yes
Yes
Yes
Yes
Notes: This table presents OLS regression results of robust proxies for State bond holdings on bank‐specific variables and on indicators of political
connections. Columns (1)—
(3) of the table show estim
ation results for alternative numeraire choices regarding the dep
enden
t variable, the
bank’s total holdings of bonds issued
by the State where the bank is headquartered, divided
by the bank’s gross total assets. Column (1) shows
result when m
easuring the State debt shares of total assets based
on nominal instead of market values of State bonds. Column (2) uses the share
of State bonds relative to the bank’s securities portfolio. Column (3) shows results for the share of own State bonds relative to the fixed
‐income
securities portfolio
of the bank only. Column (4) shows the results for loans to the governmen
t as a share of total assets. Column (5) shows the
results for quarter‐on‐quarter growth in
the bank’s total h
oldings of bonds issued
by the State where the bank is headquartered, divided
by the
bank’s gross total assets. Column (6) shows the results for quarter‐on‐quarter growth in the bank’s total loans to the government as a share of
total assets. M
isaligned
is an in
dicator variable equal to one if the party with the most votes obtained
during the latest regional elections in the
county w
here the bank is domiciled is different from the leading party in the coalition form
ing the State governmen
t after the latest State
parliamen
tary elections. Government‐owned
is an
indicator variable equal to one for banks that are ultim
ately owned by the local government,
i.e. local savings banks. The regressions include all control variables from Table 4 (coefficien
ts not reported
for brevity). Standard errors are two‐
way clustered at the county and quarter level. */**/***
den
ote significance at the 10%/5%/1% levels, respectively. For variable definitions and
sources, see
Appen
dix Table 1.
ECB Working Paper Series No 2146 / April 2018 60

Table 11. Politics, banks, and home‐State bonds: Robust alignment
State bonds / Total assets
Misalignment via
any election Misalignment via State elections
Misalignment via county elections
(1) (2) (3) (4) (5)
Misaligned × Government‐owned 0.0462** 0.0005
(0.0226) (0.0305)
Misaligned Q1 × Government‐owned 0.0196 0.0372* ‐0.0327
(0.0149) (0.0205) (0.0207)
Misaligned Q2 × Government‐owned 0.0379** 0.0433** ‐0.0024
(0.0170) (0.0203) (0.0287)
Misaligned Q3 × Government‐owned 0.0492*** 0.0423** 0.0460
(0.0170) (0.0194) (0.0313)
Misaligned Q4 × Government‐owned 0.0402*** 0.0304* 0.0434
(0.0152) (0.0168) (0.0289)
Misaligned Q5 × Government‐owned 0.0312* 0.0270 0.0377
(0.0177) (0.0187) (0.0395)
Misaligned Q6 × Government‐owned 0.0364** 0.0236 0.0910**
(0.0180) (0.0194) (0.0455)
Misaligned Q7 × Government‐owned 0.0340* 0.0262 0.0629
(0.0191) (0.0216) (0.0475)
Misaligned Q8 × Government‐owned 0.0223 0.0240 0.0242
(0.0173) (0.0206) (0.0441)
Misaligned Q9+ × Government‐owned ‐0.0049 0.0143 ‐0.0472**
(0.0098) (0.0110) (0.0207)
Observations 52,288 46,338 46,338 35,837 35,837
R‐squared 0.596 0.465 0.458 0.473 0.473
Bank FE Yes Yes Yes Yes Yes
County × Quarter FE Yes Yes Yes Yes Yes
Annual controls Yes Yes Yes Yes Yes
Quarterly controls Yes Yes Yes Yes Yes
Notes: This table presents OLS regression results of State bond holdings on bank‐specific variables and on indicators of political connections. The dependent variable in both columns is the market value of the bank’s total holdings of bonds issued by the State where the bank is headquartered, divided by the bank’s gross total assets. Misaligned is an indicator variable equal to one if the party with the most votes obtained during the latest regional elections in the county where the bank is domiciled is different from the leading party in the coalition forming the State government after the latest State parliamentary elections. In columns (2) and (3), only misalignments occurring as a result of State elections are counted. In columns (4) and (5), only misalignments occurring as a result of local elections are counted. In both cases, the alternative type of misalignment is dropped from the data. Misaligned Qi is an indicator variable equal to one if Misaligned equals 1 i quarters after any (column (1)), after State (column (3)), or after local (column (5)) elections. Government‐owned is an indicator variable equal to one for banks that
ECB Working Paper Series No 2146 / April 2018 61

are ultimately owned by the local government, i.e. local savings banks. The regressions include all control variables from Table 4 (coefficients not reported for brevity). Standard errors are two‐way clustered at the county and quarter level. */**/*** denote significance at the 10%/5%/1% levels, respectively. For variable definitions and sources, see Appendix Table 1.
ECB Working Paper Series No 2146 / April 2018 62

Table 12. The cost of political m
isalignmen
t: Inciden
ce of bank bailouts
Ba
ilout amou
nt / Risk‐weighted assets
(1)
(2)
(3)
(4)
(5)
Misaligned × Government‐owned
‐8.3773***
‐6.0893*
‐11.2087**
‐7.9961*
‐9.6961*
(3.1863)
(3.4311)
(4.8486)
(4.4583)
(6.0597)
Misaligned
‐0.1375
1.9545
‐0.1872
2.6558
3.8890
(1.0663)
(1.6274)
(1.4381)
(2.1745)
(3.6504)
Government‐owned
0.8644
0.9545
1.0928
1.3307
2.4719
(1.7471)
(2.6252)
(2.5125)
(3.2455)
(4.7266)
Observations
131
131
131
131
131
R‐squared
0.374
0.446
0.408
0.455
0.493
State fixed
effects
No
Yes
No
Yes
Absorbed
Quarter fixed effects
No
No
Yes
Yes
Absorbed
Stat
e × Quarter FE
No
No
No
No
Yes
Annual controls
Yes
Yes
Yes
Yes
Yes
Quarterly controls
Yes
Yes
Yes
Yes
Yes
Notes: This table presents O
LS regression results of an
indicator of bailout intensity on bank‐specific variables and on indicators of political
connections. The depen
dent variable is the am
ount of capital support provided
to banks as a share of risk‐w
eighted assets. These capital support
measures constitute the same bailouts analyzed
in Dam
and Koetter (2012) and Bian et al. (2013). M
isaligned
is an
indicator variable equal to
one if the party with the m
ost votes obtained
during the latest regional elections in the county where the bank is domiciled is different from the
leading party in the coalition form
ing the State governmen
t after the latest State parliamentary elections. Government‐owned
is an
indicator
variable equal to one for banks that are ultim
ately owned
by the local governmen
t, i.e. local savings banks. The regressions include all control
variables from Table 4 (coefficien
ts not reported
for brevity). Standard errors are two‐w
ay clustered
at the state and quarter level. */**/***
den
ote significance at the 10%/5%/1% levels, respectively. For variable definitions and sources, see
Appendix Table 1.
ECB Working Paper Series No 2146 / April 2018 63

Appen
dix Table 1. V
ariable definitions and sources
Varia
ble
Unit
Definition
Source
D
epen
dent variables and
trea
tmen
t
State bonds / To
tal assets
%
Market value according to German
accounting rules of state bonds where
the bank is headquartered divided
by average quarterly gross assets.
Bista and SHS
State bonds / To
tal assets (Nominal value) %
Nominal value of state bonds where the bank is headquartered divided
by average quarterly gross assets.
Bista and SHS
State bonds / To
tal portfolio
%
Market value of state bonds where the bank is headquartered according
to German
accounting rules divided
by the aggregate m
arket value of the
entire equity and fixed
income security portfolio.
Bista and SHS
State bonds / Bond portfolio
%
Market value of state bonds where the bank is headquartered according
to German
accounting rules divided
by the aggregate m
arket value of the
entire equity and fixed
income security portfolio.
Bista and SHS
Federal bonds / To
tal assets
%
Market value according to German
accounting rules of federal
governmen
t bonds divided by average quarterly gross assets.
Bista and SHS
Other States’ bonds / To
tal assets
%
Market value according to German
accounting rules of any sub‐fed
eral,
state bonds irrespective of where the bank is headquartered divided
by
average quarterly gross assets.
Bista and SHS
Stocks / To
tal assets
%
Market value according to German
accounting rules of eq
uity securities
divided
by average quarterly gross assets.
Bista and SHS
Bailout am
ount / Risk‐weighted assets
%
Capital and equity warrant support by local dep
osit and institution
insurance schem
es relative to risk‐weighted assets.
BBK
Misaligned
0/1
An indicator eq
ual to one if the strongest party in
the county is different
from the leading political party in
the State governmen
t.
SSO
Defector
0/1
An indicator eq
ual to one if the strongest party in
the county is different
from the leading party in
the majority of the counties in
the State.
SSO
ECB Working Paper Series No 2146 / April 2018 64

Government‐owned
0/1
An indicator eq
ual to one if the bank is owned
by the local governmen
t.
BBK
Q
uarterly ban
k‐level con
trols
Log (Total assets)
€
The logarithm of total assets, m
easured in
€.
Bista
Share of stocks of total assets
%
The share of stocks relative to total assets.
Bista
Share of cash of total assets
%
The sum of cash, vault cash, and notes relative to total assets.
Bista
Share of corporate loans in total len
ding
%
Corporate credit relative to total non‐m
onetary financial institutions
(MFI) credit.
Bista
Share of household lending in total
lending
%
Household credit relative to total non‐M
FI credit.
Bista
Share of governmen
t lending
%
Domestic governmen
t borrowing relative to total non‐M
FI credit.
Bista
Share of lending to foreigners
%
Foreign non‐M
FI counterparties relative to total non‐M
FI credit.
Bista
A
nnua
l ban
k‐level con
trols
Tier 1 capital ratio
%
Core capital divided
by risk‐w
eighted assets.
BBK
Cost‐income ratio
%
Administrative expen
ses for personnel, dep
reciation of fixed assets, ren
t,
and other overhead relative to operating result.
BBK
Share of fee income
%
Reven
ues from fees relative to total operating income.
BBK
Return on equity
%
Operating return relative to gross equity.
BBK
Ratio of ST assets to ST liabilities
%
Liquid assets with a m
aturity of up to one month relative to liabilities
with a m
aturity of up to one month.
BBK
Share of non‐perform
ing loans
%
Audited loans with iden
tified
need for value correction relative to total
loans.
BBK
Notes: BBK is the acronym
for Deu
tsche Bundesbank, the German
Cen
tral Bank. Bista abbreviates the monthly balance sheet statistic of BBK. SHS
abbreviates the security holdings statistic (WP‐Invest) of BBK. SSO
abbreviates State Statistical Offices.
ECB Working Paper Series No 2146 / April 2018 65

Appendix Table 2. Timing and existence of State ratings
Moodys Standard and Poors Rating Date Rating Date
Baden‐Württemberg Aaa 14.12.1999 AAA 06.03.2012
Bayern Aaa 20.01.2000 AAA 19.01.2012
Berlin Aa1 15.12.2006
Brandenburg Aa1 15.12.2006
Bremen
Hamburg
Hessen AA 29.11.2005
Mecklenburg‐Vorpommern
Niedersachsen
Nordrhein‐Westfalen Aa1 04.03.2014 AA‐ 20.12.2004
Rheinland‐Pfalz
Saarland
Sachsen AAA 19.01.2012
Sachsen‐Anhalt Aa1 15.03.2007 AA+ 16.12.2010
Schleswig‐Holstein
Thüringen
Notes: This table reproduces ratings reported in "Issuer Guide Deutsche Bundesländer 2015" (Nord LB). Only State ratings as opposed to occasional bond issues are considered. Quarters before the reported time of rating are considered not rated. If the rating was conducted prior to the start of the sample in q4:2005, we consider the rating as of the start of our sample. Ratings are converted into 16 categories in ascending order of quality, which corresponds to the number of prime ratings by both rating agencies.
ECB Working Paper Series No 2146 / April 2018 66

Appendix Table 3. Banks with and without State debt holdings
Local savings banks Local cooperatives Yes No Yes No
2005 88 354 86 1141
2006 96 347 88 1140
2007 89 353 73 1154
2008 79 357 65 1127
2009 103 326 141 1012
2010 117 310 169 965
2011 128 297 171 944
2012 137 284 177 921
2013 154 261 181 893
Notes: This table shows the number of local savings and cooperative banks that hold and do not hold sub‐sovereign debt from the State where they are headquartered.
ECB Working Paper Series No 2146 / April 2018 67

Appen
dix Table 4. G
ross total assets and State bonds
Bank
ing grou
p Va
riable
Mean
Med
ian
SD
N
Government‐owned
Gross total assets in Euro
2,443,834,572
1,515,403,456
3,317,372,052
14,262
Own State debt in Euro (market value)
2,534,212
0
7,588,939
14,262
Own State debt in Euro (nominal value)
2,495,484
0
7,531,873
14,262
Cooperative banks
Gross total assets in Euro
578,379,025
279,799,504
1,423,717,098
38,302
Own State debt in Euro (market value)
503,580
0
3,069,191
38,302
Own State debt in Euro (nominal value)
494,847
0
3,041,425
38,302
Notes: This table shows descriptive statistics for the componen
ts of the main dep
enden
t variable in levels. The data are measured in Euros an
d
separated
by banking group. Th
e market value of sub‐sovereign deb
t denotes the value of the financial assets according to the German
accounting rules. The nominal value dep
icts the face value of fixed income instrumen
ts.
ECB Working Paper Series No 2146 / April 2018 68

Appendix Table 5. Politics, banks, and sub‐sovereign debt: Non‐linear regression models
State bonds / Total assets (1) (2) (3) (4) Tobit Poisson Logit Probit
Misaligned × Government‐owned 0.0430*** 0.1473*** 0.2078** 0.1639***
(0.0064) (0.0445) (0.0892) (0.0499)
Observations 52,288 52,288 15,306 52,288
Bank FE (Or RE in probit) Yes Yes Yes Yes
Quarter FE Yes Yes Yes Yes
County FE No Yes No Yes
Annual controls Yes Yes Yes Yes
Quarterly controls Yes Yes Yes Yes
This table presents results from panel Tobit (column (1)), zero‐inflated Poisson (column (2)), panel Logit (column (3)), and panel Probit (column (4)) regressions of State bond holdings on bank‐specific variables and on indicators of political connections. The dependent variable in all columns is the bank’s total holdings of bonds issued by the State where the bank is headquartered, divided by the bank’s gross total assets. Misaligned is an indicator variable equal to one if the party with the most votes obtained during the latest regional elections in the county where the bank is domiciled is different from the leading party in the coalition forming the State government after the latest State parliamentary elections. Government‐owned is an indicator variable equal to one for banks that are ultimately owned by the local government, i.e. local savings banks. The regressions include all control variables from Table 4 (coefficients not reported for brevity). Standard errors are clustered at the bank level. */**/*** denote significance at the 10%/5%/1% levels, respectively. For variable definitions and sources, see Appendix Table 1.
ECB Working Paper Series No 2146 / April 2018 69

Appendix Table 6. Excluding single‐county States and Bremen
State bonds / Total assets (1) (2) (3) (4) (5)
Baseline Excluding Berlin
Excluding Bremen
Excluding Hamburg
Excluding all three
Misaligned × Government‐owned 0.0195** 0.0197** 0.0196** 0.0194** 0.0197**
(0.0077) (0.0077) (0.0077) (0.0077) (0.0077)
Observations 52,288 52,189 52,123 52,024 51,760
R‐squared 0.596 0.596 0.595 0.596 0.596
Bank FE Yes Yes Yes Yes Yes
County × Quarter FE Yes Yes Yes Yes Yes
Annual controls Yes Yes Yes Yes Yes
Quarterly controls Yes Yes Yes Yes Yes
Notes: This table presents OLS regression results of State bond holdings on bank‐specific variables and on indicators of political connections. Column (1) replicates the baseline result from column (6) in Table 4. The three subsequent columns exclude one by one those states with only one county where no within‐state variation of the Misaligned indicator is possible. Column (5) excludes all three city‐states: Berlin, Bremen, and Hamburg. The dependent variable in all columns is the market value of the bank’s total holdings of bonds issued by the State where the bank is headquartered, divided by the bank’s gross total assets. Misaligned is an indicator variable equal to one if the party with the most votes obtained during the latest regional elections in the county where the bank is domiciled is different from the leading party in the coalition forming the State government after the latest State parliamentary elections. Government‐owned is an indicator variable equal to one for banks that are ultimately owned by the local government, i.e. local savings banks. The sample period is q4:2005 until q3:2013. Standard errors are two‐way clustered at the county and quarter level. */**/*** denote significance at the 10%/5%/1% levels, respectively. For variable definitions and sources, see Appendix Table 1.
ECB Working Paper Series No 2146 / April 2018 70

Acknowledgements Without implicating them, we are grateful to Viral Acharya, Claudia Buch, Filippo De Marco, Victoria Ivashina, Olga Kuzmina (discussant), Elena Loutskina, Alberto Martin, Filippo de Marco (discussant), Jana Ohls, Steven Ongena, Jean-Charles Rochet, Javier Suarez, Nikola Tarashev (discussant), Ernst-Ludwig von Thadden, Benjamin Weigert, seminar participants at the Deutsche Bundesbank, ECB, LSE, Osnabrueck University, University of Groningen, and University of Zurich, and conference participants at the EBC-DNB-CEPR Conference "Avoiding and Resolving Financial Crises", the 6th MoFiR Workshop on Banking, the 2017 EEA annual congress, and the 2017 EFA annual congress for valuable comments. Tim van Ark provided outstanding research assistance. The opinions expressed herein are those of the authors and do not necessarily reflect those of the Deutsche Bundesbank, the ECB, or the Eurosystem. Michael Koetter IWH, Halle, Germany; email: [email protected] Alexander Popov (corresponding author) European Central Bank, Frankfurt am Main, Germany; email: [email protected]
© European Central Bank, 2018
Postal address 60640 Frankfurt am Main, Germany Telephone +49 69 1344 0 Website www.ecb.europa.eu
All rights reserved. Any reproduction, publication and reprint in the form of a different publication, whether printed or produced electronically, in whole or in part, is permitted only with the explicit written authorisation of the ECB or the authors.
This paper can be downloaded without charge from www.ecb.europa.eu, from the Social Science Research Network electronic library or from RePEc: Research Papers in Economics. Information on all of the papers published in the ECB Working Paper Series can be found on the ECB’s website.
ISSN 1725-2806 (pdf) DOI 10.2866/700142 (pdf) ISBN 978-92-899-3251-6 (pdf) EU catalogue No QB-AR-18-026-EN-N (pdf)