working paper series - ecb.europa.eu · working paper series ... see eurostat’s handbook on price...
TRANSCRIPT

Work ing PaPer Ser i e Sno 1204 /
Banking
Sector outPut
MeaSureMent in
the euro area –
a Modified
aPProach
by Antonio Colangelo and Robert Inklaar
2010J une

WORKING PAPER SER IESNO 1204 /
In 2010 all ECB publications
feature a motif taken from the
€500 banknote.
BANKING SECTOR OUTPUT
MEASUREMENT IN THE EURO
AREA – A MODIFIED APPROACH 1
by Antonio Colangelo 2 and Robert Inklaar 3
1 This research was supported by the European Commission, Research Directorate General as part of the 7th Framework Programme, Theme 8,
“Socio-Economic Sciences and Humanities” and is part of the project “Indicators for evaluating international performance in service sectors”.
The work has benefited from useful comments and suggestions by Henning Ahnert, Giacomo Carboni, Jean-Marc Israël, Steven Keuning,
Christoffer Kok Sørensen, Reimund Mink and Christina Wang. We would also like to thank an anonymous referee
for several useful comments; his suggestions have resulted in a much improved version of the paper.
2 European Central Bank, Kaiserstrasse 29, 60311 Frankfurt am Main, Germany, e-mail: [email protected]
This paper can be downloaded without charge from http://www.ecb.europa.eu or from the Social Science Research Network electronic library at http://ssrn.com/abstract_id=1610200.
NOTE: This Working Paper should not be reported as representing the views of the European Central Bank (ECB). The views expressed are those of the authors
and do not necessarily reflect those of the ECB.
2010J une
3 University of Groningen, PO Box 800, 9700 AV Groningen, The Netherlands, e-mail: [email protected] Vx

© European Central Bank, 2010
AddressKaiserstrasse 2960311 Frankfurt am Main, Germany
Postal addressPostfach 16 03 1960066 Frankfurt am Main, Germany
Telephone+49 69 1344 0
Internethttp://www.ecb.europa.eu
Fax+49 69 1344 6000
All rights reserved.
Any reproduction, publication and reprint in the form of a different publication, whether printed or produced electronically, in whole or in part, is permitted only with the explicit written authorisation of the ECB or the authors.
Information on all of the papers published in the ECB Working Paper Series can be found on the ECB’s website, http://www.ecb.europa.eu/pub/scientific/wps/date/html/index.en.html
ISSN 1725-2806 (online)

3ECB
Working Paper Series No 1204
Abstract 4
Non-technical summary 5
1 Introduction 7
2 Imputed bank output – current methodology 8
3 The new methodology 9
3.1 The conceptual framework 9
3.2 The empirical set up 17
4 FISIM calculations 25
4.1 Interest margins 25
4.2 FISIM results for the euro area 30
5 Concluding remarks 33
References 35
Appendices 37
CONTENTS
2010June

4ECBWorking Paper Series No 1204
Abstract: Banks do not charge explicit fees for many of the services they provide but the service payment is bundled with the offered interest rates. This output therefore has to be imputed using estimates of the opportunity cost of funds. We argue that rather than using the single short-term, low-risk interest rate as in current official statistics, reference rates should more closely match the risk characteristics of loans and deposits. For the euro area, imputed bank output is, on average, 24 to 40 percent lower than according to current methodology. This implies an average downward adjustment of euro area GDP (at current prices) between 0.16 and 0.27 percent.
JEL No. E01, E44, O47
Key words: Bank output, FISIM, risk, loan interest rates, deposit interest rates.
2010June

5ECB
Working Paper Series No 1204
Non technical summary
Fees charged to customers only cover part of the actual costs born by banks. In practice, for many of the services they provide banks do not even charge explicit fees. For instance, on loans and deposits the service payment is usually bundled with the interest rates charged or paid. In particular, when granting loans banks usually provide services to their customers throughout the duration of the contract; these services take the form of financial advice, screening credit worthiness, monitoring the performance of the loan, re-bargaining the contract conditions and are usually charged not by means of fees. Instead, they are charged implicitly by setting an interest rate which is higher than a “fair” reference interest rate. Similarly, on deposits banks’ services taking the form of bookkeeping and payment facilities are charged by offering the depositors interest rates which are lower than a “fair” reference interest rate.
Any complete measure of bank output should take this into account by estimating what part of bank interest rates is a payment for services and what part is the cost of funds, reflected by the appropriate reference rate. The implicit service charge and the fees actually charged by the banks make up the total output of banks and thus any measurement issue related to the estimation of imputed service changes of banks affect the measurement of the banking sector output, its contribution to Gross Domestic Product (GDP) and overall GDP.
Under the statistical framework set up by the European system of national and regional accounts 1995, EU countries have implemented a common methodology to compile imputed bank output, which is referred to as financial intermediation services indirectly measured (FISIM). Under this approach, FISIM are compiled on all loans and deposits vis-à-vis non-financial sectors (and insurance corporations and pension funds). The estimates are derived by comparing bank interest rates to a single reference rate of interest. The latter reflects the average interest rate at which financial intermediaries lend money to each other, without distinction by type and maturity of the instrument. Typically compensation for default risk is also rather minimal on these types of transactions (at least in historical terms). As a result, the compensation for bearing credit default risk and the term premium is treated as a productive service and thus becomes part of financial services and, to some extent, whole economy GDP.
In this paper, we argue against this treatment of risk as economic theory suggests that bank interest rates should be compared to the yield on market securities with the similar risk and term characteristics. A simple example illustrates the inconsistency of the current approach. Consider two firms with similar characteristics that need to borrow to finance their operations. The first firm borrows from the financial markets and pays the market interest rate which includes the term spread and the default risk premium, while no services are paid to the holders of the securities. The second firm borrows from a bank and pays the interest rate charged by the bank. Under the current approach, the second firm is assumed to pay only the
2010June

6ECBWorking Paper Series No 1204
inter-bank rate, while the remainder of the payment is bank output. Under our proposed approach, both firms face the same cost of funds, and only the payments in excess of this market rate by the second firm are bank output.
The proposed enhanced framework is applied to the euro area, estimating monthly FISIM for the period January 2003 to June 2008. This period is chosen because of the availability of detailed interest rate and balance sheet statistics for euro area banks, which allow distinguishing among different types of loans and deposits, further broken down by maturity and by sector of the borrower and holder respectively. In our results, we distinguish between two scenarios, one where the reference rate only takes into account the maturity of the loan and another where it also takes the default risk premium into account. Under the first scenario, euro area FISIM is on average 24 percent lower than under the current approach, while the second scenario leads to imputed banking sector output that is 40 percent lower. In terms of deliveries to final demand this implies, on the average, an overestimation between €12.6bln and €21.4bln or 0.16 to 0.27 percent of euro area GDP at current prices.
2010June

7ECB
Working Paper Series No 1204
1. Introduction
Banks do not charge explicit fees for many of the services they provide.4 Instead, the payment for the services is usually bundled with the interest rates charged on loans and paid on deposits. Any complete measure of bank output should take this into account by estimating what part of bank interest rates is a payment for services and what part is the cost of funds. In this paper, we argue that the estimation methodology that is currently used in the euro area (and in many other economies) needs to be reviewed to take into account the risk characteristics of loans and deposits and we present new euro area estimates based on our proposed methodology.5
The key point of contention in estimating, or imputing, bank output is identifying the opportunity cost of funds. In current European National Accounts methodology, the inter-bank rate is used as the cost of funds for all types of loans and deposits.6 However, in recent theoretical work, Wang et al (2008) show that profit-maximizing banks would not use such an interest rate as a measure of the opportunity costs of funds. Instead, they would use an interest that reflects the (systematic) risk associated with each loan or deposit, so taking into account the risk of default and any term premium. Recently, the Wang et al (2008) methodology has been applied for US commercial banks in Basu et al (2009). They find that current methodologies overestimate US imputed bank output by 45 percent and US GDP by 0.3 percent. The contribution of this paper is to apply the Wang et al (2008) methodology to the euro area to establish whether or not the large overestimation is a common feature across countries.
It is very important to have an accurate and appropriate measure for imputed bank output. First of all, it is part of overall banking sector output (in addition to fees and commissions) and insofar as banks serve households, government or foreign demand, imputed bank output contributes to overall GDP. Additionally, the interest margin is part of the price of bank output, so how this price is measured will affect overall producer and consumer prices. Our results are based on a benchmarking exercise that identifies opportunity costs of funds by estimating pass-through equations in an error-correction modelling framework. The findings imply that imputed bank output is, on average, overestimated by 24 to 40 percent and euro area GDP (at current prices) is, on average, overestimated by between €12.6bln and €21.4bln or 0.16 to 0.27 percent. The higher numbers are estimated using the same conceptual approach as Basu et al (2009), so we conclude that euro area bank output is overestimated to the same degree as US bank output.
4 Where we talk about banks, we refer to the group of other Monetary Financial Institutions (MFIs), which mainly includes
credit institutions and money market funds (MMFs); for more information, see Regulation ECB/2008/32. As the scope of the analysis is limited to loans and deposits, the bias resulting from the inclusion of MMFs is marginal; in fact, according to ECB estimates for 2006, deposits held with MMFs and loans granted by MMFs vis-à-vis non-MFI euro area residents accounted on the average for 0.02% of the corresponding total other MFIs loans and deposits.
5 This paper concentrates on estimates of output at current prices. For details on the methodology for FISIM volume measures, see Eurostat’s Handbook on price and volume measures in national accounts (2001), and also Basu and Wang (2006) and Inklaar and Wang (2007).
6 This is consistent with the recommendations of the System of National Accounts, see 1993 SNA, paragraph 6.128.
2010June

8ECBWorking Paper Series No 1204
The paper is organised as follows. Section two describes the current methodology for estimating bank output in European statistics; Section three deals with our proposed methodology, presenting both its conceptual framework and the empirical set-up. The estimates from the new methodology are presented in Section four for the euro area7 as a whole and compared to imputed bank output derived according to the current European methodology.8 Finally, we offer some concluding remarks.
2. Imputed bank output – current methodology
Imputed bank output is commonly referred to as Financial Intermediation Services Indirectly Measured (FISIM) in official statistics. FISIM are the financial services that other MFIs and Other Financial Intermediaries (excluding insurance corporations and pension funds, OFIs)9 provide to their customers but which are not directly invoiced. For depositors, these services generally include the management of the accounts, the provision of accounts statements and fund transfers between accounts. Banks may charge explicit fees for deposit accounts, but in addition, the interest rate received on these accounts is typically lower than what customers could have obtained by lending their money directly on the market. For borrowers, these financial services include the screening and monitoring of their creditworthiness, financial advice, the smoothing over time of repayments, and the recording of the repayments for accounting purposes. They are paid by an increase of the interest rates charged by banks.
In contrast, there is no intermediation service for debt securities: to the extent that a bank was involved in issuing or placing these securities, they will have received an upfront fee and to the extent that they bought these in the secondary market, they have not provided services.
Paragraph 3.63.J of the 1995 ESA outlines the principles underlying FISIM compilation10. In particular, it states that in general financial intermediation services cover two parts: (a) financial intermediation services directly charged by financial intermediaries to their clients and measured as the sum of fees and commission charged; and (b) FISIM.
The 1995 ESA identifies other MFIs and OFIs as being the only FISIM-producer sectors. 11 Their output is valued on the basis of the difference between the actual rates of interest payable and receivable on loans and deposits vis-à-vis other sectors (including the rest of the world) and a “reference” rate of interest. For
7 All estimates in the paper refer to the moving composition of the euro area, i.e. data prior to January 2007 do not include
Slovenia and similarly, data prior to January 2008 do not include Cyprus and Malta. 8 The FISIM estimates presented in this paper according to the methodology laid down in the Council Regulation (EC) No
2223/93 of 25 June 1996 on the European System of National and Regional Accounts in the Community (1995 ESA), amended by Council Regulations (EC) 448/98 and 1889/2002, are not based on national official statistics but have been derived by the ECB simulating this methodology. In particular, whereas national results are only presented for euro area countries, the methodological framework proposed in the paper could be applied more in general to all EU countries.
9 Other MFIs, OFIs and insurance corporations and pension funds are part of the financial corporations institutional sector. For a formal definition of financial corporations and the related sub-classification, see Paragraphs 2.32 to 2.67 of 1995 ESA.
10 In the context of FISIM measurement 1995 ESA is fully consistent with the general framework set up in 1993 SNA. 11 The results presented in this paper are limited to other MFIs’ output as a fully consistent and detailed set of statistics on other
financial intermediaries (OFIs) is currently not available at the ECB for all euro area countries. In addition, under 1995 ESA insurance corporations and pension funds are not identified as producers of FISIM; while this treatment is not questioned in this paper, it could offer interesting perspectives for future research.
2010June

9ECB
Working Paper Series No 1204
those to whom the intermediaries lend funds, both resident and non-resident, it is measured by the difference between the effective interest charged on loans and the amount that would be paid if a reference rate were used. For those from whom the intermediaries receive funds (under the form of deposits), both resident and non-resident, it is measured by the difference between the interest they would receive if a reference rate were used and the effective interest they actually receive.
In turn, the reference rate is defined as the average interest rate at which FISIM-producer sectors lend money to each other12. In particular, the 1995 ESA distinguishes between an internal reference rate, to be used for transactions among residents, and an external reference rate, to be used for the business between residents and the rest of the world, with the possibility of compiling different external reference rates according to currencies of denomination and counterpart areas.
The current approach has various shortcomings. Essentially, the method does not appropriately capture the differences between the various types of loans and deposits: for instance, whereas the inter-bank business is mainly short term with low default risk premium, deposits and loans from/to other sectors may have completely different maturity structure with sometimes high default risk. In summary, within the current methodological framework compensation for term premium and default risk is treated as productive service and leads in many instances to negative FISIM, both at the sectoral level and in the rest-of-the-world account.13
3. The new methodology
3.1 The conceptual framework14
A measure of bank output cannot be estimated without a description of the financial services that customers buy. This is also the starting point of the model developed in Wang et al (2008) and this section is based on their arguments. It goes too far in an empirical paper like this to provide a full exposition of their general equilibrium model, so this section will focus on the main features and intuition of their model. The key conclusion of Wang et al (2008) and the earlier Wang (2003) studies regarding output measurement is that implicit compensation for bank services can be inferred from a bank’s total income by netting out the pure risk-based returns (i.e., costs of funds) on assets and liabilities held by the bank. To impute the cost of funds on any such risky financial instrument, one should use the rate of return on (debt) securities subject to the same risk, but without any services attached. Total income net of the pure costs of funds then measures the true value of bank services implicitly charged for. This conclusion
12 The reference rate is computed as a weighted average of money market rates that reflects the currency and maturity
composition of the financial intermediaries’ lending market. The positions vis-à-vis the central banks are excluded from this computation. It also follows that when comparing reference rates for different reference areas, the average inter-bank rates may differ due to the currency and maturity composition of the market. As financial intermediaries include banks and OFIs, the reference rate may also diverge from the average inter-bank rate depending on the relative size of OFIs.
13 Colangelo and Inklaar (2009) present two examples where negative margins may arise from mismatches between risk and maturity structure of specific instruments and the reference rate. For a more in depth analysis of the issue of negative FISIM on imports and exports see S. Fonte Santa (2007).
14 This subsection draws heavily on a similar exposition in Basu et al (2009).
2010June

10ECBWorking Paper Series No 1204
is summarized in Figure 1, which shows graphically how we impute the value of bank services related to loans ( AY ) and deposits ( DY ) using data on the interest rate paid on deposits ( Dr ), the interest rate charged on loans ( Ar ) and market interest rates on risk-free securities ( Fr ) and risky securities ( Mr ). This section first outlines the theoretical arguments for choosing these particular interest rates and next discusses our empirical implementation.
Figure 1. Decomposition of a bank’s interest flows (simplified version)
Notes: rA: (Average) interest rate received on loans rM: Expected rate of return required on market securities with the same (systematic) risk characteristics as the loans rF: Risk-free raterF’: Short-term risk-free raterD: (Average) interest rate paid on deposits YA: Nominal output of bank services to borrowers YD: Nominal output of bank services to depositors For a more detailed decomposition, see Wang (2003).
3.1.1 Implicit bank services – the case of lending15
Before any attempt to measure, one must first define a concept. So, what is the output of banks? Wang (2003) and Wang et al (2008) answer this question through models that embed optimal bank operations within the context of competitive financial markets. These papers recognize that the value added of banks lies in resolving information problems and processing transactions, not in generating returns on the resulting financial instruments. These returns are determined entirely by the instruments’ risk characteristics and market interest rates. In particular, in these models the value added of bank lending consists of screening and monitoring activities to mitigate asymmetric information problems with regard
15 For exposition of the theory, we focus on bank lending services because the measurement problem is made harder by the fact
that the implicit revenue from services is bundled with risk-based asset (i.e. loan) returns. See Wang (2003) for detailed accounting of services to depositors. In the empirical application, we also measure services to depositors.
rA
2010June

11ECB
Working Paper Series No 1204
to borrowers’ creditworthiness.16 Bank services are analogous to other professional business services, such as legal, accounting and consulting services, and indeed analogous to all production in the economy: output is generated through a production process that uses primary inputs of labour and capital, as well as intermediate inputs (such as office supplies and utilities).
In contrast, the purely risk-based returns that accrue to the stock of financial instruments held by banks are what investors would demand on any contingent claims with the same risk profiles, regardless of how these are created. These pure returns also correspond to the concept of the “user cost of funds,” defined as the (risky) future payoff from investment that compensates suppliers of funds for their forgone current consumption and for bearing risk, but not for any attached services.17 The costs of funds are part of the overall user cost of capital faced by the ultimate users of funds, such as non-financial firms. These are therefore part of those firms’ value added, not the value added of the banks that provide the funds.
This paper concentrates on the measurement of nominal bank output, but to understand the models of Wang (2003) and Wang et al (2008), it is useful to consider briefly the concept of real output implied by these models. Real bank (lending) output consists of intermediation services that certify borrowers as credit-worthy at loan origination (screening) and on an on-going basis (monitoring). Thus, a natural measure of real bank output is the number of loans originated and monitored, just as a natural measure of the output of a “normal” service provider, like a barbershop, is the number of haircuts it provides. In principle, certain types of loans (for example, small business loans) may require more information processing than others (such as conforming mortgages). Thus, a refined measure of real output would augment the raw transactions count with some notion of “quantity of service,” just as a high-quality coiffure by Christophe of Los Angeles18 should be counted as being “more haircut output” than a haircut from the local barber shop. But in any measure of real bank output, the natural starting point is the number of transactions of each type performed.
Inklaar and Wang (2009) count these transactions and aggregate them into an index of real bank output. The object of this paper, of course, is to measure nominal bank output accurately. In conjunction, these two papers imply a complete set of national income measures for banking—nominal output, real output, and an implicit price index for banking services.
3.1.2 Loan interest rate spread – risk vs. implicit bank services
The key measurement implication of Wang (2003) and Wang et al (2008) is that the nominal value of bank services that are not explicitly charged for can be imputed as total income net of the purely risk-
16 Banks’ role in resolving information asymmetry is well recognized in the financial intermediation literature (e.g., see the
survey by Bhattacharya and Thakor, 1993). More recently, Allen and Santomero (2001) broaden the scope to recognize intermediaries’ role as providers of specialized financial expertise. This can be interpreted as a form of transaction facilitation and thus encompassed in our definition of bank value added.
17 This can be viewed as an extension to what is often referred to as the “user-cost” framework. Diewert (1974) was one of the first to introduce this framework and Barnett (1978) first applies it to financial assets, introducing the concept of “user cost of money.” The key element of our extension is that it takes account of risk, that is, in the real world where the reward to essentially all investment is uncertain, the so-called “opportunity cost of money” is comparable across securities only after adjusting for risk.
18 Who famously cut Bill Clinton’s hair on Air Force One at Los Angeles International Airport (LAX).
2010June

12ECBWorking Paper Series No 1204
based returns on the financial claims created by those services and held on the bank’s book. In the case of lending services, the pure cost of funds on a loan should be inferred using the rate of return on a market debt security with the same risk characteristics (but without any services attached).
This method of matching risk is of the same nature as a common application of asset-pricing theory to corporate finance – the cost of capital for a specific investment project is set to equal the rate of return on “like” market securities. Both of these applications follow the same principle as the Arbitrage Pricing Theory in Ross (1976), where the expected rate of return on a portfolio is determined given the returns on “factor” portfolios and the absence of arbitrage opportunities.19 One obvious implication is that no firm—and no bank—would use the return on risk-free securities as the appropriate opportunity cost for an investment with risky payoff.
The logic of removing risk-adjusted returns from total bank income to impute the value of service output can be illustrated with a stylized example of “the bank that does nothing.”20 Specifically, assume frictionless financial markets, so that firms can borrow directly from households without the need for intermediaries to process information or transactions. The required (net) rate of return on any investment between periods t and t+1, denoted 1tr (with the tilde emphasizing the random nature of the return), is
determined by a stochastic discount factor, denoted mt+1, as follows:
(1) t 1 1E [(1 ) ] 1t tr m .
Assume entities that function solely as accounting vehicles are set up as follows:21 households transfer their capital to these entities in exchange for claims on the entities, which then rent the capital to production firms. By design, these entities have balance sheets and income statements that look like those of banks, so they are called banks for short even though they perform no services.
For simplicity of exposition, we assume these banks are fully equity funded. Note however that the banks’ capital structure is irrelevant for their cost of capital in this simple model economy since here the Modigliani-Miller (MM, 1958) theorem applies. More generally, Wang (2003) showed that the central message that the user cost of funds must take risk into account does not depend on whether the MM theorem holds. What remains is the practical matter of finding the market rates most commensurate with the risk of financial instruments held by banks, as we discuss later in detail.
Now look at the cash flow of a representative bank. Households recognize that a bank here is just a bookkeeping device and that they ultimately own its assets – capital used in production. So they require the same rate of return on a bank’s equity as on those assets. The bank must therefore lend the funds to any firm at a rate set according to (1). Consequently, production firms face the same cost of capital as they would have if they had borrowed directly from households. Let t 1E ( )i i
t tr r denote the expected
19 These are all examples of the so-called relative approach to asset pricing: the value of a specific risky investment is
determined taking the value of all the other assets as given. See Cochrane and Saa-Requejo (2000) for other applications of this relative approach. One prominent example is pricing options.
20 See Wang et al (2008) for a more detailed illustration in a general-equilibrium framework. 21 The real-world analogy is a so-called special purpose vehicle, which is a pure financing arrangement off the balance sheet of
the sponsoring institution. It involves virtually no operational activities.
2010June

13ECB
Working Paper Series No 1204
rate of return on the loan to firm i with balance itA ; further denote total balance of the loan portfolio as At
and the average rate of return on the portfolio as Atr . Then the expected interest income on the portfolio
can be expressed as
(2) A i it t t ti
r A A r , with it ti
A A and A it i ti
r w r
ii t tw A A is the weight of loan i in the portfolio. Note that A
t tr A is also the expected dividend
payment to the households who own the bank.
The correctly imputed value of bank service output should be zero on average since by design the banks produce no real services.22 This is exactly the result if the value of services is imputed as the bank’s total income net of its risk-adjusted cost of funds, that is, 1ˆ( ) 0A A
t t tA r r , because
1 1ˆ ˆ( ) 0A A i it t i t ti
r r w r r , where 1ˆitr and 1 1ˆ ˆA i
t i tir w r are the realized rate of return on loan i
and on the portfolio, respectively.
In contrast, if the value of services is imputed by subtracting risk-free returns from total income, as in the existing national income accounting practices, then on average the bank will be credited with producing positive output of services, since in general the expectation of 1ˆ 0A F A F
t t t tr r r r .23 This result
follows directly from expanding (1), which applies to itr and hence also to A
tr , and substituting 1 Ftr
for 11 E ( )t tm (which is itself an application of (1) to risk-free assets):
(3) 1 1(1 )[1 cov( , )] 1A F At t t tr r r m .
Ftr is the yield on a debt not subject to any risk24 (e.g., default), nor with any embedded options.25 US
Treasury’s are the best example.26 Ftr only compensates investors for sacrificing current for future
consumption with certainty. A security with risky payoff that cannot be diversified away and is (negatively) correlated with the stochastic discount factor, however, must in expectation pay a return premium 1 1cov( , )t tr m , to make up for the risk-induced disutility.27 This premium is positive for
almost all risky assets (see any finance text, e.g. Campbell, Lo and MacKinlay, 1997).
This stylized example serves to intuitively highlight the conceptual problem of using the risk-free rate to impute bank output. Wang (2003) and Wang et al (2008) show that similar overestimation of bank output
22 To the extent the portfolio is sufficiently diversified and the persistence in aggregate shocks is accounted for, realized returns
averaged across firms should basically equal the conditional expectation. 23 The mirror image of this over-counting of bank output is the under-counting of borrowing firms’ output – reduced on average
by ( )A Ft tr r simply because of the change in accounting method.
24 This stylized example refers to a one-period ahead model, so that maturity does not really play a role; see also Section 3.1.3. 25 Yields on bonds must be adjusted for the embedded option to be comparable with those on option-free debt instruments.
Bonds that allow prepayment, such as MBS, essentially have an embedded call option. 26 They are typically considered risk-free in that they earn a guaranteed return, F
tr , if the debt is held till maturity. Note that even for this type of debt there is still interest rate risk, that is, the holding-period return is almost surely uncertain if one sells it prior to the maturity date.
27 In the consumption-CAPM model, which can be expressed as a specific case of (1), this means assets with payoff positively correlated with consumption growth have to pay a positive return premium.
2010June

14ECBWorking Paper Series No 1204
arises in the realistic case where banks provide actual services – processing information and transactions – for which no explicit fees are charged but implicit compensation is earned via an interest rate spread.
To infer the value of such implicitly priced services as part of banks’ net interest income, Wang (2003) solves for the optimal interest rate charged by a value-maximizing bank when making loans with the same (systematic) risk profile as a type of existing market debt. The usual first-order condition gives rise to the following expression for the rate of return (denoted A
tr ) the bank should expect to earn on a loan
portfolio:
(4) A M St t tr r r .
t 1E ( )M Mt tr r is the expected rate of return demanded by investors on the market debt with the same risk. S
tr represents what we shall call the service spread, which generates the extra interest that compensates
the bank implicitly for processing the loan. The optimal service spread Str in (4) satisfies the condition
that the extra interest receipt, St tr A , equals the (weighted average) marginal cost of processing a loan
multiplied by the optimal markup.28 This markup is determined by competition in the loan market.
In the nomenclature of the 1993 SNA, Mtr in (4) is called the reference rate – serving as reference for the
cost of funds on the loan. For a market rate to be the proper reference, the security should not only have similar risk, but banks should also face the same marginal tax rate and transaction costs faced by typical investors in the reference market debt.29 We argue that this is likely a reasonable assumption for the reference rates used in our empirical exercise, since most of the market securities chosen as references for bank loans are backed by securitized pools of loans, such as mortgage-backed securities (MBS), and the securities are routinely held on bank balance sheet along with those same categories of loans. That is, by revealed choices of asset allocation, banks appear to consider these securities as offering similar rates of return as the corresponding categories of loans. The reference rate for a portfolio of loans (of varying types, maturities and rate-reset dates) is then a weighted average of rates on the individual loans.
3.1.3 Imputing the value of implicit bank services
Derivations in the previous section imply that, on average, a bank’s nominal output of implicit lending services to borrowers should equal ( )S A M
t t t t tr A r r A . But neither of the expected rates of return, Atr
and Mtr , is observed. So, for empirical estimations, we make use of the relationship that the expected rate
28 That is, the bank charges an implicit price for its intermediation service, equal to a markup on the marginal cost of producing
that service. The cost is determined by a loan officer’s labour input in processing a loan, plus the amount of physical capital and supplies used for that task.
29 For banks, additional distortions are introduced if deposit insurance is not fully risk sensitive (see Wang, 2003 for a detailed treatment). Here we assume that deposit insurance is fairly priced for the banking industry as a whole, and ignore distributional effects.
2010June

15ECB
Working Paper Series No 1204
of return on a defaultable debt equals its promised yield to maturity (that is, the contractual interest rate, denoted k
tR ) corrected for its expected loss rate due to default (denoted ktd ):30
(5) k k kt t tr R d , k = M, A.
t 1E ( )k kt td d , where k
td is the (random) default loss rate. For market securities, MtR ’s are generally
observed while Mtd ’s can be estimated using time series data.31 Similarly, for loans, A
td ’s can be
estimated as well, while AtR ’s are covered in official statistics (at least in the euro area). Substitute (5)
into (4) and we can impute the output of lending services as:32
(6) tMt
At
Mt
Att
Mt
Mt
At
Att
St
At AddRRAdRdRArY .
For the purposes of this paper, due to lack of information on expected default rates, we will assume that 0M
tA
t dd , leaving such measurement problem for future research.
Hence reference rates vary across loan types, depending on risk characteristics of the loans or portfolio of loans associated with the services considered. In contrast, the use of a (nearly) risk-free rate as the reference rate would imply an overestimation of output:
(7) A F S P A Pt t t t t t t t tr r A r r A Y r A ,
where P M Ft t tr r r is the return premium of the reference risky market securities over (maturity-
matched) risk-free securities; it equals 1 1(1 )cov( , )F Mt t tr r m (see (3) above).
As described above, the methodology set up in 1995 ESA goes even further, proposing the use of a short-term risk-free rate 'F
tr as the reference rate, thus including the term premium as productive service:
(8) tP
tT
tA
ttP
tT
tS
ttF
tA
t ArrYArrrArr ' ,
where 'Ft
Ft
Tt rrr is the term premium.
The value of output imputed according to (8) will overstate the actual value of service output. According to some, the informal justification for (8) is that t
Tt Ar and t
Pt Ar are regarded as compensation for
rendering so-called “maturity transformation” and “risk-bearing” services. The conceptual framework presented in this paper argues against this treatment. First, the term premium entails no service as it simply reflects the assumptions about future interest rates as well as the compensation of the investors for having their money tied up for a longer period, including the added risk of the greater price uncertainty. In turn, Wang and Basu (2007, Section 3.4) discuss at length why risk bearing is not a productive service according to the conceptual framework of 1993 SNA. More importantly, they show that the National
30 k
td equals the product of the probability of default (PD) and the expected loss rate given default. If the latter is near 100%,
then ktd is close to the PD. Wang (2003) details the distinction between promised yield and expected rate of return. The
equation here is exact only for instantaneous returns, and is used as an approximation in discrete-time cases. See Duffie and Singleton (2003) for continuous-time models of defaultable debt pricing.
31 The conditional estimate of Mtd , such as KMV’s EDF, is procyclical.
32 See Wang et al (2008) for a detailed discussion of how the actual value in each period still deviates from this average.
2010June

16ECBWorking Paper Series No 1204
Accounts imputation results in inconsistent accounting of the output of borrowing firms, by making firms’ measured value added depend on their sources of funding. Suppose two firms are identical, but one borrows from banks and the other from the bond market. Then the firm relying on banks is credited with producing lower value added than the one issuing bonds, even if their actual productive activities are identical. 33
The value of implicit depositor services can be imputed in a similar manner to the new way we imputed the value of implicit lending services. Let Dt denote the deposit balance, and D
tr the interest rate paid; MtR and M
td are defined as above (but the values almost certainly differ). Then nominal output of
depositor services can be imputed as:
(9) D M M Dt t t t tY R d r D .
For insured deposits34, the relevant reference rate should be the risk-free (Treasury) rate, that is, M M Ft t tR r r , since 0M
tP
t dr . For the remaining, uninsured, deposits, M M Ft t tR d r , because
the deposit holders are exposed to some (default) risk in bank asset portfolios. In our empirical application, we abstract from this issue and effectively assume that all deposits are insured, and hence risk-free. Under our working assumptions, equation (9) then simplifies to t
Dt
Ft
Dt DrrY , while the
1995 ESA methodology, based on the short-term risk free reference rate 'Ftr , computes bank output on
deposits as
(10) tT
tD
ttT
tD
tF
ttD
tF
t DrYDrrrDrr ' ,
where 'Ft
Ft
Tt rrr , as above, represents the term premium. It thus follows that the European National
Accounts underestimate the value of depositor services.35
Note that equation (6) implies that if a bank passively holds market securities in its investment portfolio, there are no services provided to the asset issuers (that is, YA = 0), since RA = RM and dA = dM. Likewise, (9) implies zero implicit services (that is, YD = 0) provided to holders of bank term liabilities (commercial paper, market bonds, and privately placed bonds), since the interest rate paid equals the reference rate (RD
33 Default risk management can be viewed as an insurance contract where the lender, acting as a guarantor, charges a premium
(default risk premium) to the borrower in exchange of the risk of his potential default; this premium can thus be viewed as the expected loss of the loan. See also the section on loan guarantees in chapter 17 of the 2008 SNA. Drawing a parallel with the methodology in use to derive the output of non-life insurance corporations, or specifically, of credit insurance institutions may be of some interest in this context. In this case, output is derived as the difference between the collected premiums minus the payments or the calls under the guarantees. This would then argue in favour of the default risk correction, under the recognition that for insurance corporations the correction is done ex-post (discount of ‘realised’ defaults) while in the context of FISIM compilation it would be performed ex-ante (discount of ‘expected’ defaults). On the other hand, the risk assessment is clearly a productive activity that should be incorporated in FISIM; see also Keuning (2008).
34 See Gropp, and Vesala (2004) for an analysis of the impact of deposit insurance on risk taking of banks. 35 It should be underlined that before the financial turmoil in August 2007 perceived risk on the interbank market, measured as
the difference between unsecured and secured interbank lending rates, was rather minimal. Besides deposit insurance this may then argue in favour of limited risk premiums on banks’ deposits. Since the start of the financial market turbulence the spreads between secured and unsecured interbank lending rates have widened considerably, and they have been passed through on deposits rates to a large extent. While this may justify the consideration that deposits are less secured than before, the impact on total FISIM calculation should be minimal as unsecured interbank lending rates are used as reference rates for most deposit categories (accounting, on the average, for about 90% of total deposits placed with other MFIs by households and non-financial corporations) thus guaranteeing that risk premiums are adequately reflected even in this case.
2010June

17ECB
Working Paper Series No 1204
= RM and dD = dM). Also note that under virtually all circumstances (that is, whenever there are equity holders), (rM – dM) in (6) is greater than its counterpart in (9), because bank assets are typically riskier than bank liabilities. In other words, the reference rates for imputing lending and depositor services almost always differ by a positive margin.
So again, recall that Figure 1 illustrates the imputed nominal output value of implicit bank services. In the case of loans only part of a bank’s net interest income constitutes nominal output of bank services; the remainder—corresponding to the risk and term premium in the case of loans, Arr FM ' , —is
excluded. Similarly, in the case of deposits a reference rate that excludes the term premium underestimates banking sector output—by Drr FF ' . The term and risk premiums, along with actual
interest expenses on bank liabilities, constitutes a pure transfer of capital income. It is part of the factor income generated by the capital used in the borrowing firms’ production or in the consumption of consumers. This factor income is then transferred from the end users of funds to the ultimate suppliers of funds—the bank shareholders in case of loans, the depositors in the case of deposits. Only when all investors are risk neutral or all risk is idiosyncratic will this risk premium disappear. Figure 1 illuminates how our model-based output measure differs from the National Accounts’ current measure, which uses a (nearly) risk-free short-term rate as the single reference rate. As we have argued, the National Accounts’ measure incorrectly bank output as they do not reflect term and risk premiums appropriately In the remainder of this paper, we discuss how to estimate the quantitative impact of these components on the measured output of euro area banks.
3.2 The empirical set up36
The methodology developed in this paper to estimate the banking sector output on positions vis-à-vis households and non-financial corporations is mainly based on the use of MFI interest rate (MIR) statistics37. These statistics provide (on a monthly basis and for periods as from 2003) a harmonised and comprehensive coverage of the interest rates applied by euro area credit institutions to resident households and non-financial corporations on euro denominated loans and deposits. These data are available and consistent both at national and euro area level, and distinguish between the interest rate on new business, i.e. newly negotiated interest rates during the period, and rates on outstanding amounts. In addition, detailed breakdowns on deposits are provided both by maturity and by instrument, while for loans the data are broken down by maturity/period of fixation and additionally, in the case of households, by purpose of the loan, i.e. consumer credit, loans for house purchases and other credit. While the current approach implicitly relies on MIR rates on outstanding amounts, the methodology developed in this paper uses statistics on new business. Section 3.2.1 below will discuss some methodological aspects underlying this approach.
36 Although the paper is mainly focused on the derivation of FISIM estimates for the euro area as a whole, the empirical set-up
of the methodology could easily be replicated at national level. 37 The requirements for MIR statistics are laid down in Regulation ECB/2001/18. In particular, it should be underlined that the
reporting scheme defined in the Regulation applies only to other MFIs, thus excluding central banks and MMFs. For further information, see http://www.ecb.europa.eu/stats/money/interest/interest/html/index.en.html.
2010June

18ECBWorking Paper Series No 1204
As described above, another feature of the current approach is the use of the inter-bank rate as the reference rate to evaluate interest margins. The first proposed improvement (in the case of households and non-financial corporations) is to take into account the maturity structure of loans and deposits based on the general government bond yield curve38 and, for short maturities, money market rates; in this paper we use the euro area government bond yield curve derived by Thomson Reuters Datastream based on AAA government bonds issued in the euro area.39 In the absence of detailed information on the average maturity/period of rate fixation for each category of loans and deposits for households and non-financial corporations, the matching with the relevant reference rates has been conducted via a benchmarking exercise based on the estimation of a pass-through equation (using an error-correction modelling framework) against alternative market rates.40 Table A1 in Appendix 1 describes in detail which rate has been identified on the basis of standard model selection criteria for each loan and deposit category under this approach. Overall though, it should be underlined that the results are not very sensitive to the exact reference rates’ choices we make.
Secondly, while deposits are usually considered as (relatively) risk-free investments because of deposit insurance schemes, bank loan rates are higher because of longer maturities but also because of higher risk.41 Data on the yield on bonds, specifically indices of non-financial corporate bonds and of asset-backed and residential mortgage-backed securities can be used to take this into account42. The indices we use are compiled by Merrill Lynch which provides information on the average yield of the bonds after adjusting for option-like features of these bonds. For those indices Merrill Lynch also makes available the average residual maturity of the underlying bonds, thus allowing for a maturity correction to take into account the different average maturity structure of the bond indices compared to the various deposits and loans categories. Section 3.2.2 describes in detail the use of these data in the context of FISIM measurement. Table A2 in Appendix 1 reviews the reference rates applied to each type of loans and deposits for households and non-financial corporations under this more complex approach.
38 The government bond yields are based on (notional) zero-coupon bonds, so the duration of these bonds is equal to its
maturity. Most bank loans will have regular interest payments, so the duration of those loans will be smaller than their maturity. For most maturities, this distortion is likely to be small. Assuming annual interest payments of a 5 percent interest rate, the duration will be on average 10% of a year shorter than the maturity for the bracket of one to five year maturity.
39 An alternative approach would be to rely the interest swap yield curve. Although this could offer interesting perspectives as swap rates reflect banks’ refinancing costs, it does not fully respect the theoretical framework suggested in this paper: while reference rates should include only the term premium, risk components in swap rates (mainly counterparty risk) are rather high and if historically their spreads on government bonds (the so-called swap spreads) were about 35bp up to August 2007, these have increased considerably after the start of the turmoil.
40 Appendix 2 briefly discusses this approach and provides an overview of the results of the estimations. 41 It is important to notice that the dispersion among euro area countries in the level of MFI interest rates is rather high. This
reflects differences in credit risk and market structure but also institutional factors like regulation and taxation; see ECB (2006) for a detailed review of these aspects. Focusing on the housing loans market, Kok Sørensen and Lichtenberger (2007) show that a significant part of the interest rate differences across the euro area are related to country specific institutional aspects such as enforcement procedures, loan-to-value ratios and fiscal arrangements.
42 Another way of indirectly performing the correction would be to use data on loan provisions which may be collected for financial stability purposes by national authorities; in practice this approach may lead to incomparable results due to the lack of harmonisation of statistics on loan provisions across countries.
2010June

19ECB
Working Paper Series No 1204
For the other sectors, as well as for cross border positions, some working assumptions are applied due to lacking basic data; in Section 3.2.3 below we will argue that this approach is likely to lead to more sound estimates compared to the current framework.
Under both approaches, the margins derived at the level of the breakdowns by maturity or period of initial rate fixation are opportunely averaged on the basis of the new business volumes; the resulting average margins for each loan and deposit category are then applied to the total amounts outstanding to calculate the corresponding FISIM.43
3.2.1 Interest rates for households and non-financial corporations
The main aim of our research is to improve the estimates of interest margins applied by banks on loans and deposits to reflect the services they provide. A first question is whether to use the ‘new business’ (NB) or ‘outstanding amounts’ (OA) rates as the basis for comparison. While the estimated margin should be relevant for the entire portfolio of bank loans in that category thus arguing for OA rates, a drawback of this approach is that the correct reference rate is difficult to define as many such loans have interest rates that were agreed some years before. Ideally, the reference rate should then be a weighted average of past bond yields, where the weights reflect the share of loans from each period in the past that are still on banks’ balance sheets.
In addition, current definitions of NB and OA interest rates are not homogeneous for different maturities. NB rates are categorised according to the initial period of rate fixation while OA rates are categorised according to the original time to maturity of the loan44. Hence, for instance, if a loan has an original maturity of seven years, but rates are renegotiated annually, it would be more appropriate to compare the interest rate on this loan to the yield on a bond with a time to maturity of one year rather the seven years.45 Given these considerations, we will rely on the NB rates to calculate the interest margins46.47
43 It can be argued that this approach could lead to overestimating the total value of the banking sector output as some of the
services on loans, for instance, could be provided only at the time of agreeing on or renegotiating the terms. This bias should be anyway non-significant for non-financial corporations as most these loans have initial rate fixation below one year, but could be more problematic for households. Still, this approach looks more sound than relying on new business volumes only, thus neglecting those services that are provided during the entire life span of deposits and loans.
44 For a detailed discussion of the characteristics of MIR statistics, see also the “Manual on MFI interest rate statistics.” 45 Following the implementation of the new requirements for MIR statistics as set-up in Regulation ECB/2009/7, new data will
become available to partly address this limitation. In particular, data will be collected on new business loans to non-financial corporations with period of initial rate fixation below one year and original maturity over one year.
46 In this paper we do not take into consideration interest rate statistics on bank overdrafts that are available in the context of MIR statistics. In fact, this category currently includes negative balances on current accounts, revolving loans (including those obtained through a line of credit) and, in some countries, also loans without fixed maturity. The difficulty of matching the resulting interest rates with reference rates reflecting maturity and risk characteristics of these instruments leads us to leave them out of the scope of the paper. It should also be underlined that in the case of households these statistics would not be available broken down by purpose of the loans, thus further complicating their usability.
47 All MIR statistics used in this paper relate to so-called annualised agreed rates, i.e. rates individually agreed, converted to an annual basis and covering all interest payments but no other charges that may apply; see also the MIR statistics manual cited above. It should also be underlined that under the MIR Regulation interest rate statistics on new business for consumer credit and loans to households for house purchases are also derived reflecting the so-called annual percentage rate of charge (APRC), i.e. the effective lending rate that includes other charges such as administration and legal fees, as well as, in the case of some euro area countries, advertisement and opening commissions, credit insurance premiums, etc. Those charges though are not relevant in the context of FISIM measurement as they are typically directly invoiced and therefore are already part of the banking sector output.
2010June

20ECBWorking Paper Series No 1204
3.2.2 Reference rates on loans to non-financial corporations and households: discussion of the data in case of full adjustment
The proposed method requires data on the current market yield of different types of debt securities with a broad coverage of the euro area market. Therefore, bond indices are preferred over individual bonds. The bond indices compiled by Merrill Lynch satisfy these criteria.48
In particular, Merrill Lynch publishes a range of bond indices for non-financial corporations broken down by rating category, but only their overall non-financial corporations bond index, which has an average rating between BBB and A, is available broken down by maturity band. Our choice is for the latter as it allows the matching with the various interest rate categories (possibly after adjusting for the differences in maturity/fixation period characteristics).49
Figure 2 compares the interest rate on new business loans to non-financial corporations with period of rate fixation between one and five years with the corresponding one to five years corporate bond yield adjusted to a maturity of one year and the one year government bond yields (see Table A2 in Appendix 1).50 As expected, the loan rate is higher than the (adjusted) corporate bond yield, which in turn is higher than the government bond yield. In June 2008 the spread was slightly negative, but otherwise the picture is consistent. As the more complete analysis below will demonstrate, negative spreads occur in some other instances as well. There we will discuss possible reasons why margins may become negative in theory and in practice. Overall, the Merrill Lynch bond index for non-financial corporations in the corresponding maturity bands does capture the main developments that also affect loan rates. This may be seen as the financial market indicator with the most similar characteristics. It is also worth noting that from the summer of 2007 to (at least) end-2008, due to the financial market turmoil the spread of the corporate yield over the government bond yield has widened.51 The spread has peaked at the end of the first quarter of 2008 when a substantial “flight to security” effect pushed down government bond yields. Interest rates on bank loans to non-financial corporations have also risen though the risk-adjusted interest margins have been broadly stable, although in the course of the second quarter of 2008 the worsening of
48 See www.mlindex.ml.com for these data as well as the bond index rules and definitions. Merrill Lynch does not produce
country-specific bond indices as most national debt markets within the euro area do not have the characteristics for the derivation of reliable and meaningful bond indices.
49 This approach is thus implicitly based on the assumption that the risk characteristics of bank loans are similar, on average, to those of the corporate bonds included in the overall Merrill Lynch index. This may seem in general rather disputable. On one side, one may claim that most borrowers (at least by number) are not investment grade or anyway unable to obtain financing on capital markets, so that the credit risk of their bank loans would be typically higher than on corporate bonds. On the other side, in many cases banks engage in long-term relationships with their borrowers and thus obtain additional information than what is available to capital market participants, so that the price on default risk demanded by the bank might be lower. In particular, the former factor seems to mostly affect small-sized loans (below €1mln), while the second should be mostly relevant for large-sized loans (above €1mln). While separate interest rate statistics are available under the MIR framework for these two categories of loans to non-financial corporations, their matching with reference rates that would address the issues described above is not easy and might represent an interesting area for future research. One possible approach could rely on the use of Moody’s KMV data that include statistics on expected default frequencies for a large set of euro area non-financial corporations, including smaller-sized companies.
50 The interest rate for non-financial corporations refers to loans with an initial interest rate fixation period between one and five years and is the rate on new business. The corporate bond and government bond yields are defined to match this maturity band.
51 The spreads of bonds of financial corporations have widened even more.
2010June

21ECB
Working Paper Series No 1204
the economic outlook and the consequent lack of liquidity on euro area bond markets resulted in a sharp increase of NFC bond yields which have converged to interest rates on business loans.
Figure 2, Interest rate on business loans compared to corporate and government bonds (%), 2003:1-2008:6
0.0
1.0
2.0
3.0
4.0
5.0
6.0
7.0
Jan-2003
Apr-2003
Jul-2003
Oct-2003
Jan-2004
Apr-2004
Jul-2004
Oct-2004
Jan-2005
Apr-2005
Jul-2005
Oct-2005
Jan-2006
Apr-2006
Jul-2006
Oct-2006
Jan-2007
Apr-2007
Jul-2007
Oct-2007
Jan-2008
Apr-2008
Bank loan rate (NB)Corporate bond yieldGovernment bond yield
Sources: ECB (MIR interest rates), Thomson Reuters Datastream (Government bonds), Merrill Lynch (Corporate bonds)Notes: All series for the euro area. Bank loan rate refers to loans to non-financial corporations with an initial rate fixation between 1 and 5 years. Corporate bond yield is the yield on the Merrill-Lynch bond index for non-financial corporation bonds with a remaining maturity between 1 and 5 years, adjusted using government bond yields to a 1-year maturity. Government bond yield is the 1 year constant maturity bond yield
This illustrates the unappealing choice in troubled financial times: one could either rely on government bond yields and see a sharp widening of interest margins or use corporate bond yields and see a contracting interest margin. Using government bonds probably overstates margins by more in the recent period: why would loans that used to require only about 0.7 percentage points of service margin require in the current market developments up to 2.5 percentage points? On the other hand, a disappearing margin is likewise implausible.
For loans to households, it is more challenging to compute interest-rate margins since households do not generally raise funds directly from financial markets. Here the most comparable security is securitized debt. Securitization is a means for banks to fund further credits as, in its traditional form, it enables to remove loans from balance sheet and thus frees up capital to grant new loans. The main advantage of securitization is to enable banks to specialize in what they do best, namely originating and monitoring debt. However, an important reason for banks to originate a loan for a household in the first place is that the fixed cost of gathering and processing credit information on households is too burdensome for decentralized financial markets. To allow these loans to be sold in secondary markets in form of asset backed securities (ABS) or residential mortgage backed securities (RMBS), a group of similar loans is pooled and usually divided into tranches. Defaults in this loan pool will first be borne by the junior tranches and the senior tranches will be affected last. As a result, the senior tranches commonly receive an AAA credit rating from rating agencies. The current financial market turmoil has raised questions about whether these ratings are a good reflection of risk, in particular in the face of high default rates on
2010June

22ECBWorking Paper Series No 1204
mortgages of subprime borrowers in the US. However, for our proposed method, what is relevant in principle is the perceived risk by banks at the time the loan is originated52.
The limited size of the ABS and RMBS market in Europe compared to the corporate bond market also deserves some considerations. While the overall Merrill Lynch bond index for non-financial corporations covers around 700 corporate bonds, their index for ABS and RMBS covers only some 30 bonds.53 This means that for Europe we only have a single index that covers all maturities and credit ratings, with most securities AAA-rated54.55 Despite the small number of securities, the yield spread over government bonds is quite stable, highly correlated with the yield spread of AAA corporate bonds (0.85) and almost the same size on average56.57
As the Merrill Lynch ABS/RMBS index has an average residual maturity of around six years, the spread over the six-year government bond index for each fixation period band is applied for the matching.
52 Recent literature has elaborated on various agency problems raised by securitisation and resulting in misalignments between
perceived risks by banks and on the market. For instance asymmetric information may lead to downward biases in ABS/RMBS spreads when the loan quality deterioration is not fully recognised by investors and rating agencies. In addition, once the default risk is transferred the bank may have a little incentive to monitor the borrowers and to restructure the underlying loan portfolios. For a comprehensive review of these and other agency problems related to securitisation, see Franke and Krahnen (2008) and references therein.
53 By comparison, similar indices for the US cover around 3000 corporate bonds and 1500 RMBS or collateralized mortgage obligations (CMOs).
54 Merrill Lynch only provides occasional snapshots of the composition of the index and these suggest limited differences between the components. Given the scarcity of information, this is a tentative finding.
55 As a result of financial engineering the default risk on the most liquid RMBS and ABS is supposed to be minimal and the main reason for the positive spread over risk-free government bonds is prepayment risk; see e.g. Rothberg et al (1989). Thus, under normal circumstances the yield from these RMBS and ABS will be too low compared to the risk associated with the bank loans. However, if the risk is higher, banks will presumably also go to greater lengths to gauge the credit worthiness of borrowers, so the service margin for those types of loans is also likely to be higher. One concern in the current climate is that the opacity and heterogeneity of RMBS and ABS leads to illiquidity. Also, there is an ongoing reassessment of the value of credit ratings and the default risk of these securities. As a result, in current periods yields on these securities are possibly higher than warranted by the underlying default risk or the index composition may have changed to include more lower-rated securities.
56 The average spread for AAA corporate bonds was 0.33 percentage points over the period 2003-2007 and for the RMBS/ABS bonds it was 0.35 points.
57 A natural alternative to ABS/RMBS securities could be covered bonds. Also in this case, the securities are backed by a pool of assets (typically mortgages or public debt) but the issuer must ensure that such pool consistently backs the instrument. This scheme undermines the linkage between the risk characteristics of covered bonds and the underlying pool of assets, thus questioning their usage in our approach to FISIM measurement. Other paths are being investigated to improve this framework. For example, the development of new statistics on short-term European paper (STEP), which also cover asset-backed commercial paper, might offer some interesting prospects. For further information on STEP, see http://www.ecb.eu/stats/money/step/html/index.en.html). More in the medium to long term horizon, the enhancement of the collection of securities statistics on a security by security basis and the related development of the so-called Centralised Security Database (CSDB) in the euro area could also allow the derivation of more refined yield curves to be used in the framework of FISIM measurement as described in this paper.
2010June

23ECB
Working Paper Series No 1204
Figure 3, Interest rate on housing loans compared to ABS/MBS and government bonds (%), 2003:1-2008:6
0.0
1.0
2.0
3.0
4.0
5.0
6.0
Jan-2003
Apr-2003
Jul-2003
Oct-2003
Jan-2004
Apr-2004
Jul-2004
Oct-2004
Jan-2005
Apr-2005
Jul-2005
Oct-2005
Jan-2006
Apr-2006
Jul-2006
Oct-2006
Jan-2007
Apr-2007
Jul-2007
Oct-2007
Jan-2008
Apr-2008
Bank loan rate (NB)ABS/MBS bondsGovernment bond yield
Sources: ECB (MIR interest rates), Thomson Reuters Datastream (Government bonds), Merrill Lynch (ABS/MBS)Notes: All series for the euro area. Bank loan rate refers to loans to household for house purchases with an initial rate fixation between 1 and 5 years. ABS/MBS bonds is the yield on the Merrill-Lynch bond index for asset-back and mortgage backed bonds, adjusted using government bond yields to a 4-year maturity. Government bond yield is the 4 year constant maturity bond yield
Figure 3 shows the interest rate on household loans for housing purposes with period of rate fixation between one and five years compared to the ABS/RMBS series on yields adjusted to a residual maturity of four years and the corresponding four year government bond yield. The interest margin for this type of loans varies more than the corporate margins as the inertia of bank interest rates seems greater. On the other hand, the interest margin stays positive throughout the period, with the exception of June 2008. As for NFCs, periods following the financial turmoil are strongly influenced by the developments on the financial markets. While the implicit risk premium measured by the government bond spread of ABS/RMBS securities index has widened, seemingly in line with the underlying causes of the credit crisis, this market has become almost fully illiquid and cannot, in the context prevailing in the second half of 2008, represent a good proxy for the household loans on banks’ balance sheets. For instance, this may be the reason underlying the negative margin in June 2008.
3.2.3 The treatment of other sectors
Loans and deposits of non-financial corporations and households represent about 80 percent of total outstanding amounts of loans and deposits positions involving non financial counterparties. For these sectors, the new methodology proposes to derive interest margins on each instrument by comparing the MFI interest rate on new business with the corresponding reference rate which represents the yield on market securities with similar characteristics. Loans and deposits of other domestic sectors, i.e. the government and insurance companies and pension funds, represent another 11 percent while loans and deposits from the rest of the world make up the remaining 9 percent.58 Little is known about these loans and deposits except their overall size; especially data on corresponding interest rates are not available.
58 These shares are based on the average balance sheet composition over the period from January 2003 to June 2008. Loans and
deposits of financial institutions are omitted as under the current FISIM regulation, a sector can be either a FISIM producer or user, not both. As the focus of this analysis is on different margin estimates, we stay comparable in the coverage of sectors.
2010June

24ECBWorking Paper Series No 1204
In the case of other domestic sectors, we assume that the interest margins are the same as for non-financial corporations. This differs from the current approach, where the margin is calculated as a residual of the sectoral interest rates on loans and deposits after comparison with the common reference rate.59 Here we assume constant margins, thus allowing the (implicit) reference rates to be different. Our approach is justifiable on various grounds. First, loans and deposits to non-financial corporations likely involve similar financial services as those to the government60 and insurance companies and pension funds. Second, in many countries banks’ business with these sectors (mainly insurance corporations) has a very long maturity and negative margins may result in the framework of the current FISIM methodology. Last, given the lack of data on interest rates and flows for these sectors, the current FISIM method seems to involve a higher degree of estimation than the alternative proposed.
When deriving euro area estimates for residents in the rest of the world, we assume that they buy the same services as euro area residents. This may be not fully correct as, for example, screening costs incurred by banks might be higher for non-resident borrowers. Still, this assumption seems more plausible than using, for example, foreign margins (if those were available) as, presumably, foreign customers buy financial services from euro area banks rather than their own banks only if their cost appears reasonable to them. As no breakdown by sector is available in MFI balance sheet statistics for positions vis-à-vis residents of the rest of the world not belonging to the MFI or government sector, we use in this case a weighted average of euro area margins based on the sectoral composition of cross-border balances of loans and deposits within the euro area.
Applying this logic for individual euro area countries would require using domestic margins for exports from one euro area country to another and foreign margins for imports from another euro area country. For imports61 from outside the euro area this is not feasible, so domestic margins will have to be used there as well. This approach to the import and export of FISIM also differs from current methods. Currently, the external reference rate should be compared to market interest rates on cross-border positions within the euro area and for the rest of the world.62 In view of the lack of reliable and detailed sectoral data on interest rates and margins for the positions with extra euro area residents, the proposed method has the advantage of conceptual clarity and is more appealing from our point of view since it focuses on the services provided, rather than trying to estimate the service margin as a residual based on
59 For the purpose of simulating FISIM results under the current methodology, interest rates on loans to the general government
and insurance corporations and pension funds are estimated using financial market data, while the corresponding interest rates on deposits are assumed to be the same as for NFCs.
60 For the government sector this may not be the case as most transactions (at least those with the central government) are likely to be rather automated and involve high volumes, thus implying small service components. On the other side this sector has a little weight on the overall deposits and loans activities of the euro area banking sector, thus implying a small impact on the final estimates.
61 The paper is focused on the output of euro area banks and therefore the treatment of the services imported by euro area residents is not crucial for our discussion. Nevertheless its relevance for the compilation of non-financial accounts leads to include it in our discussion.
62 In our simulation of the current FISIM official methodology, both the external reference rate and the cross-border interest rates are based on estimated interest flows which are respectively derived from inter-bank rates (EURIBOR, LIBOR) for the inter-bank component, from MIR rates for the intra euro area positions vis-à-vis non-banks, and from balance of payment statistics for the positions vis-à-vis extra euro area non-bank residents.
2010June

25ECB
Working Paper Series No 1204
two sets of statistics possibly involving a high degree of estimation and which are neither fully complete nor consistent.
4. FISIM calculations
4.1 Interest margins
So far we have discussed what data we use on loan and deposit rates for households and non-financial corporations, namely interest rates on new business from the MIR statistics. We also described our approach to matching these interest rates to comparable securities traded in the financial markets and how to estimate interest margins for the other sectors. We can now move to a discussion of the interest margins as estimated in our framework. In the case of loans, the interest margin we calculate is the excess a borrower has to pay compared to the market rate to compensate the bank for the information services provided. For deposits, it is the opposite: how much less a depositor is willing to accept than the market rate in return for the transaction services the bank provides.
Table 1 gives the broadest set of results on interest margins by comparing the estimates on the different financial asset categories for the euro area as a whole in the case of households and non-financial corporations.63 Our analysis uses monthly data from January 2003 to June 2008, thus covering 66 months (the entire span of the MFI survey on interest rates). We compare three sets of interest margins. The first set is calculated by simulating the current approach where implicit interest margins can be obtained by comparing MIR rates on outstanding amounts to the internal reference rate. The second set takes into account that for longer-term financial assets a term premium is paid, estimated by the yield spread of long-term over short-term government bonds. For loans, we also calculate a third set, where the default risk is taken into account by using data on corporate bonds and asset and residential mortgage-backed securities. Under the new proposed framework, MIR statistics on new business are used and for all instruments a weighted average margin is compiled across maturities in the case of deposits and across bands of initial interest rate fixation periods in the case of loans using the shares in new business volumes as weights. For each set of margins, we compare four statistics, namely the average over the period, the standard deviation, the coefficient of variation and the number of negative margins. For a more complete overview, the interested reader is referred to Appendix 3 which, for each sector and type of loan and deposits, presents in form of time series the three sets of estimated margins, together with the corresponding interest and reference rates.
63 Under the MIR Regulation, no interest rate statistics on deposits redeemable at notice placed by non-financial corporations
are collected given the small significance of this category in the euro area. Our working assumption with this respect is that non-financial corporations are granted the same interest rates as households on these instruments. In addition MIR statistics on repurchase agreements are collected without a breakdown between households and non-financial corporations; therefore for our purposes we use the overall interest rate series as a proxy for the sectoral breakdowns.
2010June
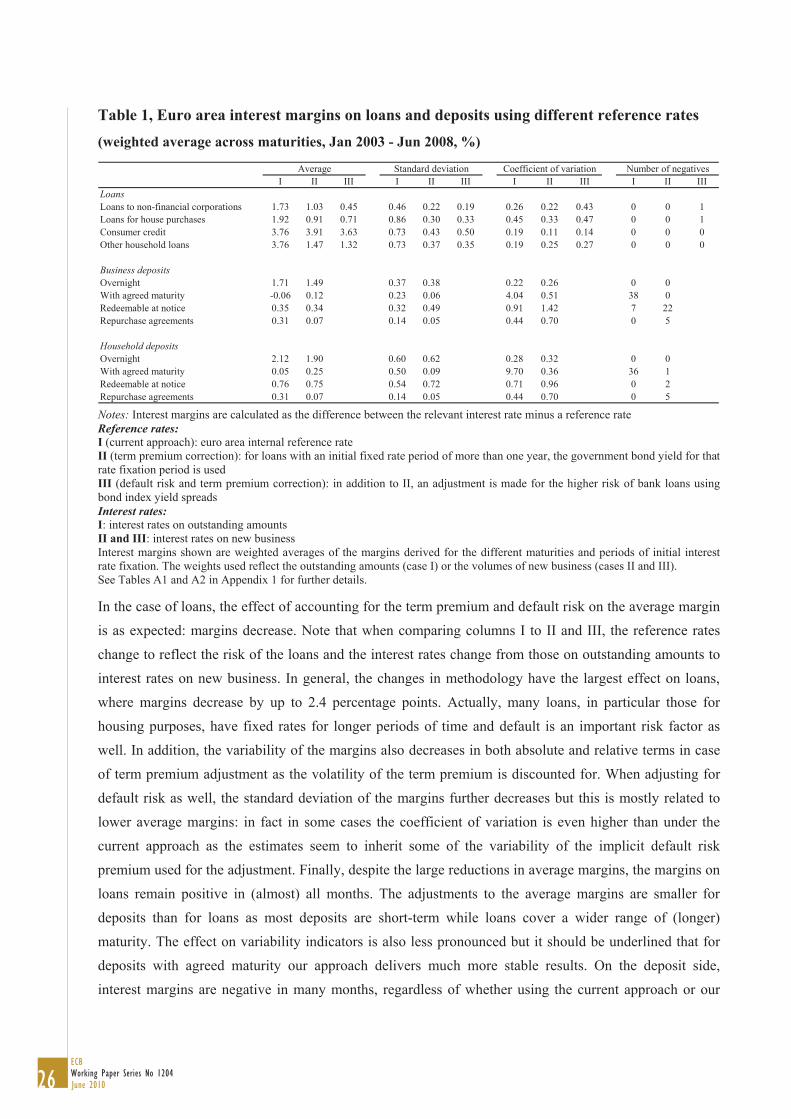
26ECBWorking Paper Series No 1204
Table 1, Euro area interest margins on loans and deposits using different reference rates (weighted average across maturities, Jan 2003 - Jun 2008, %)
I II III I II III I II III I II IIILoansLoans to non-financial corporations 1.73 1.03 0.45 0.46 0.22 0.19 0.26 0.22 0.43 0 0 1Loans for house purchases 1.92 0.91 0.71 0.86 0.30 0.33 0.45 0.33 0.47 0 0 1Consumer credit 3.76 3.91 3.63 0.73 0.43 0.50 0.19 0.11 0.14 0 0 0Other household loans 3.76 1.47 1.32 0.73 0.37 0.35 0.19 0.25 0.27 0 0 0
Business depositsOvernight 1.71 1.49 0.37 0.38 0.22 0.26 0 0With agreed maturity -0.06 0.12 0.23 0.06 4.04 0.51 38 0Redeemable at notice 0.35 0.34 0.32 0.49 0.91 1.42 7 22Repurchase agreements 0.31 0.07 0.14 0.05 0.44 0.70 0 5
Household depositsOvernight 2.12 1.90 0.60 0.62 0.28 0.32 0 0With agreed maturity 0.05 0.25 0.50 0.09 9.70 0.36 36 1Redeemable at notice 0.76 0.75 0.54 0.72 0.71 0.96 0 2Repurchase agreements 0.31 0.07 0.14 0.05 0.44 0.70 0 5
Average Coefficient of variation Number of negativesStandard deviation
Notes: Interest margins are calculated as the difference between the relevant interest rate minus a reference rate Reference rates: I (current approach): euro area internal reference rate II (term premium correction): for loans with an initial fixed rate period of more than one year, the government bond yield for that rate fixation period is used III (default risk and term premium correction): in addition to II, an adjustment is made for the higher risk of bank loans using bond index yield spreads Interest rates: I: interest rates on outstanding amounts II and III: interest rates on new business Interest margins shown are weighted averages of the margins derived for the different maturities and periods of initial interest rate fixation. The weights used reflect the outstanding amounts (case I) or the volumes of new business (cases II and III). See Tables A1 and A2 in Appendix 1 for further details.
In the case of loans, the effect of accounting for the term premium and default risk on the average margin is as expected: margins decrease. Note that when comparing columns I to II and III, the reference rates change to reflect the risk of the loans and the interest rates change from those on outstanding amounts to interest rates on new business. In general, the changes in methodology have the largest effect on loans, where margins decrease by up to 2.4 percentage points. Actually, many loans, in particular those for housing purposes, have fixed rates for longer periods of time and default is an important risk factor as well. In addition, the variability of the margins also decreases in both absolute and relative terms in case of term premium adjustment as the volatility of the term premium is discounted for. When adjusting for default risk as well, the standard deviation of the margins further decreases but this is mostly related to lower average margins: in fact in some cases the coefficient of variation is even higher than under the current approach as the estimates seem to inherit some of the variability of the implicit default risk premium used for the adjustment. Finally, despite the large reductions in average margins, the margins on loans remain positive in (almost) all months. The adjustments to the average margins are smaller for deposits than for loans as most deposits are short-term while loans cover a wider range of (longer) maturity. The effect on variability indicators is also less pronounced but it should be underlined that for deposits with agreed maturity our approach delivers much more stable results. On the deposit side, interest margins are negative in many months, regardless of whether using the current approach or our
2010June

27ECB
Working Paper Series No 1204
suggested alternative. Margins for the sizeable deposit categories (overnight and with agreed maturity) are less prone to being negative.64
There are both conceptual and practical reasons that may explain temporarily negative interest margins. First, banks may accept small or even negative margins if a borrower or depositor brings in income from deposits or fees for other services. The analogy with a supermarket is useful here: they often price visible brand-name products at or below cost to draw in customers, who then spend on other goods. Second, long-term business relationships may also play a role: in times of rising market interest rates, banks may not raise their loan interest rates by as much or ration credit in return for more favourable margins in periods of lower market rates. There may be some support for this in the data as many of the loan interest rates are less volatile than the corresponding reference bonds. This is in general indicative of imperfect pass-through of market interest rates to retail bank interest rates. Our finding of more negative interest margins for deposits than for loans is also consistent with the pass-through literature, where deposit rates are generally found to be more inelastic.65
A more practical reason for some of the negative margins may be shortcomings in the available data, such as mismatches between interest rates and bond indices in terms of maturities and risk profiles. For example, the two negative values on loans refer to June 2008 and in both cases the bond indices used as reference rates show sharp increase which are not matched in the interest rate data (see also Appendix 3)66. Similarly, for deposits with an agreed maturity of more than two years we have selected five-year government bonds as the reference rate for households. However, in Germany deposits are on offer with much longer maturities so that a ten-year government bond might have been a more representative security. In some countries bank loans to creditworthy firms may also be more prevalent, making a corporate bond with a high credit rating a better choice. Another reason for the observed negative margins may be sampling error in the MIR survey. The evidence for this is somewhat circumstantial, but the interest rates of relatively uncommon loans and deposits tend to be more volatile.67
64 In particular, it should be outlined that most of our negative margins refer to deposits redeemable at notice by NFCs, which
only account for about 3% of the total NFCs deposits. 65 See, for instance, Hannan and Berger (1991), Berger and Udell (1992), Elsas and Krahnen (1998), Berlin and Mester (1999),
Boot (2000), Mojon (2001), De Bondt (2005) and De Graeve et al (2007). Besides relationship banking, other factors can contribute to the sluggishness of bank interest rate pass-through. For example, customer switching costs for retail bank products can make demand inelastic to price changes (Calem et al (2006)). In addition, when banks set their interest rates they take into account the fixed costs of adjusting their retail rates and they may opt for no adjustments especially when changes in policy rates are perceived as temporary or are minor (see e.g. Hannan and Berger (1991) and Hofmann and Mizen (2004)). Banks also tend to react differently depending on whether policy rates are moving up or down (i.e. the so-called asymmetric pass-though; see, for instance, Mester and Saunders (1995), Sander and Kleineier (2004) and Grop et al (2007)). Furthermore a higher degree of competition is expected to have a positive impact on the speed and degree of the pass-through (Sander and Kleimeier (2004), and Van Leuvensteijn et al (2008)).
66 As described above, the margins shown in Table 1 are compiled as weighted averages across maturities in the case of deposits and across bands of initial interest rate fixation periods in the case of loans. Hence while Figure 2 shows some negative margins for loans to NFCs with a fixation period between one and five years in the course of 2003, no negative margins are derived for total NFCs loans over that period.
67 Volatility is measured as the standard deviation of the interest rates and we get an indication of how common an instrument is in the country by calculating the average volume of new business for the instrument over the entire period and normalizing by the average across all instruments.
2010June
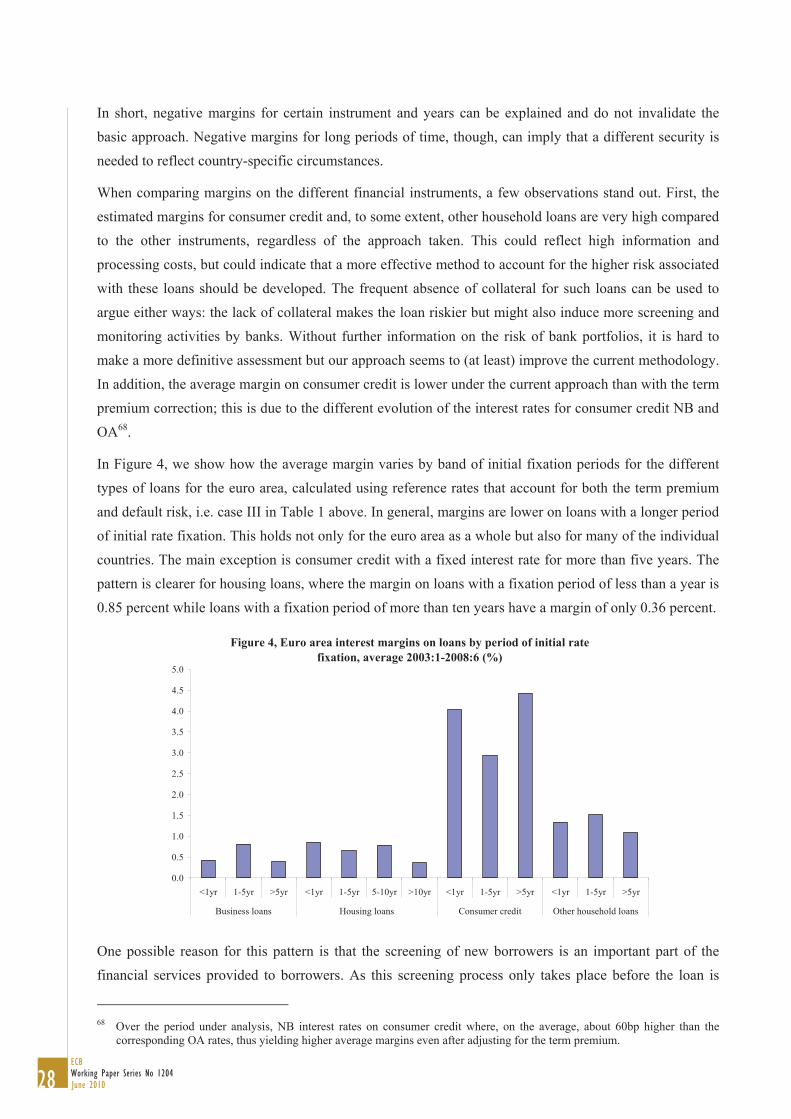
28ECBWorking Paper Series No 1204
In short, negative margins for certain instrument and years can be explained and do not invalidate the basic approach. Negative margins for long periods of time, though, can imply that a different security is needed to reflect country-specific circumstances.
When comparing margins on the different financial instruments, a few observations stand out. First, the estimated margins for consumer credit and, to some extent, other household loans are very high compared to the other instruments, regardless of the approach taken. This could reflect high information and processing costs, but could indicate that a more effective method to account for the higher risk associated with these loans should be developed. The frequent absence of collateral for such loans can be used to argue either ways: the lack of collateral makes the loan riskier but might also induce more screening and monitoring activities by banks. Without further information on the risk of bank portfolios, it is hard to make a more definitive assessment but our approach seems to (at least) improve the current methodology. In addition, the average margin on consumer credit is lower under the current approach than with the term premium correction; this is due to the different evolution of the interest rates for consumer credit NB and OA68.
In Figure 4, we show how the average margin varies by band of initial fixation periods for the different types of loans for the euro area, calculated using reference rates that account for both the term premium and default risk, i.e. case III in Table 1 above. In general, margins are lower on loans with a longer period of initial rate fixation. This holds not only for the euro area as a whole but also for many of the individual countries. The main exception is consumer credit with a fixed interest rate for more than five years. The pattern is clearer for housing loans, where the margin on loans with a fixation period of less than a year is 0.85 percent while loans with a fixation period of more than ten years have a margin of only 0.36 percent.
Figure 4, Euro area interest margins on loans by period of initial rate fixation, average 2003:1-2008:6 (%)
0.0
0.5
1.0
1.5
2.0
2.5
3.0
3.5
4.0
4.5
5.0
<1yr 1-5yr >5yr <1yr 1-5yr 5-10yr >10yr <1yr 1-5yr >5yr <1yr 1-5yr >5yr
Business loans Housing loans Consumer credit Other household loans
One possible reason for this pattern is that the screening of new borrowers is an important part of the financial services provided to borrowers. As this screening process only takes place before the loan is
68 Over the period under analysis, NB interest rates on consumer credit where, on the average, about 60bp higher than the
corresponding OA rates, thus yielding higher average margins even after adjusting for the term premium.
2010June

29ECB
Working Paper Series No 1204
agreed upon, the associated costs are spread over the life of the loan. Alternatively, it could reflect higher administration costs for loans with variable interest rates. This is likely to be a factor for loans to non-financial corporations: only 13 percent of new loans have a fixed rate for more than one year, but 69 percent on the outstanding loans have an (original) maturity of more than one year. This implies that most loans to non-financial corporations have (fairly) flexible rates and a long maturity. Another possible reason is that only low-risk borrowers receive a fixed rate for longer periods of time. In contrast, our reference rates are based on bonds with a constant default risk profile across maturities. This would imply that our default risk adjustment is overdone for loans with long-term fixed rates. We would need firmer evidence, though, before changing the adjustment.
A further observation is that the margins on loans granted to non-financial corporations are noticeably lower than those on (consumption and other purpose) loans to households; only the margins on loans for housing purposes are close to the former. An explanation could be that amounts lent to households are generally smaller so that banks provide more services per euro lent and need to charge a higher relative price to cover their fixed costs. Also, the risk associated with corporate loans may be easier to gauge than that of loans to households. This would be the case if non-financial corporations tended to have standardized financial reports compared to less standardized or less detailed financial information provided by households. Non-financial corporations (in particular large ones) may also be better informed and have more bargaining power than households. In addition, large corporate loans are often collateralized. Finally, loans to non-financial corporations with a fixation period of more than 5 years show small average margins (0.39 percent), but these loans account, on the average, for about 7 percent only of the total new business volume of loans to non-financial corporations.
Figure 5, Euro area interest margins on deposits by maturity, average 2003:1-2008:6 (%)
-1.0
-0.5
0.0
0.5
1.0
1.5
2.0
2.5
Over- <1yr 1-2yr >2yr <3mo >3mo Repos Over- <1yr 1-2yr >2yr <3mo >3mo Repos
night Fixed maturity Redeemable atnotice
night Fixed maturity Redeemable atnotice
Business deposits Household deposits
Figure 5 shows the average interest margin in the euro area in the case of deposits; this corresponds to case II in Table 1 above. Margins for deposits held by non-financial corporations tend to be lower than for household deposits, which could be explained by the same reasons as for loans. Furthermore, overnight deposits (current accounts) command the highest margins. Banks may charge a high interest margin on
2010June

30ECBWorking Paper Series No 1204
these deposits because they provide most transaction services to their customers on this type of accounts. Another observation from Figure 5 is that for two categories of deposits, interest margins are negative when averaged over the entire period.
4.2 FISIM results for the euro area
With a complete set of interest margins, the implications for FISIM (imputed bank output) can be shown. Imputed bank output is calculated as:
(11) ii
i SmY
where Yi is the output associated with financial asset i (loan or deposit), mi is the interest margin and Si is the outstanding amount of the corresponding financial asset or liability on the bank balance sheet. 69 As discussed above, our margins are calculated using interest rates on new business for each maturity band in the case of deposits and for each band of initial interest rate fixation periods in the case of loans, and then averaged according to the shares of new business volumes, but these are then applied to outstanding amounts. In addition, we apply the margins estimated for non-financial corporations to loans and deposits of insurance corporations and pension funds and general government. For an estimate of exported financial services, we use a weighted average of the relevant margins, where the weights are given by the share in intra euro area cross-border positions.
The top panel of Table 2 shows three estimates of FISIM by sector: (i) as required in the current FISIM regulation, (ii) when the term premium is removed from the interest margins and (iii) when the default risk premium for loans is additionally removed. The bottom panel shows the weighted average interest margin for each sector, based on the underlying margins for deposits and loans. Note that the differences between FISIM under current framework and the two alternatives is not only due to different references rates, but also due to the use of interest rates on new business as compared to interest rates on outstanding amounts under the current FISIM methodology.
69 A critical point has been recently raised that only on-balance sheet activities of other MFIs are taken into account. Once a
bank loan is securitised, the bank is assumed to be no longer providing services to the borrower. Calculations of the Federal Reserve Bank of New York have shown that treating off-balance sheet lending originated by banks in the same manner as on-balance sheet loans would boost bank output by more than 10% for the US. This should be taken into account to avoid implausible growth rates: the subprime crisis has resulted in a substantive enlargement of bank balance sheets as the sponsors of many structured vehicles have returned back to bank financing. This shift will have, ceteris paribus, the effect of artificially boosting financial sector output. See e.g. Ashcraft and Steindel (2008). No detailed simulations have been carried out in the case of the euro area, but a very preliminary assessment has led to the conclusion that the impact would be much lower in this case. Moreover, care must be taken to avoid double-counting: to the extent that banks receive separate fee income for servicing the securitized loans, bank output is correctly measured.
2010June

31ECB
Working Paper Series No 1204
Table 2, Imputed banking sector output (FISIM) and interest margins in the euro area by
sector, current regulation and modified approaches (average 2003Q1-2008Q2)
Current regulation
Adjusted for term premium
Adjusted for term and default risk premium
FISIM (€bln)Total 225.9 172.5 135.0Non-financial corporations 72.0 47.0 27.1Households 144.9 100.9 92.3Insurance companies & pension funds -1.8 2.3 1.9Government 11.4 10.9 6.1Exports -0.6 11.4 7.5
Interest margin (%)Total 1.4 1.0 0.8Non-financial corporations 1.5 1.0 0.6Households 1.7 1.2 1.1Insurance companies & pension funds -0.3 0.3 0.3Government 1.0 1.0 0.5Exports 0.0 0.7 0.5
Notes: FISIM is calculated as the interest margin of each type of loan and deposit times the outstanding balance. The interest margins in the bottom panel are weighted averages of loan and deposit margins. Current regulation FISIM uses interest rates on outstanding amounts and reference rates which mainly represent weighted averages of inter-bank interest rates. The two alternatives use interest rates on new business. When adjusting for the term premium, the government bond yield with the most closely matching maturity is used as reference rate. When also adjusting for the default risk premium, yields on corporate bonds and residential mortgage- and asset-backed securities are used. See Tables A1 and A2 in Appendix 1 for details.
Overall, the differences are substantial. Both alternatives show lower FISIM than the current approach: the average annual banking sector output is €172.5bln after adjusting for the term premium and €135bln after adjusting for the default risk premium as well. These adjustments yield figures that are 24 and 40 percent lower, respectively, than the data on FISIM under the current framework. While the simulations calculated under the current regulation imply an estimated average interest margin of 1.4 percent, this falls to 1 and 0.8 percent under the two options described above. The impact differs across sectors, with the largest drop in the margin for non-financial corporations and a more moderate adjustment in the household sector. Table 1 illustrates why the impact of the two alternatives is larger for non-financial corporations than households. For nearly all types of loans and deposits the margins paid by corporations are lower than for households, even when a short-term interest rate is used. Any downward adjustment will therefore represent a relatively larger part of the margin. A more complete overview on sectoral FISIM results and time series is given in Appendix 370.
Non-financial corporations and households are predominant in total FISIM. While the results obtained for these sectors are derived under all frameworks on the basis of reliable sets of statistics, the proposed alternatives have the advantage of yielding a much more plausible outcome for FISIM paid by insurance corporations and pension funds, general government and the rest of the world. As a result, there are no
70 In particular, Appendix 3 presents detailed results for the new methodology in its two variants compared to the framework of
1995 ESA. The different approaches are referred to using the syntax of Table 1, i.e. method I refers to the current approach, method II performs a term premium correction on the reference rate(s) and method III also takes into account the default risk premium in case of loans; in addition, methods II and III use interest rates on new business.
2010June

32ECBWorking Paper Series No 1204
instances of negative FISIM for any of the sectors under either of the two alternative approaches proposed, unlike the current estimates of FISIM that show frequent and steady negative results.
Figure 6, Euro area imputed bank output (FISIM) and the value of the risk premia (annualised data; billions of euros), 2003:1-2008:6
020406080
100120140160180200220240260
03Q1
03Q2
03Q3
03Q4
04Q1
04Q2
04Q3
04Q4
05Q1
05Q2
05Q3
05Q4
06Q1
06Q2
06Q3
06Q4
07Q1
07Q2
07Q3
07Q4
08Q1
08Q2
Default risk and term premium adjusted FISIM Default risk premium Term premium
Figure 6 provides a summary overview on euro area FISIM71. The bottom area shows FISIM calculated using interest margins from which both the term premium and default risk have been eliminated. The middle area can be interpreted as the default risk premium adjustment. The three areas together correspond to the current statistical practice of measuring FISIM, and therefore the top area shows the (bias resulting from the inclusion of the) term premium. As might be expected based on the data in Table 1, the impact of removing risk from the banking sector output is substantial. Risk-adjusted FISIM is on average only 60 percent of estimated current-practice FISIM, with default risk accounting for 16 percent of the current measure and the term premium for 24 percent. In terms of deliveries to final demand this implies, on the average, a possible overestimation between €12.6bln and €21.4bln or 0.16 to 0.27 of euro area GDP at current prices. 72
The impact of removing the remuneration for credit default risk and term premium from the banking sector output is substantial. A first important remark regards the sizeable impact of the term premium correction over the period from 2003Q3 to 2006Q2 which was characterized by a steep yield curve;
71 It should be stressed that Figure 6 shows euro area results net of FISIM exports; this is needed for comparison purposes as the
current methodology yields very low FISIM exports. 72 Assessing the impact on GDP (at current prices) of the new methodology is not straightforward as FISIM affects both
intermediate and final consumption and requires their bridging with the different types of loans recorded in the context of MFI balance sheet statistics. Services provided to corporations (as non-FISIM producers) are intermediate consumption, and do not affect GDP. However, services provided to households (as well as to general government and to non-residents) are final consumption and add to GDP. An important exception, though, is lending to households for housing purposes, which is an intermediate consumption input into the production of these services. Preliminary simplified estimates show that for the period January 2003 to June 2008 the contribution of FISIM to GDP would be reduced, on the average, by €21.4bln in case of default risk and term premium adjustment, and by €12.6bln in case of adjustment for the term premium only. The adjustments respectively represent 0.27 and 0.16 percent of euro area GDP. It should be outlined that this estimate depends on the specific implementation of both current-regulation FISIM and our adjusted FISIM. Current FISIM statistics as compiled by statistical agencies will in general be different leading to different estimates of this overstatement, although it seems plausible that the order of the correction would not change.
2010June

33ECB
Working Paper Series No 1204
conversely, this adjustment drops in the course of 2007 because of a flattening yield curve. Secondly, while over this period the total default risk correction seems to be broadly stable, in an environment with high growth rates on outstanding loans and deposits this mainly reflects a decreasing (average) risk premium; see also Section 3.2.2. In addition, the default risk premium correction also appears to decrease in the last two quarters of 2007 and to then increase rather sharply in the course of 2008. This phenomenon is related to the peculiarity of the financial turmoil observed over this period, which led to an increase of the general financial market risks while the borrowers’ credit default risk remained broadly unchanged at first, to then increase considerably in 2008.73
Risk-adjusted FISIM are broadly in line with the evolution of the outstanding amounts on loans and deposits which have shown sharp growth rates over the period under analysis. In addition, all related interest margins are less volatile than under the current framework (see Appendix 3 for further details); the reason is that most of the volatility of the current margins originates from the volatility of the term premium and the default risk premium components. By removing these common drivers of the interest margins, idiosyncratic movements make up a more substantial part.
5. Concluding remarks
Banks do not charge explicit fees for much of the services they provide, so that the value of those services needs to be imputed by comparing bank loan and deposit rates to reference rates that serve as a measure of opportunity costs of funds. This paper has shown how the euro area banking sector output (FISIM) would change if the compensation for bearing risk would be removed from output. Recent theoretic work has demonstrated that bearing risk is in general not a productive service as such. Instead, determining credit-worthiness of borrowers and assessing the risk is production as it requires labour, capital and intermediate inputs. If banks bear risks by holding corporate bonds or equity, this is not considered a productive service and, likewise, the systematic risk on bank loans (and deposits) should also be excluded from the banking sector output.
Our empirical application of the risk-adjusted bank output model covers the euro area from the first quarter of 2003 to the second quarter of 2008. The results show that if we only remove the term premium, the banking sector output is on average 24 percent lower than under the current methodology. If we also remove the default risk premium, this output is on average 40 percent lower. In other words, the choice of reference rate is crucial and the empirical impact of this choice is substantial. This also has an effect on GDP, the size of the economy, to the extent that bank services are part of final demand. For example, banking sector output to households falls from an average over the period of €144.9bln to €92.3bln, implying a fall in final consumption expenditure of about one percent. Comparable work for the United States by Basu et al (2008) has shown an adjustment to banking sector output of a similar magnitude, so our findings for the euro area do not depend on specific data or assumptions.
73 In other words, while market interest rates on loans increased reflecting the sharp increase in inter-bank rates with a maturity
between one month and one year, the bond yields did not completely mirror this change at the beginning, of the turmoil to then increase in the course of 2008 reflecting the deterioration of the general economic situation
2010June

34ECBWorking Paper Series No 1204
Beneath these headline results, a number of data issues remain. The current financial crisis in particular illustrates problems of matching bank loans and financial market securities. Risk premiums have widened since the summer of 2007, but bank loans rates have changed by much less. Does this mean bank loan rates are slow to adjust? Have service margins decreased? Is there a mismatch between the type of bank loans and the debt included in these securities? These questions would need further research to be answered, but these questions also arise under the old methodology. There, excessive service margins lead to avoid negative interest margins in these times, but the changes in margins are as hard or harder to gauge. Since our service margins are closer to what economic theory requires for all the periods under study, and also because they are less volatile we would argue for our modified, risk-adjusted bank output measure.
2010June
35ECB
Working Paper Series No 1204
References Allen, F. and A.M. Santomero (2001). “What Do Financial Intermediaries Do?” Journal of Banking and
Finance, 25(2), 271-94 Ashcraft, A.B. and C. Steindel (2008), “Measuring the impact of securitization on imputed bank output,”
Paper presented at the 2008 World Congress on National Accounts, Arlington (VA), USA. Barnett, W. A. (1978), “The User Cost of Money,” Economic Letters 1(2), 145–49. Basu, S. and J. C. Wang (2006), “Technological Progress, ‘Money’ in the Utility Function, and the ‘User
Cost of Money,’” Paper presented at the 2006 NBER/CRIW Summer Institute workshop. Basu, S., R. Inklaar and J. C. Wang (2009), “The Value of Risk: Measuring the Service Income of U.S.
Commercial Banks,” forthcoming in Economic Inquiry Bhattacharya, S. and A. Thakor (1993), “Contemporary Banking Theory,” Journal of Financial
Intermediation 3(1), p. 2-50. Berger, A.N. and G.F. Udell (1992), “Some evidence on the empirical significance of credit rationing,”
Journal of Political Economy, 100(5), pp. 1047-77. Berlin, M. and L. Mester (1999), “Deposits and Relationship Lending,” Review of Financial Studies, 12
(Fall 1999), pp. 579-607. Boot, A.W.A. (2000), “Relationship Banking: What Do We Know?” Journal of Financial Intermediation
9(1), pp. 7-25 Barnett, W.A. (1978), “The User Cost of Money,” Economics Letters 1(2), pp. 145-49. Calem, P.S., M.B. Gordy and L.J. Mester (2006), “Switching costs and adverse selection in the market for
credit cards: New evidence,” Journal of Banking & Finance, 30(6), pp. 1653-85. Campbell, J.Y., A.W. Lo, and A.C. MacKinlay (1997), The Econometrics of Financial Markets,
Princeton University Press. Cochrane, J. H. and Saa Requejo (2000). “Beyond Arbitrage: Good-Deal Asset Price Bounds in
Incomplete Markets,” Journal of Political Economy 108(1), 79-119. Colangelo, A. and R. Inklaar (2009) “Measuring the output of the banking sector: shortcomings of the
current European methodology and new perspectives,” in Eds. Balling, M., Gnan, E., Lierman, F., and Schoder J-P, "Productivity in the Financial Services Sector", SUERF Studies 2009/4, Larcier, Brussels.
De Bondt, G. (2005), “Interest rate pass-through: empirical results for the euro area,” German Economic Review, 6(1), pp 37-78.
De Graeve, F., O. De Jonghe and R. Vander Vennet (2007), “Competition, transmission and bank pricing policies: Evidence from Belgian loan and deposit markets,” Journal of Banking & Finance, 31(1), pp. 259-278.
Diewert, W.E. (1974). “Intertemporal Consumer Theory and the Demand for Durables,” Econometrica42(3), 497–516.
Elsas, R. and J.P. Krahnen (1998), “Is relationship lendind special? Evidence from credit-file data in Germany,” Journal of Banking & Finance, 22(10-11), pp. 1283-1316.
European Council, Council Regulation (EC) No 2223/96 of 25 June 1996 on the European system of national and regional accounts in the Community” (1995 ESA), Brussels, 25 June 1996
European Central Bank (2003), Manual on MFI Interest Rate Statistics, ECB: Frankfurt, see http://www.ecb.europa.eu/pub/pdf/other/mfiintrestratestatisticsmanualen.pdf.
European Central Bank (2006), Differences in MFI interest rates across euro area countries, ECB: Frankfurt, see http://www.ecb.int/pub/pdf/other/differencesmfiinterestrates2006en.pdf.
Fonte Santa, S. (2007), “Financial Intermediation Services Indirectly Measured (FISIM) – the problematic of imports and exports,” Banco de Portugal, Supplement 1/2007 to the Statistical Bulletin, August 2007.
Franke, G. and J.P. Krahnen (2008), “The future of securitisation,” CFS Working Paper, no. 2008/31.
2010June

36ECBWorking Paper Series No 1204
Gropp, R., C. Kok Sørensen and J.-D. Lichtenberger (2007), “The dynamics of bank spreads and financial structure,” ECB Working Paper, no. 714.
Gropp, R. and J. Vesala (2004), “Deposit insurance, moral hazard and market monitoring,” Review of Finance, 8(4), pp. 571-602.
Hannan, T.H. and A.N. Berger (1991), “The rigidity of prices: evidence from the banking industry,” American Economic Review, 81(4), pp. 938-945.
Hofmann, B. and P. Mizen (2004), “Interest rate pass-through and monetary transmission: evidence from individual financial institutions’ retail rates,” Economica, 71(2), pp. 99-123.
Inklaar, R. and J.C. Wang (2009), “Not Your Grandfather’s Bank Any More? Consistent Measurement of Non-Traditional Bank Output,” mimeo, University of Groningen and Boston Fed.
Keuning, S.J. (2008), “Discussant comments on session IPM83: Measures of output and prices of financial services,” IFC Bulletin No. 28.
Kok Sørensen, C. and J.-D. Lichtenberger (2007), “Mortgage interest rate dispersion in the euro area,” ECB Working Paper, no. 733.
Mester, L.J. and A. Saunders (1995), “When does the prime rate change?” Journal of Banking & Finance, 19(5), pp. 743-764.
Modigliani, F. F. and Mi. H. Miller (1958). “The Cost of Capital, Corporation Finance, and the Theory of Investment,” American Economic Review (48), p. 261-97.
Mojon, B. (2001), “Financial structure and the interest rate channel of ECB monetary policy,” Economie et Provision, 147(1), pp. 89-115.
Ross, S. A. (1976). “The Arbitrage Theory of Capital Asset Pricing,” Journal of Economic Theory 13(3), p. 341-360.
Rotherberg, J.R, F.E. Nothaft and S.A. Gabriel (1989), “On the determinants of yield spreads between mortgage pass-through and Treasury securities,” Journal of Real Estate Finance and Economics, 2(4), pp. 301-315.
Sander, H. and S. Kleimeier (2004), “Convergence in euro-zone retail banking? What interest rate pass-through tells us about monetary policy transmission, competition and integration,” Journal of International Money and Finance, 23(3), pp. 461-492.
System of National Accounts (1993 SNA), UN: New York. United Nations, Eurostat, International Monetary Fund, Organization for Economic Cooperation and
Development and World Bank (1993), System of National Accounts 1993, Series F, No. 2, Rev. 4, United Nations, New York.
Van Leuvensteijn, M., J.A. Bikker, A. Van Rixtel, C. Kok Sørensen (2007), “A new approach to measuring competition in the loan markets of the euro area,” ECB Working Paper, no. 768.
Wang, J. C. (2003), “Loanable Funds, Risk, and Bank Service Output,” Federal Reserve Bank of Boston, Working Paper Series, no. 03-4.
Wang, J. C. and Basu, S. (2007). “Risk Bearing, Implicit Financial Services, and Specialization in the Financial Industry,” Working paper, Federal Reserve Bank of Boston
Wang, J. C., S. Basu and J. Fernald (2008), “A General-Equilibrium Asset-Pricing Approach to the Measurement of Nominal and Real Bank Output” forthcoming in J. Greenlees and C. M. Hulten (eds.) Price Index Concepts and Measurement, NBER Studies in Income and Wealth, University of Chicago Press: Chicago.
2010June

37ECB
Working Paper Series No 1204
Appendix 1
Table A1, Bank loan and deposit instruments and reference rates: term premium adjustmentReference rate
LoansNon-financial corporationsUp to 1 year 5-month EURIBOROver 1 year and up to 5 years 1Y government bond yieldOver 5 years 5Y government bond yield
HouseholdsFor house purchasesUp to 1 year 1Y EURIBOROver 1 year and up to 5 years 4Y government bond yieldOver 5 year and up to 10 years 6Y government bond yieldOver 10 years 10Y government bond yield
Consumer creditUp to 1 year 2-month EURIBOROver 1 year and up to 5 years 5Y government bond yieldOver 5 years 5Y government bond yield
Other purposesUp to 1 year 11-month EURIBOROver 1 year and up to 5 years 4Y government bond yieldOver 5 years 6Y government bond yield
DepositsNon-financial corporationsOvernight deposits EONIA
Deposits with agreed maturityUp to 1 year 1-month EURIBOROver 1 year and up to 2 years 1Y government bond yieldOver 2 years 3Y government bond yield
Deposits redeemable at noticeUp to 3 months 3-month EURIBOROver 3 months 2Y government bond yield
Repurchase agreements EONIA
HouseholdsOvernight deposits EONIA
Deposits with agreed maturityUp to 1 year 1-month EURIBOROver 1 year and up to 2 years 1Y government bond yieldOver 2 years 5Y government bond yield
Deposits redeemable at noticeUp to 3 months 3-month EURIBOROver 3 months 2Y government bond yield
Repurchase agreements EONIA
Acronyms:NFC: non-financial corporationsEuribor: Euro interbank offered rateEONIA: Euro overnight index average
2010June

38ECBWorking Paper Series No 1204
Table A2, Bank loan and deposit instruments and reference rates: default risk and term premium adjustmentReference rate
LoansNon-financial corporationsUp to 1 year ML NFC bond index, 1-5Y minus 3Y government bond yield plus 1Y government bond yieldOver 1 year and up to 5 years ML NFC bond index, 1-5Y minus 3Y government bond yield plus 1Y government bond yieldOver 5 years ML NFC bond index, 5-10Y minus 9Y government bond yield plus 5Y government bond yield
HouseholdsFor house purchasesUp to 1 year ML ABS/MBS index minus 6Y government bond yield plus 1Y government bond yieldOver 1 year and up to 5 years ML ABS/MBS index minus 6Y government bond yield plus 4Y government bond yieldOver 5 year and up to 10 years ML ABS/MBS index minus 6Y government bond yield plus 6Y government bond yieldOver 10 years ML ABS/MBS index minus 6Y government bond yield plus 10Y government bond yield
Consumer creditUp to 1 year ML ABS/MBS index minus 6Y government bond yield plus 1Y government bond yieldOver 1 year and up to 5 years ML ABS/MBS index minus 6Y government bond yield plus 5Y government bond yieldOver 5 years ML ABS/MBS index minus 6Y government bond yield plus 5Y government bond yield
Other purposesUp to 1 year ML ABS/MBS index minus 6Y government bond yield plus 1Y government bond yieldOver 1 year and up to 5 years ML ABS/MBS index minus 6Y government bond yield plus 4Y government bond yieldOver 5 years ML ABS/MBS index minus 6Y government bond yield plus 6Y government bond yield
DepositsNon-financial corporationsOvernight deposits EONIA
Deposits with agreed maturityUp to 1 year 1-month EURIBOROver 1 year and up to 2 years 1Y government bond yieldOver 2 years 3Y government bond yield
Deposits redeemable at noticeUp to 3 months 3-month EURIBOROver 3 months 2Y government bond yield
Repurchase agreements EONIA
HouseholdsOvernight deposits EONIA
Deposits with agreed maturityUp to 1 year 1-month EURIBOROver 1 year and up to 2 years 1Y government bond yieldOver 2 years 5Y government bond yield
Deposits redeemable at noticeUp to 3 months 3-month EURIBOROver 3 months 2Y government bond yield
Repurchase agreements EONIA
Acronyms:ML: Merrill LynchNFC: non-financial corporationsABS/RMBS: Asset-backed security/Mortgage-backed securityEuribor: Euro interbank offered rateEONIA: Euro overnight index average Notes: Over the preiod under analysis, the average residual maturities of the bonds underlying the indices have been 6 years for the ABS/RMBS index, and 3 and 9 years for the corporate indices for the bands 1 to 5 years and 5 to 10 years respectively.
2010June

39ECB
Working Paper Series No 1204
Appendix 2. Modelling interest rates into an error-correction framework.
Error correction models have occupied a prominent role in economic literature to study the transmission of monetary policy rates to bank interest rates via changes in market interest rates. Under this framework, changes in a bank interest rate B are regressed on simultaneous and lagged changes in a relevant market rate M, lagged changes in the bank interest rate itself and include an error-correction term reflecting the divergence of the bank rate from its long-run equilibrium relationship with the market rate in the previous period. The equation reads as follows:
ttttttt MBBMMB )( 3121113121 ,
where stands for the difference operator and t are zero-mean i.i.d. random variables. In particular, the
coefficients 1 and 2 represent the immediate and final pass-through while 1 relates to the speed of
adjustment; the latter is also referred to as the cointegration parameter as testing its equality to zero is a way to testing for cointegration. For further details, see De Bondt (2005) and reference therein.
In this paper we have used the error correction model to match each interest rate on deposits and loans with its relevant reference rate. In particular, each bank interest rate has been regressed against a spectrum of market rates reflecting a maturity falling into the band of maturity or period of rate fixation of the rate, and the reference rate has thus been selected performing the model selection on the basis of the Schwarz information criterion (or BIC). Estimations have been carried out supplementing MIR statistics for the period from January 2003 to June 2008 with historical ECB estimates from January 1999 to December 2002 when available. Table A3 below provides the details of the model selection. Table A4 thus reviews the main results of the estimations for the selected models.
It should be underlined that there is some evidence that after the outbreak of the financial market turbulence in August 2007 the pass-through of retail bank interest rates was somehow affected by the money-market malfunctioning, banks’ scramble for safe deposits and flight to safety flows in the government bond market. Nonetheless our results would not be too much affected when restricting the sample to periods up to June 2007, perhaps hinting that these factors may have started to play an important role only after the intensification of the crisis in the second half of 2008.
2010June

40ECBWorking Paper Series No 1204
Table A3, Retail interest rate pass-though process within error-correction framework: model selection 1)
Eonia Eur. 1M Eur. 2M Eur. 3M Eur. 4M Eur. 5M Eur. 6M Eur. 7M Eur. 8M Eur. 9M Eur. 10M Eur. 11M Eur. 12MLoansNon-financial corporationsUp to 1 year -503.18 -568.01 -575.24 -606.36 -621.57 -636.43 -634.12 -631.35 -626.66 -621.32 -616.51 -611.52 -607.78Over 1 year and up to 5 yearsOver 5 years
HouseholdsFor house purchasesUp to 1 year -580.32 -593.80 -592.63 -604.75 -612.12 -622.48 -629.16 -631.34 -633.94 -635.11 -635.81 -636.56 -638.42Over 1 year and up to 5 yearsOver 5 year and up to 10 yearsOver 10 years 2)
Consumer creditUp to 1 year -355.37 -353.15 -356.17 -354.59 -354.70 -355.26 -355.29 -355.03 -355.11 -355.03 -355.00 -354.91 -355.01Over 1 year and up to 5 yearsOver 5 years
Other purposesUp to 1 year 2) -264.16 -268.06 -270.01 -272.30 -273.10 -273.86 -274.65 -275.15 -275.37 -275.62 -276.03 -276.55 -276.40Over 1 year and up to 5 years 2)
Over 5 years 2)
DepositsNon-financial corporationsOvernight deposits -793.07
Deposits with agreed maturityUp to 1 year -563.34 -655.89 -620.81 -627.46 -636.79 -632.99 -637.41 -635.45 -632.33 -629.44 -626.49 -623.09 -621.58Over 1 year and up to 2 yearsOver 2 years
Deposits redeemable at noticeUp to 3 months 3)
Over 3 months 3)
Repurchase agreements -657.85 -656.76 -640.66 -620.15 -617.05 -615.54 -614.28 -614.16 -613.50 -612.51 -611.29 -610.16 -608.07
HouseholdsOvernight deposits -721.76
Deposits with agreed maturityUp to 1 year -604.72 -687.76 -670.14 -673.52 -685.49 -673.40 -671.29 -668.14 -661.05 -655.06 -650.77 -645.55 -642.07Over 1 year and up to 2 yearsOver 2 years
Deposits redeemable at noticeUp to 3 months -703.06 -707.37 -710.51 -710.95Over 3 months 4) -731.53 -735.96 -741.00 -747.46 -751.07 -753.10 -755.65 -758.03 -760.27 -762.22
Repurchase agreements 3)
2) Due to the lack of histortical estimates, the sample period is January 2003 to June 2008 for these series.3) No model selection as margins derived under working assumptions in these cases (see footnote 63)
Acronyms:Eur: Euro interbank offered rateGB: Euro area government bond yield curve
4) While the 12-month Euribor has the highest values of the BIC indicator, we select the 2-year government bond because it performs better than the 1-year government bond thus indicating that the relevant maturity might be higher than 1-year.
1) The table dispays the value of the Schwarz Criterion (BIC) for each of the models; non-linear least squares estimates using the Trust-Region Reflective algorithm; sample period January 1999 to June 2008 (unless otherwise specified)
2010June

41ECB
Working Paper Series No 1204
Table A3 (continued), Retail interest rate pass-though process within error-correction framework: model selection 1)
GB 1Y GB 2Y GB 3Y GB 4Y GB 5Y GB 6Y GB 7Y GB 8Y GB 9Y GB 10Y GB 12Y GB 15Y GB 20Y GB 30YLoansNon-financial corporationsUp to 1 yearOver 1 year and up to 5 years -396.99 -392.61 -386.36 -381.06 -376.81Over 5 years -495.35 -491.00 -487.73 -485.84 -484.59 -483.88 -481.52 -478.60 -474.10 -461.98
HouseholdsFor house purchasesUp to 1 yearOver 1 year and up to 5 years -606.92 -618.89 -623.60 -624.51 -620.44Over 5 year and up to 10 years -623.83 -625.42 -625.39 -623.82 -620.53 -616.91Over 10 years 2) -380.26 -373.25 -369.27 -367.50 -363.84
Consumer creditUp to 1 yearOver 1 year and up to 5 years -449.05 -451.85 -453.79 -455.07 -455.77Over 5 years -401.55 -401.38 -401.10 -400.81 -400.59 -400.04 -399.16 -398.11 -396.49 -394.23
Other purposesUp to 1 year 2)
Over 1 year and up to 5 years 2) -266.70 -274.61 -279.67 -280.76 -276.48Over 5 years 2) -305.74 -306.77 -306.02 -303.15 -300.07 -298.40 -296.81 -295.45 -294.23 -292.99
DepositsNon-financial corporationsOvernight deposits
Deposits with agreed maturityUp to 1 yearOver 1 year and up to 2 years -167.44 -161.52Over 2 years -136.94 -136.98 -135.92 -133.95 -131.66 -129.38 -127.54 -126.32 -125.41 -124.54 -123.97 -123.78 -123.17
Deposits redeemable at noticeUp to 3 months 3)
Over 3 months 3)
Repurchase agreements
HouseholdsOvernight deposits
Deposits with agreed maturityUp to 1 yearOver 1 year and up to 2 years -523.87 -511.17Over 2 years -459.27 -463.98 -467.14 -467.72 -464.87 -460.25 -454.94 -450.12 -445.38 -439.21 -434.69 -432.14 -424.09
Deposits redeemable at noticeUp to 3 monthsOver 3 months 4) -754.76 -759.50 -759.13 -756.38 -753.95 -751.77 -750.82 -749.59 -748.39 -747.31 -745.79 -744.20 -741.57 -729.73
Repurchase agreements 3)
2) Due to the lack of histortical estimates, the sample period is January 2003 to June 2008 for these series.3) No model selection as margins derived under working assumptions in these cases (see footnote 63)
Acronyms:Eur: Euro interbank offered rateGB: Euro area government bond yield curve
4) While the 12-month Euribor has the highest values of the BIC indicator, we select the 2-year government bond because it performs better than the 1-year government bond thus indicating that the relevant maturity might be higher than 1-year.
1) The table dispays the value of the Schwarz Criterion (BIC) for each of the models; non-linear least squares estimates using the Trust-Region Reflective algorithm; sample period January 1999 to June 2008 (unless otherwise specified)
2010June

42ECBWorking Paper Series No 1204
Table A4, Retail interest rate pass-though process within error-correction framework: results overview 1)
Immediate pass-through ( 1)
Final pass-through ( 2)
Speed of adjustment ( 1)
Correlation Adjusted R2 BICAverage share of total new business volumes
4)
LoansNon-financial corporationsUp to 1 year 0.714 (0.043) * 0.017 (0.035) * -0.153 (0.049) * 0.991 0.803 -636.43 86.9%Over 1 year and up to 5 years 0.506 (0.107) * 0.973 (0.086) * -0.198 (0.058) * 0.946 0.274 -396.99 6.7%Over 5 years 0.350 (0.053) * 0.973 (0.094) * -0.149 (0.041) * 0.920 0.399 -495.35 6.4%
HouseholdsFor house purchasesUp to 1 year 0.287 (0.037) * 1.284 (0.212) * -0.031 (0.012) * 0.860 0.704 -638.42 47.9%Over 1 year and up to 5 years 0.248 (0.030) * 1.272 (0.084) * -0.090 (0.020) * 0.920 0.714 -624.51 13.2%Over 5 year and up to 10 years 0.289 (0.030) * 1.553 (0.148) * -0.056 (0.017) * 0.910 0.749 -625.42 17.2%Over 10 years 2) 0.182 (0.038) * 1.120 (0.136) * -0.123 (0.033) * 0.836 0.471 -380.26 21.7%
Consumer creditUp to 1 year 0.300 (0.135) ** 0.794 (1.163) -0.022 (0.036) 0.508 0.067 -356.17 26.5%Over 1 year and up to 5 years -0.039 (0.063) 0.632 (0.123) * -0.147 (0.035) * 0.610 0.151 -455.76 45.9%Over 5 years -0.062 (0.080) 0.222 (0.066) * -0.317 (0.073) * 0.370 0.232 -401.55 27.6%
Other purposesUp to 1 year 2) 0.346 (0.111) * 0.776 (0.055) * -0.271 (0.068) * 0.952 0.367 -276.55 76.5%Over 1 year and up to 5 years 2) 0.112 (0.069) 1.142 (0.123) * -0.245 (0.051) * 0.809 0.458 -280.76 10.4%Over 5 years 2) 0.137 0.057) ** 1.198 (0.194) * -0.160 (0.043) * 0.752 0.412 -306.77 13.1%
DepositsNon-financial corporationsOvernight deposits 0.142 (0.019) * 0.246 (0.091) * 0.032 (0.015) ** 0.858 0.503 -793.07
Deposits with agreed maturityUp to 1 year 0.552 (0.035) * 1.284 (0.894) 0.020 (0.047) 0.990 0.797 -655.89 98.5%Over 1 year and up to 2 years 0.481 (0.240) ** 1.162 (0.081) * -0.474 (0.118) * 0.943 0.309 -167.44 0.4%Over 2 years 0.229 (0.228) 0.627 (0.099) * -0.627 (0.137) * 0.721 0.284 -136.98 1.1%
Deposits redeemable at noticeUp to 3 months 3)
Over 3 months 3)
Repurchase agreements 0.560 (0.040) * 0.917 (0.065) * -0.077 (0.060) 0.995 0.795 -657.85
HouseholdsOvernight deposits 0.141 (0.025) * 0.246 (0.021) * -0.177 (0.058) * 0.965 0.296 -721.76
Deposits with agreed maturityUp to 1 year 0.433 (0.028) * 0.774 (0.161) * 0.029 (0.028) 0.981 0.807 -687.76 91.2%Over 1 year and up to 2 years 0.233 (0.059) * 1.553 (0.919) -0.030 (0.032) 0.914 0.469 -525.87 3.2%Over 2 years 0.263 (0.060) * 1.136 (0.096) * -0.167 (0.033) * 0.881 0.365 -467.72 5.6%
Deposits redeemable at noticeUp to 3 months 0.061 (0.028) ** 0.2561 (0.026) * -0.156 (0.033) * 0.856 0.253 -710.95 93.7%Over 3 months 0.090 (0.019) * 0.913 (0.203) * -0.022 (0.010) ** 0.826 68.390 -759.50 6.3%
Repurchase agreements 3)
2) Due to the lack of historical estimates, the sample period is January 2003 to June 2008 for these series.3) No model selection as margins derived under working assumptions in these cases (see footnote 63)4) Averages derived for the period January 2003 to June 2008.
1) Non-linear least squares estimates using the Trust-Region Reflective algorithm; sample period January 1999 to June 2008 unless otherwise specified; * and ** denote significance at the 1% and 5% level respectively; standard errors are reported in parantheses; model selection is performed on the basis of the Schwarz Criterion (BIC).
2010June

43ECB
Working Paper Series No 1204
Banking sector output with domestic residents1995 ESA approach vs enhanced methodology - Deposits for the euro area
(Quarterly output; EUR million)
2003 2004 2005 2006 20070.00
5000.00
10000.00
15000.00
20000.00
25000.00 1995 ESA (I) Term premium adjustment (II)
Households
2003 2004 2005 2006 20071500.00
2000.00
2500.00
3000.00
3500.00
4000.00
4500.00
5000.00
5500.00 1995 ESA (I) Term premium adjustment (II)
Non-financial corporations
2003 2004 2005 2006 2007-2500.00
-2000.00
-1500.00
-1000.00
-500.00
0.00
500.00
1000.00 1995 ESA (I) Term premium adjustment (II)
Insurance corporations and pension funds
2003 2004 2005 2006 2007200.00
400.00
600.00
800.00
1000.00
1200.00
1400.00
1600.00
1800.00 1995 ESA (I) Term premium adjustment (II)
General government
2003 2004 2005 2006 20070.00
5000.00
10000.00
15000.00
20000.00
25000.00
30000.00
35000.00 1995 ESA (I) Term premium adjustment (II)
Total domestic economy
Appendix 3
2010June

44ECBWorking Paper Series No 1204
Banking sector output with domestic residents1995 ESA approach vs enhanced methodology - Loans for the euro area
(Quarterly output; EUR million)
2003 2004 2005 2006 20075000.00
10000.00
15000.00
20000.00
25000.00
30000.00
35000.001995 ESA (I)Full adjustment (III)
Term premium adjustment (II)
Households
2003 2004 2005 2006 2007-2000.00
0.00
2000.00
4000.00
6000.00
8000.00
10000.00
12000.00
14000.00
16000.00
18000.001995 ESA (I)Full adjustment (III)
Term premium adjustment (II)
Non-financial corporations
2003 2004 2005 2006 2007-100.00
0.00
100.00
200.00
300.00
400.00
500.00
600.00
700.001995 ESA (I)Full adjustment (III)
Term premium adjustment (II)
Insurance corporations and pension funds
2003 2004 2005 2006 2007-1000.00
-500.00
0.00
500.00
1000.00
1500.00
2000.00
2500.00
3000.00
3500.00
4000.001995 ESA (I)Full adjustment (III)
Term premium adjustment (II)
General government
2003 2004 2005 2006 20070.00
10000.00
20000.00
30000.00
40000.00
50000.00
60000.001995 ESA (I)Full adjustment (III)
Term premium adjustment (II)
Total domestic economy
2010June

45ECB
Working Paper Series No 1204
Banking sector output with domestic residents1995 ESA approach vs enhanced methodology - Deposits and loans for the euro area
(Quarterly output; EUR million)
2003 2004 2005 2006 200715000.00
20000.00
25000.00
30000.00
35000.00
40000.00
1995 ESA (I)Full adjustment (II for deposits and III for loans)Term premium adjustment (II)
Households
2003 2004 2005 2006 20070.00
5000.00
10000.00
15000.00
20000.00
25000.00
1995 ESA (I)Full adjustment (II for deposits and III for loans)Term premium adjustment (II)
Non-financial corporations
2003 2004 2005 2006 2007-2000.00
-1500.00
-1000.00
-500.00
0.00
500.00
1000.00
1500.00
1995 ESA (I)Full adjustment (II for deposits and III for loans)Term premium adjustment (II)
Insurance corporations and pension funds
2003 2004 2005 2006 20070.00
500.00
1000.00
1500.00
2000.00
2500.00
3000.00
3500.00
4000.00
4500.00
1995 ESA (I)Full adjustment (II for deposits and III for loans)Term premium adjustment (II)
General government
2003 2004 2005 2006 200720000.00
25000.00
30000.00
35000.00
40000.00
45000.00
50000.00
55000.00
60000.00
65000.00
1995 ESA (I)Full adjustment (II for deposits and III for loans)Term premium adjustment (II)
Total domestic economy
2010June

46ECBWorking Paper Series No 1204
Banking sector with domestic residents1995 ESA approach vs enhanced methodology - Loans to households for the euro area
(percentage points for interest rates and margins; EUR million for stocks)
2003 2004 2005 2006 20072.00
3.00
4.00
5.00
6.00
7.00
8.00
9.00
OA interest rateNB interest rateReference rate (III)
Reference rate (II)Reference rate (I)
Consumer credit: interest rates
2003 2004 2005 2006 20072.00
2.50
3.00
3.50
4.00
4.50
5.00
Credit default and term premium adjustment (III)Term premium adjustment (II)1995 ESA (I)
Consumer credit: margins
2003 2004 2005 2006 20074000.00
4500.00
5000.00
5500.00
6000.00
6500.00
Credit default and term premium adjustment (III)Term premium adjustment (II)1995 ESA (I)
Consumer credit: output
2003 2004 2005 2006 20072.00
3.00
4.00
5.00
6.00
OA interest rateNB interest rateReference rate (III)
Reference rate (II)Reference rate (I)
Housing loans: interest rates
2003 2004 2005 2006 2007-1.00
0.00
1.00
2.00
3.00
4.00
Credit default and term premium adjustment (III)Term premium adjustment (II)1995 ESA (I)
Housing loans: margins
2003 2004 2005 2006 20070.00
5000.00
10000.00
15000.00
20000.00
Credit default and term premium adjustment (III)Term premium adjustment (II)1995 ESA (I)
Housing loans: output
2003 2004 2005 2006 20072.00
3.00
4.00
5.00
6.00
7.00
8.00
OA interest rateNB interest rateReference rate (III)
Reference rate (II)Reference rate (I)
Other loans: interest rates
2003 2004 2005 2006 20070.00
1.00
2.00
3.00
4.00
5.00
Credit default and term premium adjustment (III)Term premium adjustment (II)1995 ESA (I)
Other loans: margins
2003 2004 2005 2006 20071000.00
2000.00
3000.00
4000.00
5000.00
6000.00
7000.00
8000.00
Credit default and term premium adjustment (III)Term premium adjustment (II)1995 ESA (I)
Other loans: output
2003 2004 2005 2006 20070.00
1000000.0
2000000.0
3000000.0
4000000.0Consumer creditHousing loans
Other loans
Outstanding amounts
2010June

47ECB
Working Paper Series No 1204
Banking sector with domestic residents1995 ESA approach vs enhanced methodology - Loans to other sectors for the euro area
(percentage points for interest rates and margins; EUR million for stocks)
2003 2004 2005 2006 20072.00
3.00
4.00
5.00
6.00
OA interest rateNB interest rateReference rate (III)
Reference rate (II)Reference rate (I)
Non-financial corporations: interest rates
2003 2004 2005 2006 2007-0.50
0.00
0.50
1.00
1.50
2.00
2.50
Credit default and term premium adjustment (III)Term premium adjustment (II)1995 ESA (I)
Non-financial corporations: margins
2003 2004 2005 2006 2007-5000.00
0.00
5000.00
10000.00
15000.00
20000.00
Credit default and term premium adjustment (III)Term premium adjustment (II)1995 ESA (I)
Non-financial corporations: output
2003 2004 2005 2006 20071.00
2.00
3.00
4.00
5.00
6.00
7.00
OA interest rateNB interest rateReference rate (III)
Reference rate (II)Reference rate (I)
Insurance corporations and pension funds: interest rates
2003 2004 2005 2006 2007-0.50
0.00
0.50
1.00
1.50
2.00
2.50
Credit default and term premium adjustment (III)Term premium adjustment (II)1995 ESA (I)
Insurance corporations and pension funds: margins
2003 2004 2005 2006 2007-200.00
0.00
200.00
400.00
600.00
800.00
Credit default and term premium adjustment (III)Term premium adjustment (II)1995 ESA (I)
Insurance corporations and pension funds: output
2003 2004 2005 2006 20072.00
3.00
4.00
5.00
6.00
OA interest rateNB interest rateReference rate (III)
Reference rate (II)Reference rate (I)
General government: interest rates
2003 2004 2005 2006 2007-0.50
0.00
0.50
1.00
1.50
2.00
Credit default and term premium adjustment (III)Term premium adjustment (II)1995 ESA (I)
General government: margins
2003 2004 2005 2006 2007-1000.00
0.00
1000.00
2000.00
3000.00
4000.00
Credit default and term premium adjustment (III)Term premium adjustment (II)1995 ESA (I)
General government: output
2003 2004 2005 2006 20070.00
1000000.0
2000000.0
3000000.0
4000000.0
5000000.0
Non-financial corporationsInsurance corporations and pension fundsGeneral government
Outstanding amounts
2010June

48ECBWorking Paper Series No 1204
Banking sector with domestic residents1995 ESA approach vs enhanced methodology - Deposits by households in the euro area
(percentage points for interest rates and margins; EUR million for stocks)
2003 2004 2005 2006 20070.00
5.00
NB interest rateReference rate (II)
Reference rate (I)
Overnight deposits: interest rates
2003 2004 2005 2006 20071.00
1.50
2.00
2.50
3.00
3.50 Term premium adjustment (II) 1995 ESA (I)
Overnight deposits: margins
2003 2004 2005 2006 20071.00
2.00
3.00
4.00
5.00
OA interest rateNB interest rate
Reference rate (II)Reference rate (I)
Deposits with agreed maturity: interest rates
2003 2004 2005 2006 2007-1.00
-0.50
0.00
0.50
1.00 Term premium adjustment (II) 1995 ESA (I)
Deposits with agreed maturity: margins
2003 2004 2005 2006 20071.00
2.00
3.00
4.00
5.00
NB interest rateReference rate (II)
Reference rate (I)
Deposits redeemable at notice: interest rates
2003 2004 2005 2006 2007-1.00
0.00
1.00
2.00
3.00 Term premium adjustment (II) 1995 ESA (I)
Deposits redeemable at notice: margins
2003 2004 2005 2006 20071.00
2.00
3.00
4.00
5.00
NB interest rateReference rate (II)
Reference rate (I)
Repurchase agreements: interest rates
2003 2004 2005 2006 2007-0.20
0.00
0.20
0.40
0.60 Term premium adjustment (II) 1995 ESA (I)
Repurchase agreements: margins
2003 2004 2005 2006 20070.00
500000.00
1000000.0
1500000.0
2000000.0
OvernightWith agreed maturity
Redeemable at noticeRepurchase agreements
Outstanding amounts
2010June

49ECB
Working Paper Series No 1204
Banking sector with domestic residents1995 ESA approach vs enhanced methodology - Deposits by non-financial corporations in the euro area
(percentage points for interest rates and margins; EUR million for stocks)
2003 2004 2005 2006 20070.00
5.00
NB interest rateReference rate (II)
Reference rate (I)
Overnight deposits: interest rates
2003 2004 2005 2006 20071.00
1.50
2.00
2.50 Term premium adjustment (II) 1995 ESA (I)
Overnight deposits: margins
2003 2004 2005 2006 20071.00
2.00
3.00
4.00
5.00
OA interest rateNB interest rate
Reference rate (II)Reference rate (I)
Deposits with agreed maturity: interest rates
2003 2004 2005 2006 2007-0.50
0.00
0.50 Term premium adjustment (II) 1995 ESA (I)
Deposits with agreed maturity: margins
2003 2004 2005 2006 20071.00
2.00
3.00
4.00
5.00
NB interest rateReference rate (II)
Reference rate (I)
Deposits redeemable at notice: interest rates
2003 2004 2005 2006 2007-0.50
0.00
0.50
1.00
1.50 Term premium adjustment (II) 1995 ESA (I)
Deposits redeemable at notice: margins
2003 2004 2005 2006 20071.00
2.00
3.00
4.00
5.00
NB interest rateReference rate (II)
Reference rate (I)
Repurchase agreements: interest rates
2003 2004 2005 2006 2007-0.20
0.00
0.20
0.40
0.60 Term premium adjustment (II) 1995 ESA (I)
Repurchase agreements: margins
2003 2004 2005 2006 20070.00
500000.00
1000000.0
OvernightWith agreed maturity
Redeemable at noticeRepurchase agreements
Outstanding amounts
2010June

50ECBWorking Paper Series No 1204
Banking sector with domestic residents1995 ESA approach vs enhanced methodology - Deposits by the general government in the euro area
(percentage points for interest rates and margins; EUR million for stocks)
2003 2004 2005 2006 20070.00
5.00
NB interest rateReference rate (II)
Reference rate (I)
Overnight deposits: interest rates
2003 2004 2005 2006 20071.00
1.50
2.00
2.50 Term premium adjustment (II) 1995 ESA (I)
Overnight deposits: margins
2003 2004 2005 2006 20071.00
2.00
3.00
4.00
5.00
OA interest rateNB interest rate
Reference rate (II)Reference rate (I)
Deposits with agreed maturity: interest rates
2003 2004 2005 2006 2007-0.50
0.00
0.50 Term premium adjustment (II) 1995 ESA (I)
Deposits with agreed maturity: margins
2003 2004 2005 2006 20071.00
2.00
3.00
4.00
5.00
NB interest rateReference rate (II)
Reference rate (I)
Deposits redeemable at notice: interest rates
2003 2004 2005 2006 2007-0.50
0.00
0.50
1.00
1.50 Term premium adjustment (II) 1995 ESA (I)
Deposits redeemable at notice: margins
2003 2004 2005 2006 20071.00
2.00
3.00
4.00
5.00
NB interest rateReference rate (II)
Reference rate (I)
Repurchase agreements: interest rates
2003 2004 2005 2006 2007-0.20
0.00
0.20
0.40
0.60 Term premium adjustment (II) 1995 ESA (I)
Repurchase agreements: margins
2003 2004 2005 2006 20070.00
100000.00
200000.00
300000.00
400000.00
500000.00
Overnight, OGGWith agreed maturity, OGGRedeemable at notice, OGG
Repurchase agreements, OGGDeposits by the central governmentDeposits by the general government (CG + OGG)
Outstanding amounts
2010June

51ECB
Working Paper Series No 1204
Banking sector with domestic residents1995 ESA approach vs enhanced methodology - Deposits by insurance corporations and pension funds in the euro area
(percentage points for interest rates and margins; EUR million for stocks)
2003 2004 2005 2006 20070.00
5.00
NB interest rateReference rate (II)
Reference rate (I)
Overnight deposits: interest rates
2003 2004 2005 2006 20071.00
1.50
2.00
2.50 Term premium adjustment (II) 1995 ESA (I)
Overnight deposits: margins
2003 2004 2005 2006 20071.00
2.00
3.00
4.00
5.00
OA interest rateNB interest rate
Reference rate (II)Reference rate (I)
Deposits with agreed maturity: interest rates
2003 2004 2005 2006 2007-0.50
0.00
0.50 Term premium adjustment (II) 1995 ESA (I)
Deposits with agreed maturity: margins
2003 2004 2005 2006 20071.00
2.00
3.00
4.00
5.00
NB interest rateReference rate (II)
Reference rate (I)
Deposits redeemable at notice: interest rates
2003 2004 2005 2006 2007-0.50
0.00
0.50
1.00
1.50 Term premium adjustment (II) 1995 ESA (I)
Deposits redeemable at notice: margins
2003 2004 2005 2006 20071.00
2.00
3.00
4.00
5.00
NB interest rateReference rate (II)
Reference rate (I)
Repurchase agreements: interest rates
2003 2004 2005 2006 2007-0.20
0.00
0.20
0.40
0.60 Term premium adjustment (II) 1995 ESA (I)
Repurchase agreements: margins
2003 2004 2005 2006 20070.00
200000.00
400000.00
600000.00
800000.00
OvernightWith agreed maturity
Redeemable at noticeRepurchase agreements
Outstanding amounts
2010June

Work ing PaPer Ser i e Sno 1118 / november 2009
DiScretionary FiScal PolicieS over the cycle
neW eviDence baSeD on the eScb DiSaggregateD aPProach
by Luca Agnello and Jacopo Cimadomo