working paper 19-10 protectionism under trump: the china ... · consensus supporting open...
TRANSCRIPT

WORKING PAPER
19-10 Protectionism under Trump: TheChina Shock, Intolerance, and the “FirstWhite President”Marcus NolandJune 2019
AbstractIn 2016, the United States elected an avowedly protectionist president. This paper uses US county-level electoral data to examine this outcome. The hypothesis that support for protectionism was purely a response to globalization is rejected. Exposure to trade competition encouraged a shift to the Republican candidate, but this effect is mediated by race, diversity, education, and age.
If the turn toward protectionism is due to economic dislocation, then public policy interventions could mitigate the impact and support the reestablishment of a political consensus for open trade. If, however, the drivers are identity or cultural values, then the scope for constructive policy intervention is unclear.
JEL codes: D72, F13, F68, Z13Keywords: China shock, Donald Trump, globalization, protectionism, sociotropic voting
Marcus Noland, executive vice president and director of studies at the Peterson Institute for International Economics, has been associated with the Institute since 1985. He is also nonresident senior fellow at the East-West Center.
Author’s note: Paper prepared for the Asian Economic Policy Review (AEPR) conference in Tokyo, Japan, April 6, 2019. I thank Soyoung Han for painstaking research assistance. I would also like to thank, without implicating, Fred Bergsten, Chad Bown, Monica de Bolle, Kim Elliott, Brad Jensen, participants in the AEPR conference, and its editors for helpful comments on an earlier draft.
© Peterson Institute for International Economics. All rights reserved. This publication has been subjected to a prepublication peer review intended to ensure analytical quality.
The views expressed are those of the author. This publication is part of the overall program of the Peterson Institute for International Economics, as endorsed by its Board of Directors, but it does not neces-
sarily reflect the views of individual members of the Board or of the Institute’s staff or management. The Peterson Institute for International Economics is a private nonpartisan, nonprofit institution for rigorous, intellectu-
ally open, and indepth study and discussion of international economic policy. Its purpose is to identify and analyze important issues to make globalization beneficial and sustainable for the people of the United States and the world, and
then to develop and communicate practical new approaches for dealing with them. Its work is funded by a highly diverse group of philanthropic foundations, private corporations, and interested individuals, as well as income on its capital
fund. About 35 percent of the Institute’s resources in its latest fiscal year were provided by contributors from outside the United States. A list of all financial supporters is posted at https://piie.com/sites/default/files/supporters.pdf.
1750 Massachusetts Avenue, NW | Washington, DC 20036-1903 USA | +1.202.328.9000 | www.piie.com
2
“We must protect our borders from the ravages of other countries making our products, stealing our companies, and destroying our jobs. Protection will lead to great prosperity and strength.”
Donald J. Trump, presidential inaugural address1
Following the debacle of the Smoot-Hawley tariff in the 1930s and the Great Depression that followed, a broad
consensus supporting open international trade policies prevailed in American politics for three generations. The
2016 presidential campaign of Republican candidate Donald J. Trump departed from that longstanding norm
by emphasizing limits on immigration and international trade as key campaign issues, along with promoting
explicitly nationalist and protectionist positions (figure 1).2 Survey data suggest that changes in the underlying
attitudes of a substantial number of American voters mirrored this shift, however, and in November 2016
Trump was elected president, despite losing the popular vote (Mutz 2018).
To a significant extent, Trump has delivered on his campaign promises. During his first week in office, he
pulled the United States out of the Trans-Pacific Partnership initiative. Subsequent renegotiations of the North
American Free Trade Agreement and the Korea-US Free Trade Agreement, through the tightening of rules of
origin and the lengthening of liberalization timelines, moved those two agreements from free trade. He imposed
protection in steel and aluminum via a national security case (Section 232 of the Trade Expansion Act of 1962),
started a trade war with China, and has threatened trade relations with other partners via a pending Section 232
case on trade in automobiles and parts.
Applied protection has skyrocketed: 15 percent of US imports, mostly from China, were covered by special
protection (though some of this coverage pre-dates Trump) (Bown and Zhang 2019). If Trump were to carry
through on his threat to hit the remainder of Chinese imports not currently covered, that figure would rise
further. If the United States were to impose Section 232 protection on autos, another 15 percent of imports
would come under special protection. In short, the administration is contemplating putting 40 percent of US
imports under special protection. Several trading partners, including China and the European Union, have
retaliated by imposing tariffs on 8 percent of US exports (Bown, Jung, and Lu 2018); this figure will rise if the
administration makes good on its threats to impose more tariffs. Amiti, Redding, and Weinstein (2019) estimate
annual real income loss of $17 billion due to protection in place at the end of 2018. This figure is likely an
underestimate, however, insofar as the underlying model does not consider productivity effects (e.g., damage to
value chains and productivity losses due to shifting intermediate input suppliers).3
Two broad explanations have been offered for the apparent shift in voter preferences and Trump’s electoral
success, one emphasizing economic anxiety and the other emphasizing white voters’ distress over status loss, both
1. Available at www.whitehouse.gov/inaugural-address (accessed on September 22, 2017).
2. The subjective scoring of De Bolle and Zettelmeyer (2018) reported in figure 1 is supported by a quantita-tive analysis of political communication by Cerrato, Ferrara, and Ruggieri (2018), which found that Republican candidates shifted from free trade to protectionism, as well as articulated harsh anti-immigration positions, linked minorities to criminal justice issues, and targeted Muslim countries.
3. Fajgelbaum et al. (2019) estimate that the annual losses from higher import prices of protection imposed in 2018 is $69 billion; accounting for tariff revenue and gains to domestic producers through higher prices, the net welfare loss is $6 billion.
3
as the dominant group at home and in America’s standing abroad.4 Economic distress due to enhanced import
competition (sometimes attributed specifically to competition from China) has been linked to voters turning
to protectionism, particularly white male voters in areas with high levels of manufacturing employment (Che
et al. 2016; Jensen, Quinn, Weymouth 2017; Freund and Sidhu 2017; Autor et al. 2018; Bisbee n.d.).5 Over
the past two generations, the US economy has experienced a tremendous increase in globalization. The share of
international trade in national income has risen steadily, roughly tripling from 9 percent in 1960 to 27 percent
in 2017. In the United States, the expansion of trade tends to depress the wages of low-skilled workers, increase
the wages of some skill classes, and may well increase the returns to capital, land, and other natural resources. It
is argued that the so-called China shock of the 1990s and the granting of permanent normal trade relations status
to China following its accession to the World Trade Organization (WTO) in 2001, together with a period of
Chinese currency undervaluation, contributed to a surge in manufactured imports particularly harmful to US
manufacturing employment (Autor, Dorn, and Hanson 2013).
That period of rapid increase in import penetration has passed. Hicks and Devaraj (2015), who decompose
US job loss in manufacturing during the period 2000–2010 into components associated with technological
change, trade, and shifts in domestic demand, find that productivity change accounted for 88 percent of the job
losses. But citizens cannot vote against technological change. In this malaise, international trade policy becomes
the scapegoat of those unhappy with prevailing economic trends. The United States is not alone in experiencing
public dissatisfaction with trade policy, and the growing salience of immigration concerns in the United States
and elsewhere suggests that the expressions of unease with international trade and immigration may reflect
apprehensions that run deeper than the national income accounts.
Working with survey data on individual voters, Mutz (2018) shows that the shift in preferences toward
protectionism, and the likelihood of voting for Trump as the protectionist candidate, was uncorrelated with
household economic distress or perceptions about the impact of international trade on household economic
well-being. Instead, attitudes were correlated with voter perceptions of American global dominance and the
group position of whites domestically. This result is consistent with survey data showing nearly half of whites,
and a majority of Republicans, believe that majority-minority status will have a negative impact on American
customs and values (Pew Research Center 2019). Furthermore, Mutz finds that these preferences were not a
matter of being “left behind.” Once attitudes toward group status threat are considered, educational attainment
was uncorrelated with support for Trump; instead fear of status erosion and impaired ability to use system domi-
4. A number of observers, including former director of national intelligence James Clapper, have claimed that Russian electoral interference was decisive in the electoral outcome (“Russia ‘turned’ election for Trump, Clapper believes,” PBS NewsHour, May 23, 2018, www.pbs.org/newshour/show/russia-turned-election-for-trump-clapper-believes). This possibility is not addressed in this paper.
5. Di Tella and Rotemberg (2018) reach a demographically similar profile of Trump supporters but through an en-tirely different route. Using survey data from just before the 2016 election, and a psychological model of populism as insurance against elite betrayal, they find that two groups respond to priming about the role of competence in policymaking with quantitatively significant increases in support for Trump: rural voters and white voters living in urban and suburban areas with less than two years of postsecondary education. They interpret this affirmative vote against competency as reflective of betrayal aversion, invoking historian Richard Hofstadter’s characteriza-tion of the “paranoid style” of American politics.
4
nance to extract benefits motivated white voters.6 Kaufmann (2017) obtains a similar result showing American
support for Trump is positively correlated with authoritarian attitudes and income (but not education).7 Cox,
Lienesch, and Jones (2017) find that economic hardship was in fact weakly correlated with support for Trump’s
Democratic opponent, Hillary Clinton.8
This is not to say that the white working class is not also imbued with these apprehensions. A preelection
survey found that “fears about immigrants and cultural displacement” were more important than economic
concerns in predicting support for Trump (Cox, Lienesch, and Jones 2017). Almost two-thirds of those white
working class voters surveyed believe that American culture and way of life have deteriorated since the 1950s,
and almost half say that they “often feel like a stranger in my own country.” More than two-thirds believe
that America needs to be protected from foreign influence, far more than the 44 percent of college-educated
Americans who hold these views. These white working class voters believe that immigrants threaten America at
more than twice the rate that they believe immigrants strengthen it. More than half believe that discrimination
against whites is now as big a problem as discrimination against blacks and other minorities, while 70 percent of
college-educated whites disagree with this proposition. Sixty percent of white working class voters surveyed—
roughly double the rate of college graduates—believe that the country is so off track that it needs a strong leader
willing to break the rules.
Such attitudes can be primed. Surveys in which respondents were treated with information about President
Barack Obama or the impending end of white majority status obtained shifts toward supporting conservatism,
the Tea Party (and within the Tea Party, racialized, as distinct from libertarian, aspects of its platform), Donald
Trump, and intensified racism (Craig and Richeson 2014a, 2014b; Major, Blodorn, and Blascovich 2016; Willer,
Feinberg, and Wetts 2016).9 And anti-immigrant and racist sentiments were important motives in voting for
Trump as revealed in a pre- and post-election survey of individual voters (Hooghe and Dassonneville 2018).
Needless to say, given the susceptibility of underlying attitudes to priming, the election and subsequent reelection
of a Harvard Law–educated black man as president could be interpreted as a significant “treatment” (Tesler 2016).
Moreover, considerable evidence indicates that attitudes toward international trade and domestic minorities
are not separable.10 Mansfield and Mutz (2009) argue that prejudicial attitudes toward domestic minorities is a
6. Surveys done by Pew Research document a decline among Americans in the country’s perceived global standing (Pew Research Center 2019). The fall has been particularly acute among Republicans (Pew Research Center 2014). China is perceived negatively by most Americans, particularly older Americans. Pluralities believe that China has or will replace the United States as the dominant global power and is the world’s leading economic power (www.pew-global.org/2014/07/14/global-opposition-to-u-s-surveillance-and-drones-but-limited-harm-to-americas-image/).
7. Similarly, Parker and Barreto (2016) observe that Tea Party supporters tend to be economically advantaged.
8. Freund and Sidhu (2017) observe that voter turnout in the 2016 presidential election fell among the white work-ing class in manufacturing-intensive regions. This phenomenon could be interpreted as support for the argument that backing from elite whites was what put Trump over the top.
9. Examples of the libertarian aspects of Tea Party positions would be low taxes and regulations. Examples of racialized positions would be opposition to Barack Obama, support for racial profiling in law enforcement, opposi-tion to immigration, and hostility toward Muslim nations.
10. Grossman and Helpman (2018) present a theoretical model in which utility has both material and psychosocial components. Changes in social identification patterns that arise from increased income inequality or racial or eth-nic tensions can generate changes in equilibrium protection. To the extent that social identification approximates discrete choice, “if identity choices by those with shared characteristics are positively correlated, discrete changes

5
better predictor of trade policy attitudes than occupational or employment status. Cerrato, Ferrara, and Ruggieri
(2018) find that individuals in regions exposed to the “China shock” have harsher attitudes towards immigrants
and racial minorities and tend to gravitate toward more extreme forms of their own religion.11 They tend to adopt
more favorable attitudes toward Christian fundamentalists (the in-group religion) and negative attitudes towards
Muslims.12 Given that Muslims make up roughly 1 percent of the US population, it is hard to argue that such
sociotropic views are a product of competition over scarce resources or labor market outcomes. There is evidence
that Trump’s emphasis on immigration and trade increased the salience of these issues and, together with his
superior alignment with shifting voter preferences, attracted votes (Mutz 2018). His campaign’s articulation of
protectionist positions and the use of racially charged, anti-immigrant, and Islamophobic political language—as
documented by Cerrato, Ferrara, and Ruggieri—amounted to a self-reinforcing package.
The economic and cultural explanations are not mutually exclusive, though the precise channels through
which these effects operate are difficult to parse. Autor et al. (2018) find that political polarization is intimately
tied not just to economic displacement due to trade shocks but also specifically to industries employing large
numbers of white males. White male voters likely experience such distress most acutely, insofar as they perceived
threats to dominance both domestically and globally. Similarly, Freund and Sidhu (2017) find that the impact
of trade on the Trump vote was conditional on the racial composition of the county. Trade shocks may be
encouraging support for protectionism for conventional economic reasons (though Mutz’s finding on the lack
of correlation between household economic distress and support for Trump calls even this result into question),
but it seems clear that voter perceptions of trade effects are intimately tied to a nexus of issues revolving around
race, education, and status.
Parsing these alternative explanations is important for understanding the future trajectory of US trade
policy. This paper examines the power of these competing explanations on county-level voting patterns. The
idea that the turn to protectionism was purely a response to globalization is rejected. Exposure to trade competi-
tion encouraged a shift to the Republican candidate, but this effect is mediated by race, diversity, education, and
age, and economics may not be the most important driver.
This is a sobering result. If economic distress solely drove the shift toward protectionism, then policy inter-
vention could ameliorate the negative impact of trade on segments of the population and support a return to
open trade policies. However, if at base the outcome of the 2016 election was an expression of white anxiety over
loss of status and political control, captured memorably by Ta-nehisi Coates’s (2017) characterization of Donald
Trump as “the first white president,” then it is hard to envision a policy response to such concerns.
in self-identification at the individual level can go hand in hand with precipitous changes in policy preferences at the aggregate level” (Grossman and Helpman 2018, 28).
11. Social psychology research supports the notion that Christians regard themselves as more prototypically American than other citizens, and conversely Americans envision prototypical Americans as native born, resident most of their lives, having US citizenship, Christian, and probably white. The more nationalist the respondent, the more exclusive these boundary characteristics become (Theiss-Morse 2009).
12. Expressions of this anxiety can reach apocalyptic intensity: Senator Ben Sasse (R-NE) recounts a constituent writing that “by the end of a Hillary Clinton administration, ‘America would have been hunting Christians in the street for sport under a 7-2 Hillary [Supreme] Court’” (Sasse 2018, 93).
6
MODELING VOTING PATTERNS
Following Freund and Sidhu (2017) and others, this paper analyzes county-level presidential election results
using data from Dave Leip’s Atlas of U.S. Presidential Elections.13 The dependent variable is the change in the
Republican vote share between the 2012 and 2016 elections. As a rough robustness check, the period 2000–2016
is also examined. The 2000 election was selected insofar as it preceded the global financial crisis and was the most
recent presidential election comparable to 2016 in that the incumbent was not on the ballot.
Explanatory variables are introduced in four waves: a set of demographic indicators, economic variables,
cultural variables, and interaction terms. Values of explanatory variables are taken from time periods preceding
the 2012–16 and 2000–2016 cycles, respectively. All regressions are estimated using robust standard errors to
account for the heteroskedasticity created by the widely differing county sample population sizes.
Regressions on demographic indicators are reported in the first two columns of table 1, (1.1) and (1.2) for
the periods 2012–16 and 2000–2016, respectively. Data on age, race, ethnicity, and education in 2000 and
2010 are taken from the US Census.14 The regressions explain roughly half of sample variation. The coefficients
on the share of the population without a college degree, and interaction terms between not having a college
degree and white population share and not having a college degree and population share ages 50 and older, are
all positive and significant at the 1 percent level in both the 2012–16 and 2000–2016 specifications. That is to
say, counties with populations that have low educational attainment, specifically those that have low educational
attainment and are white and older, exhibited a shift toward the Republican candidate. Conversely, the share
of the population that was black or Hispanic was associated with a shift away from the Republican candidate.
In the next four columns, economic variables are entered. In specifications (1.3) and (1.4), the Republican
vote share is regressed against data taken from the Bureau of Labor Statistics on the employment share in
manufacturing and tradable services.15 If political allegiances follow economic interests, the import-competing
manufacturing sector is expected to favor protectionism, while the export-oriented services sector is expected
to support openness. These regressions explain 20 percent of sample variation, with the coefficients taking the
expected signs at the 1 percent level.16
Particular concern has been expressed regarding competition from China. From a pure economics stand-
point, it is not clear why the specific source of import competition should be relevant; the focus on China could
be connected to the aforementioned concern about that country supplanting the United States as a global power
13. Available at http://uselectionatlas.org. Due to data limitations, Alaska, Puerto Rico, and the US Virgin Islands are not included in the analysis.
14. Education-related data used in the 2012–16 regressions are based on a 2008–12 five-year estimate.
15. Using the classification provided in appendix C of Jensen, Quinn, and Weymouth (2017), tradable services include information, finance, and business and professional services.
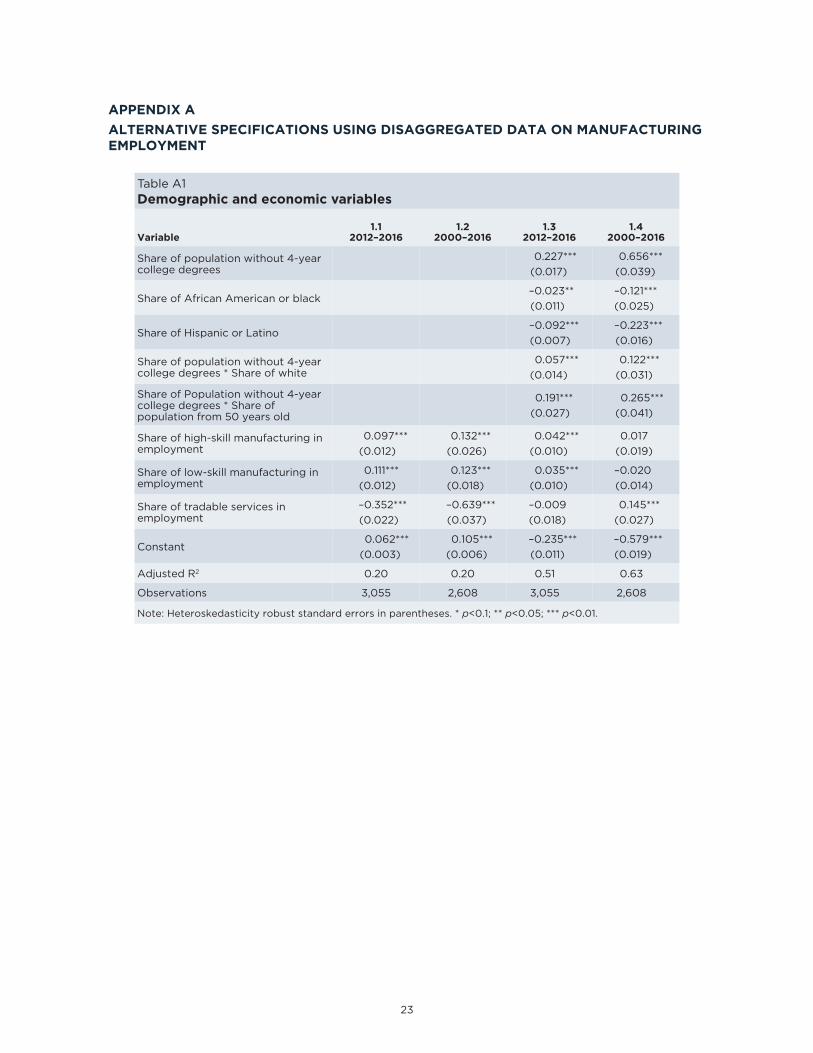
16. Following Jensen, Quinn, and Weymouth (2017), the manufacturing data were disaggregated into high- and low- wage industries, and when subindustry employment data are unavailable, k-th nearest neighborhood in the same state method was used to estimate high- and low-wage industries’ employment. In the specifications reported in this paper, the hypothesis of equality of the coefficients on these two terms could never be rejected at conventional levels of statistical significance. In the interests of parsimony, the regressions using overall manu-facturing employment are reported, but for the sake of completeness, the alternative specifications using the disaggregated data are reported in appendix A. Jensen, Quinn, and Weymouth had access to firm-level data via the Census Bureau, and this greater granularity may have contributed to their sharper result.

7
and, in that sense, is connected to deeper cultural issues and is not simply an indicator of economic distress. In
specifications (1.5) and (1.6) data from Autor, Dorn, and Hanson (2013) via Freund and Sidhu (2017) on the
China import exposure is regressed against the change in the Republican vote share. The China shock variable
attempts to instrument out the effect of domestic demand shocks by instrumenting Chinese exports to European
countries across industries, then matching those industries to US commuter zone–level employment composi-
tion. Although this variable will not pick up the impact of integration with China on exports, and commuting
zones are more broadly defined than counties, the China shock variable is nevertheless significant at the 1
percent level with the expected positive sign in both regressions.17
In table 2, the demographic and economic variables are entered jointly. The coefficients on the demo-
graphic variables are all estimated with their expected signs at conventional levels of significance. The addition
of the economic variables improves regression fit at the margin. In specification (2.1), the coefficient on the
manufacturing employment share is positive and significant, but the coefficient on the tradeable services share is
insignificant. In regression (2.2) over the period 2000–2016, the coefficient on the manufacturing employment
share is statistically insignificant, and the coefficient on the tradable services share is significant but takes the
“wrong” sign. When the trade exposure variables are replaced with the China shock variable in regressions (2.3)
and (2.4), all coefficients are estimated with their expected signs at the 5 percent or better level.
These regressions demonstrate that demographics are tightly correlated with voting patterns. There is
evidence to support the hypothesis that the effect of trade influences voting patterns, but the precise channel of
influence is debatable. In table 3, cultural variables are introduced. On the basis of World Values Survey data,
Inglehart and Norris (2016) argue that a division is widening among Americans, in significant part along an
educational fault line, with regard to a nexus of views that might be broadly construed as signaling tolerance.
These attitudes include the desirability of an authoritarian leader for the United States (those without college
degrees are more than half again as likely to support this notion), racial and gender equality, and sexual mores.18
To explore the role these attitudes play in voting patterns more concretely, data was collected on hate
crimes, acceptance of gays, and status of women.19 The Department of Justice (DoJ) defines a hate crime as one
“motivated by bias against race, religion, disability, sexual orientation, ethnicity, gender, or gender identity.”20
17. The unemployment rate was also tried, but the results were weak and are thus not reported. The change in voting pattern is also correlated with a measure of job susceptibility to automation but these data do not go back to 2012 (let alone 2000) and hence are not predetermined.
18. Presumably this was the population segment Hillary Clinton had in mind when she referred to some Trump supporters as “deplorables.” Speaking at a 2016 fundraiser, she is reported to have said, “You know, to just be grossly generalistic, you could put half of Trump’s supporters into what I call the basket of deplorables. Right? The racist, sexist, homophobic, xenophobic, Islamophobic—you name it. And unfortunately, there are people like that. And he has lifted them up.” She then went on to say that the other half of Trump’s supporters “feel that the government has let them down” and are “desperate for change. Those are people we have to understand and empathize with as well.” Katie Reilly, “Read Hillary Clinton’s ‘Basket of Deplorables’ Remarks About Donald Trump Supporters,” Time, September 10, 2016, http://time.com/4486502/hillary-clinton-basket-of-deplorables-transcript/ (accessed on March 5, 2019).
19. Markers for Protestant, mainline Protestant, and Evangelical Protestant were also tried but did not yield consis-tent statistical results.
20. Definition and information on Department of Justice collection of data on hate crimes are available at www.justice.gov/hatecrimes/learn-about-hate-crimes. In both the 1999 and 2011 samples, a single hate crime was

8
Local police and prosecutors report such crimes, and there is no guarantee that the classification standards
are applied uniformly across jurisdictions; nevertheless, the DoJ provides a comprehensive listing of crimes
attributable to a hate motive.21 Tolerance of gays was proxied by the number of gay-oriented establishments in
each county listed in the 1999 guide, a sort of “Green Book” for gay travelers.22 Both the hate crime and gay
establishment measures are expressed in per voter terms.
It is remarkably difficult to locate county-level data on the status of women that extend back to 2000.
Unable to obtain data on the presence of women as officeholders or political candidates, doctors or lawyers, the
ratio of female to male graduates with college or postgraduate degrees from the US Census has been adopted as
an indicator of female status.23
Lastly, much of the survey literature has uncovered unease among the white population with ethnic and reli-
gious minorities. It is well known in the development literature that ethno-linguistic fractionalization (ELF)—a
measure of the probability that two random individuals in an area do not share the same cultural identity—
may be associated with intense political competition over rents generated and allocated by the political system
(Alesina, Baqir, and Easterly 1999; Alesina and La Ferrara 2005). More specifically, voters in fractionalized
polities may not support the provision of public goods if they believe that the benefits will flow largely to
out-groups. To explore this idea, the change in ELF in the run-up to the 2016 election was calculated, where
ELF = �� ��∑ 𝑝𝑝������
and pi is a share of each race group.24 The expectation is that rising ELF will be associated
with white discomfort and a shift toward the Republican candidate.
The cultural variables are regressed against voting patterns in table 3. In specifications (3.1) and (3.2), they
explain 10 to 12 percent of sample variation. All coefficients are significant at the 1 percent level. Increased racial
diversity is correlated with a shift toward the Republican candidate. The existence of hate crimes is correlated
with a shift away from the Republican candidate. This is unexpected if hate crimes are interpreted as signaling
the local presence of intolerance. The presence of gay establishments is associated with a fall in the share of
Republican votes. An increase in relative female education is associated with a rise in the Republican vote share.
This is unexpected given the well-known “gender gap,” but as Mansfield and Mutz found, women are more
protectionist than men, and most white women voted for Trump.
reported for a county with an extremely low population, generating an extraordinarily skewed distribution and creating highly influential data points. These two observations were dropped.
21. The Southern Poverty Law Center’s data on hate groups were also analyzed but ultimately not used because they had a lower correlation with voting patterns than did the hate crime data.
22. Data from 1999 are used in both sets of regressions. The distribution of this variable is highly skewed, in significant part to the existence of tourist towns like Provincetown, MA, and Key West, FL, which have many gay establishments but very small numbers of registered voters. These tourist destinations were excluded from the sample. “Green Book” refers to the travel guide published for African American motorists during segregation that identified businesses (e.g., restaurants, hotels, and gas stations) that would serve them.
23. The Census does report data on females in management occupations, but this measure had a weaker correla-tion with voting patterns than the relative female-male educational attainment variable.
24. The racial groups are defined as White, Black/African American, Asian, Alaskan Native/Native Americans, Native Hawaiians/Pacific Islanders, and Other. “Hispanic” is not a racial category in the US Census, but as Alesina, Baqir, and Easterly (1999) observe, the correlation between “Hispanic” and the “Other” category is 0.9, so for practical purposes, “Other” can be interpreted as Hispanic.

9
These results change considerably when the cultural variables are entered jointly with the demographic
controls in specifications (3.3) and (3.4). All demographic variables are statistically significant with their
expected signs. Increased racial diversity is associated with a shift toward the Republican candidate during the
2012–16 period but not in the longer 2000–2016 period. One interpretation of this result is that the election
of President Obama in 2008 and 2012 did indeed induce a backlash. The presence of gay establishments is no
longer significantly correlated with voting patterns. Hate crimes are statistically insignificant in specification
(3.3) but significant at the 10 percent level with a positive coefficient in specification (3.4). In other words,
when demographic controls are added, the existence of hate crimes is weakly associated with an increase in the
Republican vote share. Relative female educational attainment continues to be associated with a shift to the
Republican candidate at the 1 percent level.
The demographic, economic, and cultural indicators are entered jointly in table 4. The coefficients on the
demographic variables are all estimated with the expected signs at the 1 percent level. The economic variables
exhibit the same pattern as in table 2: The coefficient on the manufacturing employment share is associated with
a shift toward the Republican candidate over the 2012–16 period (4.1) at the 1 percent level but is uncorrelated
with the voting pattern over 2000–16 (4.2). The coefficient on the services employment share exhibits the
opposite pattern: statistically insignificant in (4.1) and significant with an unexpected sign in (4.2). The China
shock variable is significant at the 1 percent level with the expected sign in both regressions.
Increased diversity over the period 2012–16 is associated at the 1 percent level with a shift toward the
Republican candidate in both the specifications using employment shares (4.1) and the China shock (4.3).
The coefficient on hate crimes is again weakly positive in specification (4.2) (i.e., the presence of hate crimes is
associated with a shift toward the Republican candidate). The existence of gay establishments is uncorrelated
with vote shares. Relative female educational attainment remains correlated with a shift toward the Republican
candidate at the 1 percent level.
The American president is not elected by direct popular vote, but rather through a system that aggregates
votes at the state level. The electoral college system generates a phenomenon in which votes in some sharply
contested “swing states” are implicitly more valuable than votes cast in less competitive regions. To examine
whether the hypotheses under consideration were particularly salient in the 2016 swing states (Colorado,
Florida, Iowa, Michigan, Minnesota, Nevada, New Hampshire, North Carolina, Ohio, Pennsylvania, Virginia,
and Wisconsin), the results in table 4 were decomposed by explanatory variable.
Focusing on the 2012–2016 cycle, these states voted more Republican than the nation as a whole. Relative
to the national average, the swing states were older, less educated, more white, and less Hispanic, with a higher
manufacturing employment share. When combined with the coefficients estimated in table 4, the low level of
education and its interactions with the white and older population shares, together with the Hispanic population
share, are the biggest sources of divergence from national voting patterns.
10
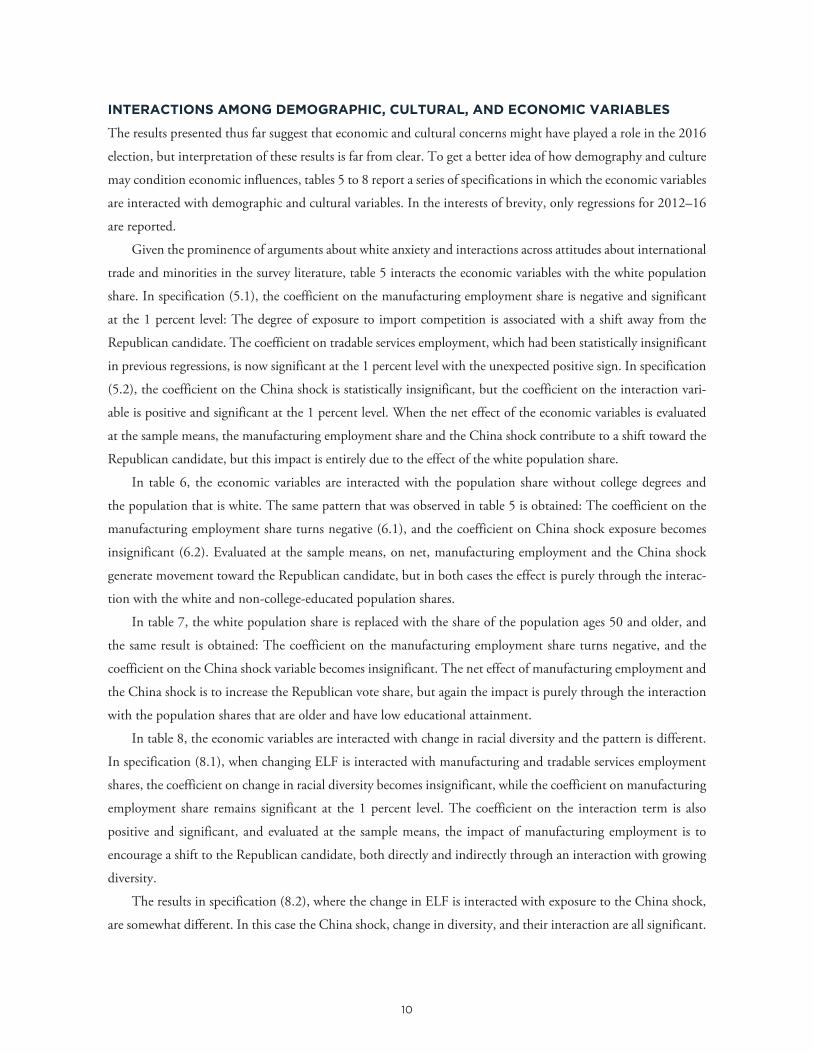
INTERACTIONS AMONG DEMOGRAPHIC, CULTURAL, AND ECONOMIC VARIABLES
The results presented thus far suggest that economic and cultural concerns might have played a role in the 2016
election, but interpretation of these results is far from clear. To get a better idea of how demography and culture
may condition economic influences, tables 5 to 8 report a series of specifications in which the economic variables
are interacted with demographic and cultural variables. In the interests of brevity, only regressions for 2012–16
are reported.
Given the prominence of arguments about white anxiety and interactions across attitudes about international
trade and minorities in the survey literature, table 5 interacts the economic variables with the white population
share. In specification (5.1), the coefficient on the manufacturing employment share is negative and significant
at the 1 percent level: The degree of exposure to import competition is associated with a shift away from the
Republican candidate. The coefficient on tradable services employment, which had been statistically insignificant
in previous regressions, is now significant at the 1 percent level with the unexpected positive sign. In specification
(5.2), the coefficient on the China shock is statistically insignificant, but the coefficient on the interaction vari-
able is positive and significant at the 1 percent level. When the net effect of the economic variables is evaluated
at the sample means, the manufacturing employment share and the China shock contribute to a shift toward the
Republican candidate, but this impact is entirely due to the effect of the white population share.
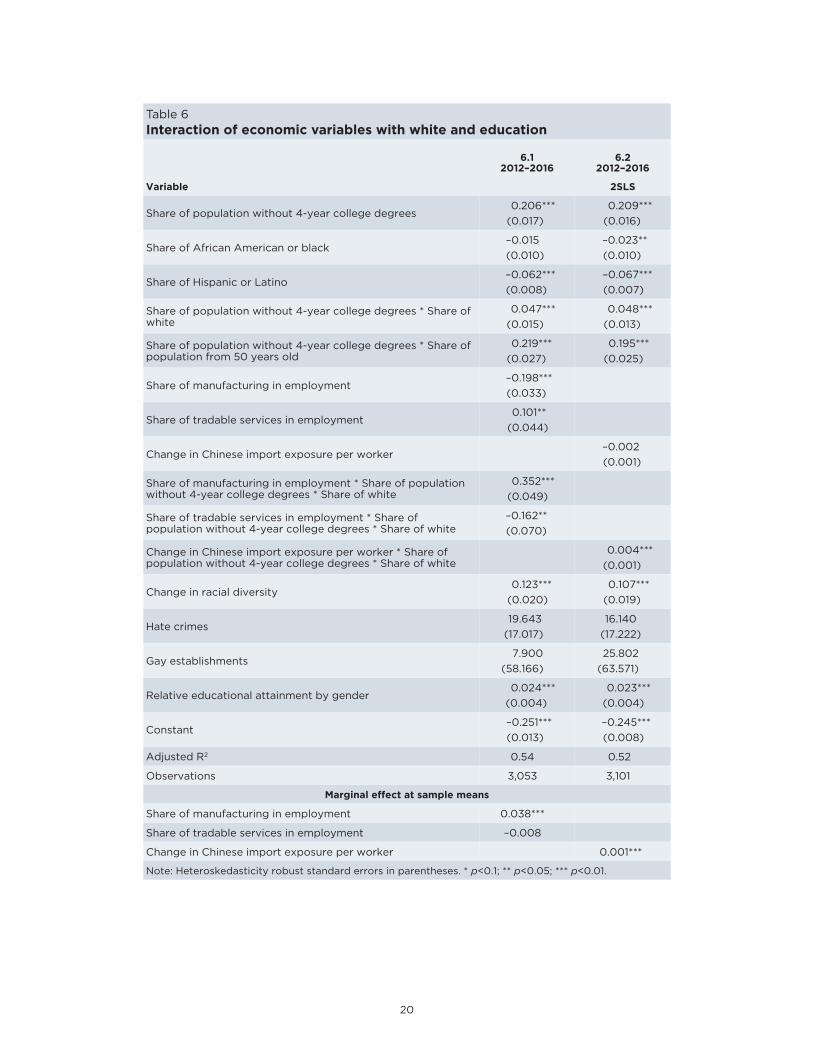
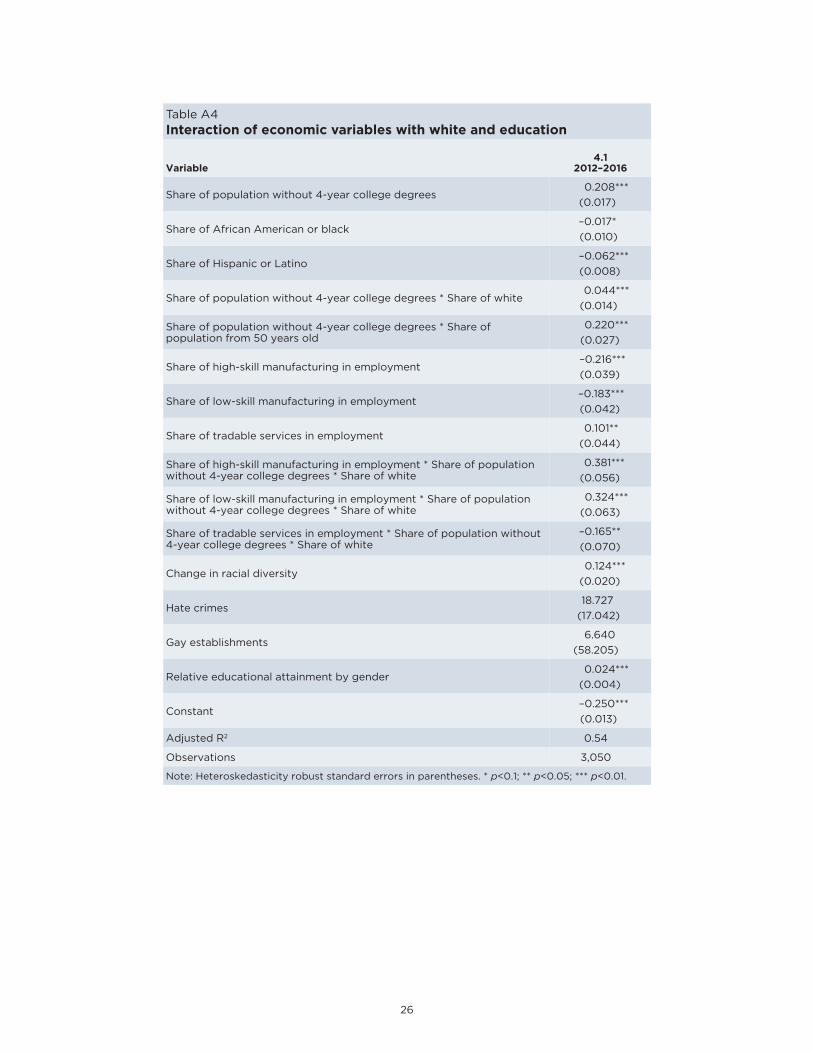
In table 6, the economic variables are interacted with the population share without college degrees and
the population that is white. The same pattern that was observed in table 5 is obtained: The coefficient on the
manufacturing employment share turns negative (6.1), and the coefficient on China shock exposure becomes
insignificant (6.2). Evaluated at the sample means, on net, manufacturing employment and the China shock
generate movement toward the Republican candidate, but in both cases the effect is purely through the interac-
tion with the white and non-college-educated population shares.
In table 7, the white population share is replaced with the share of the population ages 50 and older, and
the same result is obtained: The coefficient on the manufacturing employment share turns negative, and the
coefficient on the China shock variable becomes insignificant. The net effect of manufacturing employment and
the China shock is to increase the Republican vote share, but again the impact is purely through the interaction
with the population shares that are older and have low educational attainment.
In table 8, the economic variables are interacted with change in racial diversity and the pattern is different.
In specification (8.1), when changing ELF is interacted with manufacturing and tradable services employment
shares, the coefficient on change in racial diversity becomes insignificant, while the coefficient on manufacturing
employment share remains significant at the 1 percent level. The coefficient on the interaction term is also
positive and significant, and evaluated at the sample means, the impact of manufacturing employment is to
encourage a shift to the Republican candidate, both directly and indirectly through an interaction with growing
diversity.
The results in specification (8.2), where the change in ELF is interacted with exposure to the China shock,
are somewhat different. In this case the China shock, change in diversity, and their interaction are all significant.

11
The China shock, reinforced by increasing diversity, encourages a shift to the Republican candidate. The increase
in diversity is also independently associated with a rise in the Republican vote share regardless of exposure to
Chinese imports.
CONCLUSION
In 2016, the United States elected a protectionist presidential candidate. There are two broad explanations for
this departure from the historical norm. The first is that this development is a reaction to the globalization of the
US economy, possibly due to trade competition with China specifically. The other is that the move is essentially
driven by white anxiety over group status within the United States and the country’s broader standing in the
world. The two hypotheses are not mutually exclusive and are difficult to disentangle: Survey research indicates
that individuals compound attitudes toward racial and religious minorities, immigrants, foreigners, and trade.
From this perspective, the use of racialized language and imagery by Republican candidates while promoting
protectionism is a self-reinforcing package.
The evidence presented in this paper rejects the first hypothesis: The turn toward protectionism cannot
be judged as a purely economic phenomenon. While trade exposure may play a role in voting patterns, it does
so through the prisms of race, diversity, education, and age. Such effects were particularly acute in so-called
swing states. What cannot be assessed is if white anxiety is a purely cultural phenomenon: The survey evidence
demonstrating the interactions of personal attitudes toward trade and out-groups confounds parsing that issue
via aggregate data, as are used in this paper. The finding that increased diversity is statistically significant in
the 2012–16 election results but not the 2000–2016 results could be interpreted as supportive of the “cultural
backlash” hypothesis, either in the narrow sense that the 2016 election result was a reaction to the presidency of
Barack Obama or in the broader sense that economic anxiety following the global financial crisis and intensified
international trade competition contributed to heightened social intolerance, or both.
If the turn toward protectionism were solely an economic phenomenon, then public policies to ameliorate
the negative impact of trade exposure on segments of the population might make reestablishing a political
consensus to underpin open trade possible. The demographic and cultural issues would seem less amenable to
public policy intervention. Racial identity is immutable (at least in the short run), as are trends in racial diversity.
The results reported in this paper also highlight the salience of age and education in voting patterns, but
whether these markers should be interpreted in an absolute or positional sense is unclear. It may be the case that
the current cohort of older Americans are uncomfortable with changes in US society and its role in the world
but that the next generation of older Americans may view things differently. Or it could be that each generation
of older Americans is as irascible and intolerant as the last.
Similarly, it is unknown whether the salience of education is driven by the impact that education has on
individuals (i.e., they become more confident and tolerant) or if the educational effect uncovered in this paper
is a marker of position within a hierarchical social order. If it is the former, then expanding education would
deliver a less anxious citizenry. If it is the latter, expanding education would simply raise the dividing line from
a college diploma to a postgraduate degree.

12
In the short run, Donald Trump forged a successful political coalition of probusiness conservatives seeking
tax cuts and deregulation, social conservatives, and nationalists. The probusiness and nationalist factions could
conceivably clash over trade policy, though favorable tax treatment and deregulation are likely to outweigh the
business community’s reservations on trade. If this coalition holds, protectionism should be politically sustain-
able, at least within the current Republican Party. If the costs of protectionism grow too extreme, the business
conservatives could defect, though the magnitudes of the costs of protection applied thus far relative to the
benefits via tax policy and deregulation would make this unlikely. Similarly, shifts toward extreme noneconomic
policies could fracture the coalition, or it could be overwhelmed by a rejuvenated Democratic Party.
Yet that last outcome would not automatically mean a return to more liberal trade policies. Antiglobalization
has become the default position within the Democratic Party, and while returning Democrats to power would
reinvigorate the United States’ commitment to multilateral cooperation, it would not necessarily result in more
open trade.
In sum, it appears unlikely that the United States will return to liberal trade policies any time soon. The
implications of this development would be especially regrettable if the rest of the world were to emulate the US
example in this regard.
REFERENCESAlesina, Alberto, Reza Baqir, and William Easterly. 1999. Public Goods and Ethnic Divisions. Quarterly Journal of Economics 114, no. 4: 1243–84.
Alesina, Alberto and Eliana La Ferrara. 2005. Ethnic Diversity and Economic Performance. Journal of Economic Literature 43, no. 3: 762–800.
Amiti, Mary, Stephen J. Redding, and David Weinstein. 2019. The Impact of the 2018 Trade War on U.S. Prices and Welfare. DP 13564. London: Centre for Economic Policy Research.
Autor, David H., David Dorn, and Gordon H. Hanson. 2013. The China Syndrome: Local Labor Market Effects of Import Competition in the United States. American Economic Review 103, no. 6: 2121–68.
Autor, David H., David Dorn, Gordon H. Hanson, and Kaveh Majlesi. 2018. Importing Polarization? The Electoral Consequences of Rising Trade Exposure. NBER Working Paper 22637. Cambridge, MA: National Bureau of Economic Research.
Bisbee, James. n.d. What is out your back door: How policy preferences respond to local trade shocks. Available at www.dropbox.com/s/vacprfieznxzc9b/bisbee_jmp.pdf?dl=0 (accessed on March 4, 2019).
Bown, Chad P., Jung, Euijin, and Lu, Zhiyao (Lucy). 2018. Trump and China Formalize Tariffs on $260 Billion of Imports and Look Ahead to Next Phase. PIIE Trade and Investment Policy Watch Blog, September 20. Available at https://piie.com/blogs/trade-investment-policy-watch/trump-and-china-formalize-tariffs-260-billion-imports-and-look.
Bown, Chad P., and Eva (Yiwen) Zhang. 2019. Measuring Trump’s 2018 Trade Protection: Five Takeaways. PIIE Trade and Investment Policy Watch Blog, February 15. Available at https://piie.com/blogs/trade-investment-policy-watch/measuring-trumps-2018-trade-protection-five-takeaways.
Cerrato, Andea, Federico Maria Ferrara, and Francesco Ruggieri. 2018. Why Does Import Competition Favor Republicans? (September 30). Available at SSRN: https://ssrn.com/abstract=3147169 or http://dx.doi.org/10.2139/ssrn.3147169.
Che, Yi, Yi Lu, Justin R. Pierce, Peter K. Schott, and Zhigang Zhao. 2016. Does Trade Liberalization with China Influence U.S. Elections? NBER Working Paper 22178. Cambridge, MA: National Bureau of Economic Research.
Coates, Ta-nehisi. 2017. The First White President. The Atlantic (October). Available at www.theatlantic.com/magazine/archive/2017/10/the-first-white-president-ta-nehisi-coates/537909/.
Cox, Daniel, Rachel Lienesch, and Robert P. Jones. 2017. Beyond Economics: Fear of Cultural Displacement Pushed the White Working Class to Trump. PRRI/The Atlantic Report. Available at www.prri.org/research/white-working-class-attitudes-economy-trade-immigration-election-donald-trump/ (accessed on March 4, 2019).

13
Craig, Maureen A., and Jennifer A. Richeson. 2014a. More Diverse Yet Less Tolerant? How the Increasingly Diverse Racial Landscape Affects White Americans’ Racial Attitudes. Personality and Social Psychology Bulletin 40, no. 6: 750–61.
Craig, Maureen A., and Jennifer A. Richeson. 2014b. On the Precipice of a “Majority-Minority” America: Perceived Status Threat From the Racial Demographic Shift Affects White Americans’ Political Ideology. Psychological Science 25, no. 6: 1189–97.
De Bolle, Monica, and Jeromin Zettelmeyer. 2018. Measuring Economic Nationalism. Seminar presentation at the Peterson Institute for International Economics, Washington, DC, October 26.
Di Tella, Rafael, and Julio J. Rotemberg. 2018. Populism and the return of the “Paranoid Style:” Some evidence and a simple model of demand for incompetence as insurance against elite betrayal. Journal of Comparative Economics 46: 988–1005.
Fajgelbaum, Pablo D., Pinelopi K. Goldberg, Patrick J. Kennedy, and Amit K. Khandelwal. 2019. The Return of Protectionism. Available at www.econ.ucla.edu/pfajgelbaum/RTP1.pdf (accessed on March 4, 2019).
Freund, Caroline, and Dario Sidhu. 2017. Manufacturing and the 2016 Election. PIIE Working Paper 17-7. Washington: Peterson Institute for International Economics. Available at https://piie.com/publications/working-papers/manufacturing-and-2016-election.
Grossman, Gene M., and Elhanan Helpman. 2018. Identity Politics and Trade Policy. NBER Working Paper 25348. Cambridge, MA: National Bureau of Economic Research.
Hicks, Michael, and Srikant Devaraj. 2015. The Myth and the Reality of Manufacturing in America. Center for Business and Economic Research, Ball State University, Muncie, IN.
Hooghe, Marc and Ruth Dassonneville. 2018. Explaining the Trump Vote: The Effect of Racist Resentment and Anti-Immigrant Sentiments. Political Science & Politics 51, no. 3: 528–34.
Inglehart, Ronald F., and Pippa Norris. 2016. Trump, Brexit, and the Rise of Populism: Economic Have-Nots and Cultural Backlash. RWP16-026. Cambridge, MA: John F. Kennedy School of Government.
Jensen, J. Bradford, Dennis P. Quinn, and Stephen Weymouth. 2017. Winners and Losers in International Trade: The Effects on US Presidential Voting. International Organization 71 (Summer): 423–57.
Kaufmann, Eric Peter. 2017. Values and Immigration—The real reasons behind Brexit and Trump. Available at www.researchgate.net/publication/318317407_Values_and_immigration_-_the_real_reasons_behind_Brexit_and_Trump (accessed on March 4, 2019).
Major, Brenda, Alison Blodorn, and Gregory Major Blascovich. 2016. The threat of increasing diversity: Why many White Americans support Trump in the 2016 presidential election. Group Processes and Intergroup Relations 21, no. 6: 931–40.
Mansfield, Edward W., and Diana C. Mutz. 2009. Support for Free Trade: Self-Interest, Sociotropic Politics, and Out-Group Anxiety. International Organization 63, no. 3: 425–57.
Mutz, Diana C. 2018. Status Threat, not economic hardship, explains the 2016 presidential vote. Proceedings of the National Academy of Sciences 115, no. 19: E4330–E4339.
Parker, Christopher S., and Matt A. Barreto. 2016. Change They Can’t Believe In: The Tea Party and Reactionary Politics in America. Princeton: Princeton University Press.
Pew Research Center. 2014. Most Americans think the U.S. is great, but fewer say it’s the greatest. Available at www.pewresearch.org/fact-tank/2014/07/02/most-americans-think-the-u-s-is-great-but-fewer-say-its-the-greatest/.
Pew Research Center. 2019. Looking to the Future, Public Sees An America in Decline on Many Fronts. Available at www.pewsocialtrends.org/2019/03/21/public-sees-an-america-in-decline-on-many-fronts/.
Sasse, Ben. 2018. Them: Why We Hate Each Other—and How to Heal. New York: St. Martin’s Press.
Tesler, Michael. 2016. Post-Racial or Most-Racial? Race and Politics in the Obama Era. Chicago: University of Chicago Press.
Theiss-Morse, Elizabeth. 2009. Who Counts As An American? The Boundaries of National Identity. New York: Cambridge University Press.
Willer, Rob, Matthew Feinberg, and Rachel Wetts. 2016. Threats to Racial Status Promote Tea Party among White Americans. Working Paper No. 3422. Stanford CA, Stanford University Graduate School of Business. Available at www.gsb.stanford.edu/faculty-research/working-papers/threats-racial-status-promote-tea-party-support-among-white (accessed on March 4, 2019).

14
Figure 1Economic nationalism pre- and post-global financial crisis (GFC) in the United States
Industry Internationaltrade
Competition Inwardforeign direct
investment
Immigration Multilateralorganization
Macroeconomicpolicy
grade
Democratic Party(pre-GFC)
Democratic Party(post-GFC)
Republican Party(pre-GFC)
Republican Party(post-GFC)
Republican Party(President Trump)
2 2
1 1
3
2
3
2
3
4
1 1 1
2
1 1
2
3
4 4 4 4
3 3
1 1 1 1 1
Notes: Economic nationalism is subjectively scored on a scale of 1 to 5 based on political party manifestos. In the chart above scores are based on Democratic and Republican Party platforms adopted in 2004 (pre-GFC) and 2016 (post-GFC). The grades for President Trump are preliminary and based on his policies since 2017. Grade 1 refers to the least economic nationalist standpoint, while grade 5 indicates the most economic nation-alist position. When there is no relevant information to assess, the grade appears as 0 in the chart. The grades are determined by the degree of domestic interest in protectionism in seven policy categories. According to the scale definitions developed by De Bolle and Zettelmeyer (2018), “the scale of:n industrial policy describes whether the state wishes to support specific sectors of the economy and the
means that it is willing to use to reach the objective.n international trade policy captures deviations from the liberal benchmark only to the extent that they are
motivated by nationalism/protectionism. n competition policy describes continuum between the view that competition between firms is all important
and the view that national policy aims can justify limiting or eliminating competition between firms. n inward foreign direct investment (FDI) policy describes the extent and manner in which restrictions on FDI
are used. n immigration policy is organized in terms of both motivations for restricting immigration and the restrictions
that typically follow from these motivations.n multilateral organization describes how a government resolves tensions between narrowly defined national
interests and its potential interest in supporting an organization that can solve collective problems.n macroeconomic policy is defined in terms of the aims of macroeconomic policy, specifically, the extent to
which stability objectives are subordinated to other objectives that may conflict with stability.”
Source: De Bolle and Zettelmeyer (2018).

15
Table 1Demographic and economic variables
1.12012–2016
1.22000–2016
1.32012–2016
1.42000–2016
1.52012–2016
1.62000–2016
Variable 2SLS 2SLS
Share of population without 4-year college degrees
0.251***(0.014)
0.557***(0.025)
Share of African American or black–0.025**(0.010)
–0.074***(0.016)
Share of Hispanic or Latino–0.100***(0.007)
–0.182***(0.011)
Share of Population without 4-year college degrees * Share of white
0.058***(0.013)
0.169***(0.019)
Share of population without 4-year college degrees * Share of population from 50 years old
0.164***(0.024)
0.212***(0.033)
Share of manufacturing in employment
0.104***(0.009)
0.125***(0.017)
Share of tradable services in employment
–0.352***(0.022)
–0.633***(0.037)
Change in Chinese import exposure per worker
0.003***(0.000)
0.006***(0.001)
Constant–0.244***(0.007)
–0.515***(0.012)
0.062***(0.003)
0.105***(0.006)
0.025***(0.002)
0.041***(0.003)
Adjusted R2 0.50 0.61 0.20 0.20 0.03 0.03
Observations 3,112 3,111 3,058 2,621 3,106 3,107
Note: Heteroskedasticity robust standard errors in parentheses. * p<0.1; ** p<0.05; *** p<0.01.

16
Table 2Combined demographic and economic variables
2.12012–2016
2.22000–2016
2.32012–2016
2.42000–2016
Variable 2SLS 2SLS
Share of population without 4-year college degrees
0.224***(0.017)
0.641***(0.037)
0.241***(0.015)
0.547***(0.025)
Share of African American or black–0.021*(0.012)
–0.112***(0.024)
–0.028**(0.011)
–0.085***(0.017)
Share of Hispanic or Latino–0.091***(0.007)
–0.217***(0.015)
–0.093***(0.007)
–0.173***(0.011)
Share of population without 4-year college degrees * Share of white
0.060***(0.014)
0.137***(0.029)
0.056***(0.014)
0.156***(0.021)
Share of population without 4-year college degrees * Share of population from 50 years old
0.190***(0.027)
0.261***(0.040)
0.177***(0.025)
0.231***(0.034)
Share of manufacturing in employment
0.040***(0.008)
–0.011(0.013)
Share of tradable services in employment
–0.007(0.018)
0.150***(0.027)
Change in Chinese import exposure per worker
0.001***(0.000)
0.002***(0.000)
Constant–0.236***(0.011)
–0.578***(0.019)
–0.243***(0.007)
–0.511***(0.012)
Adjusted R2 0.51 0.63 0.51 0.61
Observations 3,058 2,621 3,106 3,107
Note: Heteroskedasticity robust standard errors in parentheses. * p<0.1; ** p<0.05; *** p<0.01.

17
Table 3Demographic and cultural variables
3.12012–2016
3.22000–2016
3.32012–2016
3.42000–2016Variable
Share of population without 4-year college degrees
0.227***(0.015)
0.529***(0.027)
Share of African American or black–0.026***(0.009)
–0.071***(0.017)
Share of Hispanic or Latino–0.077***(0.007)
–0.169***(0.014)
Share of population without 4-year college degrees * Share of white
0.064***(0.011)
0.178***(0.020)
Share of population without 4-year college degrees * Share of population from 50 years old
0.175***(0.024)
0.231***(0.034)
Change in racial diversity0.244***
(0.021)0.110***
(0.029)0.108***
(0.019)0.022
(0.028)
Hate crimes–102.443***
(25.389)–199.081***(46.739)
20.258(17.261)
51.859*(28.508)
Gay establishments–379.277***
(58.887)–903.023***(108.080)
.53.364(62.026)
1.339(90.957)
Relative educational attainment by gender
0.048***(0.005)
0.113***(0.011)
0.021***(0.004)
0.029***(0.008)
Constant–0.013**(0.005)
–0.043***(0.011)
–0.257***(0.007)
–0.534***(0.014)
Adjusted R2 0.12 0.10 0.52 0.61
Observations 3,107 3,105 3,107 3,105
Note: Heteroskedasticity robust standard errors in parentheses. * p<0.1; ** p<0.05; *** p<0.01.

18
Table 4Demographic, economic, and cultural variables
4.12012–2016
4.22000–2016
4.32012–2016
4.42000–2016
Variable 2SLS 2SLS
Share of population without 4-year college degrees
0.202***(0.017)
0.598***(0.038)
0.213***(0.016)
0.513***(0.028)
Share of African American or black–0.027***(0.010)
–0.115***(0.024)
–0.029***(0.010)
–0.082***(0.018)
Share of Hispanic or Latino–0.063***(0.008)
–0.212***(0.019)
–0.069***(0.007)
–0.158***(0.014)
Share of population without 4-year college degrees * Share of white
0.060***(0.013)
0.145***(0.030)
0.060***(0.012)
0.166***(0.021)
Share of Population without 4-year college degrees * Share of population from 50 years old
0.212***(0.027)
0.290***(0.041)
0.191***(0.025)
0.251***(0.034)
Share of manufacturing in employment
0.051***(0.009)
–0.002(0.013)
Share of tradable services in employment
0.009(0.019)
0.177***(0.028)
Change in Chinese import exposure per worker
0.002***(0.000)
0.002***(0.000)
Change in racial diversity0.126***
(0.020)–0.015(0.037)
0.107***(0.019)
0.020(0.028)
Hate crimes15.829
(17.100)49.630*
(27.510)16.344
(17.188)44.252
(28.083)
Gay establishments56.327(61.447)
19.700(71.363)
35.133(64.387)
–7.077(99.922)
Relative educational attainment by gender
0.026***(0.004)
0.051***(0.010)
0.023***(0.004)
0.033***(0.008)
Constant–0.257***(0.011)
–0.611***(0.021)
–0.255***(0.007)
–0.531***(0.014)
Adjusted R2 0.53 0.64 0.52 0.61
Observations 3,053 2,618 3,101 3,101
Note: Heteroskedasticity robust standard errors in parentheses. * p<0.1; ** p<0.05; *** p<0.01.

19
Table 5Interaction of economic variables with white
5.12012–2016
5.22012–2016
Variable 2SLS
Share of population without 4-year college degrees0.199***
(0.017)0.220***
(0.016)
Share of African American or black–0.018*(0.010)
–0.022**(0.010)
Share of Hispanic or Latino–0.063***(0.008)
–0.068***(0.007)
Share of population without 4-year college degrees * Share of white
0.058***(0.014)
0.048***(0.013)
Share of population without 4-year college degrees * Share of population from 50 years old
0.225***(0.027)
0.195***(0.025)
Share of manufacturing in employment–0.193***(0.033)
Share of tradable services in employment0.222***
(0.050)
Change in Chinese import exposure per worker–0.002(0.001)
Share of manufacturing in employment * Share of white0.292***
(0.041)
Share of tradable services in employment * Share of white–0.271***(0.060)
Change in Chinese import exposure per worker * Share of white
0.004***(0.001)
Change in racial diversity0.122***
(0.020)0.107***
(0.019)
Hate crimes20.744(17.238)
15.562(17.294)
Gay establishments–6.632
(58.295)27.491
(64.056)
Relative educational attainment by gender0.026***
(0.004)0.023***
(0.004)
Constant–0.257***(0.010)
–0.254***(0.007)
Adjusted R2 0.54 0.52
Observations 3,053 3,101
Marginal effect at sample means
Share of manufacturing in employment 0.050***
Share of tradable services in employment –0.003
0.001***
Note: Heteroskedasticity robust standard errors in parentheses. * p<0.1; ** p<0.05; *** p<0.01.
20
Table 6Interaction of economic variables with white and education
6.12012–2016
6.22012–2016
Variable 2SLS
Share of population without 4-year college degrees0.206***
(0.017)0.209***
(0.016)
Share of African American or black–0.015(0.010)
–0.023**(0.010)
Share of Hispanic or Latino–0.062***(0.008)
–0.067***(0.007)
Share of population without 4-year college degrees * Share of white
0.047***(0.015)
0.048***(0.013)
Share of population without 4-year college degrees * Share of population from 50 years old
0.219***(0.027)
0.195***(0.025)
Share of manufacturing in employment–0.198***(0.033)
Share of tradable services in employment0.101**
(0.044)
Change in Chinese import exposure per worker–0.002(0.001)
Share of manufacturing in employment * Share of population without 4-year college degrees * Share of white
0.352***(0.049)
Share of tradable services in employment * Share of population without 4-year college degrees * Share of white
–0.162**(0.070)
Change in Chinese import exposure per worker * Share of population without 4-year college degrees * Share of white
0.004***(0.001)
Change in racial diversity0.123***
(0.020)0.107***
(0.019)
Hate crimes19.643
(17.017)16.140
(17.222)
Gay establishments7.900
(58.166)25.802
(63.571)
Relative educational attainment by gender0.024***
(0.004)0.023***
(0.004)
Constant–0.251***(0.013)
–0.245***(0.008)
Adjusted R2 0.54 0.52
Observations 3,053 3,101
Marginal effect at sample means
Share of manufacturing in employment 0.038***
Share of tradable services in employment –0.008
Change in Chinese import exposure per worker 0.001***
Note: Heteroskedasticity robust standard errors in parentheses. * p<0.1; ** p<0.05; *** p<0.01.

21
Table 7Interaction of economic variables with education and age
7.12012–2016
7.22012–2016
Variable 2SLS
Share of population without 4-year college degrees0.201***
(0.019)0.212***
(0.016)
Share of African American or black–0.026***(0.010)
–0.029***(0.010)
Share of Hispanic or Latino–0.064***(0.008)
–0.069***(0.007)
Share of population without 4-year college degrees * Share of white
0.062***(0.012)
0.060***(0.012)
Share of population without 4-year college degrees * Share of population from 50 years old
0.139***(0.033)
0.179***(0.028)
Share of manufacturing in employment–0.197***(0.068)
Share of tradable services in employment–0.002(0.056)
Change in Chinese import exposure per worker0.000
(0.001)
Share of manufacturing in employment * Share of population without 4-year college degrees * Share of population from 50 years old
0.806***(0.219)
Share of tradable services in employment * Share of population without 4-year college degrees * Share of population from 50 years old
0.033(0.204)
Change in Chinese import exposure per worker * Share of population without 4-year college degrees * Share of population from 50 years old
0.004(0.004)
Change in racial diversity0.122***
(0.020)0.107***
(0.019)
Hate crimes12.946
(16.873)16.624
(17.166)
Gay establishments43.678
(60.172)34.328
(64.139)
Relative educational attainment by gender0.025***
(0.004)0.023***
(0.004)
Constant–0.234***(0.015)
–0.251***(0.008)
Adjusted R2 0.53 0.52
Observations 3,053 3,101
Marginal effect at sample means
Share of manufacturing in employment 0.041***
Share of tradable services in employment 0.007
Change in Chinese import exposure per worker 0.002***
Note: Heteroskedasticity robust standard errors in parentheses. * p<0.1; ** p<0.05; *** p<0.01.

22
Table 8Interaction of economic variables with change in racial diversity
8.12012–2016
8.22012–2016
Variable 2SLS
Share of population without 4-year college degrees0.211***
(0.017)0.215***
(0.016)
Share of African American or black–0.031***(0.010)
–0.031***(0.010)
Share of Hispanic or Latino–0.062***(0.008)
–0.069***(0.007)
Share of population without 4-year college degrees * Share of white
0.056***(0.013)
0.057***(0.012)
Share of population without 4-year college degrees * Share of population from 50 years old
0.209***(0.027)
0.190***(0.025)
Share of manufacturing in employment0.055***
(0.009)
Share of tradable services in employment0.019
(0.017)
Change in Chinese import exposure per worker0.002***
(0.000)
Share of manufacturing in employment * Change in racial diversity
0.463**(0.182)
Share of tradable services in employment * Change in racial diversity
1.229***(0.346)
Change in Chinese import exposure per worker * Change in racial diversity
0.027***(0.009)
Change in racial diversity–0.011(0.034)
0.050**(0.025)
Hate crimes14.739
(16.913)15.948
(17.196)
Gay establishments59.871(61.568)
34.716(64.352)
Relative educational attainment by gender0.026***
(0.004)0.023***
(0.004)
Constant–0.262***(0.011)
–0.255***(0.007)
Adjusted R2 0.53 0.52
Observations 3,053 3,101
Marginal effect at sample means
Share of manufacturing in employment 0.052***
Share of tradable services in employment 0.010
Change in Chinese import exposure per worker 0.001***
Note: Heteroskedasticity robust standard errors in parentheses. * p<0.1; ** p<0.05; *** p<0.01.
23
Table A1Demographic and economic variables
1.12012–2016
1.22000–2016
1.32012–2016
1.42000–2016Variable
Share of population without 4-year college degrees
0.227***(0.017)
0.656***(0.039)
Share of African American or black–0.023**(0.011)
–0.121***(0.025)
Share of Hispanic or Latino–0.092***(0.007)
–0.223***(0.016)
Share of population without 4-year college degrees * Share of white
0.057***(0.014)
0.122***(0.031)
Share of Population without 4-year college degrees * Share of population from 50 years old
0.191***(0.027)
0.265***(0.041)
Share of high-skill manufacturing in employment
0.097***(0.012)
0.132***(0.026)
0.042***(0.010)
0.017(0.019)
Share of low-skill manufacturing in employment
0.111***(0.012)
0.123***(0.018)
0.035***(0.010)
–0.020(0.014)
Share of tradable services in employment
–0.352***(0.022)
–0.639***(0.037)
–0.009(0.018)
0.145***(0.027)
Constant0.062***
(0.003)0.105***
(0.006)–0.235***(0.011)
–0.579*** (0.019)
Adjusted R2 0.20 0.20 0.51 0.63
Observations 3,055 2,608 3,055 2,608
Note: Heteroskedasticity robust standard errors in parentheses. * p<0.1; ** p<0.05; *** p<0.01.
APPENDIX AALTERNATIVE SPECIFICATIONS USING DISAGGREGATED DATA ON MANUFACTURING EMPLOYMENT

24
Table A2Demographic, economic, and cultural variables
2.12012–2016
2.22000–2016Variable
Share of population without 4-year college degrees0.204***
(0.017)0.613***
(0.040)
Share of African American or black–0.029***(0.010)
–0.127***(0.026)
Share of Hispanic or Latino–0.064***(0.008)
–0.219***(0.020)
Share of population without 4-year college degrees * Share of white
0.058***(0.012)
0.128***(0.032)
Share of population without 4-year college degrees * Share of population from 50 years old
0.213***(0.027)
0.296***(0.041)
Share of high-skill manufacturing in employment0.054***
(0.011)0.031
(0.019)
Share of low-skill manufacturing in employment0.047***
(0.010)–0.013(0.014)
Share of tradable services in employment0.008
(0.019)0.173***
(0.028)
Change in racial diversity0.127***
(0.020)–0.017(0.037)
Hate crimes15.222
(17.112)45.963*
(27.492)
Gay establishments55.405(61.495)
17.196 (72.365)
Relative educational attainment by gender0.026***
(0.004)0.052***
(0.010)
Constant–0.256***(0.011)
–0.613***(0.021)
Adjusted R2 0.53 0.64
Observations 3,050 2,605
Note: Heteroskedasticity robust standard errors in parentheses. * p<0.1; ** p<0.05; *** p<0.01.

25
Table A2Demographic, economic, and cultural variables
2.12012–2016
2.22000–2016Variable
Share of population without 4-year college degrees0.204***
(0.017)0.613***
(0.040)
Share of African American or black–0.029***(0.010)
–0.127***(0.026)
Share of Hispanic or Latino–0.064***(0.008)
–0.219***(0.020)
Share of population without 4-year college degrees * Share of white
0.058***(0.012)
0.128***(0.032)
Share of population without 4-year college degrees * Share of population from 50 years old
0.213***(0.027)
0.296***(0.041)
Share of high-skill manufacturing in employment0.054***
(0.011)0.031
(0.019)
Share of low-skill manufacturing in employment0.047***
(0.010)–0.013(0.014)
Share of tradable services in employment0.008
(0.019)0.173***
(0.028)
Change in racial diversity0.127***
(0.020)–0.017(0.037)
Hate crimes15.222
(17.112)45.963*
(27.492)
Gay establishments55.405(61.495)
17.196 (72.365)
Relative educational attainment by gender0.026***
(0.004)0.052***
(0.010)
Constant–0.256***(0.011)
–0.613***(0.021)
Adjusted R2 0.53 0.64
Observations 3,050 2,605
Note: Heteroskedasticity robust standard errors in parentheses. * p<0.1; ** p<0.05; *** p<0.01.
Table A3Interaction of economic variables with white
3.12012–2016Variable
Share of population without 4-year college degrees0.201***
(0.017)
Share of African American or black–0.021** (0.010)
Share of Hispanic or Latino–0.063***(0.008)
Share of population without 4-year college degrees * Share of white0.055***
(0.014)
Share of population without 4-year college degrees * Share of population from 50 years old
0.226***(0.027)
Share of high-skill manufacturing in employment–0.206***(0.041)
Share of low-skill manufacturing in employment–0.182***(0.039)
Share of tradable services in employment0.222***
(0.050)
Share of high-skill manufacturing in employment * Share of white0.307***
(0.049)
Share of low-skill manufacturing in employment * Share of white0.276***
(0.051)
Share of tradable services in employment * Share of white–0.272***(0.060)
Change in racial diversity0.123***
(0.020)
Hate crimes20.026(17.275)
Gay establishments–7.724
(58.340)
Relative educational attainment by gender0.026***
(0.004)
Constant–0.256***(0.010)
Adjusted R2 0.54
Observations 3,050
Note: Heteroskedasticity robust standard errors in parentheses. * p<0.1; ** p<0.05; *** p<0.01.
26
Table A4Interaction of economic variables with white and education
4.12012–2016Variable
Share of population without 4-year college degrees0.208***
(0.017)
Share of African American or black–0.017*(0.010)
Share of Hispanic or Latino–0.062***(0.008)
Share of population without 4-year college degrees * Share of white0.044***
(0.014)
Share of population without 4-year college degrees * Share of population from 50 years old
0.220***(0.027)
Share of high-skill manufacturing in employment–0.216***(0.039)
Share of low-skill manufacturing in employment–0.183***(0.042)
Share of tradable services in employment0.101**
(0.044)
Share of high-skill manufacturing in employment * Share of population without 4-year college degrees * Share of white
0.381***(0.056)
Share of low-skill manufacturing in employment * Share of population without 4-year college degrees * Share of white
0.324***(0.063)
Share of tradable services in employment * Share of population without 4-year college degrees * Share of white
–0.165**(0.070)
Change in racial diversity0.124***
(0.020)
Hate crimes18.727
(17.042)
Gay establishments6.640
(58.205)
Relative educational attainment by gender0.024***
(0.004)
Constant–0.250***(0.013)
Adjusted R2 0.54
Observations 3,050
Note: Heteroskedasticity robust standard errors in parentheses. * p<0.1; ** p<0.05; *** p<0.01.

27
Table A5Interaction of economic variables with education and age
Variable5.1
2012–2016
Share of population without 4-year college degrees0.204***
(0.018)
Share of African American or black–0.029***(0.010)
Share of Hispanic or Latino–0.065***(0.008)
Share of population without 4-year college degrees * Share of white0.059***
(0.012)
Share of population without 4-year college degrees * Share of population from 50 years old
0.137***(0.033)
Share of high-skill manufacturing in employment–0.161**(0.080)
Share of low-skill manufacturing in employment–0.258**(0.110)
Share of tradable services in employment–0.006(0.056)
Share of high-skill manufacturing in employment * Share of population without 4-year college degrees * Share of population from 50 years old
0.708***(0.265)
Share of low-skill manufacturing in employment * Share of population without 4-year college degrees * Share of population from 50 years old
0.977***(0.346)
Share of tradable services in employment * Share of population without 4-year college degrees * Share of population from 50 years old
0.037(0.204)
Change in racial diversity0.122***
(0.020)
Hate crimes12.287
(16.859)
Gay establishments42.730
(60.261)
Relative educational attainment by gender0.025***
(0.004)
Constant–0.233***(0.015)
Adjusted R2 0.54
Observations 3,050
Note: Heteroskedasticity robust standard errors in parentheses. * p<0.1; ** p<0.05; *** p<0.01.

28
Table A6Interaction of economic variables with change in racial diversity
Variable6.1
2012–2016
Share of population without 4-year college degrees 0.212***(0.017)
Share of African American or black–0.033***
(0.010)
Share of Hispanic or Latino–0.062*** (0.008)
Share of population without 4-year college degrees * Share of white0.053***
(0.013)
Share of population without 4-year college degrees * Share of population from 50 years old
0.210*** (0.027)
Share of high-skill manufacturing in employment0.057***
(0.011)
Share of low-skill manufacturing in employment0.052***
(0.011)
Share of tradable services in employment0.018
(0.017)
Share of high-skill manufacturing in employment * Change in racial diversity
0.522** (0.246)
Share of low-skill manufacturing in employment * Change in racial diversity
0.388(0.273)
Share of tradable services in employment * Change in racial diversity1.216***
(0.346)
Change in racial diversity–0.008 (0.035)
Hate crimes14.244
(16.935)
Gay establishments59.018
(61.600)
Relative educational attainment by gender0.026***
(0.004)
Constant–0.261*** (0.011)
Adjusted R2 0.53
Observations 3,050
Note: Heteroskedasticity robust standard errors in parentheses. * p<0.1; ** p<0.05; *** p<0.01.