working hard or hardly working: recent mlis grads finding work and making it pay in a harsh economy...
TRANSCRIPT

Working Hard or Hardly Working:
Recent MLIS grads finding work and making it pay in a harsh economy
By: Andrea Hathaway, Liz Woolcott,
Becky Skeen, and Katie Wesolek
Utah State University
Utah Library Association Conference
April 26, 2012

Historical Context
Andrea Hathaway
Library Assistant, Acquisitions
Utah State University
2010 Graduate – University of Wisconsin-Milwaukee

Graduate Employment (with vs without)
Library Journal Placement and Salaries Surveys (1990-2011)

Employed Graduates
Library Journal Placement and Salaries Surveys (1990-2011)

References Babyboomers.com." BabyBoomers.com. Web. 24 Apr. 2012.
http://www.babyboomers.com/
Dohm, A. "Gauging the Labor Force Effects of Retiring Baby-Boomers." Monthly Labor Review 123.7 (2000): 17-25.
Edge, J. and Green, R. “The Graying of the Academic Librarians: Crisis or Revolution?” Journal of Access Services 8 (2011): 97-106.
Holt, R. and Strock, A. L. "The Entry-Level Gap." Library Journal 130.8 (2005): 36-38.
Generation WE: A Generation 95 Million People Strong." Generation WE: A Generation 95 Million People Strong. Web. 24 Apr. 2012. http://www.gen-we.com/
Joeckel, C. B. “Supply and Demand in the Library Profession.” The Library Journal 57.3 (1932): 103-110.
Marshall, J. G., et al. "Where Will They Be In The Future? Implementing A Model For Ongoing Career Tracking Of Library And Information Science Graduates." Library Trends 58.2 2009): 301-315.
Marshall, J. G., Solomon, P., and Rathburn-Grubb, S. eds. “Workforce Issues in LIS” Library Trends, 58.2 (2009): whole issue.
Workforce Issues in Library and Information Science Surveys: http://wilis.unc.edu/

Getting Acquainted
Liz Woolcott
Metadata Coordinator
Utah State University
2009 Graduate – University of North Texas

Graduates – Meet your new field
Let’s look at:
Historical ups & downs of the field
Historical salaries
What does a library budget look like?
How do libraries deal with recessions?

Historical Look at Librarians
Graph created by Sydney Beveridge, Susan Weber and Andrew A. Beveridge and included in Librarians in the U.S. from 1880-2009: An analysis using 120 years of census data. Available from : http://blog.oup.com/2011/06/librarian-census/

Under/Un-employment of Library Graduates
Graph based on trends reported by Library Journal’s Placements and Salaries report 1975-2010
1975
1977
1979
1981
1983
1985
1987
1989
1991
1993
1995
1997
1999
2001
2003
2005
2007
2009
0
1000
2000
3000
4000
5000
6000
7000
Un- and Under- Employment of Library Grad-uates
Number of GraduatesUnderEmployed/UnemployedUnderemployed
Num
ber
of
Gra
duate
s

Comparing It Nationally Before you panic…
Please note: the green line is an unemployment TREND for librarians – not the actual rate Library Journal combines
numbers reporting “Unemployed” and “Unknown employment”
While the percentage is inflated, the trend seems to follow the national unemployment rates
1960
1963
1966
1969
1972
1975
1978
1981
1984
1987
1990
1993
1996
1999
2002
2005
2008
2011
0.0%
5.0%
10.0%
15.0%
20.0%
25.0%
30.0%
35.0%
Unemployment Trends
National Unemployment rate Librarian Unemployment Trends
Graph based on trends reported by Library Journal’s Placements and Salaries report 1975-2010 and David B. Scilia’s data in “A Brief History of U.S. Unemployment” available at: http://www.washingtonpost.com/wp-srv/special/business/us-unemployment-rate-history/

The TrendsPeriods of growth in
librarians:
1900-1920’s
1940-1950’s
Mid 1990’s-early 2000’s (predicted major
shortage by 2010)
Periods of surplus librarians:
1930’s
1970’s
Current
Major Economic Recessions/Depressions of the U.S.:
• 1930’s• 1970’s
• 2007-current
• 1920’s• 1960’s
• 2002-2010
Periods of shortage in librarians:

No Big Surprise
Traditional Library funding comes from government entities
Primary Library Funding Sources - by Library Segment
Public Academic Gov't Special Average
Public funding–local 92% 8% 6% 12% 43%
Public funding–state 46% 33% 19% 21% 35%
University/school funding 1% 78% 0% 6% 30%
Gifts and donations 44% 19% 0% 28% 30%
Grants 41% 8% 0% 17% 23%
Endowments 10% 17% 0% 11% 12%
Corporate funding 1% 1% 0% 44% 10%
Public funding–federal 10% 5% 87% 8% 10%
Special fundraising events 16% 2% 0% 11% 9%
Fee-based services 9% 2% 0% 6% 6%
Don't know/unsure 1% 3% 0% 2% 2%
Other 8% 2% 0% 16% 6%
Data obtain from Sydney Beveridge, Susan Weber and Andrew A. Beveridge and included in Librarians in the U.S. from 1880-2009: An analysis using 120 years of census data. Available from : http://blog.oup.com/2011/06/librarian-census/

Possible Causes of Librarian Over-supplies
Over-estimations of need for librarians
Increased number of Library Schools
Increased number of students graduating from library school
Unforeseen economic recessions
Decreased government spending

“These data point to the latest imbalance in supply and demand, but history's lesson is that the market is cyclical. Efforts to correct disproportions, though often necessary, have resulted in unintended consequences when changing conditions were not anticipated.”Carolyn E. Lipscomb, 2003

Historical SalariesStated Beginning Salaries for Libarians, 1967-2010
1967196919711973197519771979198119831985198719891991199319951997199920012003200520072009
$0.00 $10,000.00 $20,000.00 $30,000.00 $40,000.00 $50,000.00$7,305.00$7,650.00$8,161.00$8,611.00$8,846.00$9,248.00$9,423.00$10,000.00$10,594.00$11,149.00
$11,894.00$12,527.00$13,127.00
$14,223.00$15,633.00
$16,583.00$17,705.00
$18,791.00$19,753.00
$20,874.00$22,247.00
$23,491.00$24,581.00
$25,305.00$25,583.00
$26,666.00$27,116.00
$28,086.00$28,997.00$29,480.00
$30,270.00$31,915.00
$33,976.00$34,871.00
$36,818.00$37,456.00$37,975.00
$39,079.00$40,115.00
$41,014.00$42,361.00
$41,579.00$42,215.00$42,553.00
Stated Beginning Salaries for Librarians, 1967-2010
Stated Beginning Salary
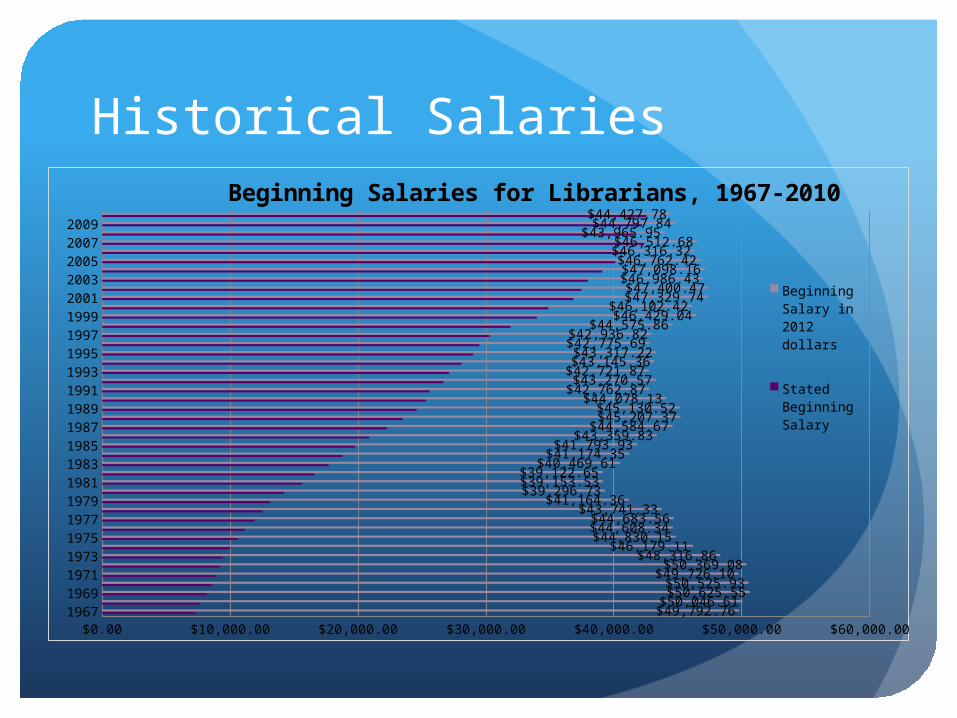
Historical Salaries
1967196919711973197519771979198119831985198719891991199319951997199920012003200520072009
$0.00 $10,000.00 $20,000.00 $30,000.00 $40,000.00 $50,000.00 $60,000.00$49,792.76$50,046.61$50,625.55$50,525.93
$49,726.10$50,369.08
$48,316.86$46,179.11
$44,830.15$44,608.34$44,683.56
$43,741.33$41,164.36
$39,296.73$39,153.53$39,122.65
$40,469.61$41,174.35$41,793.93
$43,359.83$44,584.67$45,207.37$45,130.52
$44,078.13$42,762.87$43,270.57
$42,721.87$43,145.36$43,317.22
$42,775.69$42,936.82
$44,575.86$46,429.04$46,102.42
$47,329.74$47,400.47
$46,986.43$47,098.16
$46,762.42$46,316.32$46,512.68
$43,965.95$44,797.84
$44,427.78
Beginning Salaries for Librarians, 1967-2010
Beginning Salary in 2012 dollars
Stated Beginning Salary

Historical Salaries
Historically above-average wage, comparative to average wage of all workers
Doesn’t take into account education levels or debt to obtain education.
Data obtained from Sydney Beveridge, Susan Weber and Andrew A. Beveridge and included in Librarians in the U.S. from 1880-2009: An analysis using 120 years of census data. Available from : http://blog.oup.com/2011/06/librarian-census/

Historical SalariesWhen taking education
into account, librarians tend to make less than their college degreed counterparts in the workforce
(With the exception of women in libraries in the 1950s)
Data obtain from Sydney Beveridge, Susan Weber and Andrew A. Beveridge and included in Librarians in the U.S. from 1880-2009: An analysis using 120 years of census data. Available from : http://blog.oup.com/2011/06/librarian-census/
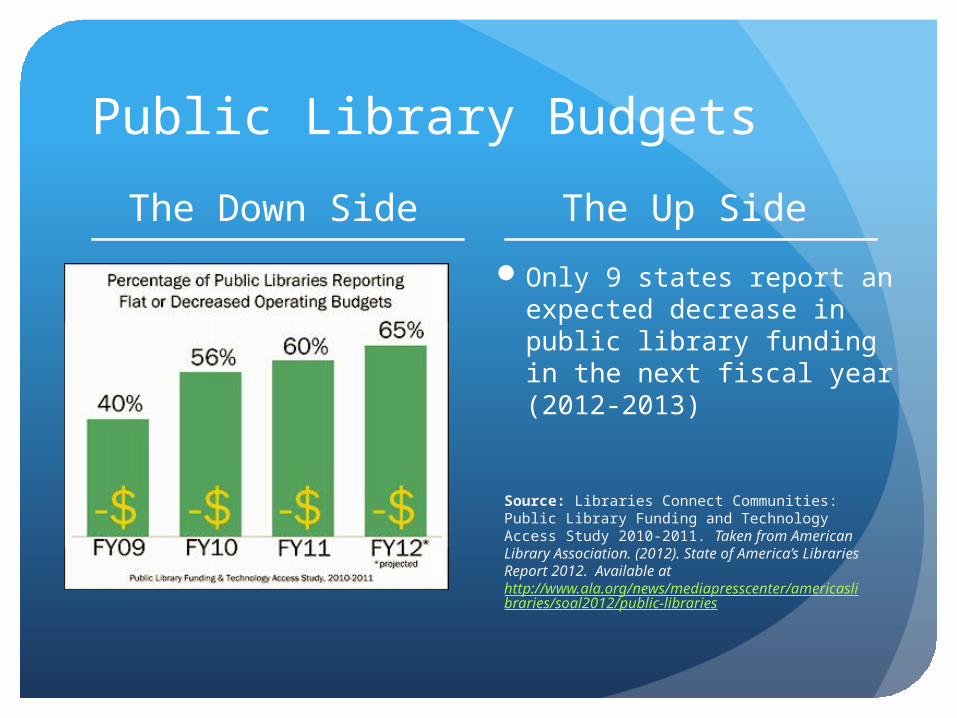
Public Library Budgets
The Down Side The Up Side
Only 9 states report an expected decrease in public library funding in the next fiscal year (2012-2013)
Source: Libraries Connect Communities: Public Library Funding and Technology Access Study 2010-2011. Taken from American Library Association. (2012). State of America’s Libraries Report 2012. Available at http://www.ala.org/news/mediapresscenter/americaslibraries/soal2012/public-libraries

Library BudgetsHow Budgets Changed in 2009-2010 and projected for 2011-
By Library Segment
Public Academic Gov't Special Average
2009-10 2011- 2009-10 2011- 2009-10 2011- 2009-10 2011- 2009-10 2011-
Increase 37% 30% 24% 27% 31% 18% 27% 21% 31% 28%
No Change 18% 28% 31% 38% 19% 25% 31% 45% 26% 34%
Decrease 43% 32% 38% 23% 49% 37% 41% 28% 29% 26%
Don't know/unsure 2% 11% 6% 13% 0% 19% 2% 6% 3% 11%
Data taken from McKendrick, J. (2011) Funding and Priorities: The Library Resource Guide Benchmark Study on 2011 Library Spending Plans. Unisphere Research: Chatham, NJ

Library Budgets
Average Annual Budgets-- By Library Structures and Segments
Average Annual Budgets for: Public Academic Government Special/Corp/Other
Single, independent libraries $744,974 $1,252,232 $3,558,357 $315,162
Single within multibranch system $1,246,320 $1,708,413 ** $859,166
Main library for multibranch systems $2,675,108 $3,151,868 ** $863,984
Library system $2,893,978 $2,717,784 ** $2,065,686
Data taken from McKendrick, J. (2011) Funding and Priorities: The Library Resource Guide Benchmark Study on 2011 Library Spending Plans. Unisphere Research: Chatham, NJ

Library Budgets
Percentage of Current Annual Budget Dedicated to Key AreasPublic Academic Gov't Special Average
Personnel/Staffing 55% 43% 26% 39% 46%
Content acquisitions/collection development
16% 34% 55% 38% 28%
Operations/facilities 17% 6% 11% 8% 11%
Library systems, computers, A/V, media equipment, software/svcs
7% 11% 12% 11% 9%
Other 4% 6% 4% 5% 5%
Data taken from McKendrick, J. (2011) Funding and Priorities: The Library Resource Guide Benchmark Study on 2011 Library Spending Plans. Unisphere Research: Chatham, NJ

Current Salary FiguresAcademic salary data, 2009-2010
Source: ALA-APA Salary Survey: Librarian—Public and Academic: A Survey of Positions with an ALA- Accredited Master’s Degree, 2009 and 2010. Taken from American Library Association. (2012). State of America’s Libraries Report 2012. Available at http://www.ala.org/news/mediapresscenter/americaslibraries/soal2012/academic-libraries
Position 2009 mean 2010 mean Percentage increase Number reporting
(2009) Number reporting
(2010)Director/dean/chief officer $92,996 $97,767 5.13% 459 217
Deputy/associate/assistant director $80,895 $81,897 1.23% 573 282Department head/branch manager/coordinator/senior manager $62,007 $65,320 5.34% 505 261
Manager/supervisor of support staff $55,704 $55,732 0.05% 680 347
Librarian who does not supervise $55,073 $57,079 3.64% 2458 1260
Beginning librarian $46,459 $47,000 1.165 441 153Total (number reporting) 5116 2520

Academic Library Staffing
Salaries and wages made up 49.8 % of total academic/research library expenditures in 2010, up from 49.3 % in 2008.
Decrease of 4.8 % (4,495 positions) since 2008
Number of academic librarians has decreased 1.2 % since 2008 to a total of 26,706 FTE positions
American Library Association. (2012). State of America’s Libraries Report 2012. Available at http://www.ala.org/news/mediapresscenter/americaslibraries/soal2012/academic-libraries

How do libraries respond to budget cuts?
Actions to Manage or Respond to Budget Cuts/Freezes - By Library Segment
Public Academic Gov't Special Average
Cut spending on subscriptions 39% 55% 75% 49% 48%
Cut or eliminated conference/travel/ education budget 40% 48% 56% 42% 44%
Salary freezes 43% 41% 6% 31% 39%
Moved more services/materials online 14% 33% 25% 26% 24%
Renegotiated contracts with vendors 18% 23% 44% 28% 23%
Applied for more grants 38% 14% 0% 13% 23%
Staff layoffs/staff hours cut 25% 22% 0% 18% 22%
Reduced library hours 23% 18% 0% 9% 18%
Added volunteers 28% 8% 12% 22% 18%
Collaborated/shared with other libraries/ joined consortia 12% 18% 12% 17% 15%
Reduced programming 29% 6% 0% 15% 15%
Lobbied for more funding from institutions 17% 17% 19% 8% 15%
Reduced IT expenditures 18% 9% 12% 13% 13%
Consolidated departments 11% 13% 6% 9% 11%
Closed facilities 1% 2% 0% 1% 1%
No cuts or budget freezes over the past year 23% 14% 12% 20% 19%
Don't know/unsure 2% 6% 0% 5% 4%
Other 9% 7% 19% 7% 8%
Data taken from McKendrick, J. (2011) Funding and Priorities: The Library Resource Guide Benchmark Study on 2011 Library Spending Plans. Unisphere Research: Chatham, NJ

Future ProjectionsFigure 12: Areas Seeing Increased Spending or Support Over the Past Year - By Library Segment
Public Academic Gov't Special Average
Online subscription acquisitions 10% 30% 31% 24% 21%
Ebooks 18% 23% 19% 11% 19%
Personnel 25% 12% 25% 7% 17%
Digital content collections/services 9% 16% 19% 8% 12%
Library technology equipment, software 16% 10% 12% 8% 12%
Book acquisitions 12% 6% 0% 7% 8%
Facilities upgrades/maintenance 14% 5% 0% 3% 8%
Operations 11% 3% 0% 0% 6%
Library hours/availability 8% 5% 0% 2% 6%
IT services 8% 2% 0% 5% 5%
Multimedia/streaming media 3% 11% 0% 1% 5%
Periodicals/serials acquisitions 4% 6% 6% 6% 5%
Cloud-based solutions 1% 1% 0% 1% 1%
No spending increases over past year 34% 28% 19% 47% 33%
Don't know/unsure 5% 10% 12% 9% 8%
Other 7% 2% 6% 6% 5%
Data taken from McKendrick, J. (2011) Funding and Priorities: The Library Resource Guide Benchmark Study on 2011 Library Spending Plans. Unisphere Research: Chatham, NJ

Future Projections
Education, Training, and Library Occupations
Total, All Occupations
Librarians
0% 10% 20%
Percent change in employment, pro-jected 2010-2020
Comparative percent change in employment, projected 2010-2020
Education, Training, and Library Occupations - 15%
Total, All Occupations - 14%
Librarians - 7%
Note: All Occupations includes all occupations in the U.S. Economy.Source: U.S. Bureau of Labor Statistics, Employment Projections program
Bureau of Labor Statistics. (2012). Occupational Outlook Handbook – Librarians. Available at: http://www.bls.gov/ooh/Education-Training-and-Library/Librarians.htm#tab-1

Future Projections
“Jobseekers may face strong competition for jobs, especially early in the decade, as many people with master’s degrees in library science compete for a limited number of available positions. Later in the decade, prospects should be better as older library workers retire and population growth generates openings.” – Bureau of Labor Statistics, 2012

What do the simple folk do?
How do other fields handle labor overages….
LawABA - market drives supply and demand
MedicineAMA - top-down control of supply to increase
demand

Weathering the Storm
What can individual libraries do to help underemployed graduates while budgets are strapped?Offer non-monetary compensation
Flexible hours More self-guided work Flexibility with jobs titles
Make them reflect the work of the individual, rather than the rank

Questions to consider?
Can or should we monitor the labor supply better? Change entrance requirements for library schools? Make library school curriculum more rigorous? Better long-term tracking of graduates? Should there be a cap on the number of MLS students and/or
degrees awarded?
How does automation/technological advances affect staffing? Does it always lead to staff reductions? Can it be used to free up monetary resources for staffing purposes?
What are our job descriptions based on? Are they accurate? Are they current? Are they sustainable?

References American Library Association. (2012). State of America’s Libraries Report 2012. Available at
http://www.ala.org/news/mediapresscenter/americaslibraries/soal2012/public-libraries
Association of College and Research Libraries, Ad Hoc Taskforce on Recruitment and Retention Issues (2002). Recruitment, retention, and restructuring: Human resources in academic libraries. Chicago: American Library Association, Association of College and Research Libraries
Beveridge, S., Weber, S. and Beveridge, A.A. (2011). Librarians in the U.S. from 1880-2009: An analysis using 120 years of census data. Available from : http://blog.oup.com/2011/06/librarian-census/
Foster, S.P. (1993, April). Victimization in library school closing rhetoric: A response to a “Library Quarterly” symposium. The Library Quarterly, 63 (2), 199-205.
Library Journal. Placements and Salaries Report. 1975-2010.
Lipscomb, C.E. (2003). Librarian supply and demand. Journal of the Medical Library Association 91 (1): 7-10. Available at : http://www.ncbi.nlm.nih.gov/pmc/articles/PMC141181/
McKendrick, J. (2011) Funding and Priorities: The Library Resource Guide Benchmark Study on 2011 Library Spending Plans. Unisphere Research: Chatham, NJ
Myers, M. (1986, Spring). The job market for librarians. Library Trends, 34 (4), 645-66.
Sicilia, D.B. (2011). “A Brief History of U.S. Unemployment” Washington Post. Available at: http://www.washingtonpost.com/wp-srv/special/business/us-unemployment-rate-history/

Job Search Considerations
Becky Skeen
Special Collections & Archives Cataloging Assistant
Utah State University
2009 Graduate – University of North Texas

Length of Job Search for new MLS Grads
2002 2007 20110
1
2
3
4
5
6
Avg. # of months
(Conners & McCarthy, 2007; Maatta, 2011a)

Why such a lengthy job search?
Fewer entry level jobs (Orbanus, 2007)
Increased job competition (Maatta, 2011a; Holt & Strock, 2005)
- large number of new graduates - other applicants with more professional experience.
Less turnover as older librarians choose to wait to retire until the economy gets better (Kruse, 2009)
Personal reasons (e.g. can’t move elsewhere, etc.) (Kruse, 2009)

What options are available to new MLS graduates?
Full-time Permanent professional position Full-time Nonprofessional or Paraprofessional position Temporary library position Part-time library position(Maatta, 2011a)

Non-professional positions - advantages
More libraries hiring for paraprofessional positions (Fialkoff, 2010; Rogers, 2002)
Opportunity to gain practical library experience (Lange, 2008)
Provides new grads with opportunity to stay engaged in their chosen profession and more easily keep up-to-date with new trends and discussions in the library field (Lange, 2008)
Possible stepping stone to a professional position (Pittman-Hassett, 2004)

Non-professional positions – advantages, (cont’d)
Gain a wider range of skills through working on a variety of projects (Lange, 2008)
Hone specific skills in area of interest through practical application and on-the-job training (Skaggs, 2006)
Greater possibility of networking and observing and interacting with other professional librarians (Lange, 2008)
Gives some new grads more job flexibility (Lange, 2008; Stevens, 2011)

Non-professional positions - concerns
o Job responsibilities outside of grads area of interest
o Can be among the first eliminated in hard economic times. (Maatta, 2011a)
o Current management will see them as a paraprofessional and not look at them for open professional positions (Newlen & Switzer, 2004)

Non-professional positions – concerns (cont’d)
o Possibility that search committees and administrators may not give the same weight to time spent in a paraprofessional position (Newlen & Switzer, 2004)
o Incongruency between work being performed at a professional level and pay/benefits received at a paraprofessional level (MacCampell, 1977; Pittman-Hassett, 2004)
-Fewer benefits (e.g. health care, paid sick/vacation leave, etc.)
-Lower pay scale

How can new MLS grads in paraprofessional positions market themselves for new jobs or promotions?
Volunteer for library committees or special projects (Newlen & Switzer, 2004)
Ask your supervisor about the possibility of increasing your job responsibilities and duties in your assigned area (Newlen & Switzer, 2004)
Ask about opportunities to cross-train or shadow other library staff members.
Participate in available in-house professional development opportunities

How can new MLS grads in paraprofessional positions market themselves for new jobs or promotions? (cont’d)
Participate in local, state, and/or national library organizations (ULA, ALA, etc.) and attend their conferences or volunteer to be on a task force or committee (Newlen & Switzer, 2004)
Continue library research and other scholarly activities (Newlen & Switzer, 2004)
Join email lists in your area of interest (Gordon, 2009)
Online networking (Easton, 2012)
Advice to new grads
“Are you doing all you can to move your job search forward? Are you networking effectively, preparing for interviews thoroughly, doggedly pursuing every lead, and does your attitude project a positive, inviting image?” (Urschel, 2012)
“Don’t be discouraged by daunting job descriptions. Keep in mind that the posting is for the ideal candidate, not the one the library actually expects to fill its applicant pool. Don’t be too proud to work your way up.” (Skaggs, 2006)

More advice
New grads advise: “‘Keep a positive and professional attitude; something will come along eventually.’ Many also suggested that new graduates will need to be even more willing than before to accept part-time, support staff positions in order to get in the door and prove one’s worth.” (Maatta, 2011b)
“Be yourself” (Stevens, 2011)

References
Bureau of Labor Statistics, U.S. Department of Labor. (2011). Librarians. In Occupational outlook handbook, 2010/2011 ed. Retrieved from http://www.bls.gov/oco/ocos068.htm
Conners, D., & McCarthy, L. (2007). The jobs can be found. Library Journal, 132(14), 44-45.
Easton, B. (2012). Career Reality Check: Life Skills for New Grads – Collection Development. Library Journal [online]. Retrieved March 19, 2012 from http://reviews.libraryjournal.com/2012/01/collection-development/career-reality-check/
Fialkoff, F. (2010). Not yet equal: Giving lip service to paraprofessionals work isn’t enough [Editorial]. Library Journal. Retrieved April 2, 2012 from http://www.libraryjournal.com/lj/community/libraryculture/853694-271/editorial_not_yet_equal.html.csp
Gordon, R.S. (2009). Finding a Library Job-Updated. Library Journal [online], 9/15/2009. Retrieved March 19, 2012 from http://www.libraryjournal.com/article/CA6250888.html
Holt, R., & Strock, A. L. (2005). THE ENTRY-LEVEL GAP. (Cover story). Library Journal, 130(8), 36-38.
Kruse, T. (2009). Employment of librarians—What can librarians do? Library Worklife, September 2009 issue. Retrieved April 10, 2012 from http://ala-pa.org/newsletter/2009/09/13/employment-of-librarians-what-can-librarians-do/
Lange, S. (2008). Why I Went Parapro. Library Journal, 133(7), 60.
Maatta, S.L. (2011a). Tight competition. Library Journal [online]. Retrieved March 19, 2012 from http://features.libraryjournal.com/placements-and-salaries/2011-survey/tight-competition/
Maatta, S.L. (2011b). The Grads’ Perspective. Library Journal [online]. Retrieved March 19, 2012 from http://features.libraryjournal.com/placements-and-salaries/2011-survey/the-grads-perspective/
MacCampbell, J. C. (1977). Better Utilization of Personnel. Library Journal, 102(15), 1718.
Newlen, R., & Switzer, T. (2004). Taking a paraprofessional position with and MLS: savvy career move or career kiss of death? LIScareer.com newsletter. Retrieved March 19, 2012 from http://www.liscareer.com/newlenswitzer_mls.htm
Orbanus, C. (2007). Where Are All the Jobs?. Library Journal, 132(11), 46.

References (cont’d) Pittman-Hassett, S. T. (2004). Is the Degree Worth It? A Librarian's Perspective. Library Mosaics, 15(2), 16.
Rogers, M. (2002). Librarians Carping Over Poor Salaries. Library Journal, 127(16), 16.
Skaggs, B. (2006). Happily (Mostly) Ever After. Library Journal, 131(1), 66.
Stevens, C.K. (2011, October 30). Career Coach: Keys to networking success. Washington Post [online]. Retrieved Nov. 11, 2011 from http://www.washingtonpost.com/business/capitalbusiness/career-coach-keys-to-networking-success/2011/10/26/gIQAvHS7WM_print.html
Urschel, H. (2012). Why is my job search taking so long? [Web log comment] Retrieved from http://www.careerrocketeer.com/2012/02/why-is-my-job-search-taking-so-long.html

Shameless Self-Promotion
Katie Wesolek
Electronic Resources Management Assistant
Utah State University
2010 Graduate – Rutgers University

No
Office Space. Dir. Mike Judge. Perf. Ron Livingston, Jennifer Aniston, David Herman. Twentieth Century Fox Film Corporation, 1999. DVD.

Yes
Say YES to everything
Be proactive – seek out opportunities to contribute, invent new projects or responsibilities for yourself
Stay visible
Get your foot in the door any way you can – volunteer, apply for a paraprofessional job, apply for a student-level job if they will let you!
References
•Maatta, Stephanie. “Stagnant Salaries, Rising Unemployment: The recession takes its toll on new graduates.” Library Journal 135.17 (2010): 22-29.
•Office Space. Dir. Mike Judge. Perf. Ron Livingston, Jennifer Aniston, David Herman. Twentieth Century Fox Film Corporation, 1999. DVD.
•Weinstein, Tatiana. “Why Your MLS and LTA Matter.” American Libraries 36.9 (2005): 57-58.