working for the council - equality employment statistics ... · working for the council - equality...
TRANSCRIPT
Working for the Council -
equality employment statistics
for 2015/2016
2
Contents Page
1 Introduction 3
2 Recruitment 4
3 Workforce profile 10 4 Training and development 24 5 Disciplinary investigations and
grievances 30 6 Monitoring and moving forward 34
3
Working for the Council – employment statistics
1 Introduction
Welcome to our employment statistics for April 2015 to March 2016. The statistics include recruitment, workforce profile, training and development, disciplinary and grievances and work experience placements. They form part of our Public Sector Equality Duty requirements where we have to provide equality information about our employees and job applicants.
The Council is still going through major changes with an even more challenging budget savings programme. We’ve reviewed our services and structures to identify savings and offered voluntary redundancy options to mitigate the number of possible compulsory redundancies. So, we’ve seen yet a further reduction in our overall workforce. We’ve tried to keep our existing workforce by reducing vacancies being advertised externally and advertising any vacancies to internal staff first. We’ve also introduced schemes such as offering learning packages to help employees with any training or development required. We have been transferred to the Jobcentre Plus Disability Confident Scheme. Due to us having succeeded in the ‘two ticks’ award for many years now, we have been automatically assessed as a Disability Confident Employer and the new logo is on the front of this booklet.
We will publish this booklet on our internal website iDerby and also on our external website at www.derby.gov.uk/equality. We’ll also present it to Derby Diversity Forum and employee networks.
Please contact us if you have any queries about the figures or have any suggestions for improving the layout for future reports. Contact us on 01332 643722, Minicom 01332 640666 or mobile 07812301144 [email protected]
4
2 Recruitment
2.1 The Council operates an on-line only application strategy, with reasonable adjustments made for disabled applicants. This section gives information about recruitment to the Council’s vacancies that were advertised between April 2015 and March 2016. The numbers exclude school vacancies. It explores the stages of the process and focuses on ethnic origin, gender, sexuality, religion or belief, disability, age.
2.2 Due to a vacancy control programme and budget savings, there
is a reduction in the number of posts being advertised externally to mitigate the number of redundancies, with more being advertised internally.
2.3 The impact of the economic climate and the need for
unprecedented savings has led to increased control over the amount of external recruitment that can be carried out by the Council and an increase in internal redeployment activity
2.4 All employees can now access their own Payroll/HR information
using a new online service known as MiPeople Self Service. As part of this, employees can update their own equality information. This helps the Council in monitoring its equality information for statistical purposes.
2.6 The appointment rates for the previous year 2014/15 are in the
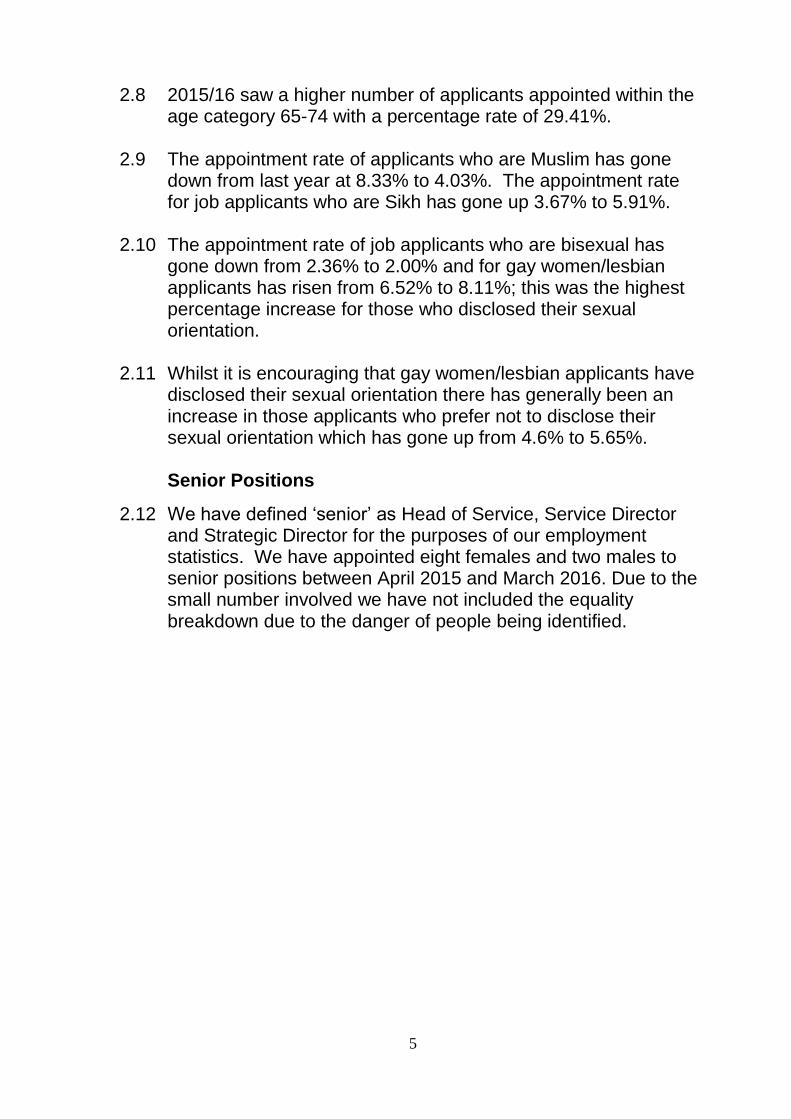
shaded area so we can compare. The appointment rate of Pakistani applicants has gone up from 3.44% to 3.87%. The appointment rate of Black and Black British Caribbean applicants up from 4.46% to 6.70%. The appointment rate of ‘other black background’ job applicants has gone down from 5.45% to 5.04%. The appointment rate of White British applicants has gone up from 5.84% to 8.48%, but the rate of White and Black Caribbean job applicants has gone down from 6.84% to 5.84%.
2.7 The appointment rate of disabled people has gone up from
4.56% in 2014/15 to 7.37% in 2015/16. We do have a policy of guaranteeing an interview to disabled people who request this, if they meet the essential requirements for the job in the person specification.
5
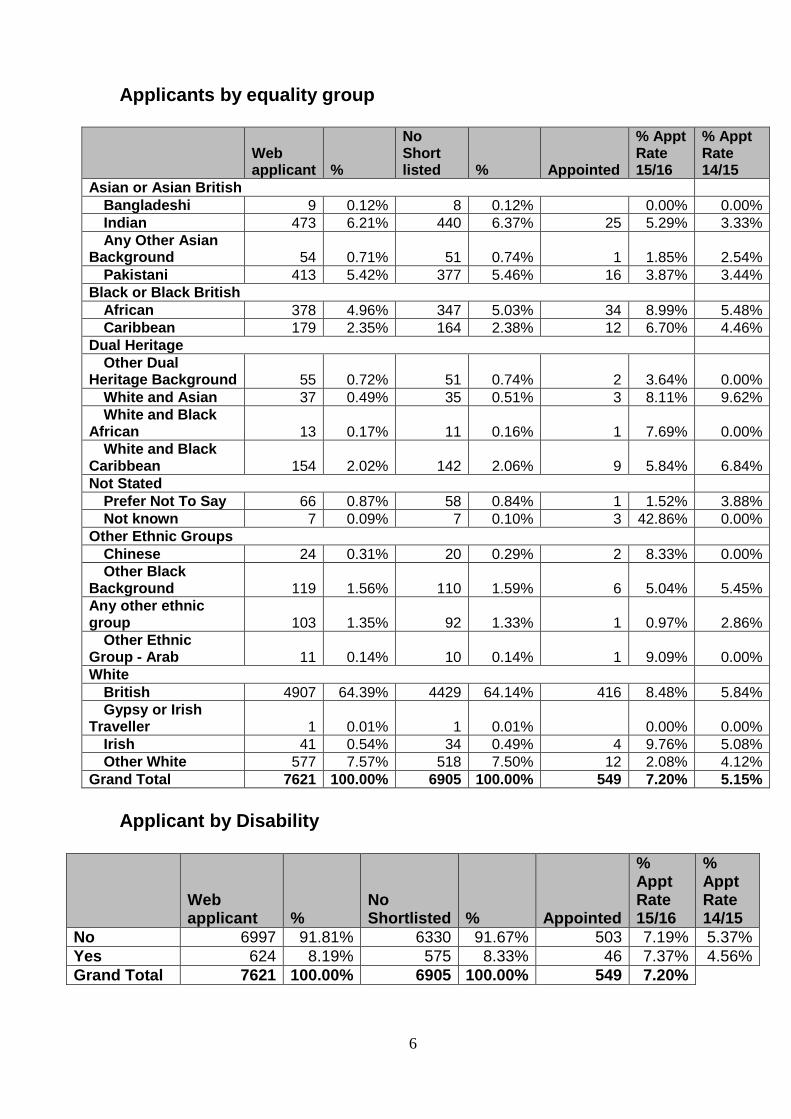
2.8 2015/16 saw a higher number of applicants appointed within the age category 65-74 with a percentage rate of 29.41%.
2.9 The appointment rate of applicants who are Muslim has gone
down from last year at 8.33% to 4.03%. The appointment rate for job applicants who are Sikh has gone up 3.67% to 5.91%.
2.10 The appointment rate of job applicants who are bisexual has
gone down from 2.36% to 2.00% and for gay women/lesbian applicants has risen from 6.52% to 8.11%; this was the highest percentage increase for those who disclosed their sexual orientation.
2.11 Whilst it is encouraging that gay women/lesbian applicants have
disclosed their sexual orientation there has generally been an increase in those applicants who prefer not to disclose their sexual orientation which has gone up from 4.6% to 5.65%.
Senior Positions
2.12 We have defined ‘senior’ as Head of Service, Service Director and Strategic Director for the purposes of our employment statistics. We have appointed eight females and two males to senior positions between April 2015 and March 2016. Due to the small number involved we have not included the equality breakdown due to the danger of people being identified.
6
Applicants by equality group
Web applicant %
No Short listed % Appointed
% Appt Rate 15/16
% Appt Rate 14/15
Asian or Asian British
Bangladeshi 9 0.12% 8 0.12% 0.00% 0.00%
Indian 473 6.21% 440 6.37% 25 5.29% 3.33%
Any Other Asian Background 54 0.71% 51 0.74% 1 1.85% 2.54%
Pakistani 413 5.42% 377 5.46% 16 3.87% 3.44%
Black or Black British
African 378 4.96% 347 5.03% 34 8.99% 5.48%
Caribbean 179 2.35% 164 2.38% 12 6.70% 4.46%
Dual Heritage
Other Dual Heritage Background 55 0.72% 51 0.74% 2 3.64% 0.00%
White and Asian 37 0.49% 35 0.51% 3 8.11% 9.62%
White and Black African 13 0.17% 11 0.16% 1 7.69% 0.00%
White and Black Caribbean 154 2.02% 142 2.06% 9 5.84% 6.84%
Not Stated
Prefer Not To Say 66 0.87% 58 0.84% 1 1.52% 3.88%
Not known 7 0.09% 7 0.10% 3 42.86% 0.00%
Other Ethnic Groups
Chinese 24 0.31% 20 0.29% 2 8.33% 0.00%
Other Black Background 119 1.56% 110 1.59% 6 5.04% 5.45%
Any other ethnic group 103 1.35% 92 1.33% 1 0.97% 2.86%
Other Ethnic Group - Arab 11 0.14% 10 0.14% 1 9.09% 0.00%
White
British 4907 64.39% 4429 64.14% 416 8.48% 5.84%
Gypsy or Irish Traveller 1 0.01% 1 0.01% 0.00% 0.00%
Irish 41 0.54% 34 0.49% 4 9.76% 5.08%
Other White 577 7.57% 518 7.50% 12 2.08% 4.12%
Grand Total 7621 100.00% 6905 100.00% 549 7.20% 5.15%
Applicant by Disability
Web applicant %
No Shortlisted % Appointed
% Appt Rate 15/16
% Appt Rate 14/15
No 6997 91.81% 6330 91.67% 503 7.19% 5.37%
Yes 624 8.19% 575 8.33% 46 7.37% 4.56%
Grand Total 7621 100.00% 6905 100.00% 549 7.20%
7
Applicant by Gender
Applicant by sexuality, religion or belief and age
Web applicant %
No Shortlisted % Appointed
% Appt Rate 15/16
Sexuality
Bisexual 100 1.31% 82 1.19% 2 2.00%
Gay Man 62 0.81% 58 0.84% 4 6.45%
Gay Woman/Lesbian 74 0.97% 66 0.96% 6 8.11%
Heterosexual/Straight 6745 88.51% 6119 88.62% 422 6.26%
Other 141 1.85% 130 1.88% 4 2.84%
Prefer Not To Say 336 4.41% 294 4.26% 19 5.65%
Not known 163 2.14% 156 2.26% 92 56.44%
Religion
Buddhist 30 0.39% 26 0.38% 3 10.00%
Christian 3127 41.03% 2845 41.20% 220 7.04%
Hindu 158 2.07% 149 2.16% 4 2.53%
Jewish 2 0.03% 1 0.01% 0.00%
Muslim 471 6.18% 428 6.20% 19 4.03%
No Religion 2905 38.12% 2605 37.73% 182 6.27%
Other Religion 127 1.67% 117 1.69% 6 4.72%
Prefer Not To Say 274 3.60% 250 3.62% 20 7.30%
Religion Not Stated 273 3.58% 252 3.65% 80 29.30%
Sikh 254 3.33% 232 3.36% 15 5.91%
Age
15-24 1987 26.07% 1775 25.71% 89 4.48%
25-34 2268 29.76% 2075 30.05% 163 7.19%
35-44 1580 20.73% 1431 20.72% 129 8.16%
45-54 1288 16.90% 1177 17.05% 130 10.09%
55-64 459 6.02% 411 5.95% 33 7.19%
65-74 17 0.22% 17 0.25% 5 29.41%
Unknown 22 0.29% 19 0.28% 0.00%
Grand Total 7621 100.00% 6905 100.00% 549 7.20%
Web applicant %
No Shortlisted % Appointed
% Appt Rate 15/16
% Appt Rate 14/15
Female 5282 69.31% 4827 69.91% 394 7.46% 5.24%
Male 2327 30.53% 2068 29.95% 155 6.66% 5.51%
Unknown 12 0.16% 10 0.14% 0.00% 0.00%
Grand Total 7621 100.00% 6905 100.00% 549 7.20%
8
Apprenticeships
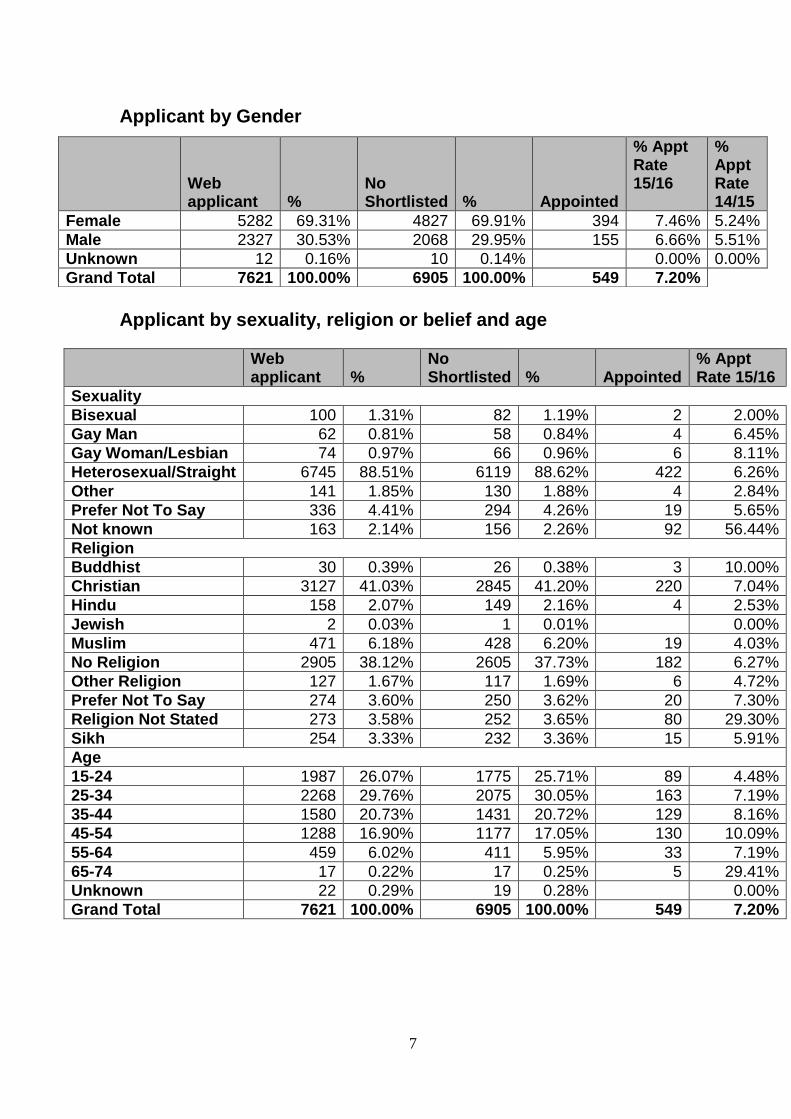
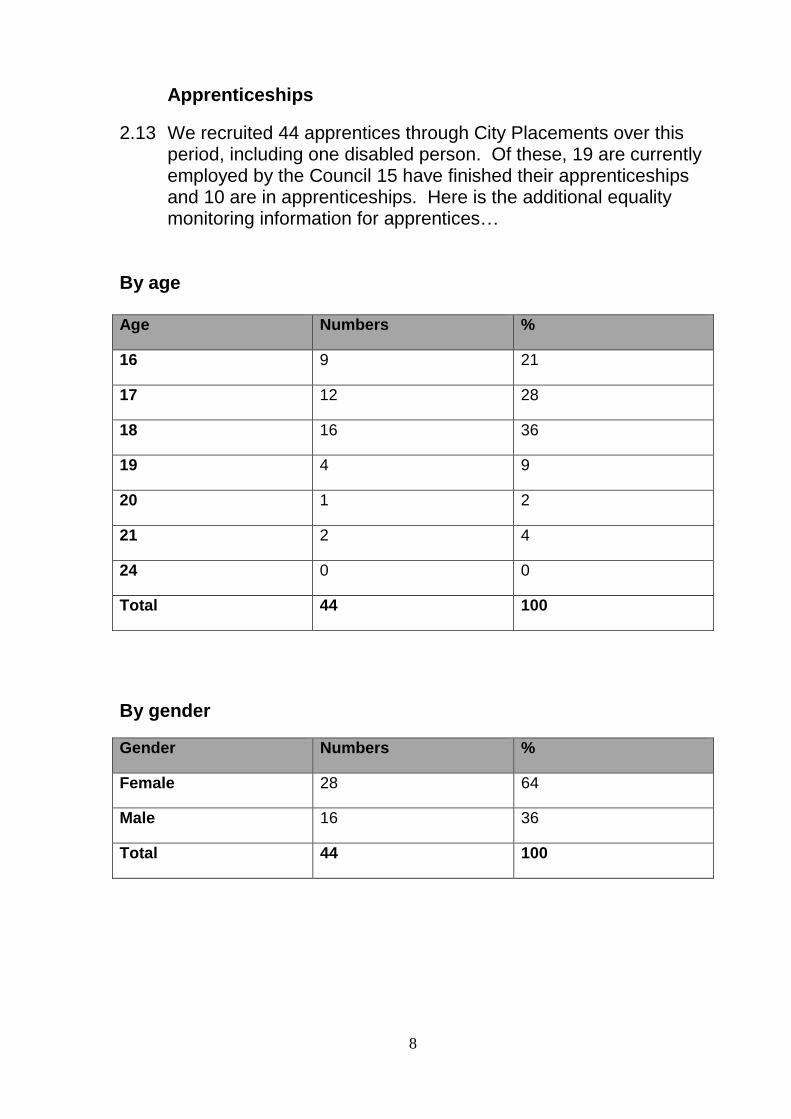
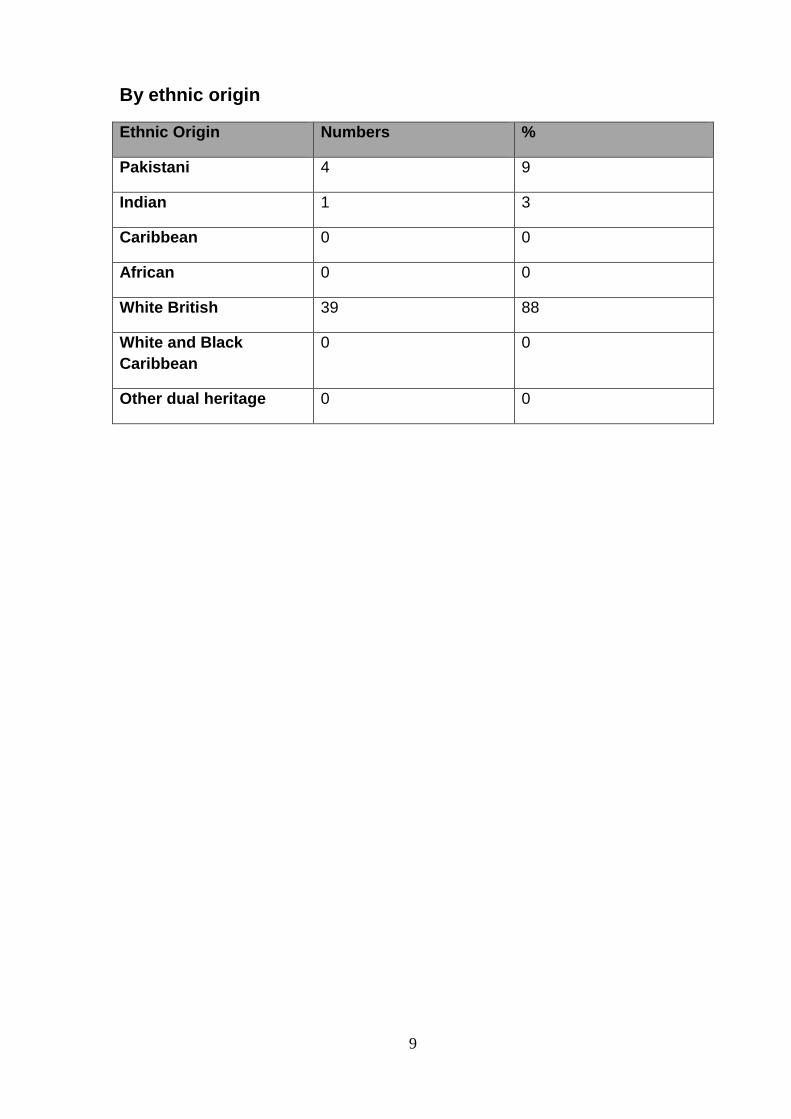
2.13 We recruited 44 apprentices through City Placements over this period, including one disabled person. Of these, 19 are currently employed by the Council 15 have finished their apprenticeships and 10 are in apprenticeships. Here is the additional equality monitoring information for apprentices…
By age Age Numbers %
16 9 21
17 12 28
18 16 36
19 4 9
20 1 2
21 2 4
24 0 0
Total 44 100
By gender
Gender Numbers %
Female 28 64
Male 16 36
Total 44 100
9
By ethnic origin
Ethnic Origin Numbers %
Pakistani 4 9
Indian 1 3
Caribbean 0 0
African 0 0
White British 39 88
White and Black
Caribbean
0 0
Other dual heritage 0 0
10
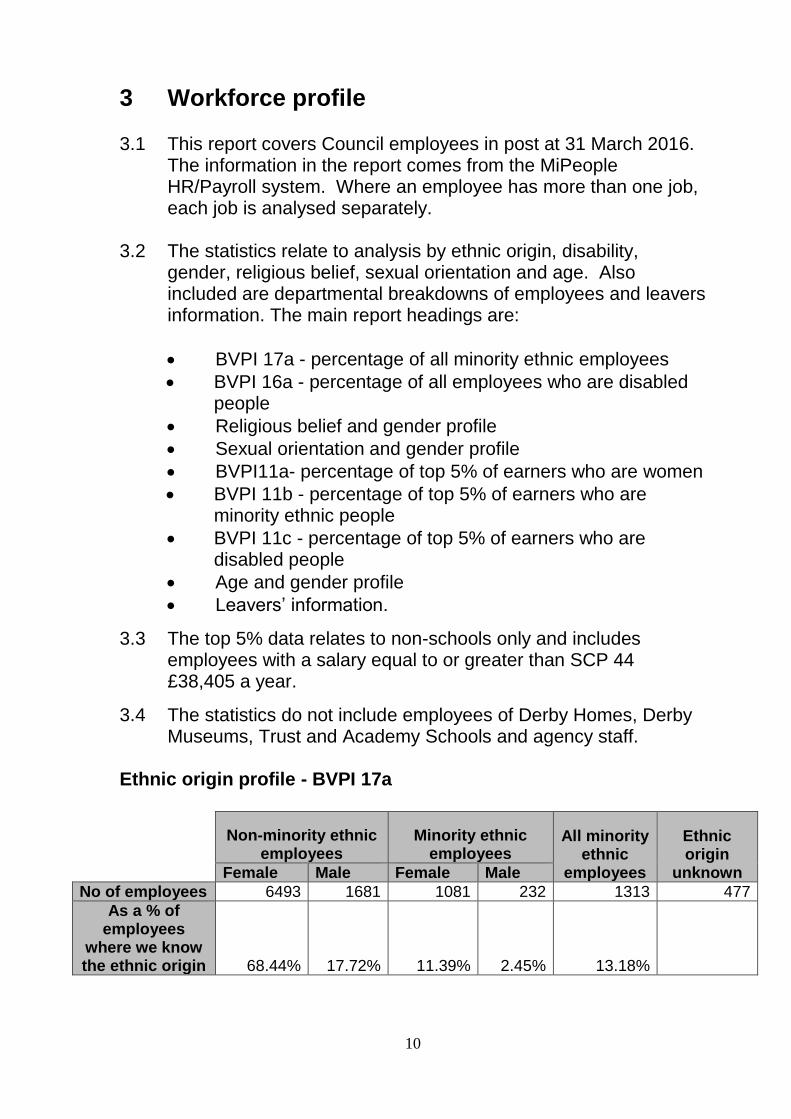
3 Workforce profile 3.1 This report covers Council employees in post at 31 March 2016.
The information in the report comes from the MiPeople HR/Payroll system. Where an employee has more than one job, each job is analysed separately.
3.2 The statistics relate to analysis by ethnic origin, disability,
gender, religious belief, sexual orientation and age. Also included are departmental breakdowns of employees and leavers information. The main report headings are:
BVPI 17a - percentage of all minority ethnic employees
BVPI 16a - percentage of all employees who are disabled people
Religious belief and gender profile
Sexual orientation and gender profile
BVPI11a- percentage of top 5% of earners who are women
BVPI 11b - percentage of top 5% of earners who are minority ethnic people
BVPI 11c - percentage of top 5% of earners who are disabled people
Age and gender profile
Leavers’ information.
3.3 The top 5% data relates to non-schools only and includes employees with a salary equal to or greater than SCP 44 £38,405 a year.
3.4 The statistics do not include employees of Derby Homes, Derby Museums, Trust and Academy Schools and agency staff.
Ethnic origin profile - BVPI 17a
Non-minority ethnic employees
Minority ethnic employees
All minority ethnic
employees
Ethnic origin
unknown
Female Male Female Male
No of employees 6493 1681 1081 232 1313 477
As a % of employees
where we know the ethnic origin 68.44% 17.72% 11.39% 2.45% 13.18%
11
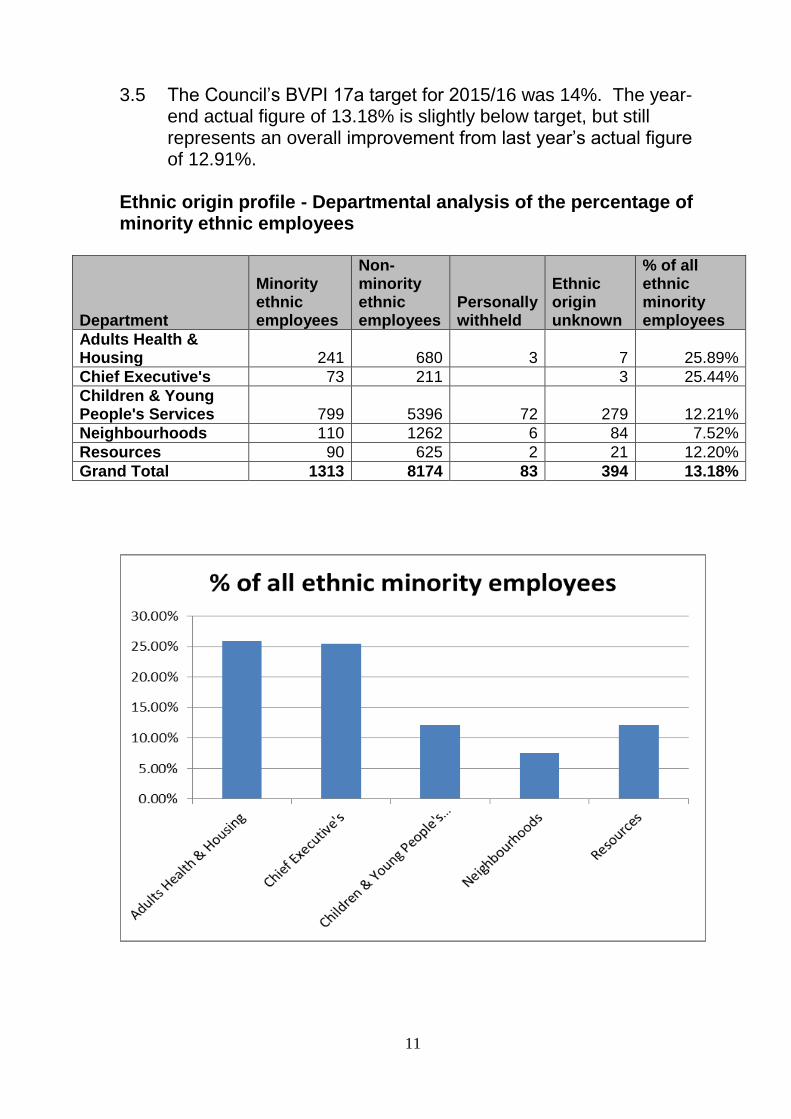
3.5 The Council’s BVPI 17a target for 2015/16 was 14%. The year-end actual figure of 13.18% is slightly below target, but still represents an overall improvement from last year’s actual figure of 12.91%.
Ethnic origin profile - Departmental analysis of the percentage of minority ethnic employees
Department
Minority ethnic employees
Non-minority ethnic employees
Personally withheld
Ethnic origin unknown
% of all ethnic minority employees
Adults Health & Housing 241 680 3 7 25.89%
Chief Executive's 73 211 3 25.44%
Children & Young People's Services 799 5396 72 279 12.21%
Neighbourhoods 110 1262 6 84 7.52%
Resources 90 625 2 21 12.20%
Grand Total 1313 8174 83 394 13.18%
12
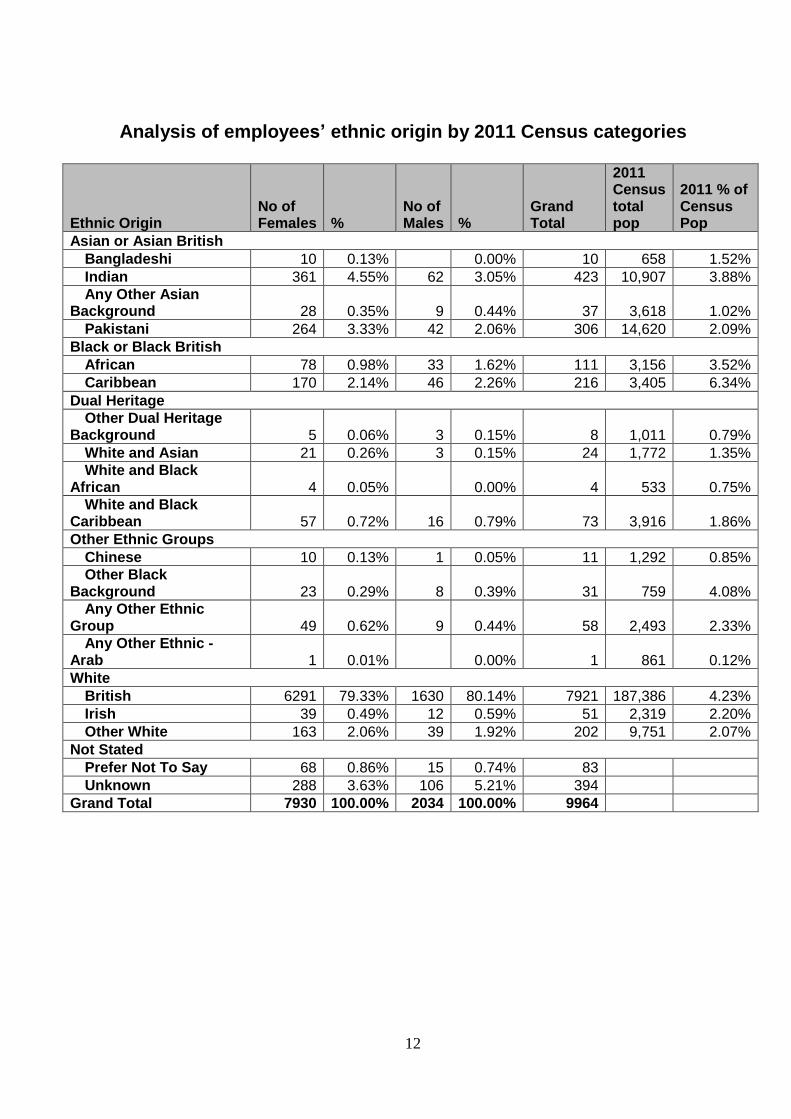
Analysis of employees’ ethnic origin by 2011 Census categories
Ethnic Origin No of Females %
No of Males %
Grand Total
2011 Census total pop
2011 % of Census Pop
Asian or Asian British
Bangladeshi 10 0.13% 0.00% 10 658 1.52%
Indian 361 4.55% 62 3.05% 423 10,907 3.88%
Any Other Asian Background 28 0.35% 9 0.44% 37 3,618 1.02%
Pakistani 264 3.33% 42 2.06% 306 14,620 2.09%
Black or Black British
African 78 0.98% 33 1.62% 111 3,156 3.52%
Caribbean 170 2.14% 46 2.26% 216 3,405 6.34%
Dual Heritage
Other Dual Heritage Background 5 0.06% 3 0.15% 8 1,011 0.79%
White and Asian 21 0.26% 3 0.15% 24 1,772 1.35%
White and Black African 4 0.05% 0.00% 4 533 0.75%
White and Black Caribbean 57 0.72% 16 0.79% 73 3,916 1.86%
Other Ethnic Groups
Chinese 10 0.13% 1 0.05% 11 1,292 0.85%
Other Black Background 23 0.29% 8 0.39% 31 759 4.08%
Any Other Ethnic Group 49 0.62% 9 0.44% 58 2,493 2.33%
Any Other Ethnic - Arab 1 0.01% 0.00% 1 861 0.12%
White
British 6291 79.33% 1630 80.14% 7921 187,386 4.23%
Irish 39 0.49% 12 0.59% 51 2,319 2.20%
Other White 163 2.06% 39 1.92% 202 9,751 2.07%
Not Stated
Prefer Not To Say 68 0.86% 15 0.74% 83
Unknown 288 3.63% 106 5.21% 394
Grand Total 7930 100.00% 2034 100.00% 9964
13
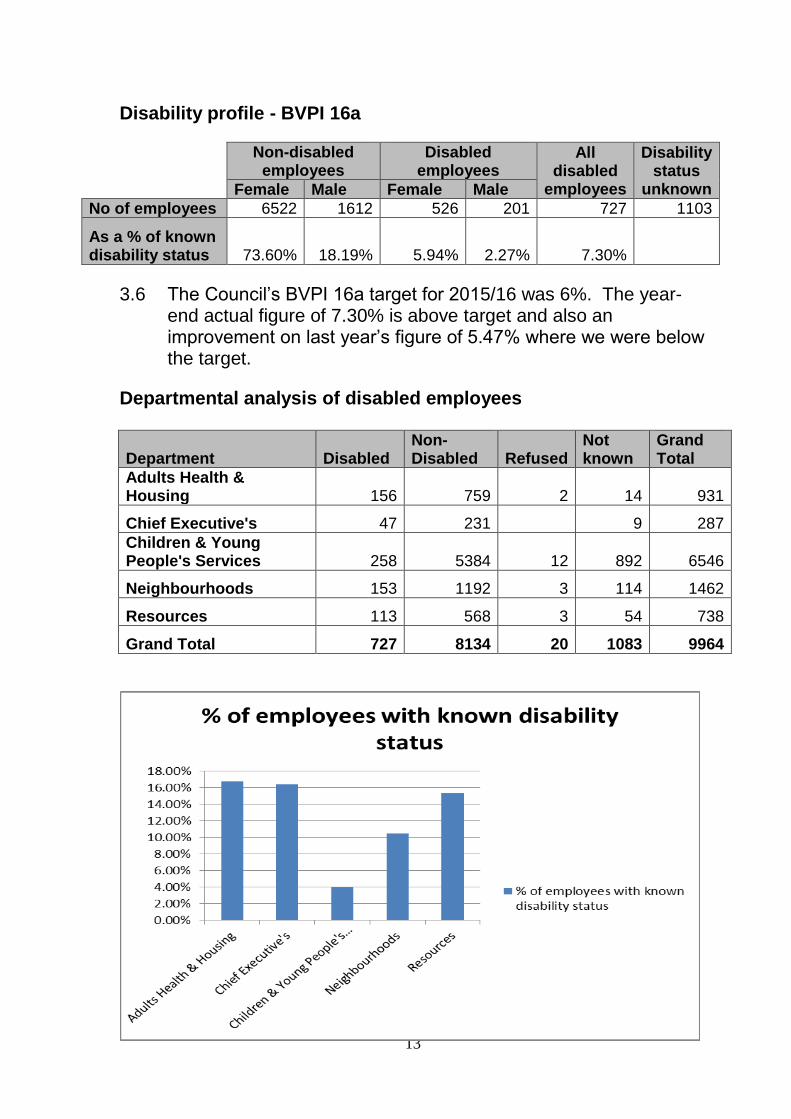
Disability profile - BVPI 16a
Non-disabled employees
Disabled employees
All disabled
employees
Disability status
unknown
Female Male Female Male
No of employees 6522 1612 526 201 727 1103
As a % of known disability status 73.60% 18.19% 5.94% 2.27% 7.30%
3.6 The Council’s BVPI 16a target for 2015/16 was 6%. The year-end actual figure of 7.30% is above target and also an improvement on last year’s figure of 5.47% where we were below the target.
Departmental analysis of disabled employees
Department Disabled Non-Disabled Refused
Not known
Grand Total
Adults Health & Housing 156 759 2 14 931
Chief Executive's 47 231 9 287
Children & Young People's Services 258 5384 12 892 6546
Neighbourhoods 153 1192 3 114 1462
Resources 113 568 3 54 738
Grand Total 727 8134 20 1083 9964
14
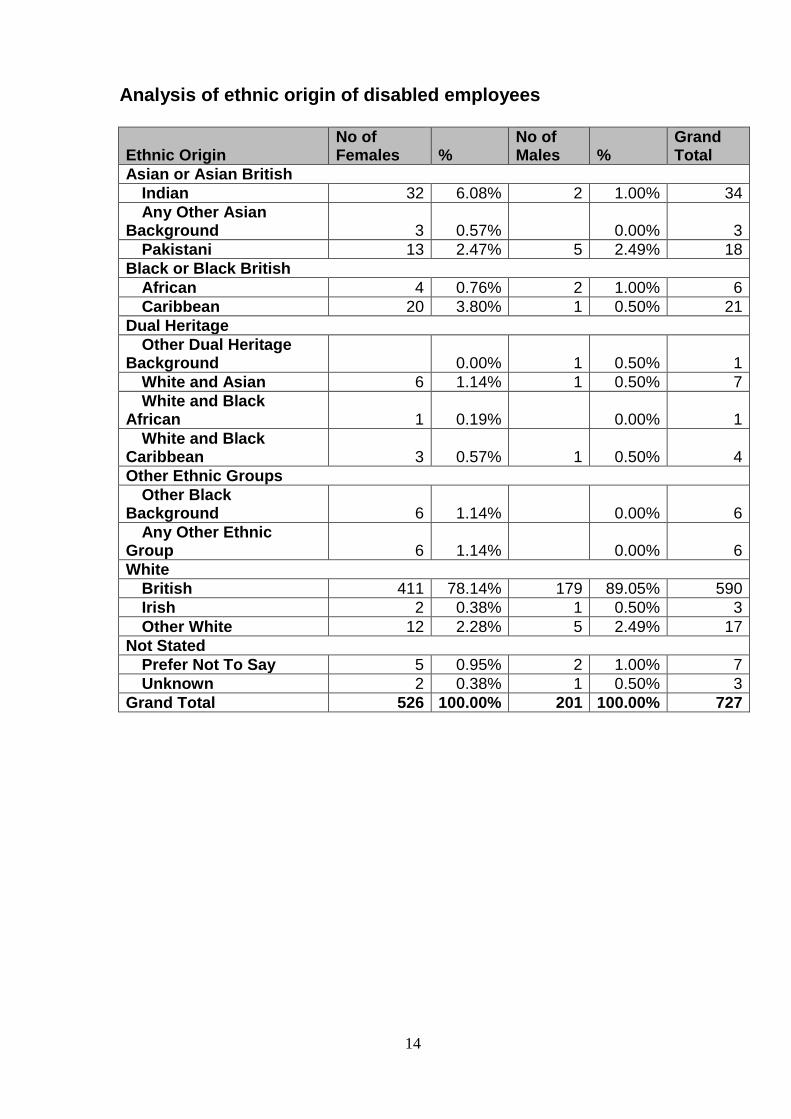
Analysis of ethnic origin of disabled employees
Ethnic Origin No of Females %
No of Males %
Grand Total
Asian or Asian British
Indian 32 6.08% 2 1.00% 34
Any Other Asian Background 3 0.57% 0.00% 3
Pakistani 13 2.47% 5 2.49% 18
Black or Black British
African 4 0.76% 2 1.00% 6
Caribbean 20 3.80% 1 0.50% 21
Dual Heritage
Other Dual Heritage Background 0.00% 1 0.50% 1
White and Asian 6 1.14% 1 0.50% 7
White and Black African 1 0.19% 0.00% 1
White and Black Caribbean 3 0.57% 1 0.50% 4
Other Ethnic Groups
Other Black Background 6 1.14% 0.00% 6
Any Other Ethnic Group 6 1.14% 0.00% 6
White
British 411 78.14% 179 89.05% 590
Irish 2 0.38% 1 0.50% 3
Other White 12 2.28% 5 2.49% 17
Not Stated
Prefer Not To Say 5 0.95% 2 1.00% 7
Unknown 2 0.38% 1 0.50% 3
Grand Total 526 100.00% 201 100.00% 727
15
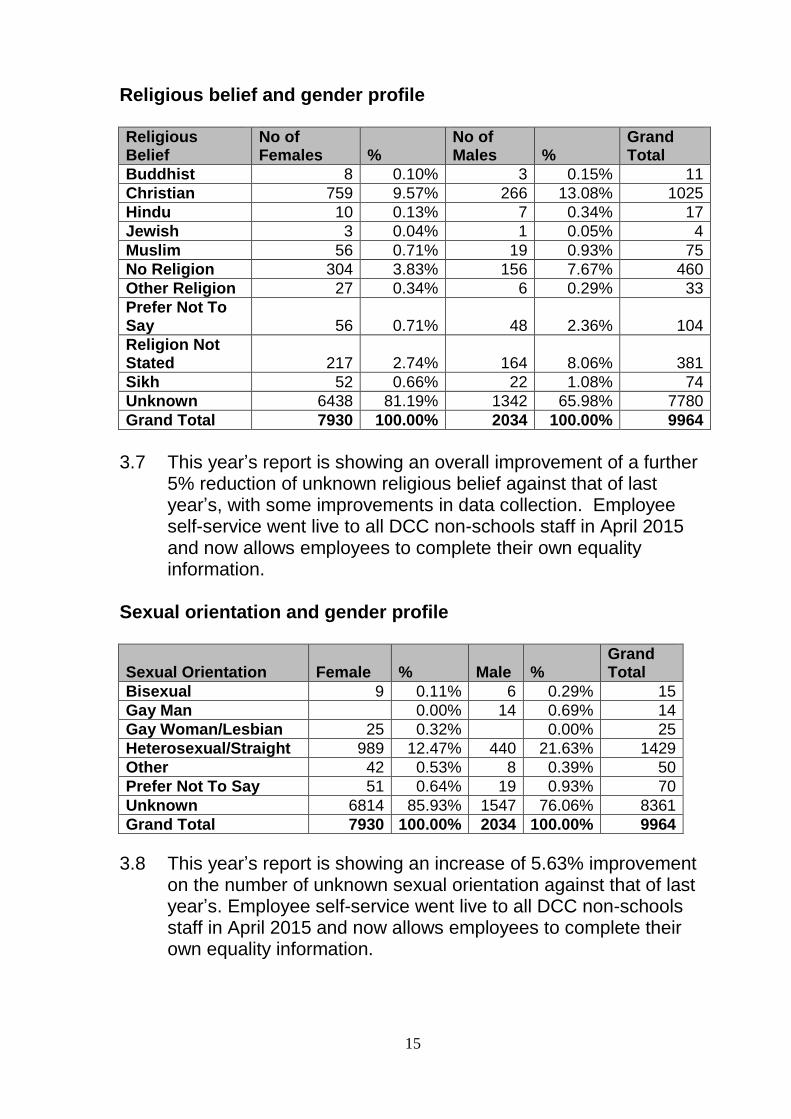
Religious belief and gender profile Religious Belief
No of Females %
No of Males %
Grand Total
Buddhist 8 0.10% 3 0.15% 11
Christian 759 9.57% 266 13.08% 1025
Hindu 10 0.13% 7 0.34% 17
Jewish 3 0.04% 1 0.05% 4
Muslim 56 0.71% 19 0.93% 75
No Religion 304 3.83% 156 7.67% 460
Other Religion 27 0.34% 6 0.29% 33
Prefer Not To Say 56 0.71% 48 2.36% 104
Religion Not Stated 217 2.74% 164 8.06% 381
Sikh 52 0.66% 22 1.08% 74
Unknown 6438 81.19% 1342 65.98% 7780
Grand Total 7930 100.00% 2034 100.00% 9964
3.7 This year’s report is showing an overall improvement of a further
5% reduction of unknown religious belief against that of last year’s, with some improvements in data collection. Employee self-service went live to all DCC non-schools staff in April 2015 and now allows employees to complete their own equality information.
Sexual orientation and gender profile
Sexual Orientation Female % Male % Grand Total
Bisexual 9 0.11% 6 0.29% 15
Gay Man 0.00% 14 0.69% 14
Gay Woman/Lesbian 25 0.32% 0.00% 25
Heterosexual/Straight 989 12.47% 440 21.63% 1429
Other 42 0.53% 8 0.39% 50
Prefer Not To Say 51 0.64% 19 0.93% 70
Unknown 6814 85.93% 1547 76.06% 8361
Grand Total 7930 100.00% 2034 100.00% 9964
3.8 This year’s report is showing an increase of 5.63% improvement on the number of unknown sexual orientation against that of last year’s. Employee self-service went live to all DCC non-schools staff in April 2015 and now allows employees to complete their own equality information.
16
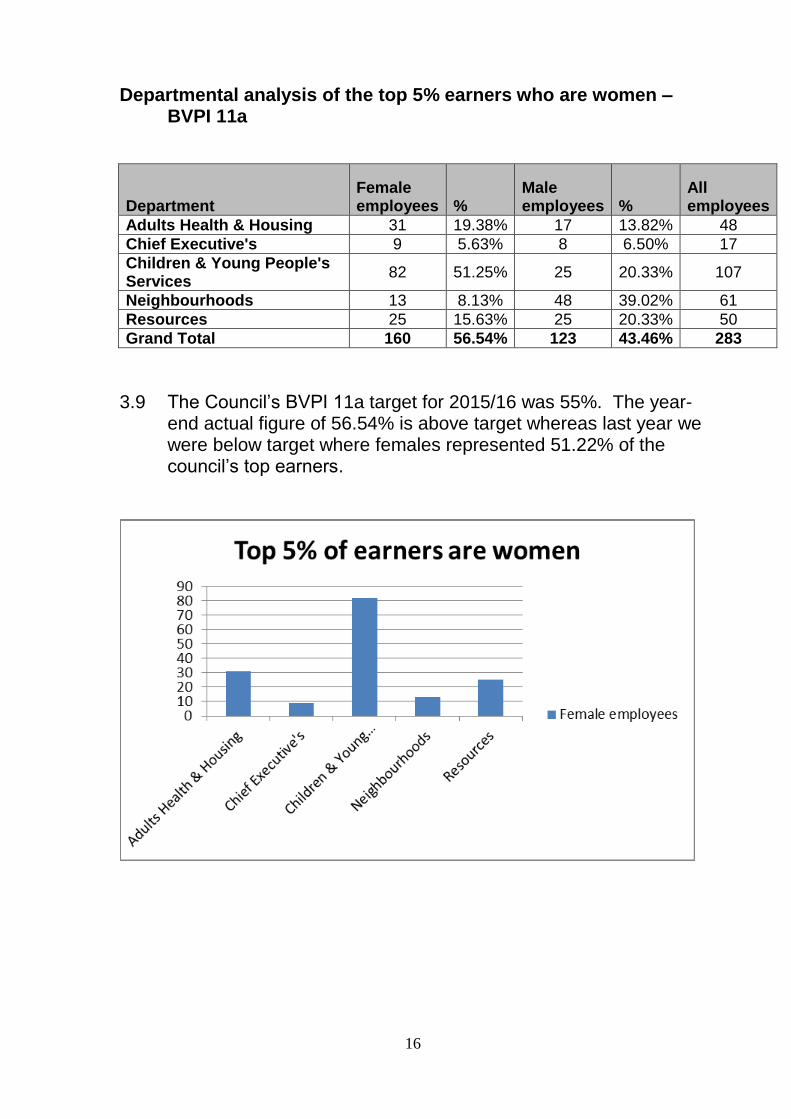
Departmental analysis of the top 5% earners who are women – BVPI 11a
Department Female employees %
Male employees %
All employees
Adults Health & Housing 31 19.38% 17 13.82% 48
Chief Executive's 9 5.63% 8 6.50% 17
Children & Young People's Services
82 51.25% 25 20.33% 107
Neighbourhoods 13 8.13% 48 39.02% 61
Resources 25 15.63% 25 20.33% 50
Grand Total 160 56.54% 123 43.46% 283
3.9 The Council’s BVPI 11a target for 2015/16 was 55%. The year-
end actual figure of 56.54% is above target whereas last year we were below target where females represented 51.22% of the council’s top earners.
17
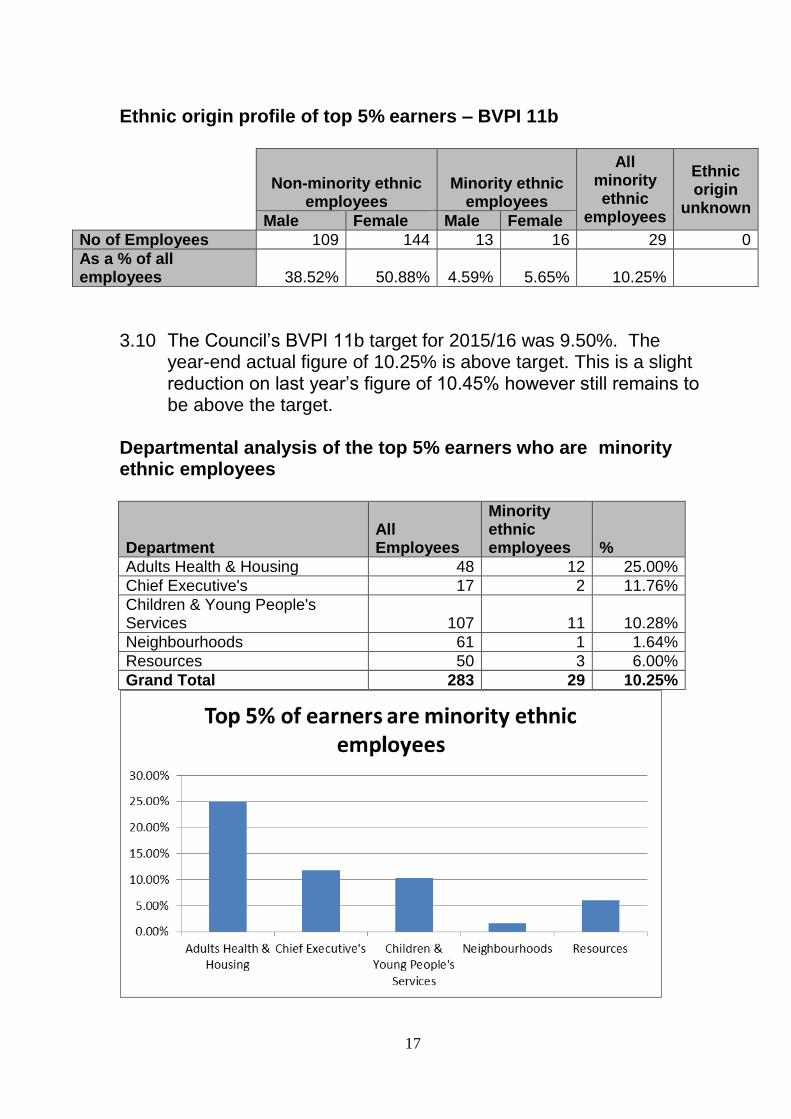
Ethnic origin profile of top 5% earners – BVPI 11b
Non-minority ethnic employees
Minority ethnic employees
All minority ethnic
employees
Ethnic origin
unknown Male Female Male Female
No of Employees 109 144 13 16 29 0
As a % of all employees 38.52% 50.88% 4.59% 5.65% 10.25%
3.10 The Council’s BVPI 11b target for 2015/16 was 9.50%. The
year-end actual figure of 10.25% is above target. This is a slight reduction on last year’s figure of 10.45% however still remains to be above the target.
Departmental analysis of the top 5% earners who are minority ethnic employees
Department All Employees
Minority ethnic employees %
Adults Health & Housing 48 12 25.00%
Chief Executive's 17 2 11.76%
Children & Young People's Services 107 11 10.28%
Neighbourhoods 61 1 1.64%
Resources 50 3 6.00%
Grand Total 283 29 10.25%
18
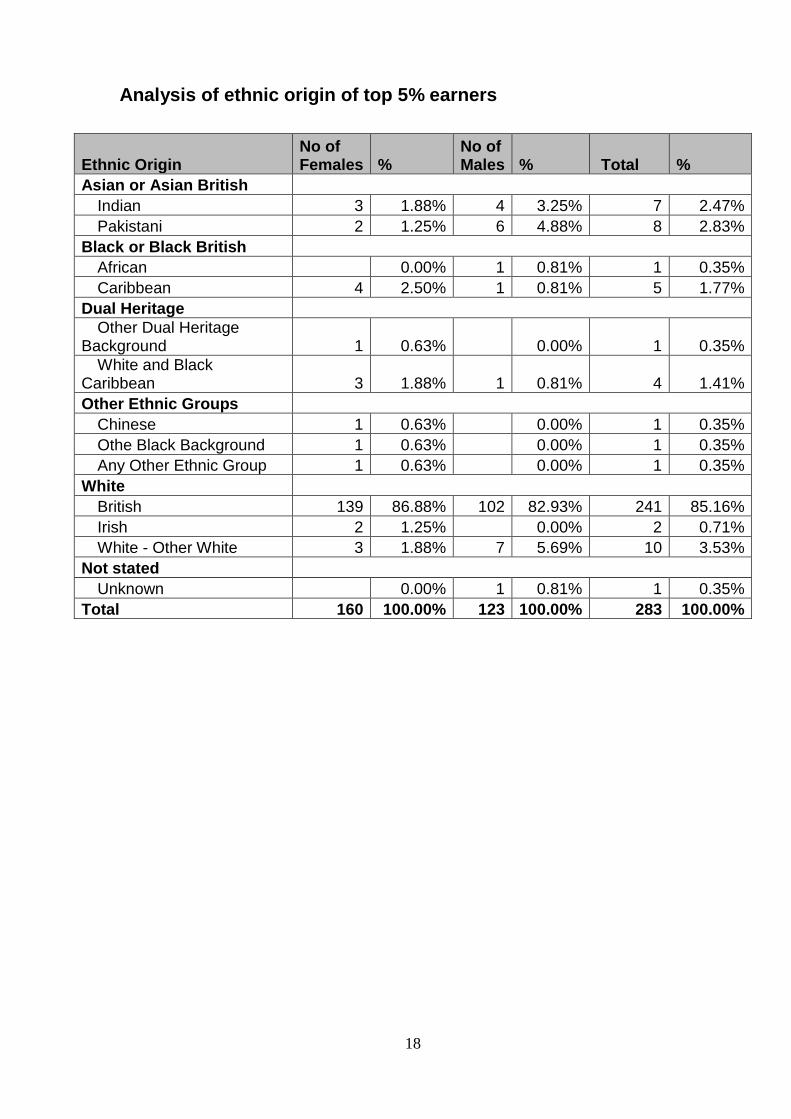
Analysis of ethnic origin of top 5% earners
Ethnic Origin No of Females %
No of Males % Total %
Asian or Asian British
Indian 3 1.88% 4 3.25% 7 2.47%
Pakistani 2 1.25% 6 4.88% 8 2.83%
Black or Black British
African 0.00% 1 0.81% 1 0.35%
Caribbean 4 2.50% 1 0.81% 5 1.77%
Dual Heritage
Other Dual Heritage Background 1 0.63% 0.00% 1 0.35%
White and Black Caribbean 3 1.88% 1 0.81% 4 1.41%
Other Ethnic Groups
Chinese 1 0.63% 0.00% 1 0.35%
Othe Black Background 1 0.63% 0.00% 1 0.35%
Any Other Ethnic Group 1 0.63% 0.00% 1 0.35%
White
British 139 86.88% 102 82.93% 241 85.16%
Irish 2 1.25% 0.00% 2 0.71%
White - Other White 3 1.88% 7 5.69% 10 3.53%
Not stated
Unknown 0.00% 1 0.81% 1 0.35%
Total 160 100.00% 123 100.00% 283 100.00%
19
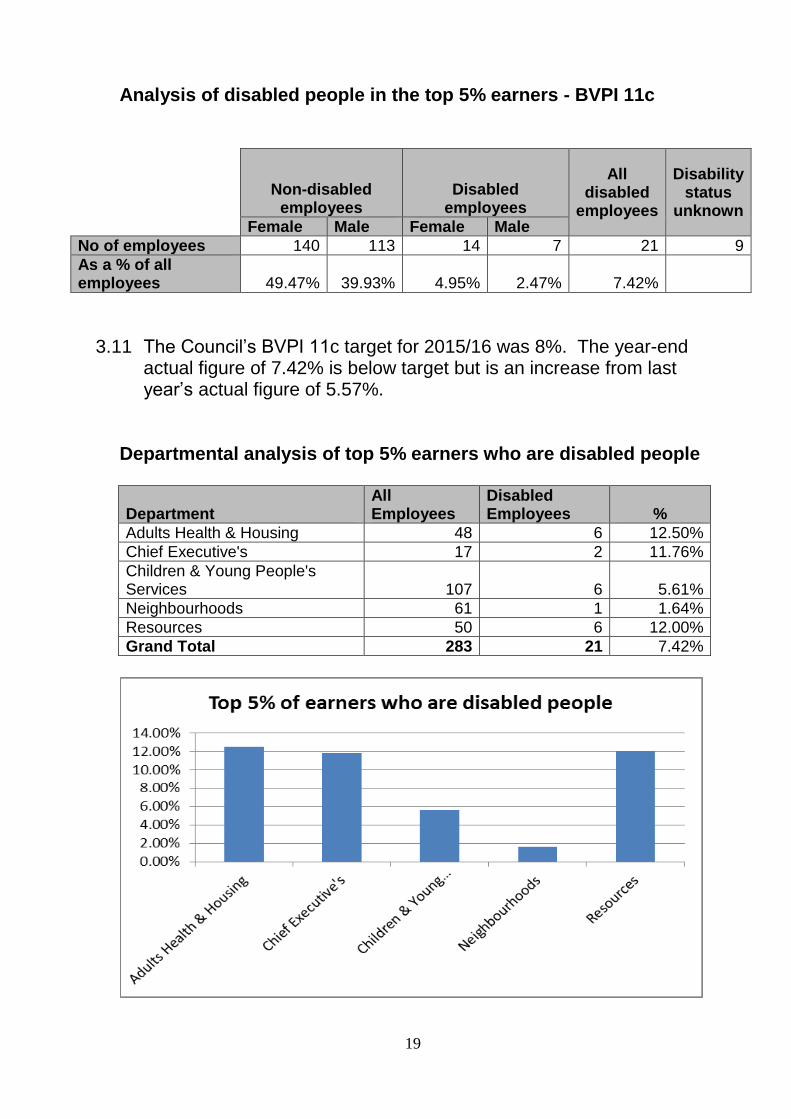
Analysis of disabled people in the top 5% earners - BVPI 11c
Non-disabled employees
Disabled employees
All disabled
employees
Disability status
unknown Female Male Female Male
No of employees 140 113 14 7 21 9
As a % of all employees 49.47% 39.93% 4.95% 2.47% 7.42%
3.11 The Council’s BVPI 11c target for 2015/16 was 8%. The year-end actual figure of 7.42% is below target but is an increase from last year’s actual figure of 5.57%.
Departmental analysis of top 5% earners who are disabled people
Department All Employees
Disabled Employees %
Adults Health & Housing 48 6 12.50%
Chief Executive's 17 2 11.76%
Children & Young People's Services 107 6 5.61%
Neighbourhoods 61 1 1.64%
Resources 50 6 12.00%
Grand Total 283 21 7.42%
20
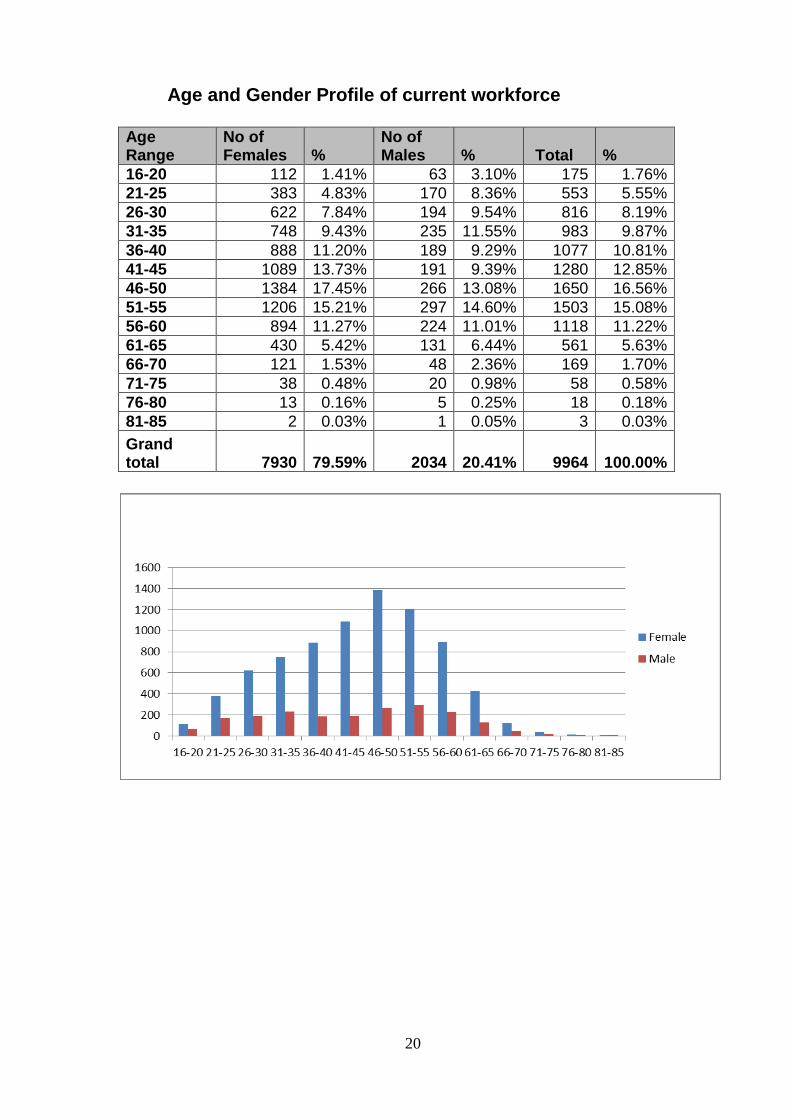
Age and Gender Profile of current workforce Age Range
No of Females %
No of Males % Total %
16-20 112 1.41% 63 3.10% 175 1.76%
21-25 383 4.83% 170 8.36% 553 5.55%
26-30 622 7.84% 194 9.54% 816 8.19%
31-35 748 9.43% 235 11.55% 983 9.87%
36-40 888 11.20% 189 9.29% 1077 10.81%
41-45 1089 13.73% 191 9.39% 1280 12.85%
46-50 1384 17.45% 266 13.08% 1650 16.56%
51-55 1206 15.21% 297 14.60% 1503 15.08%
56-60 894 11.27% 224 11.01% 1118 11.22%
61-65 430 5.42% 131 6.44% 561 5.63%
66-70 121 1.53% 48 2.36% 169 1.70%
71-75 38 0.48% 20 0.98% 58 0.58%
76-80 13 0.16% 5 0.25% 18 0.18%
81-85 2 0.03% 1 0.05% 3 0.03%
Grand total 7930 79.59% 2034 20.41% 9964 100.00%
21
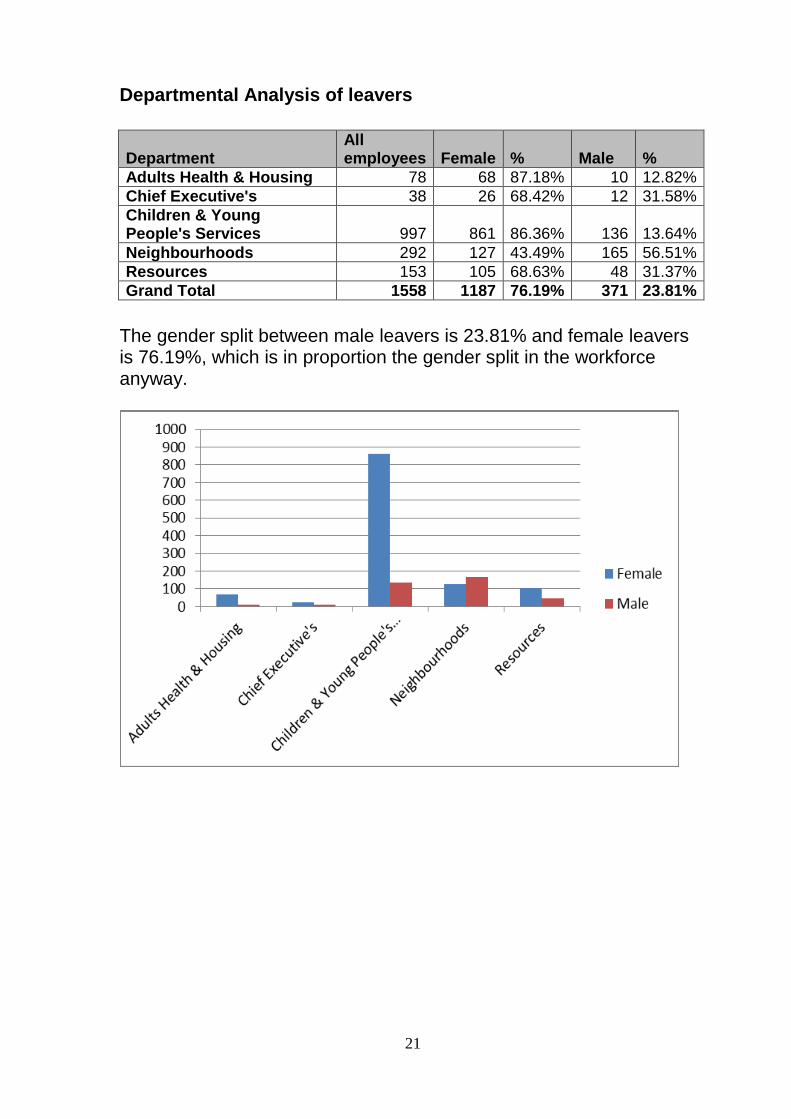
Departmental Analysis of leavers
Department All employees Female % Male %
Adults Health & Housing 78 68 87.18% 10 12.82%
Chief Executive's 38 26 68.42% 12 31.58%
Children & Young People's Services 997 861 86.36% 136 13.64%
Neighbourhoods 292 127 43.49% 165 56.51%
Resources 153 105 68.63% 48 31.37%
Grand Total 1558 1187 76.19% 371 23.81%
The gender split between male leavers is 23.81% and female leavers is 76.19%, which is in proportion the gender split in the workforce anyway.
22
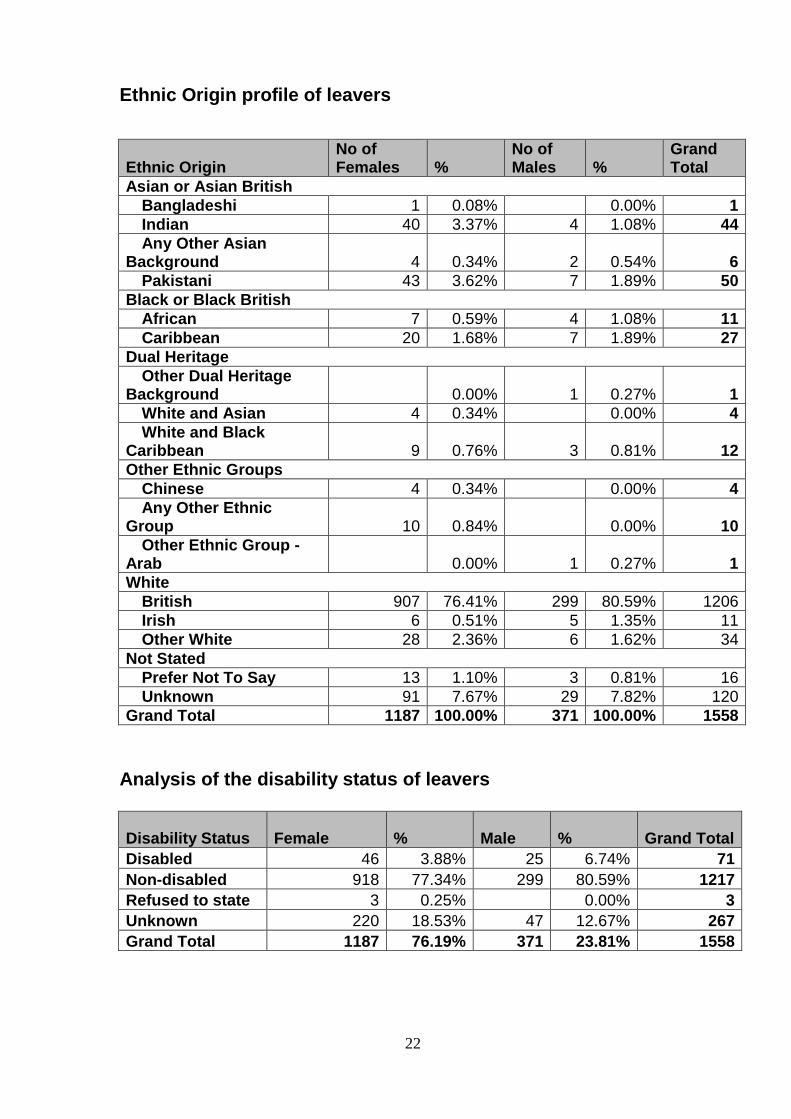
Ethnic Origin profile of leavers
Ethnic Origin No of Females %
No of Males %
Grand Total
Asian or Asian British
Bangladeshi 1 0.08% 0.00% 1
Indian 40 3.37% 4 1.08% 44
Any Other Asian Background 4 0.34% 2 0.54% 6
Pakistani 43 3.62% 7 1.89% 50
Black or Black British
African 7 0.59% 4 1.08% 11
Caribbean 20 1.68% 7 1.89% 27
Dual Heritage
Other Dual Heritage Background 0.00% 1 0.27% 1
White and Asian 4 0.34% 0.00% 4
White and Black Caribbean 9 0.76% 3 0.81% 12
Other Ethnic Groups
Chinese 4 0.34% 0.00% 4
Any Other Ethnic Group 10 0.84% 0.00% 10
Other Ethnic Group - Arab 0.00% 1 0.27% 1
White
British 907 76.41% 299 80.59% 1206
Irish 6 0.51% 5 1.35% 11
Other White 28 2.36% 6 1.62% 34
Not Stated
Prefer Not To Say 13 1.10% 3 0.81% 16
Unknown 91 7.67% 29 7.82% 120
Grand Total 1187 100.00% 371 100.00% 1558
Analysis of the disability status of leavers
Disability Status Female % Male % Grand Total
Disabled 46 3.88% 25 6.74% 71
Non-disabled 918 77.34% 299 80.59% 1217
Refused to state 3 0.25% 0.00% 3
Unknown 220 18.53% 47 12.67% 267
Grand Total 1187 76.19% 371 23.81% 1558

23
Pay and Reward 3.5 We have completed our Pay and Reward Project and 3,500
employees in council directorates and 2,800 employees in schools have had their pay evaluated. An Equal Pay Trend Analysis Report was completed by Hay in September 2015. We have now implemented the evaluation outcomes and the new conditions of employment.
24
4 Training and Development
4.1 Local Government budget pressures mean we use innovative and blended approaches to learning and development. We procured an e-Learning platform to meet our Equality, Information Governance, Safeguarding, Health and Safety Requirements in the main, whilst also offering other skills on-line courses to the workforce to aid self-development. All our equality courses are mandatory for employees to complete.
4.2 Formal training events include up-skilling managers in various
management interventions such as investigation skills, attendance management, handling difficult conversations and so on. The Workforce Development Teams in the former Adults, Health and Housing and Children’s and Young People’s Directorates continue to provide on-going professional development interventions. In addition to professional development, statutory courses such as health and safety, safeguarding, manual handling, risk assessment, fire evacuation, first aid are also provided.
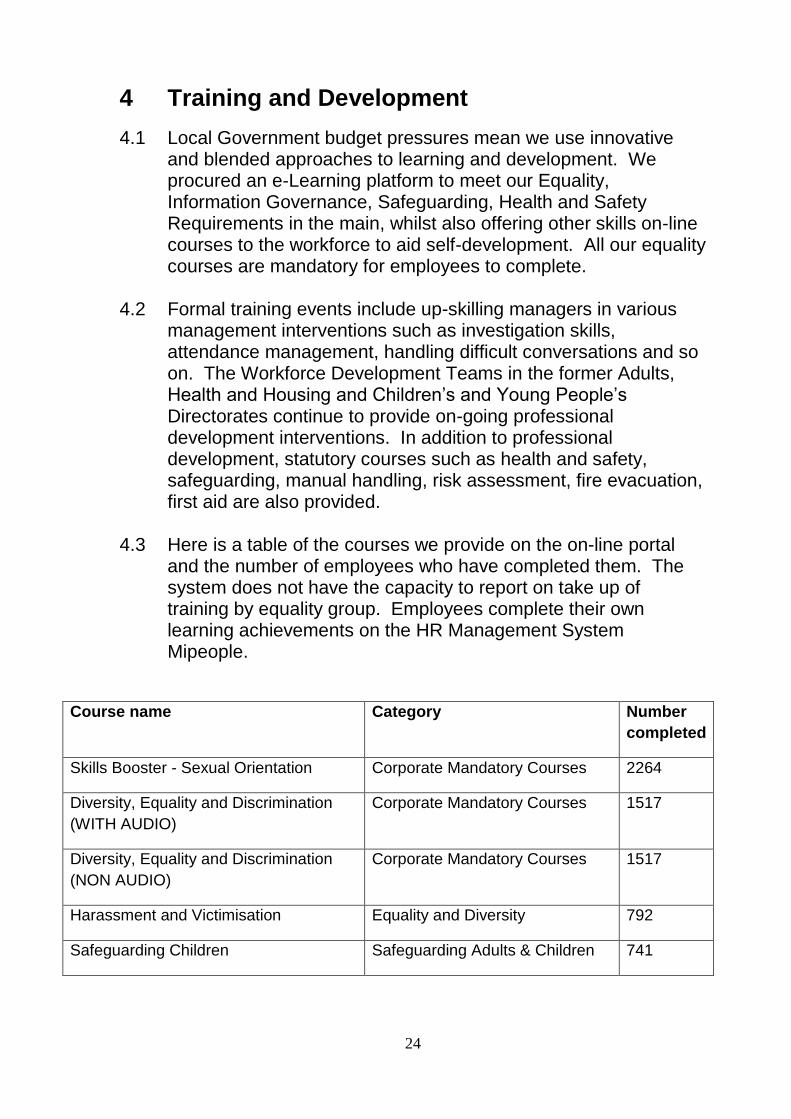
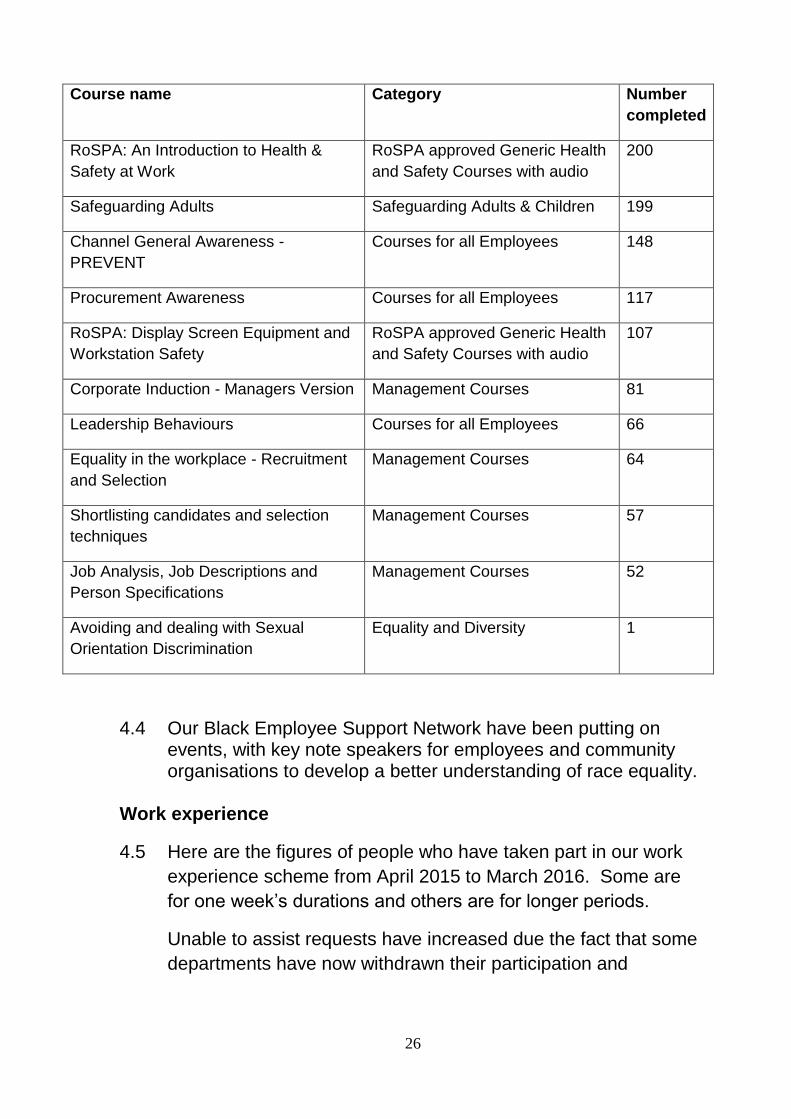
4.3 Here is a table of the courses we provide on the on-line portal
and the number of employees who have completed them. The system does not have the capacity to report on take up of training by equality group. Employees complete their own learning achievements on the HR Management System Mipeople.
Course name Category Number
completed
Skills Booster - Sexual Orientation Corporate Mandatory Courses 2264
Diversity, Equality and Discrimination
(WITH AUDIO)
Corporate Mandatory Courses 1517
Diversity, Equality and Discrimination
(NON AUDIO)
Corporate Mandatory Courses 1517
Harassment and Victimisation Equality and Diversity 792
Safeguarding Children Safeguarding Adults & Children 741
25
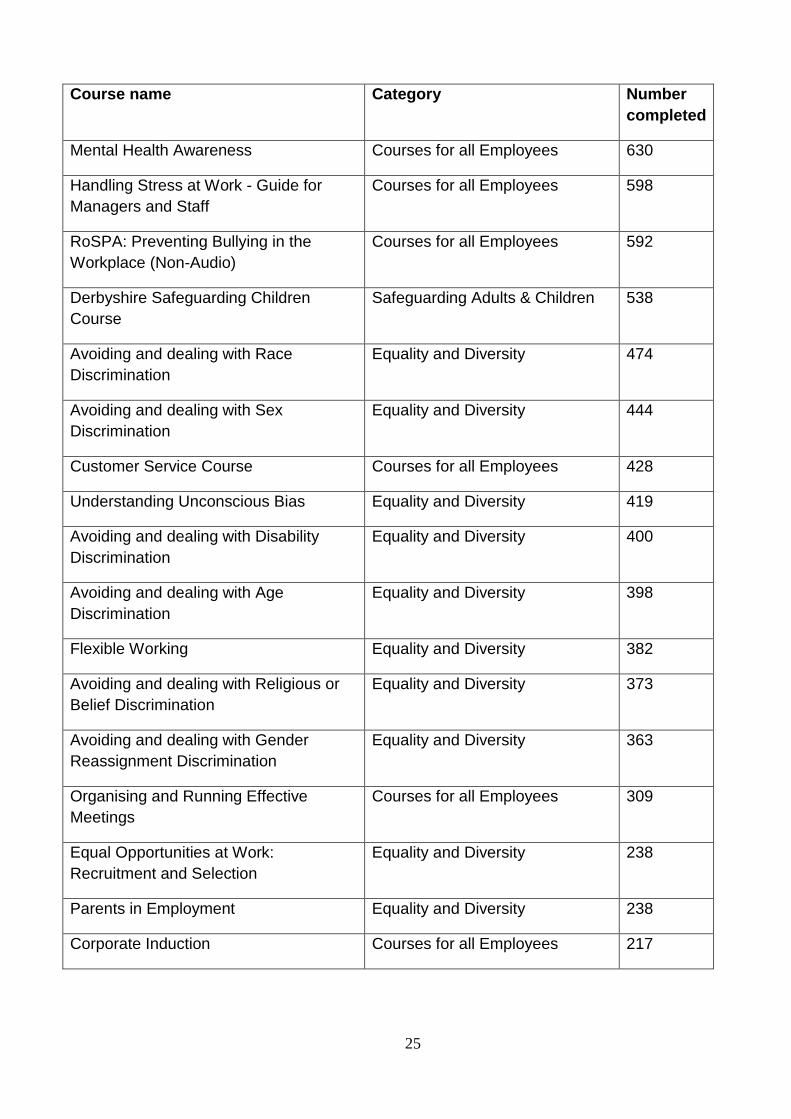
Course name Category Number
completed
Mental Health Awareness Courses for all Employees 630
Handling Stress at Work - Guide for
Managers and Staff
Courses for all Employees 598
RoSPA: Preventing Bullying in the
Workplace (Non-Audio)
Courses for all Employees 592
Derbyshire Safeguarding Children
Course
Safeguarding Adults & Children 538
Avoiding and dealing with Race
Discrimination
Equality and Diversity 474
Avoiding and dealing with Sex
Discrimination
Equality and Diversity 444
Customer Service Course Courses for all Employees 428
Understanding Unconscious Bias Equality and Diversity 419
Avoiding and dealing with Disability
Discrimination
Equality and Diversity 400
Avoiding and dealing with Age
Discrimination
Equality and Diversity 398
Flexible Working Equality and Diversity 382
Avoiding and dealing with Religious or
Belief Discrimination
Equality and Diversity 373
Avoiding and dealing with Gender
Reassignment Discrimination
Equality and Diversity 363
Organising and Running Effective
Meetings
Courses for all Employees 309
Equal Opportunities at Work:
Recruitment and Selection
Equality and Diversity 238
Parents in Employment Equality and Diversity 238
Corporate Induction Courses for all Employees 217
26
Course name Category Number
completed
RoSPA: An Introduction to Health &
Safety at Work
RoSPA approved Generic Health
and Safety Courses with audio
200
Safeguarding Adults Safeguarding Adults & Children 199
Channel General Awareness -
PREVENT
Courses for all Employees 148
Procurement Awareness Courses for all Employees 117
RoSPA: Display Screen Equipment and
Workstation Safety
RoSPA approved Generic Health
and Safety Courses with audio
107
Corporate Induction - Managers Version Management Courses 81
Leadership Behaviours Courses for all Employees 66
Equality in the workplace - Recruitment
and Selection
Management Courses 64
Shortlisting candidates and selection
techniques
Management Courses 57
Job Analysis, Job Descriptions and
Person Specifications
Management Courses 52
Avoiding and dealing with Sexual
Orientation Discrimination
Equality and Diversity 1
4.4 Our Black Employee Support Network have been putting on
events, with key note speakers for employees and community organisations to develop a better understanding of race equality.
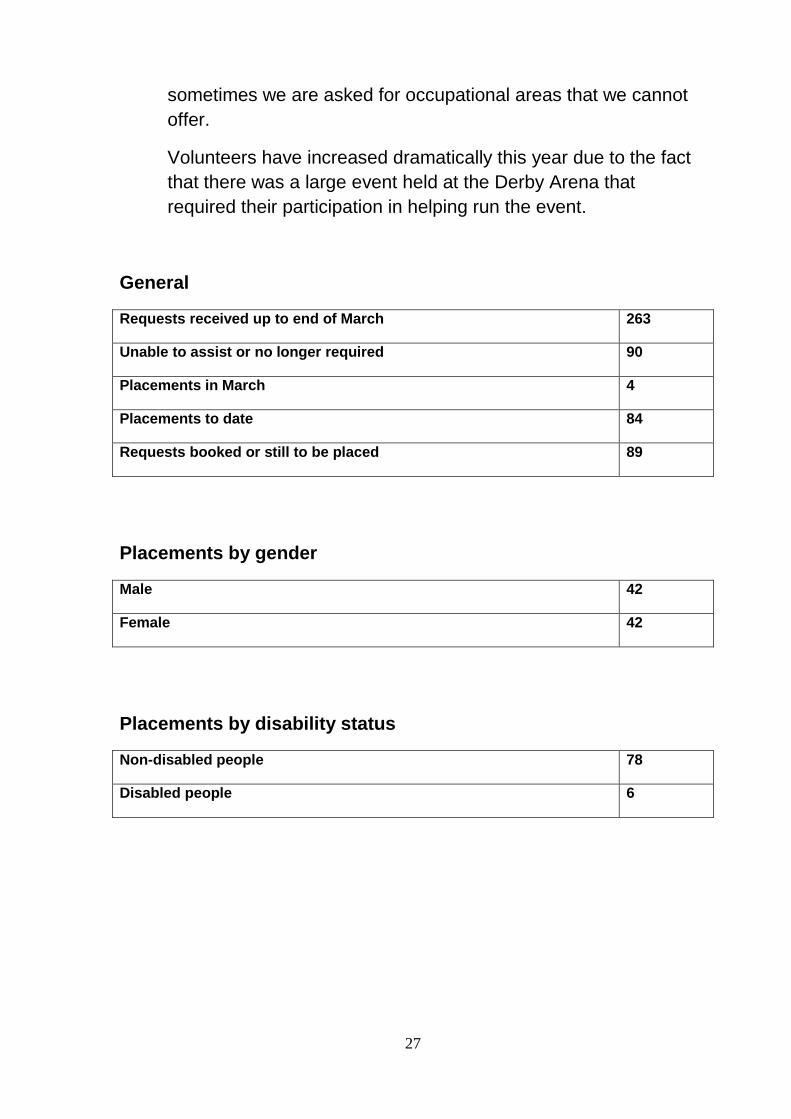
Work experience
4.5 Here are the figures of people who have taken part in our work
experience scheme from April 2015 to March 2016. Some are
for one week’s durations and others are for longer periods.
Unable to assist requests have increased due the fact that some
departments have now withdrawn their participation and
27
sometimes we are asked for occupational areas that we cannot
offer.
Volunteers have increased dramatically this year due to the fact
that there was a large event held at the Derby Arena that
required their participation in helping run the event.
General
Requests received up to end of March 263
Unable to assist or no longer required 90
Placements in March 4
Placements to date 84
Requests booked or still to be placed 89
Placements by gender
Male 42
Female 42
Placements by disability status
Non-disabled people 78
Disabled people 6
28
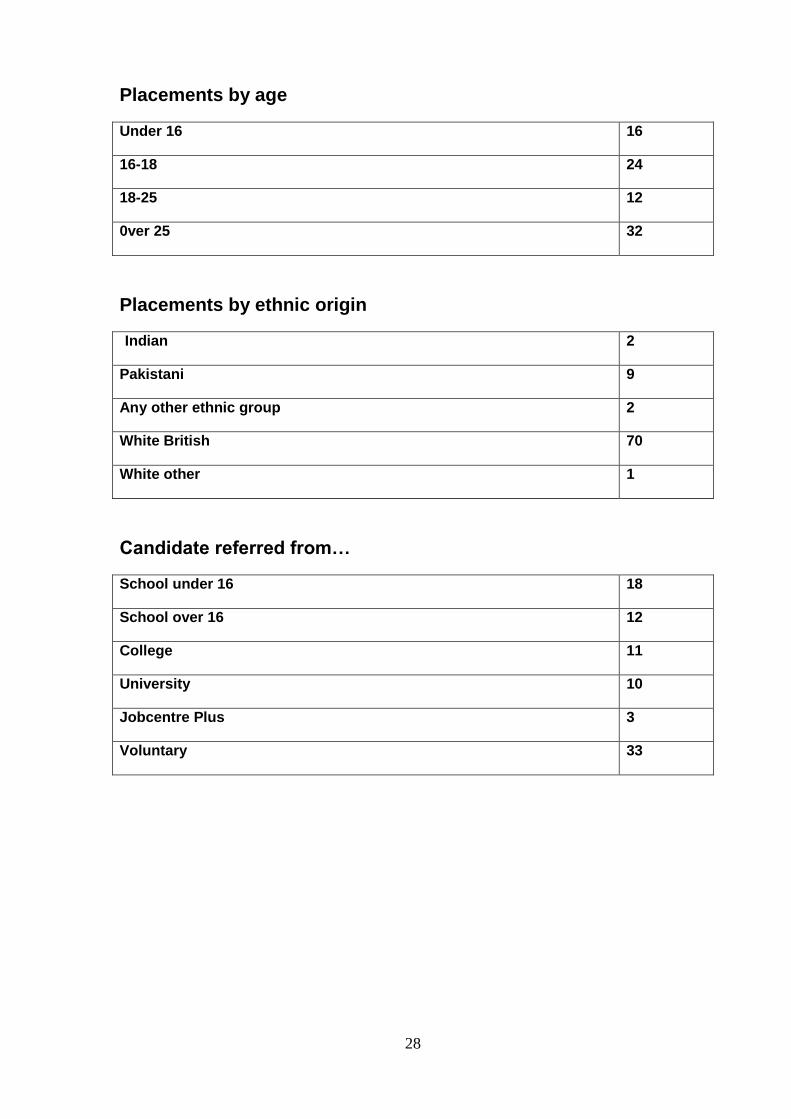
Placements by age
Under 16 16
16-18 24
18-25 12
0ver 25 32
Placements by ethnic origin
Indian 2
Pakistani 9
Any other ethnic group 2
White British 70
White other 1
Candidate referred from…
School under 16 18
School over 16 12
College 11
University 10
Jobcentre Plus 3
Voluntary 33
29
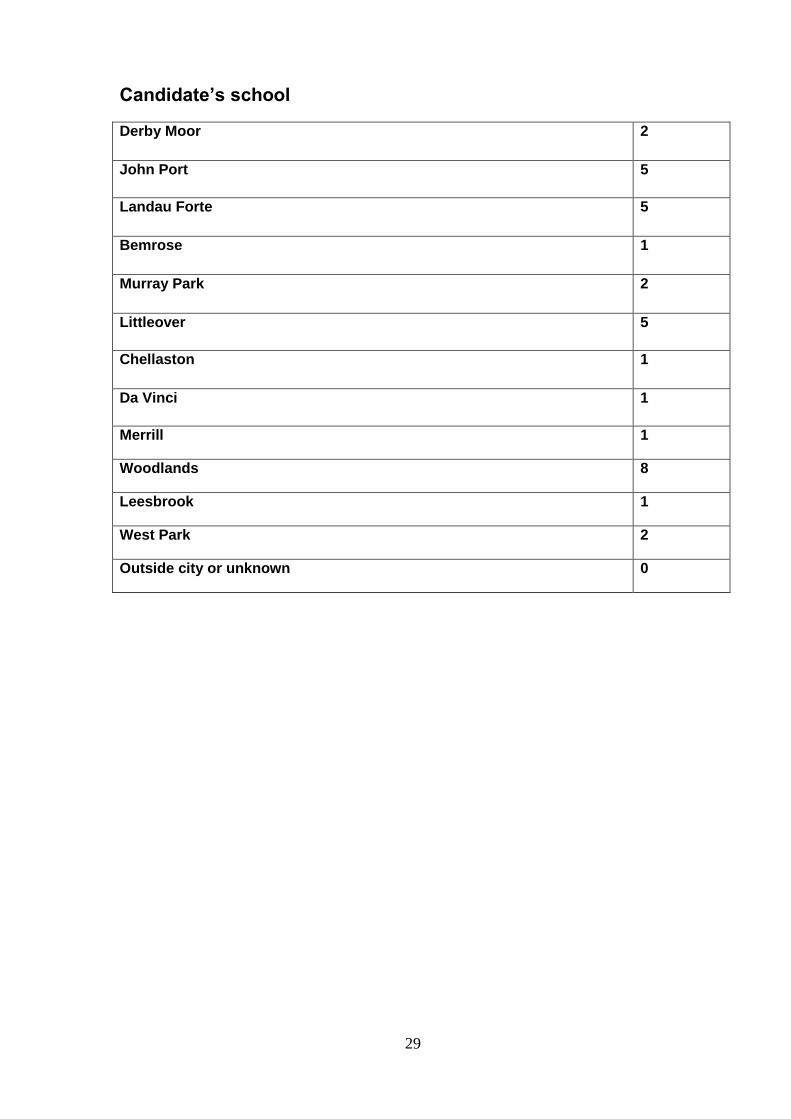
Candidate’s school
Derby Moor 2
John Port 5
Landau Forte 5
Bemrose 1
Murray Park 2
Littleover 5
Chellaston 1
Da Vinci 1
Merrill 1
Woodlands 8
Leesbrook 1
West Park 2
Outside city or unknown 0
30
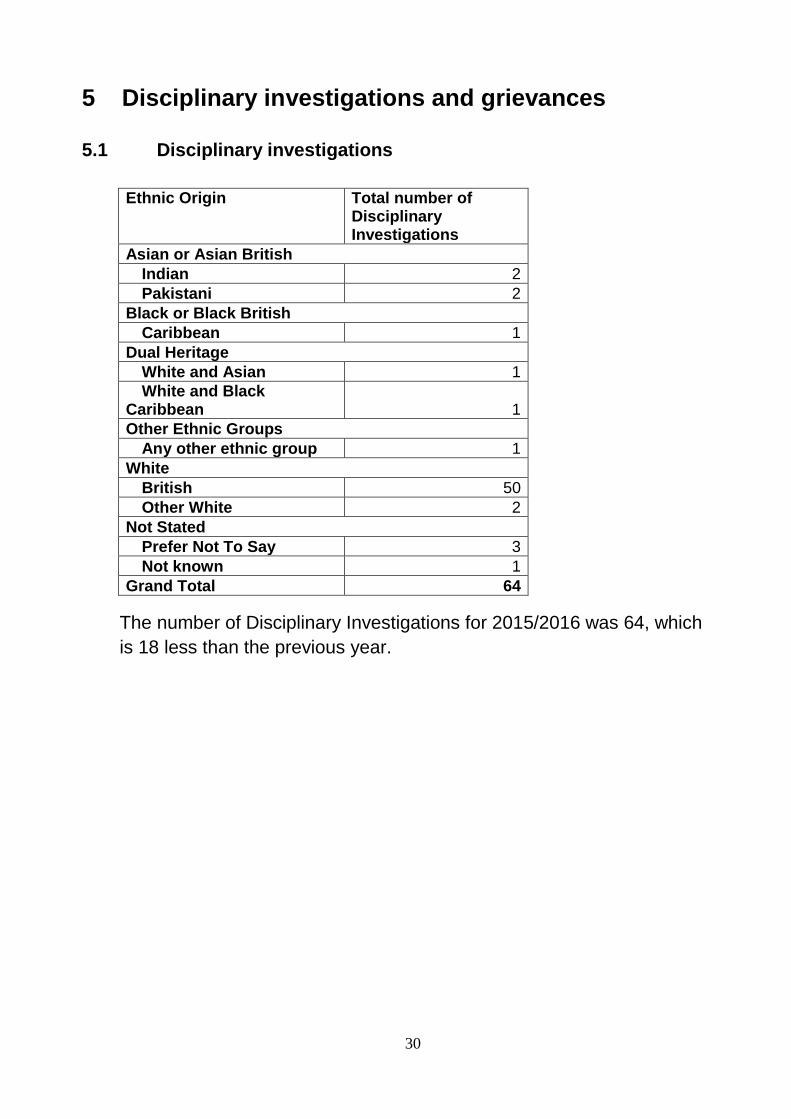
5 Disciplinary investigations and grievances 5.1 Disciplinary investigations
Ethnic Origin Total number of
Disciplinary Investigations
Asian or Asian British
Indian 2
Pakistani 2
Black or Black British
Caribbean 1
Dual Heritage
White and Asian 1
White and Black Caribbean 1
Other Ethnic Groups
Any other ethnic group 1
White
British 50
Other White 2
Not Stated
Prefer Not To Say 3
Not known 1
Grand Total 64
The number of Disciplinary Investigations for 2015/2016 was 64, which
is 18 less than the previous year.
31
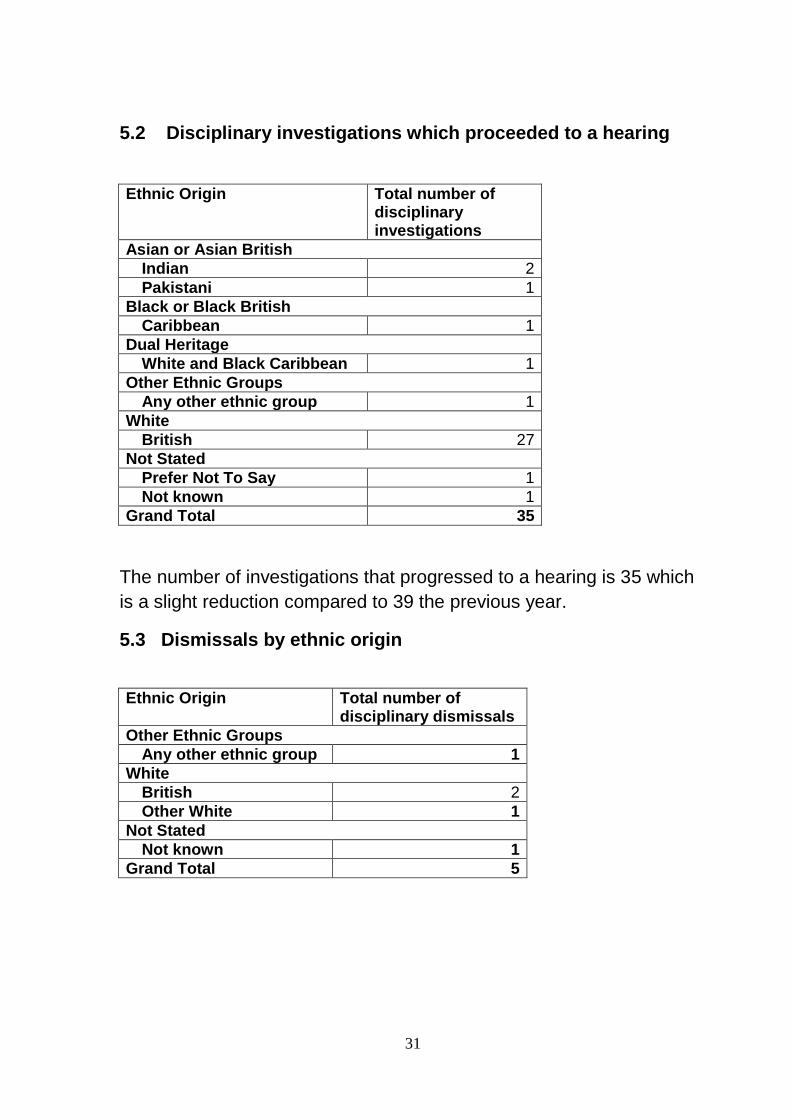
5.2 Disciplinary investigations which proceeded to a hearing
Ethnic Origin Total number of disciplinary investigations
Asian or Asian British
Indian 2
Pakistani 1
Black or Black British
Caribbean 1
Dual Heritage
White and Black Caribbean 1
Other Ethnic Groups
Any other ethnic group 1
White
British 27
Not Stated
Prefer Not To Say 1
Not known 1
Grand Total 35
The number of investigations that progressed to a hearing is 35 which
is a slight reduction compared to 39 the previous year.
5.3 Dismissals by ethnic origin
Ethnic Origin Total number of
disciplinary dismissals
Other Ethnic Groups
Any other ethnic group 1
White
British 2
Other White 1
Not Stated
Not known 1
Grand Total 5
32
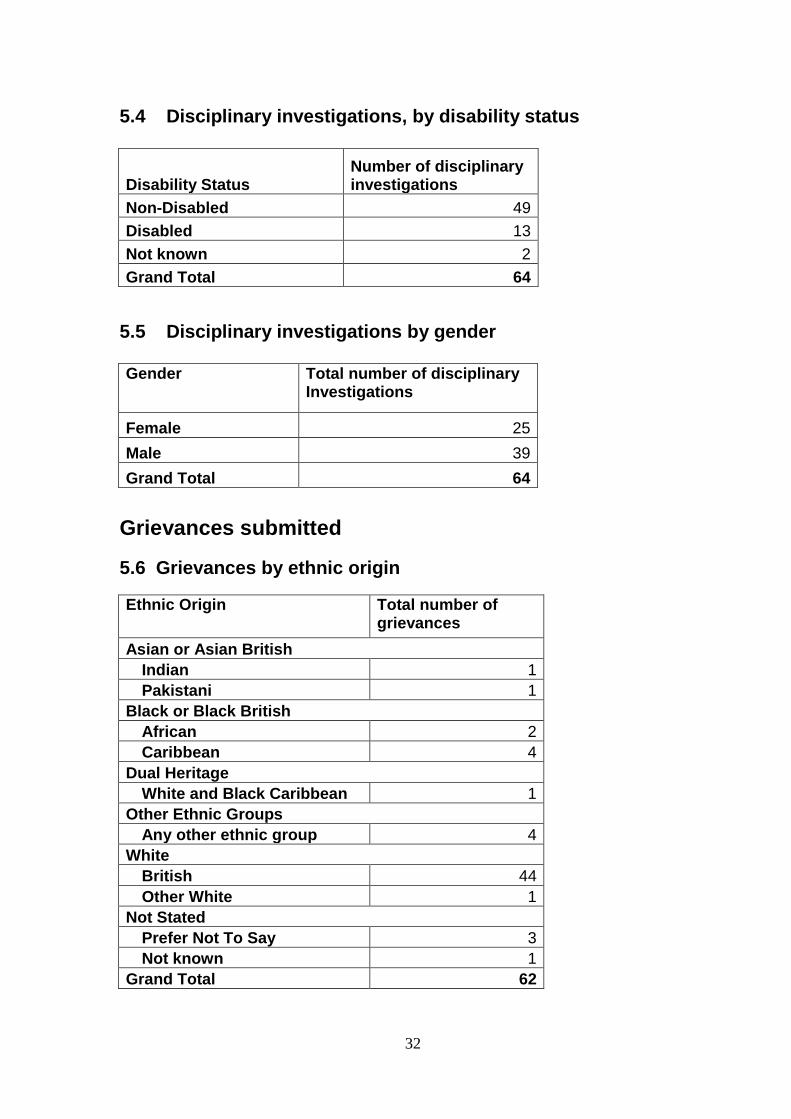
5.4 Disciplinary investigations, by disability status
Disability Status Number of disciplinary investigations
Non-Disabled 49
Disabled 13
Not known 2
Grand Total 64
5.5 Disciplinary investigations by gender Gender Total number of disciplinary
Investigations
Female 25
Male 39
Grand Total 64
Grievances submitted
5.6 Grievances by ethnic origin
Ethnic Origin Total number of grievances
Asian or Asian British
Indian 1
Pakistani 1
Black or Black British
African 2
Caribbean 4
Dual Heritage
White and Black Caribbean 1
Other Ethnic Groups
Any other ethnic group 4
White
British 44
Other White 1
Not Stated
Prefer Not To Say 3
Not known 1
Grand Total 62

33
There were 62 grievances, which is 50 less than the previous year
where we received a total of 112 grievances.
5.7 Number of grievances by disability Disability Status Total number of
Grievances
Non-disabled 38
Disabled 23
Not known 1
Grand Total 62
5.8 Number of grievances by gender Gender Total number of
Grievances
Female 31
Male 31
Grand Total 62
5.9 Grounds for grievances Grounds Total number of
Grievances
ET only 2
Bullying / Harassment 14
Disability 1
Multiple 5
Other 39
Pregnancy / Maternity 1
Grand Total 62
5.10 Information on bullying, harassment and discrimination The total number of bullying and harassment grievances for 2015/16 is 14, as against 29 for the previous year. The highest number of grievances was received against ‘Other’ compared to last year where ‘Multiple’ was the highest.
34
6 Monitoring and moving forward
We monitor our equality in employment statistics through our performance management tool – DORIS. Reports on DORIS are produced quarterly and presented to Strategic Directors at Chief Officer Group meetings. Our Equality and Diversity Strategy Group, our employee networks and Diversity Forum will be examining these statistics and adding any positive action initiatives to our plans for implementing our 2017/2020 equality objectives, which are in our latest Equality, Dignity and Respect Policy.
35