working for dignity - university of california, santa...
TRANSCRIPT

Working For Dignity The Santa Cruz County Low-Wage Worker Study
Steve McKay Associate Professor of Sociology
Director, Center for Labor Studies University of California, Santa Cruz
with Ruben Espinoza and Steven Carmona Mora
Final Report, Fall 2015

Acknowledgements
This report and the research on which it is based benefited greatly from the contributions of the 1,380 workers who participated in our survey and interviews.
As well as: Barbara Laurence, Catherine Ramirez, Shannon Gleeson, Gretchen Regenhardt, Mireya Gomez-Contreras, Ruben Espinoza, Alina Ivette Fernandez, Kati Barahona-Lopez, Steven Carmona Mora, Roxanna Utpadel, Tessa McWalters, Nora Doyle, Jessica Aguilar, Esteban Adame, Maria del Carmen Reyna, Denise Alejandre, Lizeth Vizcaya and the scores UCSC Sociology and Latin American and Latino Studies students that help make it possible.
The research was a collaboration between the UCSC Center for Labor Studies, the UCSC Chicano Latino Research Center, California Rural Legal Assistance, and the Community Action Board of Santa Cruz County Day Worker Center
Research funding was provided by the UCSC Center for Labor Studies, the UC Humanities Research Institute, and the UCSC Blum Center.

Introduction
About the Survey and Research Project
Santa Cruz and its Workers
Research Results
Conclusion and Policy Recommendations
1
4
6
9
25
Table of Contents

1
Alicia, Dish Washer
“My wage has not changed in eight years. Everything has remained the same since my first day [on the job]. We have problems with our paycheck because our hours are not always paid in full. And they take a long time to pay us when we bring it up [being shortchanged].”
Esperanza, Berry Picker
“When I lived in Mexico, I thought it would be different. I thought it would be one thing and when I got here [laughing] it was different... The work [here], it is too heavy (physically demanding)…. In strawberries, it is heavy work and they don’t pay you a lot to do what we do. … [People] don't think, when they are eating the vegetables, they don't think [about] all the things that people go through in the fields … it is real heavy work.”

Our national economy seems to be back on track. Six years into the recovery, the economy continues to grow: the stock market and profits have surpassed their pre-recession heights, businesses have steadily added new jobs, and unemployment has fallen to 5.3%. 1
Yet as the words of Alicia and Esperanza above reflect, the broad growth numbers mask the unevenness of the recovery and the fact that many people are still struggling. From 2007 to 2014, only those earning top wages saw some modest growth, while the wages for the bottom 80% were stagnant or actually fell. A key reason for wage stagnation is 2
that many of the new jobs added have been in low-wage industries, such as restaurants, retail sales, and temporary help. These lower-paying industries now employ 2.3 million more workers than at the start of the recession. Today, 24 million US workers – 3
or 35% of all hourly, non-self employed workers over 18 years of age - make less than $10.10 an hour. Low pay and poor working conditions also 4
disproportionately affect working women, immigrants and people of color. 5
California, despite the renewed tech boom and the rebound in housing prices, has not fared much better. Measured against the official federal poverty line, 16.6% of Californians are poor. But using the California Poverty Measure (CPM), a more comprehensive gauge that better accounts for the higher cost of living in California, 21.8% of Californians in 2012 were living in poverty. 6
Persistent poverty is directly connected to the growing low-wage economy. Over 4.7 million Californians, or one out of every three workers, is a low-wage worker earning less than $13.63 an hour. 7
Many of these workers are concentrated in a handful of industries: retail trade and the restaurant industry alone account for 28% of the state’s low-wage workers. Other industries also have high rates of low-wage workers include agriculture (where 71% of workers earn low-wages), restaurants (68%), home care and childcare services (52%), retail (50%) and accommodations (50%).
And as was true at the national level, certain groups of Californians are concentrated in low-wage work. In terms of race and ethnicity, more than half (56%) of low-wage workers are
Latino, compared to 39% of all workers. A larger percent of low-wage workers in California are also foreign born: 40% versus 33% for all workers. 8
Beyond Low Wages: Others aspects of “Bad” Jobs The troubles facing workers at the low-end of the labor market extend beyond wage issues. As numerous recent studies have shown, workers in low-wage industries face a daunting number of additional problems associated with “bad jobs” and precarious work. In addition to low wages and 9
wage theft, jobs that provide few or no benefits, are risky, insecure, have irregular hours and unpredictable schedules, provide few opportunities for advancement, and provide few ways to maintain control over one’s work would be considered by most workers as “bad” or “precarious” jobs. 10
Workers in low-wage industries and occupations are also much more likely experience these types violations or bad job characteristics. For example, a large-scale survey of workers in New York, Chicago and Los Angeles found that a large percentage of low-wage workers in a wide range of industries experienced some form of wage theft: 26% were paid below the minimum wage, 76% of those that worked overtime were not fully compensated, 69% did not receive legally mandated meal breaks, and 57% of workers did not receive proper paystub documentation. Additionally, 43% of workers that complained about working conditions or tried to form a union faced illegal employer retaliation, and half of all workers that were injured on the job faced illegal employer reactions (such as being fired, told not to file for workers’ compensation, or having immigration authorities called). 11
Our Study: Surveying Low-Wage Workers in Santa Cruz County
While the trends and data outlined above emerge from studies conducted at the national and state level, there is far less data on workers and working conditions in low-wage industries in Santa Cruz County. We do know that at the local level since 1990, there has been a decrease in the percentage of workers in agriculture and manufacturing and a corresponding increase in service industries such as retail sales, leisure and
2
Introduction

hospitality, education and government. But 12
beyond a general picture of the local economy and labor market, there is scant information documenting low-wage work and workers in Santa Cruz County. This report fills that gap by addressing the following questions: Who are the low-wage workers in our community? What industries do they work in and what type of work do they do? What are the working conditions that they face and how do they experience low-wage work? What labor issues (such as health and safety, or pay) and violations (such as discrimination and retaliation) do low-wage workers commonly encounter?
The first goal of this report is to establish baseline data on workers and working conditions in the low-wage sectors of Santa Cruz County (primarily Santa Cruz and Watsonville). Yet often lost in discussions of the economy are people’s own understandings of work. Thus a second major goal is to provide more than just a statistical portrait by using in-depth interviews to listen to oft-ignored voices of low-wage workers themselves. Work has long been a key source of human dignity, a central way we realize self-worth and respect. But low-wage jobs all too often leave workers struggling in poverty, exhausted or hurt, harassed and demeaned, and with few ways out or up. So is there still dignity in work? This study aims to comprehensively assess low-wage labor, mindful that the meaning of work cannot be divorced from those who perform it
What is “Low-wage” Work? Our definition of low-wage work takes into account both a worker’s wage as well as a worker’s local cost of living. Thus low wage work is defined as work that pays below the poverty line for a family of four if s/he works full time. Based on 13
the California Poverty Measure (CPM), which takes into account variation in the cost of living and, particularly, the high cost of housing in California, the poverty level for a family of 4 in Santa Cruz County in 2012 is a yearly income of $32,884. 14
This yearly income translates into an hourly rate of pay of $15.81 for a full-time, year-round worker. Therefore, for this study, the definition of a low-wage worker is someone who earns an hourly wage of less than $15.81.
3
There is often a dearth of data about low-wage work and workers in part because studying conditions is challenging. Employers may not be forthcoming about conditions, accessing private and/or informal workplaces can be difficult, and vulnerable workers may be hesitant to speak to researchers for fear of retaliation, due to language barriers, or because of their citizenship status. For these reasons, those working in low-wage jobs are often “invisible,” “hard-to-reach” and often under-counted. 15
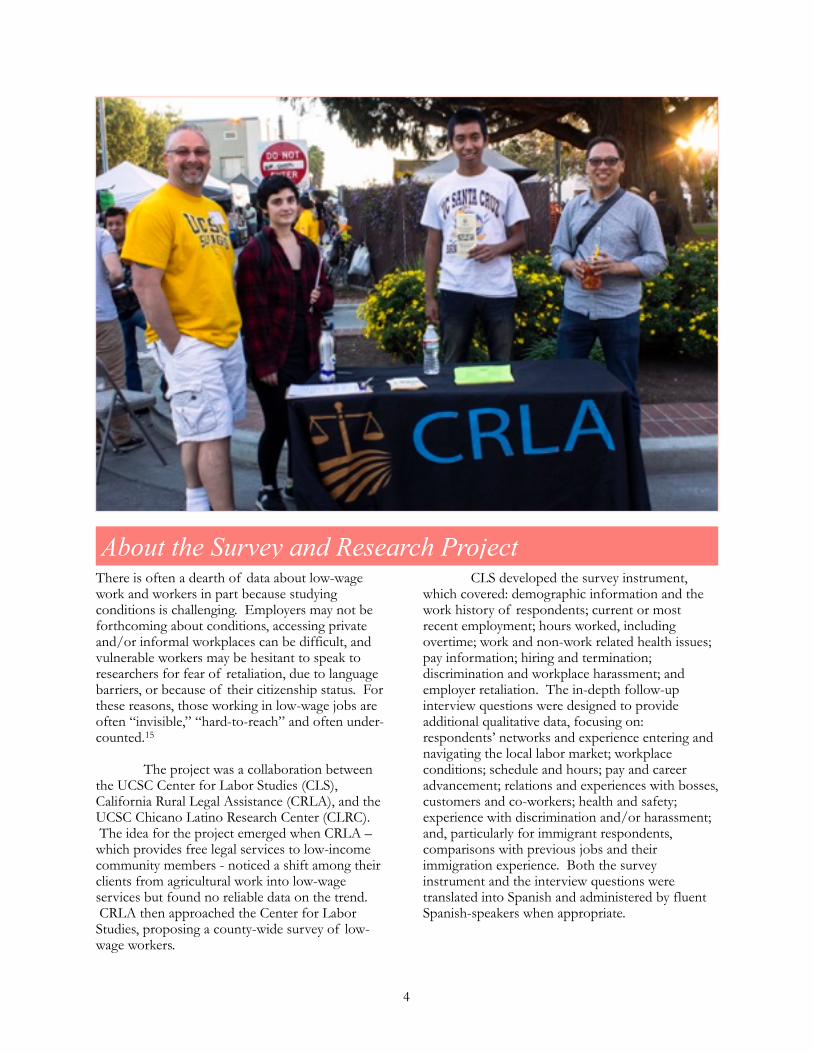
The project was a collaboration between the UCSC Center for Labor Studies (CLS), California Rural Legal Assistance (CRLA), and the UCSC Chicano Latino Research Center (CLRC). The idea for the project emerged when CRLA – which provides free legal services to low-income community members - noticed a shift among their clients from agricultural work into low-wage services but found no reliable data on the trend. CRLA then approached the Center for Labor Studies, proposing a county-wide survey of low-wage workers.
CLS developed the survey instrument, which covered: demographic information and the work history of respondents; current or most recent employment; hours worked, including overtime; work and non-work related health issues; pay information; hiring and termination; discrimination and workplace harassment; and employer retaliation. The in-depth follow-up interview questions were designed to provide additional qualitative data, focusing on: respondents’ networks and experience entering and navigating the local labor market; workplace conditions; schedule and hours; pay and career advancement; relations and experiences with bosses, customers and co-workers; health and safety; experience with discrimination and/or harassment; and, particularly for immigrant respondents, comparisons with previous jobs and their immigration experience. Both the survey instrument and the interview questions were translated into Spanish and administered by fluent Spanish-speakers when appropriate.
4
About the Survey and Research Project

In terms of the research team, CLS and the CLRC organized a research apprenticeship course and 3 subsequent field research courses to train students and involve them in every aspect of the project, from background research, to surveying and interviewing, to data management and analysis, to visual documentation, to website development. In all, over 100 undergraduates participated in the study from January 2014 through April 2015.
To conduct the survey and interviews, students spread out across Santa Cruz County, meeting face-to-face with respondents, going door-to-door, to public plazas and events, to bus stops and bus depots, to farmers markets and flea markets, in front on retail businesses and grocery stores, to laundromats, and around the university and community college campuses. Respondents were given $10 gift cards for their participation. Each survey lasted approximately 20 minutes and interviews lasted from 30 minutes to 1.5 hours. In all, students collected and analyzed 1,303 valid surveys and 76 in-depth interviews.
With a grant from the University of California Humanities Research Institute, the project was extended to include a “public humanities” component – the Working for Dignity website (www.workingfordignity.ucsc.edu) – that showcases the survey data, the narratives and images of low wage workers, and provides resources for community members, organizations, scholars and policymakers interested in the issues facing low wage worker.
5

The current population of Santa Cruz County stands at 271,857, with a total labor force of 145,300. As shown in Figure 3.1 below, Whites 16
represent the largest racial/ethnic group in the county, making up 58.3% of the total population, followed by Latinos at 32.9%. Asians account for 4.3%, multiracial individuals for 3.4%, and African Americans for 0.8%. 17
Based on 2013 data from the US Census Bureau, the median household income in Santa Cruz County is $ $68,438, well above the $60,190 for California and $52,250 for the US as a whole. 18
Yet while county residents appears relatively affluent in terms of median household income, these figures are tempered by the high cost of living and one of the least affordable housing markets in the country.
According to the US Commerce Department, Santa Cruz-Watsonville is the 5th most expensive metropolitan area for all goods and services in all of the United States – more expensive than even San Francisco-Oakland-Hayward or Washington DC. This ranking is 19
driven primarily by very high housing costs that continue to rise. In June 2015, the median sale price of a home in Santa Cruz was $725,000, compared to a national median price of $282,000. 20
In terms of rental housing, the fair market rent for
a 2-bedroom apartment in Santa Cruz is $1,750 per month. In order to makes such rent “affordable” (ie a household spends no more than 30% of its income on housing), the household gross income would need to be over $70,000. US 21
Department of Commerce has determined that Santa Cruz County rents are 71% higher than the national average. 22
When comparing local median household incomes and the costs of housing, Santa Cruz has earned the ignominious titles of the number one least affordable small metro area in the entire country, and the 3rd least affordable place overall. 23
In light of the high cost of living, it is instructive to examine in more depth the household and per capita incomes and poverty rates of county residents, particularly by ethnicity. While the median annual income in 2013 for White households was $73,281, Latino households earned only $50,003 annually. And while Whites have per capita annual income of $41,795, Latinos earn a mere $15,122 in annual per capita income. 24
Poverty levels are also similarly disproportionate. Based on federal poverty standards, 12.3% of White households fall below the poverty line, while 21.7% of Latino/as in the County are poor. In 25
large part because of the gross disparities in income and high housing costs, 67% of the County’s Latino
6
Santa Cruz and its Workers

population spends at least 30% of their income on housing, while “only” 41.4% of Whites do the same. 26
In terms of industries, jobs and labor in the county, previous research has shown that expanding tourism, leisure and hospitality industries, the proliferation of service jobs, manufacturing plant closings, and immigration policies have altered the economic and workforce landscape over the past few decades. Table 3.1 27
summarizes the top ten occupations, based on total employment, in the Santa Cruz-Watsonville Metropolitan Area, and their median wages. As can be seen, the top five occupations – cashiers, retail salespersons, combined food prep and serving, waiters and waitresses, and janitors and cleaners are all low-wage jobs, paying between $9.06 and $11.30 an hour. And looking forward, the California
Employment Development Department estimates that seven of the top ten occupations with the most projected job openings from 2012 to 2022 offer median wages that fall under our low-wage marker of $15.81/hour (Table 3.2). In fact, each of the top five occupations on the list (cashiers, retail salespersons, farm laborers and related, food preparation and serving workers, and waitresses and waiters), has a median hourly wage that is more than $4/hour less than our calculation of $15.81.
7
Whites 58.3%
Latinos 32.9%
Asians 4.3%
Multiracials 3.4%
African-Americans 0.8%
Other 0.3%
Figure 3.1: Ethnic and Racial Breakdown of Santa Cruz County

8
Occupational TitleJob Openings, 2012-
2022Median Hourly
Wage***Median Annual
Earnings***
Cashiers 1,710 $10.58 $22,001.00
Retail Salespersons 1,460 $11.30 $23,493.00
Farmworkers and Laborer Crop, Nursery, and Greenhouse 1,190 $9.09 $18,903.00
Combined Food Preperation and Serving Workers, including Fast Food 1,180 $9.16 $19,055.00
Waiters and Waitresses 1,110 $9.06 $18,833.00
Farmers, Ranchers, and Other Agricultural Managers 770 N/A N/A
Janitors and Cleaners, Except Maids and Housekeeping Cleaners 650 $10.57 $21,977.00
Registered Nurses 630 $45.63 $94,909.00
General and Operations Managers 600 $43.60 $90,669.00
Personal Care Aids 580 $11.46 $23,841.00
Occupational TitleEmployment
Estimates* Median Wage**
Cashiers 3,040 $11.00
Retail Salespersons 2,910 $12.25
Combined Food Preperation and Serving Workers, including Fast Food 2,410 $9.29
Waiters and Waitresses 1,960 $9.81
Janitors and Cleaners, Except Maids and Housekeeping Cleaners 1,720 $11.49
General and Operations Manager 1,630 $44.36
Office Clerks, General 1,590 $16.41
Registered Nurses 1,380 $66.58
Secretaries and Administrative Assistants, Except Legal, Medical 1,360 $17.51
Substitute Teachers 1,320 $13.92
Table 3.1: Top Ten Occupations 2014 based on total employment and median wage
Table 3.2: Occupational Projections 2012-2022 (California Employment Dev. Dept. 2015)
Source: Downloaded file “Occupations with the most jobs openings” 2012-2022 for Santa Cruz County. Retrieved 8/25/15 at http://www.labormarketinfo.edd.ca.gov/data/employment-projections.html. *** Based on 2014 first quarter wages.
Source: http://www.labormarketinfo.edd.ca.gov/data/oes-employment-and-wages.html. “Santa Cruz County” spreadsheet *As of May 2014. **Based on 2014 1st quarter wages*** Based on 2014 first quarter wages.

Our study included 1303 valid surveys and 76 in-depth interviews with workers from all over the county, but primarily from Santa Cruz and Watsonville. Table 4.1 summarizes the demographic background of the workers surveyed. Overall, our sample resembles the broader low-wage workforce found in other Californian and American cities. Our survey included slightly more women than men, more unmarried than married workers, and a large percentage of workers of color. Specifically, Latinos/Hispanics made up well over half our respondents, while only about a quarter of respondents were White (non-Hispanic). Our over-sampling of Latino is consistent with two previous studies of low-wage workers - one California study showing that 56% of the state’s low-wage workers are Latino even though they are only 39% of the total population in California, and one study of Los Angeles, Chicago, and New York that found 63% of low-wage workers surveyed in those cities were Latino. 28
We also found a significant percentage of immigrants and the foreign-born among the county’s low-wage workers. Specifically, while 44% said they were of US national origin, nearly half of all respondents are originally from Latin America - either naturalized citizens, or authorized or unauthorized migrants. Despite a majority of immigrants, more than half the workers declared
English as their preferred language, and one-third said they prefer Spanish.
While our sample resembles the broader low-wage workforce, it also contradicts some of the common stereotypes of low-wage workers. For example, low-wage workers are often portrayed as teenagers working part-time to earn a little extra pocket money for themselves. And our sample does have a broad age range, from 16 to 78. Yet the median age of workers we surveyed is 31, and the average age is 35. Our findings are thus consistent with previous representative studies of low-wage workers that similarly refute the teenage stereotype. Further, in our sample 62% said they 29
are the major wage-earner in their family, and nearly half (47%) reported that their wages are needed to support others.
Occupations In our sample of low-wage workers, many industries were represented, from restaurants, home health care, and retail stores, to agriculture, manufacturing and construction. The major occupations or types of jobs, shown below in Table 4.2, centered on providing services: such as prepping or serving food, caring for children, selling retail items, cleaning or landscaping, and various forms of farm labor (picking, packing, etc.). Over 10% of our sample was self-employed or an independent contractor.
9
Research Results

10
Table 4.1: Demographic of Surveyed WorkersAge Median 31
Average 35Percent of Workers
Gender Women 49Men 48.3
Race/Ethnicity Latino / Hispanic (non-White) 60White (non-Hispanic) 25.3Asian 3.2African-American 2.4Two or more races 5.8
National Origin United States 44.3Latin America 46.2Asia 0.9Europe 1.5
Preferred Language English 55.1Spanish 36.1
Marital Status Single 68.1Married/Engage 27.2
Major Wage Earner Major wage earner 62.1Not major wage earner 34.5
Supporting Others Supporting others 46.7Not supporting others 49.7
Table 4.2: Occupations of Surveyed WorkersPercent of Workers
Occupations Cooks, dishwashers, food preperation, and serving related occupations
24.1
Retail sales, cashiers, and related occupations 12.4Farmworkers, nursery, greenhouse related occupations
9.1
Personal care aids, child care workers, and related occupations
9
Janitor, maids, landscapes, and other building/grounds cleaning occupations
6.2
Teachers, trainers, teaching assistants, and library occupations
4.6
Construction laborers and construction related occupations
4.5
Production occupations 3.1Mechanics, installers, maintenance and repair occupations
2.2
Day laborers 2Self Employed 10.5Union Job 15.9

The occupations of our Santa Cruz County respondents were quite similar to those of the broader California low-wage workforce, with food prep, retail sales, personal care, and cleaning occupations also among the top 5 job categories. 30
Wages Given the distribution of industries and occupations we found, it is not surprising that our survey respondents earn quite low wages. As shown in Table 4.3, the median wage for all workers surveyed was $10.00 an hour, while the average wage for all workers was $12.37 an hour. It bears repeating that these wages are extremely low, especially in light of the very high cost of housing in Santa Cruz County.
We did not ask our respondents’ annual earnings, but a larger, statistically representative study of California’s low-wage workers found nearly the exact same median wage: $9.97 an hour. In that study, 31
the median annual earnings for low-wage workers was $15,300, largely because many did work full-time and/or year-round. Compared this median annual wage to the California Poverty Measure’s poverty threshold for Santa Cruz County, which is $32,882.
Our survey also revealed some variation in average wages, both across demographic groups, as well as across different occupations (Table 4.3 and Chart 4.1). In terms of demographic groups, the median hourly wage among Latino and White respondents were the same: $10.00 an hour. But Whites had an average wage about $4 higher than Latinos, demonstrating that in our survey, Whites had a broader range of wages (that is, more higher-wage
11
Right now things aren’t the greatest, you know, with my housing situation. But other than that I’ve always made a living out of it you know; been able to feed myself and kind of pretty much take care of myself. I used to be able to keep a roof over my head. But things like that have changed in Santa Cruz. So crazy, I can’t even believe it; it’s so sad, I mean this is my community. This is my home I can’t find a place to live here.
…it’s never been more expensive than it is right now. Like this year, I mean we just had to move out of our house because they sold the property we were living at. And I’d lived at that place over 5 years, and they sold it and the new landlords didn’t want to rent it, so we had to move.
…Right now I live all over town. I’m kind of homeless and I live in a motor home. I’m not homeless homeless, but I am homeless. The motor home is my home… But I have a lot of friends that do stay in stable residences… they let us park in the yard and that way we have a shower and stuff that we can use at the house. …. I have just become discouraged…I kind of just quit looking [for housing] for the time being. I mean, I’m thinking about leaving Santa Cruz. Trying to go find place else where we can afford to live.
Table 4.3: Wage Distribution of Surveyed Workers by Race/Ethnicity and GenderMedian Wage Average Wage
All Workers $10.00 $12.37Race/Ethnicity Latino / Hispanic (non-White) $10.00 $11.61
White (non-Hispanic) $10.00 $15.15Gender Men $10.00 $13.56
Women $9.50 $11.26
Denise, Barber

earners) than Latino respondents. In terms of gender, men surveyed earned a median hourly wage of $10.00 and an average hourly wage of $13.56. But women respondents earned a median hourly wage of $9.50 and an average wage of $11.29. Thus for respondents in the survey, women earned less overall and had a lower range of wages. Wage differentials by ethnicity and gender may be driven by the concentration of different groups of workers in different types of jobs. 32
From our survey, those working as janitors, landscapers and in other building and grounds cleaning and maintenance jobs (81 total respondents) had the highest median hourly wage of almost $14, and the highest average hourly wage of $14.50. This was followed by those in personal care and service (117 respondents), then workers in sales and related occupations (162 respondents), workers in food preparation and serving related occupations (257 respondents), and finally, farmworkers and those in nursery or greenhouse-related occupations (118 total respondents), who earned the least: a median and average hourly wage of only $9.00.
In our study, we indeed found variation in wages across the different low-wage occupations. These findings are detailed in Chart 4.1.
Workplace Violations In additions to questions about wages,
respondents were asked a variety of questions about their workplace and working conditions. One of the first things employees should know are their own rights and responsibilities at work. These details are usually laid out in an employee manual, and all California businesses are required to have at least certain basic workplace policies in writing. Yet when asked, only 63% of respondents (824 people) stated they received an employee manual, while 30% (or 388 respondents) noted they did not receive one, and 7% of respondents (91 people) did not answer the question.
12
Chart 4.1: Wage Distribution by Occupation

13
I am a citizen and was born in San Antonio, Texas. My parents were Braceros as well as my brothers. …I have lived here in Watsonville for about 50 years. …People would say that I would be dead by age 82 but now I am 82. … The work that I do, I don’t have to work, but I choose to. Adults today do not want to work in the fields but I still attempt to work there…. I am a happy worker - never did I feel tired as a 25-year experienced lettuce picker. I wake up looking for work at 5am…, never do I not look for work.... I still pick three or four cases of apples….
I used to be a great lettuce picker. Back in the day, packing cases were done in the dirt compared to now. I used to work for a Japanese owner, who owned a big field. … He treated us very well, he would bring us coffee, donuts, tacos and just about anything we wanted to eat. At that time, during the mid day, he would bring us lunch and two beers each. His main goal was to bring the production up. We would do about 30,000 cases in a day. That was basically the set goal for each group. We would bring him so much money on a daily basis. …[We would report for work] at 6am, but by 1pm we would be cashing in $200. So in 7 hours we would make $200.
… I was asked to go to high school in order to get training [to become a supervisor]. But in any case, I never did because I prefer fieldwork. I would go back then to deposit my check and the secretary would be surprised at how big my check was. The secretary would say that she made $300 dollars while I making about $900 dollars.
… Recently I have had a problem with an apple-picking job. The apple was a bit too small and I wanted to wipe them down my own way. The supervisor then told me to do it his way or else I would not be asked to come back. I told him, ‘fine. I do not want to come back anymore’, and I threw the crate at him. I: Did he at least pay you for the job that you did?
Yes, but he was paying us $24 dollars for a van filled of apples. Each van took me like 3 hours to fill up. ... I used to come at 6am and stay till sundown, working on 4-5 vans. Doing this would not even give me $100 dollars. …As of right now to make $100 you need to put into 10 hours of work. What are you going to be doing with 8 hours of work, make $80 dollars?
So currently I am staying at the mission, even after I have worked for over 30 years. I also go to a church where I was told that God will eventually give to those who have been good and for those who haven’t, then, I do not know what will happen.”
Alfonso, Farmworker
Wage Theft and Rest Break Violations Wage theft occurs when workers do not
receive their legally or contractually promised wages. Wage theft includes not paying for overtime, not paying the minimum wage, not paying for all hours worked, not allowing workers to take meal or rest breaks, and stealing tips. A summary of wage theft violations for non-agricultural workers in our survey is reported in Table 4.4. For non-agricultural work, being paid “overtime” or at 1.5 times the usual hourly rate is mandatory after 8 hours in a single day and/or after 40 hours of work within a single week.
Agricultural workers are subject to different overtime laws – they are legally entitled to overtime pay only after working 10 hours in a single day, or after 60 hours in one week. Because of the wording of the survey, we can only report non-agricultural workers’ responses.
For those respondents not in agriculture, 38.3% stated they worked more than 8 hours a day or more than 40 hours a week. Of those that did, 38% stated that they experienced some form of overtime pay violation or wage theft.
Workers in the non-agricultural sector are also mandated to receive breaks during their working shifts - including paid uninterrupted 10 minute breaks every 4 hours worked and an unpaid, uninterrupted 30 minute meal break when working at least a 5 hour shift. Yet according to survey respondents, 50% of non-agricultural workers stated they experienced some form of break violation - either not receiving their mandated break, not being paid for their break, or having their breaks interrupted.
14
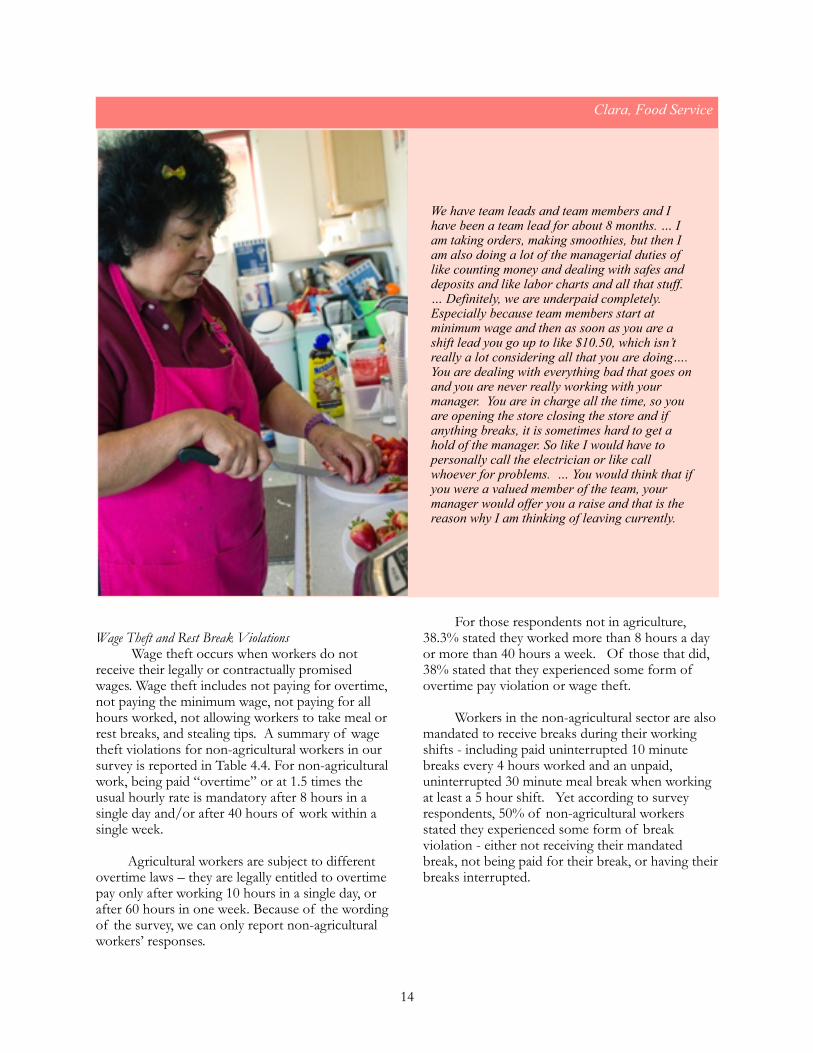
We have team leads and team members and I have been a team lead for about 8 months. … I am taking orders, making smoothies, but then I am also doing a lot of the managerial duties of like counting money and dealing with safes and deposits and like labor charts and all that stuff. … Definitely, we are underpaid completely. Especially because team members start at minimum wage and then as soon as you are a shift lead you go up to like $10.50, which isn’t really a lot considering all that you are doing…. You are dealing with everything bad that goes on and you are never really working with your manager. You are in charge all the time, so you are opening the store closing the store and if anything breaks, it is sometimes hard to get a hold of the manager. So like I would have to personally call the electrician or like call whoever for problems. … You would think that if you were a valued member of the team, your manager would offer you a raise and that is the reason why I am thinking of leaving currently.
Clara, Food Service

15
Table 4.4: Wage Theft Violations of Surveyed, Non-ag WorkersPercent of workers
Wage Theft Rest Break Non-Agricultural WorkersAll non-Agricultural respondents 38 50Race/Ethnicity Latino 47 47
White 50 54African-Americans 52 56Asians 39 50
Gender Men 44 47Women 51 53
Percent of workersAll workersWorked more than 8 hours a day or 40 hours a week 38.3Worked in a place where tips are left 18
Employer kept tips 14Provided pay stubs (paper or online) 60.1
Marcos, Grocery Store Cashier
I’ve notice I’ve been working more than 8 hours, and I’ve already surpassed my 40 hours of work and the owner wants me to stay longer. But I tell him I have stuff to do, like go to the bank, run errands. …The owner is not specific about how many hours he wants me to work. I complete my 8 hours and he still wants me to stay 15 or 30 minutes and he does not want to pay me for the extra time….I work from 6am through 2pm…. I work Monday-Friday, but he wants me to come in Saturday’s. If I have to work more than 8 hours, I consider that overtime. I think he wants us to stay overtime without paying us. …
I worked three extra hours this week and I was trying to speak with him about my concerns. However, he left the store and never came back. … so if next time he asks me to stay 8, 9, or 10 hours and right now we are having issues with him paying three hours he will definitely not pay me for working 10 extra hours. I need the job, but I don't want him to take advantage of me.…If I receive a call from my former employer tomorrow, I am leaving.

Overtime and break violations appear to be widespread across both gender and ethnicity/race. Of those that worked overtime, about 47% of Latinos stated they experienced overtime pay violations, while 50% of Whites (non-Hispanics), 52% of African-Americans, and 39% of Asians that worked overtime stated they experienced wage theft. In terms of gender, 44% of men and 51% of women that worked overtime experienced overtime pay violations.
Turning to break violations, 54% of Whites (non-Hispanics), 47% of Latinos, 56% of African-Americans, and 50% of Asians experienced some form of break violation at work. In terms of gender, 47% of men and 53% of women experienced some form of break violation.
Overtime and break violations were also consistent across the different occupations, as shown in Chart 4.2 and Chart 4.3. Food prep and serving, building and grounds cleaning/maintenance, and retail sales occupations all showed consistent and relatively high rates of overtime and break violations. Only personal care and related service showed slightly lower rates of overtime violations but slightly higher rates of break violations. Those working as farm-, nursery- and/or greenhouse-workers also reported working over 8 hours in a day, over 40 hours in a week, and/or not receiving breaks as outlined above. However, since the overtime and rest break laws for agricultural workers differ, we have not counted them in our wage theft calculations.
Other Forms of Wage Theft Two additional types of wage theft were also investigated: illegal appropriation of tipped income and non-provision of pay stubs. In terms of tips: 18% of respondents stated they worked in a place where customers leave tips.
Of those in tipped workplaces, 14% responded that their employers engaged in “tip stealing” or keeping some portion of workers’ tips, which is illegal. In terms of paystubs, employers are required by law to provide documentation of earnings and deductions. However, only 60% of our respondents stated they were provided with a legally-mandated pay stub, either a paper copy or online. Lack of pay documentation makes if much more difficult for employees to know if they are being underpaid and also to prove their claims of wage theft or underpayment should they choose to do so.
16

17
Chart 4.2: Overtime Violations by Occupations
Chart 4.3: Break Violations by Occupations

Health and Safety Issues Everyone has the right to work in a safe and healthy place of employment and to return home uninjured at the end of each workday. Every worker also has the right to file a complaint and request an inspection of his or her workplace if conditions there are unsafe or unhealthy. Every worker has the right to refuse to perform work that would violate any occupational safety or health standard. Finally, no worker may be fired or punished in any way for filing a complaint about unsafe or unhealthful working conditions.
Despite these lawful protections, many low-wage workers surveyed faced the consequences of unhealthy and unsafe workplaces, and were not always comfortable in asserting their rights. Our finding are summarized in Table 4.5.
In terms of injuries on the job, the experience was quite common and often serious. Twenty-two percent of respondents noted that they had suffered injuries while working and 44% of those injured said it was due to unsafe or unhealthy working conditions. Of those injured, 69% reported the injury and 62% received treatment.
Another common health issue was working while sick. At the time of the survey, California’s paid sick leave law was not yet in effect. Yet even today, when eligible workers can legally earn 3 days of paid sick leave per year, working while sick is likely to remain common, since many workers cannot afford to take time off or might be pressured to show up despite their illness. In our sample, over 61% of respondents said they had worked while sick and nearly 18% of those said their supervisor forced them to work even though they were sick. Unfortunately, for many low-wage workers, they are forced to make a choice between working and protecting their health. Overall, nearly one out of every five workers surveyed stated they asked to leave their job because of a serious health condition.
18
Table 4.5: Health Issues and Injury of Surveyed WorkersPercent of workers
Injured on the job 22.3Injury was due to unsafe or unhealthy working conditions 44.1Reported the injury 68.6Received treatment 62.1Returned to work 80.7Faced retaliation 6.2
Worked while sick 61.5Supervisor forced them to work 17.8
Asked for a maternity leave 9.4Request was granted 94.3Treated badly upon return 11.4
Requested leave from work due to serious health condition 19.8

Retaliation, Harassment and Discrimination
California law protects everyone from employer retaliation: this means a boss or supervisor cannot punish or fire workers for taking steps to enforce their labor rights, such as reporting a labor law violation or a workplace safety hazard.
Similarly, it illegal to be discriminated against or harassed based on your actual or perceived: ancestry; age (40 and above); color; disability (physical and mental); genetic information; gender, gender identity, and gender expression; marital status; medical condition; national origin; race; religion; sex; or sexual orientation. The laws apply to all types of work situations, including hiring, firing, promotions, harassment, training, wages, and benefits.
19
[Once] I had an accident… We would have a lot of crates and I was asked to rope them down. I was asked to put the tablets in order so that we could rope the crates down so that we could leave. As I was roping them down, 300 crates came towering over me. I was stuck in a pile of 300 crates. After coming out I realized I broke my spine. … It happened at night while it was raining. I was asked to strap them down, turn them in and come back for more. When that accident happened they put in another person because I just couldn’t do it anymore. My pelvis was broken, thankfully the insurance covered it and I continued to work. This accident left me 3 months without work.
Alfonso, Farmworker
When I was [working construction], that was before Obamacare and there wasn’t like mandated health insurance. Nobody there had like work health insurance. I guess you could file a workman’s comp claim, but that was pretty frowned upon. I never saw anybody do that.
I: Have you ever been hurt at your job or experienced any injuries?
Actually I hurt my back; basically I screwed myself up for life lifting concrete. This was at a job doing general construction and I told my employer - there was somebody there that he wanted to impress - I told him, ‘dude I can’t keep lifting this stuff my back hurts today.’ And he was like, ‘no I need you to move this stuff’, and I moved it anyway. Then that night, … I used to work out crazy all the time, I was like oh its back time …and I went and I did back … I woke up and I couldn’t walk for a week, I woke up the next day basically paralyzed. … I took a week off work. I basically laid on the floor for a week straight. …And my back has been completely screwed since then. I hurt it again at [another construction job]. And the second time I did it, what the heck, I think I took a couple days off work but I couldn’t afford it, I couldn’t afford it. So I just started eating mass quantities of ibuprofen. I ate so many ibuprofen I gave myself an ulcer. I was popping like 16 to 20 of them a day. Just eating them like tic-tacs. I didn’t file workman’s comp. I didn’t do all that stuff. Yeah and just worked anyway. That was an awful time.
William, former Construction Worker

Despite these legal protections, low-wage workers often face issues with retaliation, harassment and/or discrimination. Table 4.6 summarizes the responses from our survey. A tendency that is apparent in our results was the relatively low percentages of respondents that formally complained about workplace violations. However, this does not necessarily mean that such violations were not experienced.
Retaliation Indeed, in our longer, in-depth interviews, many stories of retaliation, harassment and discrimination were shared. However, many workers also noted that they often did not report such violations, in part because they feared some form of retaliation.
In our survey, while we found some rather low rates of formal complaints, workers who did complain often felt they were punished for raising a workplace violation issues. For example, while about 14% of survey respondents said they had complained about wage and hour violations, 20% of those said they were punished for speaking out. Similarly, 23% of
20
Table 4.6: Retaliation, Harassment, and DiscriminationPercent of Workers
Complained about wage and hour violation 13.7Punished 19.6
Complained about or opposed discrimination or harassment 8.1Punished 22.6
Complained about unsafe or unhealthy working conditions 12.7Punished 13.9
Complained about or opposed illegal conduct 3.9Punished 21.6
Applied for worker's compensation 6.8Punished 3.4
Experienced harassment at work 9.1From a co-worker 50.4
Thought they were treated differently from others 21.9
You get scared telling others what is going on and sometimes they don't even listen to you. Or if you fall or something like that, they won’t... well because one time, I injured myself at work and they told me ‘Oh you can’t file a report because you will lose the day [a day’s wages].’ That is what the supervisor told me. It was because it was really muddy and I fell and I asked him if I could file a report and he said ‘Oh no because you will lose the day.’ but I told him ‘Why would I lose the day?’… Everyone knows they are supposed to file a report but sometimes they don't want to do it…. There have been some who have [filed a report], but most of the time they are not paid attention to. Also, some do not tell the boss because they do not want to lose their job or something else could happen…. you never know whom you can talk to or be around because you don’t know if they are siding with the boss.
Esperanza, Berry Picker

those that raised their voice about discrimination or harassment faced punishment, while 22% of those that complained of “illegal conduct” by their employers said they raced direct retaliation. Finally, as noted in Table 4.5, employers might retaliate for simply claiming lawful time off. Of the 9.4% of respondents that stated they asked for a leave of absence from their job because they were pregnant, 94% noted that their request was granted, yet 11.4% nonetheless responded that their employer treated them badly when they returned to work.
Discrimination
In terms of discrimination, a fairly large percentage of our respondents, 22%, believed they were treated differently from other workers. But the bases for their “extraordinary” treatment were quite varied, as summarized in Chart 4.4.
The most common factor cited for perceived discriminatory treatment was a workers’ race/ethnicity, but others factors such as national origin, age, gender identity, pregnancy, and disability were also cited. And while discrimination seems quite common, it can be quite complex and nuanced, leaving it sometimes difficult for workers to pinpoint illegal discriminatory behavior. This may be why some 30% of respondents noted that the discriminatory treatment they experienced was “outside the categories” that were supplied.
Below are just a few of the stories of discrimination that workers related to us in our in-depth interviews.
Harassment About 9% of our survey respondents told us they were harassed at work and half of those said they experienced this harassment from a co-worker.
21
Chart 4.4: Of the 21.9% of workers that said that they were treated differently from others

22
Marcos, Dishwasher
[I’ve worked in Santa Cruz] eight years. I work in a restaurant and I work as a dishwasher… The majority [who work here] are women, eh Americans, Latinos, and Mexicans work here. …But since they are students and we only work in the back, I feel that the work is much harder in the back than it is for the students.
I: Have you ever complained about the different treatment between you and the students? No. Eh, I don’t talk to the boss, only with the manager. Well she is… my English is not that good, so I don’t know how to reach out to her, like explain what is going on.I: Do you have any problems getting paid for extra hours?Ah yes, because sometime they do not appear in my check…. We talk to the manager, [but] they take a long time [to fix it].
I: Have you ever experienced any form of discrimination?
Look at me. Definitely…. I’m a girl, I’m gay, I have a girlfriend so I have a backwards hat. You know, the way I dress is really hard right now. I… have these tattoos all over my hands, my arms, my neck, everything. But even before that it was really hard. But now it’s impossible to get a job…. Impossible. I have to go through temp agencies that are janitor shit jobs … that you’re in the back somewhere, nobody sees you. That’s why I stick with landscaping because nobody cares and they’re like, ‘oh she’s probably a hard worker, looks like a dude.’… Yeah I won’t get a job at Safeway, I won’t get a job at [the Mall] anymore. Anywhere where I have to be with people it’s not going to work. They are scared of me. It’s stupid….I’m a good person. I’m so nice to everybody. ….
[T]he worst experience was at [the Mall] and [my boss] fired me for no reason, literally. Just discrimination, I think. If you have tattoos. … Unless I’m at a smoke shop or some weird hippie shop or some herb shop, I can’t get a job there, you know what I mean?... And I’m a hard worker dude!...
My girlfriend is gorgeous. You see her, she can get a job anywhere. Like, I used her Google account one time to go on Craigslist. They thought it was her showing up ‘cause it shows her picture on the Google account. I showed up and they are like ‘nope.’ It was at a fucking donut shop dude! And they are like nope get out. What they thought, it was her coming. So they were, like, ‘yeah you know come down today.’ Yeah that was messed up.
Vivian, Landscaping

Workers’ Stories
In this final section, we want to go beyond the statistics and our survey numbers to share some of the stories that workers shared with us. In studies of work and workplace violation, it is important not to lose sight of workers themselves – their personal histories, their immigration journeys, and the meanings they attach to and derive from work. We share these often heart-wrenching excerpts to provide a glimpse of the many interconnected issues – from long- term poverty, to low-wages, to injuries, to housing, to documentation status – that many of our community members face.
23
[I’ve worked in Watsonville] since 1978 ….I pick blueberries and raspberries in the fields . …[Before, I was] in the fields working with strawberry’s. I was there for a long time, 25 years. It is very different in my home country, we earn less to work rigorous job tasks. They do not pay us over-time, they can make us work 12-13 hours and they’ll pay us the same. It is very difficult over there. There are places beginning to pay, but rarely. Here we are protected and we are offered health insurance, the country helps us although we are not U.S. born and I have rights. …
I arrived here illegally, although one of my brothers was here, I came over here with a Coyote [human smuggler], but back then it was much easier; it was difficult when I arrived at this town though. The town did not look anything how it looks now, there was only a few houses, and lots of fields. It was difficult because immigration officers were everywhere, and in the fields. Everyday they would run after us. We had to be careful when we would see immigration vans. We would run from them. During the weekends we had to wait till after 12pm to go out because immigration officers would roam around in the morning ‘til Sunday. After 12pm on Sunday’s we would go out and buy groceries, we would buy cheap groceries, and we would always eat eggs.
I still do not understand English, just a little [giggles] I never tried learning, and maybe it is not too late to learn. Maybe that is why I am still doing field work because I have not tried learning English in order to find another job. I know little English because back then, I worked with Chinese and White employers. Now-a-days there are companies run by Latinos. I arrive here when I was very young, a teacher next door to where we lived would always encourage us to return to school so we could learn English or about available occupations such becoming a carpenter, plumber or electrician, but we would be too tired from work [giggles]. They were excuses though, we were young so there was no reason for us to be tired. I am old, and I still do not become as tired, those were excuses. When we arrived to this country we come with a mentality of making money we do not have time to think about our education. I wanted to make money and help my family, well back then I wanted to help my parents. I soon was married, so it was time to help my wife and kids. Maybe later I’ll start adult school.
Mario, Berry Picker

24
[I’ve lived] in Watsonville for 25 years. I came with my parents… in 1975. [Back then], it was a lot poverty, four of us slept in a van and well, we didn’t have anything. We came here without papers and well, our bosses would work us however they wanted, and if they wanted they would pay us. And to take a shower, just imagine, using a bucket of water. It was terrible poverty. But now we are headed to the top. Before they wouldn’t even give us disability checks and unemployment checks or food, back then I was very poor.
[Now]… I have some [papers]…. My parents sent the visa and I just made the call, around 1980 or 1981…. Now I get an unemployment check and you can say that immigration cannot take you anymore. You work more comfortably. Otherwise, you would get scared if you would see a car, you would want to run and now I don’t have to run, haha. The one who does not owe anything, does not fear anything.
[In my last job], I picked up and took out boxes and also filled them up with fruit. They would pay me 4.50 per hour and then $1 per box. In one hour we can do 5 boxes so I would get paid $9.50 per hour…if you do 10 boxes in one hour they would pay you $14.50 in one hour. Sometimes there are days in which the strawberries are really nice. And there are days when they are not. If the strawberries are big and I have the energy to work I could do about 10 boxes in one day. … We all got along, men and women, we all talked normal. They are all [the boss’] family members and I am also like part of the family, we all behaved well.
Right now I am sick from one of my legs. It has been six months… I can’t work in anything. I can only walk a little bit and get on my bike….But my leg did not get hurt [at work], it happened where I live because I live in a f**** van. I don’t even have a place to live in and that is where I burned myself. The company didn’t have anything to do with this; I burned myself outside the workplace. I came out of work and I was cooking food and the oil fell on my leg. But I still worked for three days after I burned myself. Even with my foot all burned I still worked…. I can’t work anymore, but I can’t blame the company because the boss never disrespected me. ..
…I recently washed my leg after three months and the doctors did not cut off my leg because God is big. The leg was all purple. Look, this toe is basically dead. They were going to cut off my leg but God is big and that did not happen. …This accident caused me many tears, I cried a lot. And I would say if they cut off my leg, they should just take my life away…why would I want to be alive without a leg?
[M]any years ago [I worked] in this company named [x]. I basically finished all my years of youth there, I worked there for 15 years and then they fired me. That is the only job I have ever been fired from and they fired me because they said I didn’t know how to pack the right way. And not only me, they fired about 20 people.
The fields kill you and you don’t make any money. Right now I am still waiting to receive some f**** food stamps to be able to survive…. I spent my entire life killing myself working in the fields.
Benjamin, Former Strawberry Packer

As this report shows, the conditions of low-wage work pose a daunting challenge to both workers and our wider community. We found a broad range of serious workplace violations across different industries and occupations – from wage theft, to unhealthy and dangerous conditions, to discrimination, to retaliation for workers trying to speak up for their rights. We also found that those we surveyed belied the stereotypes often associated with low-wage workers: rather than predominantly teenagers earning pocket money, those laboring in low-wage jobs are older, nearly half are supporting others and nearly 2/3rds are the major income earners in their families. Finally, it was also painfully clear that despite economic recovery along
some measures in California, a large swath of county and state workers continue to struggle in poverty. Indeed, the recovery has in many ways exacerbated inequality and the difficulties faced by low-wage workers, as housing costs and rent have risen dramatically.
Our findings echo the results of previous studies, highlighting some significant changes to the structure our economy that have led to rising social and economic inequality and more “bad jobs” – those with low and stagnant wages, insecure contracts, poor working conditions, and little respect for workers’ rights. 33
25
Conclusion and Policy Recommendations

Recommendations
Given the study’s findings, the key goals of any course of action should be to raise the quality of jobs, to eliminate “bad” or precarious jobs and working conditions, and make sure that employment will allow workers to achieve at least a decent minimum living standard. While there are many factors that influence job quality and workers’ lives, achieving these primary goals to improve worker well-being and dignity would require interventions in 3 core area: raising wages, ensuring better workplace protection, and bolstering worker education, voice and bargaining power.
“California is real expensive. Not even $10 [minimum wage] will be enough when it kicks in. My monthly rent is
$2150.” – Lupe, housekeeper in Santa Cruz
One of the most immediate ways to improve workers’ well-being is to raise their incomes, which generally means increasing their wages. However, the real value of the minimum wage at the federal level has stagnated, which has been a key reasons behind growing inequality, especially between the lowest income earners and middle-income earners. Even in California, where 34
the minimum wage has recently been increased, low-wage workers still struggle with much higher costs of housing and living.
Raising the minimum wage, whether at the local, state or national level has been a prominent topic of policy debate and as well an emerging social movement. With inaction at the federal level, some 23 cities or localities, both large and small – including Los Angeles, Seattle, San Francisco, San Jose, Richmond (CA), Santa Fe (NM), Washington DC, Louisville (KY), and Montgomery County (MD) have enacted minimum wages ranging from $8.75/hr to $16/hr. While the move to raise local 35
minimum wages has accelerated since 2013, some locations enacted their substantial increases as early as 2003, providing important case studies for the impacts of raising minimum wages on workers, their families, their broader communities and local businesses.
Indeed, while there remains much public and media debate about the benefits and costs of raising the minimum wage, scholars have pointed
out that, “a broad consensus in the economic research literature agrees that minimum wage laws raise pay for workers on the bottom rungs of the labor market” and find that those affected most are largely adults, women and people of color. Research has also shown that minimum wage increases help reduce family poverty rates, and reduce reliance on food stamps and other forms of public assistance. Careful studies of the impact 36
of minimum wage increases on businesses have also shown that raising the minimum wage reduces high turnover rates and does not lead to mass business closings, relocations or loss of jobs among low-wage workers. 37
For the low-wage workers of Santa Cruz County, raising the minimum wage and indexing that wage to inflation would go a long way towards helping reduce inequality, boosting workers and their families out of poverty, and make it easier to meet their basic needs in an increasingly expensive locale. As noted above, based on the California Poverty Measure, an hourly wage of $15.81 would just put a family above the poverty line in Santa Cruz County.
It is clear from our survey and interviews that basic workplace rights – from being paid correctly, to working in safe and healthy conditions, to protection from discrimination, harassment and retaliation - are violated on a regular basis.
Government agencies at the federal and state level are charged with protecting workers, yet their capacities to enforce labor law has been severely weakened. Too often, weak enforcement can act as a signal to low-wage employers that violations will likely go unpunished. These agencies, such as the Wage and Hour Division of the Department of Labor, the Occupational Health and Safety Administration, or the National Labor Relations Board and their state-level counterparts, need greater funding and more inspectors in order to properly fulfill their mandates. In addition to greater funding and staffing of existing agencies, penalties for violations should be strengthened. Because existing penalties can be so low, they no longer deter violations. The increases in penalties and fines for employers could raise the effectiveness of penalties to foster
26
I. Raise Wages
II. Enforce Labor Laws

compliance, but also serve as a source of funding for expanded enforcement.
Finally, new enforcement strategies might be used to get an expanded range of stakeholders involved in compliance, education, and reporting. Here, existing enforcement agencies can help overcome some of the resource and staff shortages by working with other interested parties. As Milkman, Gonzalez, and Narro (2010) argue in their ground-breaking study of wage theft in Los Angeles, the effectiveness and reach of enforcement could be increased by: “partnering with immigrant worker centers, unions, community-based organizations, social service providers, legal advocates, and, wherever possible, responsible employers. Government alone will never have enough staff and resources to monitor the vast number of workplaces on a regular basis. Community partnerships can provide vital information about where workplace violations are most concentrated.” This community-involving 38
strategy related to enforcement has been successfully implemented in regulatory experiments in Los Angeles, San Francisco, and New York. 39
In the case of San Francisco, their Office of Labor Standards Enforcement (OLSE) contracts with community groups and immigrant-serving organizations to conduct Wage Theft Education and Outreach as well as to disseminate information about city labor laws, including the city’s Minimum Wage Ordinance, Paid Sick Leave Ordinance, and Health Care Security Ordinance. These organizations, which have strong ties to low-wage and immigrant communities, hold community events, workshops and training sessions; do media outreach; provide counseling; and document and refer cases of workplace violations to OLSE. 40
Any strategies to improve workers’ wages and working conditions must put workers themselves at the center. Workplace and wage violations are best combatted by workers who are fully aware of their rights, have the knowledge, available resources and power to assert their rights, and do not fear the retaliation of their employers should they seek redress.
A first step is to reach out to low-wage workers to make sure they are fully informed about labor protection laws. Recent added protections, such as the new paid sick leave law, would be important to stress, particularly in light of our finding that over 61% of respondents have worked while sick. Paid family leave is another protection that is not widely known about or used among low-wage workers, many of whom are parents of young children.
Because a large percentage of the low-wage workforce in Santa Cruz County is foreign-born, it is especially important to reach out to immigrants, as all workers, regardless of their documentation status, are covered by workplace protections. Yet, as we found in our study, immigrants may unaware of their rights (particularly those that have moved from agriculture into low-wage services), afraid of deportation, and hesitant to cooperate with government officials.
Outreach and labor rights education are also arenas that can bring together a broad array of actors and stakeholders. As in the San Francisco enforcement model mentioned above, community, faith, and worker organizations can all participate and collaborate with both government agencies and employer groups to make sure workers are informed of their rights, are familiar with the processes to report violations, and feel safe asserting those rights.
Finally, having a voice at work without fear of retaliation is an important step in stemming violations and improving the lives of workers. Yet as our research and other studies of low-wage workers have shown, those that complain, speak up at work, or attempt to organize often face reprisals and illegal retaliation. One of the most 41
fundamental labor standards is the right to organize and bargain collectively, and labor unions are one of the strongest forms of protection workers can have when faced with illegal employer activity. In our survey 15.9% of low-wage workers said their workplace was a unionized, below the overall California rate of 16.3%. And while California’s unionization rate is higher than the US rate, there remains a great discrepancy between public and private sector workers. While 54% of public sector workers in California are unionized, the private sector unionization rate is only 9%. The gulf between the two sectors is explained in large part
27
III. Increase Worker Education, Voice, and Bargaining Power
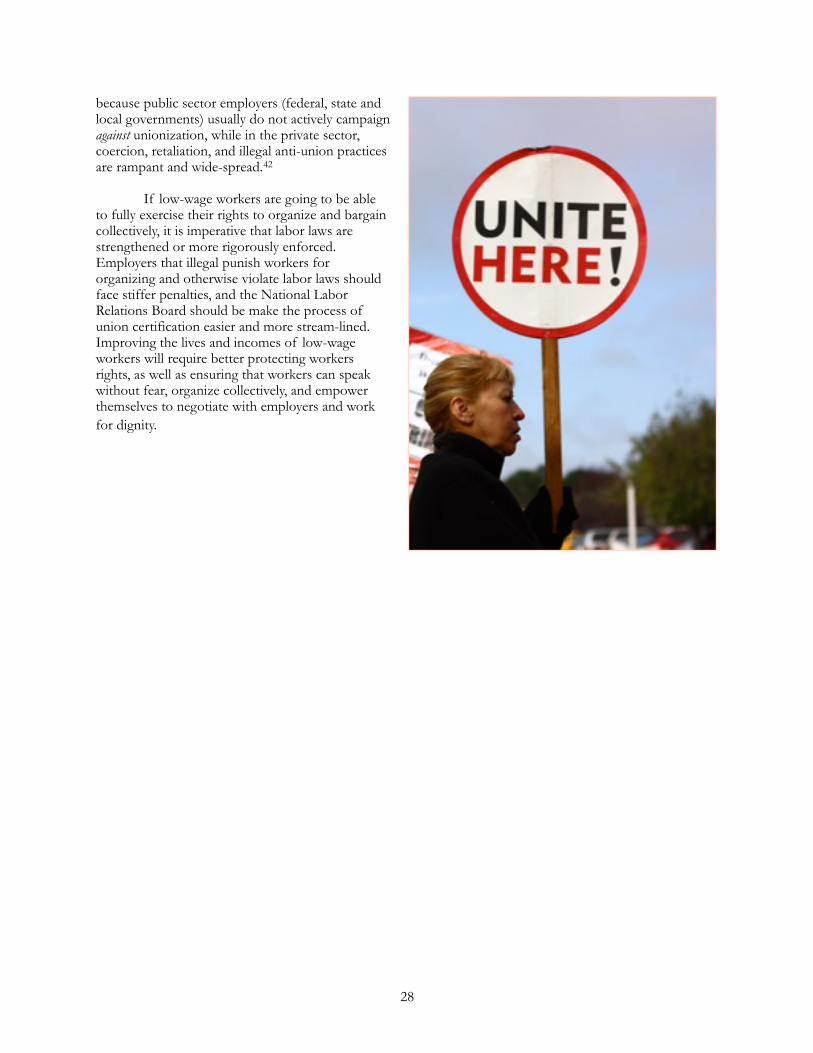
because public sector employers (federal, state and local governments) usually do not actively campaign against unionization, while in the private sector, coercion, retaliation, and illegal anti-union practices are rampant and wide-spread. 42
If low-wage workers are going to be able to fully exercise their rights to organize and bargain collectively, it is imperative that labor laws are strengthened or more rigorously enforced. Employers that illegal punish workers for organizing and otherwise violate labor laws should face stiffer penalties, and the National Labor Relations Board should be make the process of union certification easier and more stream-lined. Improving the lives and incomes of low-wage workers will require better protecting workers rights, as well as ensuring that workers can speak without fear, organize collectively, and empower themselves to negotiate with employers and work for dignity.
28

Bureau of Labor Statistics, 2015, Employment Situation Summary, 1
http://www.bls.gov/news.release/empsit.nr0.htm.
Gould, E., 2015, “2014 Continues a 35-Year Trend of Broad-based Wage Stagnation”, Economic Policy Institute 2
Policy Brief #393, http://s4.epi.org/files/pdf/stagnant-wages-in-2014.pdf
Industries that pay relatively low wages (that is, with median wages in the bottom third or less than $13.33/hour), 3
accounted for 22% of recession job losses, but 44% of job growth in the recovery. National Employment Law Project, 2015, The Low-wage Recovery, http://www.nelp.org/content/uploads/2015/03/Low-Wage-Recovery-Industry-Employment-Wages-2014-Report.pdf
Henry. B and A. Frederickson, 2015, Low Wage Nation, Alliance for a Just Society, 4
https://jobgap2013.files.wordpress.com/2015/01/lowwagenation2015.pdf; Desilver, D. and S. Schwarzer, 2014, “Making more than minimum wage, but less than $10.10 an hour”, Pew Research Center, 2014, http://www.pewresearch.org/fact-tank/2014/11/05/making-more-than-minimum-wage-but-less-than-10-10-an-hour/.
Bernhardt, A., R. Milkman, N. Theodore et al., 2009, Broken Laws, Unprotected Workers, http:// 5
www.unprotectedworkers.org/index.php/broken_laws/index
The California Poverty Measure (CPM) takes into account differences in housing prices and living costs in 6
different counties. Because most Californians live in high-cost counties and 89% of Californians live in rented or mortgaged housing, poverty levels for a family of four for most state residents ranged between $29,500 and $37,400 versus the official national poverty line of $24,028. See Wimer, C., M. Mattingly, S. Kimberlin, et al., 2015, Poverty and Deep Poverty in California, http://web.stanford.edu/group/scspi/poverty/cpm/CPM_Brief_Poverty-Deep-Poverty.pdf.
$13.63 is two-thirds of California’s overall median wage of $20.44, which is the definition of “low-wage” used by 7
the UC Berkeley Labor Center. See UC Berkeley Labor Center, 2015, Low-wage California: 2014 Chartbook, http://laborcenter.berkeley.edu/pdf/2014/chartbook.pdf
UC Berkeley Labor Center, 2015, Low-wage California: 2014 Chartbook, 8
http://laborcenter.berkeley.edu/pdf/2014/chartbook.pdf
Bobo, K. 2009, Wage Theft in America, New York: New Press; National Employment Law Project, 2013, Winning Wage 9
Justice: A Summary of Research on Wage and Hour Violations in the United States, http://www.nelp.org/content/uploads/2015/03/WinningWageJusticeSummaryofResearchonWageTheft.pdf
Kalleberg, A., 2011, Good Jobs, Bad Jobs: The Rise of Precarious Labor Systems in the United States, 1970s to 2000s, New York: 10
Russell Sage Foundation
Bernhardt, A., R. Milkman, N. Theodore et al., 2009, Broken Laws, Unprotected Workers, http:// 11
www.unprotectedworkers.org/index.php/broken_laws/index
Employment Development Department, State of California, 2015, Santa Cruz County Profile, 12
http://www.labormarketinfo.edd.ca.gov/cgi/databrowsing/localAreaProfileQSResults.asp?selectedarea=Santa+Cruz+County&selectedindex=44&menuChoice=localareapro&state=true&geogArea=0604000087 &countyName=
29
Endnotes

This is a common definition or standard for “low-wage workers” when discussing the national level. See R. Thiess, 13
2012, “The Future of Work: Trends and challenges for low-wage workers”, Economic Policy Institute Briefing Paper #341, http://www.epi.org/publication/bp341-future-of-work/ . We, however, use the California Poverty Measure for greater accuracy concerning conditions in Santa Cruz County.
Public Policy Institute of California, 2015, California Poverty Rates by County, 14
http://www.ppic.org/main/mapdetail.asp?i=1396
Bernhardt, A., R. Milkman, N. Theodore et al., 2009, Broken Laws, Unprotected Workers, http:// 15
www.unprotectedworkers.org/index.php/broken_laws/index
Employment Development Department, State of California, 2015, Santa Cruz County Profile, 16
http://www.labormarketinfo.edd.ca.gov/cgi/databrowsing/localAreaProfileQSResults.asp?selectedarea=Santa+Cruz+County&selectedindex=44&menuChoice=localareapro&state=true&geogArea=0604000087 &countyName=
Applied Survey Research, 2015, Santa Cruz County Community Assessment Project 2014 Comprehensive Report, 17
United Way, http://static1.1.sqspcdn.com/static/f/1268549/25695933/1416596994600/CAP+20+Complete+Report.pdf?token=3t5%2BKn%2F7rCEmtg9ViqibmKDEbEg%3D
US Census Bureau 2013 via Social Explorer “Social Explorer Tables: ACS 2013 (1-Year Estimates)(SE), ACS 18
2013 (1-Year Estimates), Social Explorer; U.S. Census Bureau,” http://www.socialexplorer.com/tables/ACS2013/R10997981
Bureau of Economic Analysis, US Dept of Commerce, 2015, Real Personal Income for States and Metropolitan 19
Areas 2013, http://bea.gov/newsreleases/regional/rpp/2015/pdf/rpp0615.pdf
Santa Cruz County Planning Commission, 2015, Draft Housing Element, 20
http://www.sccoplanning.com/Portals/2/County/Planning/housing/Proposed%20Draft%20Housing%20Element.pdf, Federal Reserve Bank of St. Louis, 2015, Median Sale Price for New Houses Sold in the US, https://research.stlouisfed.org/fred2/series/MSPNHSUS)
National Low-Income Housing Coalition, 2015, Out Of Reach: California 2015, http://nlihc.org/oor/california 21
Bureau of Economic Analysis, US Dept of Commerce, 2015, Real Personal Income for States and Metropolitan 22
Areas 2013, (http://bea.gov/newsreleases/regional/rpp/2015/pdf/rpp0615.pdf
A “small” metro area is defined as one below a total population of 500,000. National Association of Home 23
Builders, 2015, Housing Opportunity Index, http://www.nahb.org/en/research/housing-economics/housing-indexes/housing-opportunity-index.aspx
US Census Bureau 2013 via Social Explorer “Social Explorer Tables: ACS 2013 (1-Year Estimates)(SE), ACS 24
2013 (1-Year Estimates), Social Explorer; U.S. Census Bureau,” http://www.socialexplorer.com/tables/ACS2013/R10997981
Based on the California Poverty Measure (CPM), the income required to be above the poverty line in Santa Cruz 25
is much higher than the federal poverty line. Based on the CPM, the overall poverty rate in Santa Cruz County was 20.6% in 2012 versus the official rate of 13.1% based on the federal standard. See Public Policy Institute of California, 2013, California Poverty by County, http://www.ppic.org/content/data/CaliforniaPovertybyCounty2012.xlsx
Applied Survey Research, 2015, Santa Cruz County Community Assessment Project 2014 Comprehensive Report, 26
United Way, http://static1.1.sqspcdn.com/static/f/1268549/25695933/1416596994600/CAP+20+Complete+Report.pdf?token=3t5%2BKn%2F7rCEmtg9ViqibmKDEbEg%3D
30

Kalleberg, A., 2011, Good Jobs, Bad Jobs: The Rise of Precarious Labor Systems in the United States, 1970s to 27
2000s, New York: Russell Sage Foundation
Bernhardt, A., R. Milkman, N. Theodore et al., 2009, Broken Laws, Unprotected Workers, http:// 28
www.unprotectedworkers.org/index.php/broken_laws/index; UC Berkeley Labor Center, 2015, Low-wage California: 2014 Chartbook, http://laborcenter.berkeley.edu/pdf/2014/chartbook.pdf
Theis, 2012, “The Future of Work: Trends and challenges for low-wage workers”, Economic Policy Institute 29
Briefing Paper #341, http://www.epi.org/publication/bp341-future-of-work/; Bernhardt, A. M. Spiller, D. Polson, 2013, “All Work and No Pay”, Social Forces 91(3): 725-746.
UC Berkeley Labor Center, 2015, Low-wage California: 2014 Chartbook, http://laborcenter.berkeley.edu/pdf/2014/ 30
chartbook.pdf
UC Berkeley Labor Center, 2015, Low-wage California: 2014 Chartbook, http://laborcenter.berkeley.edu/pdf/2014/ 31
chartbook.pdf
Kalleberg, A., 2011, Good Jobs, Bad Jobs: The Rise of Precarious Labor Systems in the United States, 1970s to 32
2000s, New York: Russell Sage Foundation
Mishel, L. 2015. Causes of Wage Stagnation, Economic Policy Institute Report, 33
http://s3.epi.org/files/2013/causes_of_wage_stagnation.pdf; Milkman, R. A. Gonzalez, V. Narro, 2010, Wage Theft and Workplace Violations in Los Angeles, UCLA Institute for Research on Labor and Employment; Kalleberg, A., 2011, Good Jobs, Bad Jobs: The Rise of Precarious Labor Systems in the United States, 1970s to 2000s, New York: Russell Sage Foundation; Schmitt, J. and J. Jones, 2012, “Where have all the Good Jobs Gone?”, Center for Economic and Policy Research, http://www.cepr.net/documents/publications/good-jobs-2012-07.pdf
Bivens, J., E. Gould, L. Mishel, et al. 2014, “Raising America’s Pay: Why Its Our Central Economic Policy Challenge,” 34
Economic Policy Institute Briefing Paper #378
National Employment Law Project, 2015, “City Minimum Wage Laws: 35
Recent Trends and Economic Evidence”, http://www.nelp.org/content/uploads/City-Minimum-Wage-Laws-Recent-Trends-Economic-Evidence.pdf
Reich, M., K. Jacobs, and A. Bernhardt, 2014, “Local Minimum Wage Laws: Impacts on Workers, Families and 36
Businesses”, IRLE Working Paper, UC Berkeley Labor Center, p.11. http://laborcenter.berkeley.edu/local-minimum-wage-laws-impacts-on-workers-families-and-businesses/
Dube, A., T. Lester and M. Reich, “Minimum Wage Effects Across State Borders: Estimates Using Contiguous 37
Counties,” IRLE Working Paper No. 157-07. http://irle.berkeley.edu/workingpapers/157-07.pdf
Milkman, R. A. Gonzalez, and V. Narro. 2010. “Wage Theft and Workplace Violations in Los Angeles,” UC Institute for 38
Research on Labor and Employment, University of California, Los Angeles, p.56.
see City and County of San Francisco, Office of Labor Standards Enforcement, 39
http://sfgsa.org/index.aspx?page=391; Fine, J. and J. Gordon, 2010, “Strengthening Labor Standards Enforcement through Partnerships with Workers’ Organizations,” Politics & Society 38(4): 552-584
Dietz, M., D. Levitt, and E. Love, 2014, “Enforcement of Labor Standards” in M. Reich, D. Jacobs and M. Dietz 40
(eds), When Mandates Work: Raising Labor Standards at the Local Level, Berkeley: UC Press
Bernhardt, A. M. Spiller, D. Polson, 2013, “All Work and No Pay”, Social Forces 91(3): 725-746.41
Logan, J. 2006. “The Union Avoidance Industry in the United States,” British Journal of Industrial Relations 44(4); 42
651-675; K. Bronfrenbrenner, 2009, “No Holds Barred: The Intensification of Employer Opposition to Organizing, EPI Briefing Paper #235, http://epi.3cdn.net/edc3b3dc172dd1094f_0ym6ii96d.pdf
31