working capital management - lakehead...
TRANSCRIPT

Working Capital Management
Gitman and Hennessey, Chapter 14
Spring 2004

14.1 Net Working Capital Fundamentals
In 2002, current assets accounted for 31.7% of non-financial
Canadian corporations’ total assets.
Of this 31.7%, 46.1% were accounts receivable, 37.8% were
inventories and 16.1% was cash.
See Figure 14.1
2

14.1 Net Working Capital Fundamentals
Short-term management–managing current assets and
liabilities–is one of the financial manager’s most important
activities.
Too large an investment in current assets can reduce profitability,
whereas too little investment increases liquidity risk.
Too little current liability financing can reduce profitability
whereas too much increases liquidity risk.
3

14.1 Net Working Capital Fundamentals
Current assets are often referred to as the firm’sworking capital.
Current liabilities represent the firm’s short-term financing.
The conversion of current assets from inventory to receivables to
cash provides the source of cash to pay the current liabilities.
The timing of cash outlays for current liabilities is easily
predictable but the inflows from current assets are not. This is a
source of risk.
4

14.1 Net Working Capital Fundamentals
A tradeoff exists between a firm’s profitability and its risk.
Profitability is the relationship between revenues and costs
generated by using the firm’s assets.
Risk, in the context of short-term financial management, is the
probability that the firm be unable to pay its bill when they come
due.
5

14.1 Net Working Capital Fundamentals
The greater the firm’s net working capital, the lower the risk but
the lower the firm’s profitability.
Current assets, however, includes assets that are not very
productive (cash, for example).
A firm’s productive assets are its long-term assets.
An increase in current liabilities, on the other hand, increases
profitability but also increases risk.
6

14.2 The Cash Conversion Cycle
Cash is not a productive asset but is needed to pay bills.
• What is a reasonable level of cash to keep on hand?
• How much should the firm borrow short-term?
• How much credit should be extended to customers?
• How much inventory should the firm carry?
7

14.2 The Cash Conversion Cycle
From the balance sheet identity
Cash+ non-cash CA+ NFA = CL + LTD + E,
we find
Cash= CL + LTD + E − non-cash CA− NFA.
Hence anincrease in liabilities is a source of cashand an
increase in assets is a use of cash.
8

14.2 The Cash Conversion Cycle
Before selling goods, the firm needs to buy raw materials
(inventory).
Then it has to pay for the raw material (cash out).
Then it sells the goods produced out of the raw material.
Then it receives payment for the goods sold (cash in).
9

14.2 The Cash Conversion Cycle
How long does it take, on average, to recover the cash used to
purchase raw material?
Consider a firm with an average age of inventory (AAI, days’
sales in inventory) of 110 days, an average payment period (APP,
days’ sales in payables) of 30 days and an average collection
period (ACP, days’ sales in receivables) of 45 days.
10

14.2 The Cash Conversion Cycle
The firm’soperating cycleis the average length of time between
the moment raw material isacquiredand the moment customers
pay for the goods they buy:
Operating Cycle (OC)= AAI + ACP = 110+ 45 = 155 days.
11

14.2 The Cash Conversion Cycle
The firm’scash cycleis the average length of time between the
moment raw material ispaid forand the moment customers pay
for the goods they buy:
Cash Conversion Cycle (CCC)= OC−APP
= AAI + ACP − APP
= 110 + 45 − 30
= 125 days.
12

14.2 The Cash Conversion Cycle
The Cash Budget
The cash budget is a primary tool of short-term financial
planning.
It allows managers to identify short-term financing needs.
It helps identify when short-term borrowing will be needed.
The cash budget basically records estimates of cash receipts and
disbursements.
13

The Cash Budget
Thecash budgetdescribes the firm’s planned inflows and
outflows of cash.
This statements aims at determining when the firm will
experience surpluses and shortages of cash.
The cash budget covers a 6- to 12-month period divided into
shorter intervals, usually months.
The more seasonal or uncertain the firm’s cash flows, the shorter
these intervals (weeks or days).
14
The Cash Budget
The Sales Forecast
The starting point of financial planning, whether short- or
long-term, is the firm’s sales forecast.
Sales forecast may come from past sales, economic conditions,
sales expectations about new products, etc. These are usually
provided by the marketing department.
External forecastscome from key external economic indicators.
Internal forecastscome from the firm’s own channels.
15

The Cash Budget
Using sales forecast, the firm can determine the fixed assets
necessary to achieve these sales, variable costs can be evaluated,
and cash inflows and outflows can be estimated.
For example, some of the firm customers will pay immediately
while others will pay after 30, 60 or 90 days. Some customers
may not even pay at all. Cash inflows occur when customers pay,
not when they buy.
Similarly, some of the firm’s cash outflows depend on its credit
arrangements with suppliers.
16

The Cash Budget
Suppose a firm expects to sell for $1,000 in January. Then,
assuming that 20% of its customers pay cash at the time of the
sale, 50% pay one month later, 28% pay two months later and
2% never pay, the cash inflows arising from January sales are
expected to be
$200 in January,
$500 in February and
$280 in March.
Note that the missing $20 could be recovered at some point in
time but it may be more conservative not to count on it.
17

The Cash Budget
Cash Receipts
Cash receipts include all of the firm’s inflows of cash. These are
mainly cash sales and collections of accounts receivable.
Accounts receivable collected in a month come from sales that
took place in preceding months.
18

Example
Coulson Industries is developing its cash budget for October,
November and December. Expected sales for these months are
(in thousands of $) 400, 300 and 200, respectively. Sales in
August and September were 100 and 200, respectively.
Month August September October November December
Sales (forecast) 100 200 400 300 200
19

Example (continued)
Coulton’s sales are expected to convert to cash as follows: 20%
of its customers pay at the time of sales, 50% pay one month
later and 30% pay two months later (assume that every customer
is expected to pay). On top of that, the firm expects to receive
$30,000 from a subsidiary in December. The table below
summarizes the cash inflows.
20

Coulton’s Cash Receipts ($000)
Month Aug. Sept. Oct. Nov. Dec.
Forecast sales 100 200 400 300 200
Cash sales (20%) 20 40 80 60 40
Collections of A/R:
Lagged one month (50%) 50 100 200 150
Lagged two months (30%) 30 60 120
Other cash receipts 30
Total cash receipts 210 320 340
21

The Cash Budget
Cash Disbursements
The most common cash disbursements are
Cash purchases Fixed asset outlays
Payments of accounts payable Interest payments
Rent (and lease) payments Cash dividend payments
Wages and salaries Principal payments (on loans)
Tax payments Repurchases of common shares
22

Example (continued)
Purchases: Coulton’s purchases are 70% of sales, 10% of which
are paid in cash, 70% of which are paid one month later and
20% of which are paid two months later. That is, if Coulton
sells for $SJ in January, it will pay
10%×70%×$SJ = .07×SJ in January,
70%×70%×$SJ = .49×SJ in February,
20%×70%×$SJ = .14×SJ in March.
Note: This is not the case in this example, but very often
some of the purchases will occur in months preceding the
sales’ month.
23
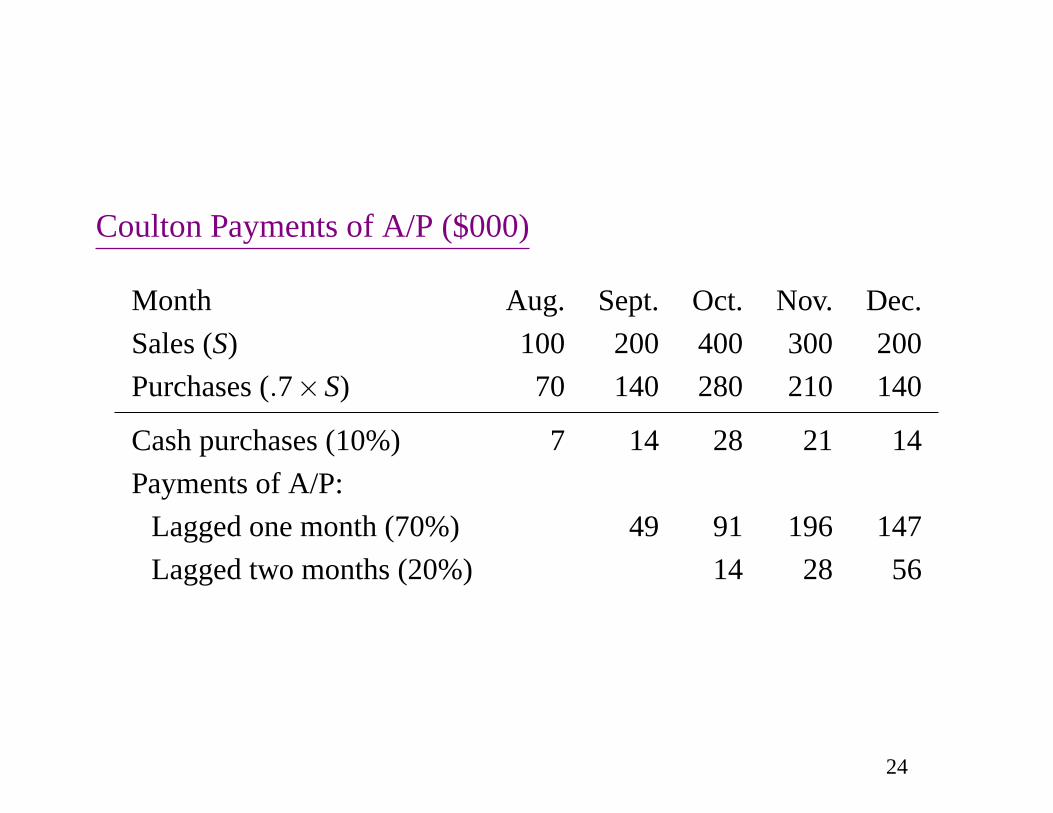
Coulton Payments of A/P ($000)
Month Aug. Sept. Oct. Nov. Dec.
Sales (S) 100 200 400 300 200
Purchases (.7×S) 70 140 280 210 140
Cash purchases (10%) 7 14 28 21 14
Payments of A/P:
Lagged one month (70%) 49 91 196 147
Lagged two months (20%) 14 28 56
24

Coulton’s Other Cash Disbursements
Rent payments: $5,000 each month.
Wages and salaries:For Coulton, these are usually 10% of sales plus fixed
salaries of $8,000 per month.
Tax payments: $25,000 in December.
Fixed asset outlays:New machinery costing $130,000 will be purchased in
September and paid for in November.
Interest payments: $10,000 in December.
Cash dividends: $20,000 in October.
Principal payments: $20,000 in December.
Repurchases of shares:$0 for the rest of the year.
25

Coulton’s Cash Disbursements ($000)
Month Aug. Sept. Oct. Nov. Dec.Sales (S) 100 200 400 300 200Purchases (.7×S) 70 140 280 210 140
Cash purchases (10%) 7 14 28 21 14Payments of A/P:
Lagged one month (70%) 49 98 196 147Lagged two months (20%) 14 28 56
Rent payments 5 5 5Wages and salaries 48 38 28Tax payments 25Fixed asset outlays 130Interest payments 10Cash dividends 20Principal payments 20Total disbursements 213 418 305
26

The Cash Budget
Net Cash Flow, Ending Cash and Excess Cash
Net Cash Flow = Cash Receipts− Cash Disbursements
Ending Cash = Beginning Cash+ Net Cash Flow
Required Financing = Minimum Cash Balance− Ending Cash
Excess Cash= Ending Cash− Minimum Cash Balance
Suppose Coulton has $50,000 in cash at the beginning of October
and suppose its minimum cash balance is $25,000.
27

Coulton’s Cash Budget ($000)
Month Oct. Nov. Dec.
Total cash receipts 210 320 340
Less: Total cash disbursements 213418 305
Net cash flow (3) (98) 35
Add: Beginning cash 50 47 (51)
Ending cash 47 (51) (16)
Less: Minimum cash balance 25 25 25
Required financing – 76 41
Excess cash 22 – –
28

The Cash Budget
Evaluating the Cash Budget
Using the information obtained so far, it is possible to determine,
for each period, the balance in cash, in marketable securities and
in notes payable.
Note that a firm should liquidate its marketable securities before
dipping into its line of credit. A firm may have both items at the
same time but this should be temporary.
29

Coulton’s End-of-Month Balances ($000)
October November December
Cash 25 25 25
Marketable securities 22 0 0
Line of credit 0 76 41
Coulton’s management must ensure that a line of credit of at least
$76,000 is secured before November.
30

The Cash Budget
Coping with Uncertainty in the Cash Budget
Many items in the cash budget vary with sales.
The cash budget thus depends on the level of sales expected.
What financing will be needed if sales are 10% less than
expected in each month?
What financing will be needed if sales are 10% more than
expected in each month?
31

The Cash Budget
Coping with Uncertainty in the Cash Budget
Cash flows are also affected by the time customers take to pay
for their purchases.
What would the cash budget look like if only 10% of the sales
were paid cash, 50% paid after one month and 40% paid after
two months?
What if 5% of the sales are never paid?
32

Coping with Uncertainty in the Cash Budget
Suppose, for example, that the time at which accounts are paid isnot expected to change but sales could be
Month Aug. Sept. Oct. Nov. Dec.
Best case (10% higher) 100 200440 330 220
Worst case (10% lower) 100 200360 270 180
33

Scenario Analysis when only Sales Vary
October November December
Cash 25 25 25
Most Likely Scenario
Marketable securities 22 0 0Line of credit 0 76 41
Best-Case Scenario
Marketable securities 23 0 0Line of credit 0 74 31
Worst-Case Scenario
Marketable securities 21 0 0Line of credit 0 78 51
34

Coping with Uncertainty in the Cash Budget
Suppose now that the best-case scenario is such that sales in the
last three months of the year are 10% higher than the initial
figures and, at the same time, 30% of sales are paid cash, 50%
one month later and 20% two months later.
The worst-case scenario, on the other hand, is such that sales are
10% lower than expected and cash sales are 10% of total sales,
50% of sales are paid one month later and 40% of sales are paid
two months later.
We will see that collection of receivables significantly affect the
firm’s cash flows.
35

Scenario Analysis when Sales and Collections of A/R Vary
October November December
Cash 25 25 25
Expected Case
Marketable securities 22 0 0Line of credit 0 76 41
Best-Case Scenario
Marketable securities 57 0 0Line of credit 0 27 6
Worst-Case Scenario
Marketable securities 0 0 0Line of credit 5 112 66
36

14.2 The Cash Conversion Cycle
If a firm’s sales are constant, its investment in operating assets
will also be constant. This firm will only have permanent funding
requirement.
If a firm’s sales vary over time, then its investment in operating
assets will also vary over time. This firm will have seasonal
funding requirements.
37

14.2 The Cash Conversion Cycle
Funding Requirements of the Cash Conversion Cycle
A firm may fund its seasonal needs with short-term debt and its
permanent needs with long-term debt (aggressive funding
strategy).
A firm may fund all its needs, both seasonal and permanent with
long-term debt (conservative funding strategy).
38

14.2 The Cash Conversion Cycle
Funding Requirements: Example 1
Nicholson Company holds, on average, $50 in cash and
marketable securities, $1,250 in inventory and $750 in accounts
receivable. Nicholson’s accounts payable of $425 are stable over
time.
Nicholson has a permanent investment in operating assets (net
operating working capital) of
50 + 1,250 + 750− 425 = $1,625.
.
39

14.2 The Cash Conversion Cycle
Funding Requirements: Example 2
Semper Pump Company, which produces bicycle pumps, has
seasonal funding needs.
It holds, at minimum, $25 in cash and marketable securities,
$100 in inventory and $60 in accounts receivable.
At peak times, inventory increases to $750 and accounts
receivable increase to $400.
Semper’s accounts payable remain $50 throughout the year.
40

14.2 The Cash Conversion Cycle
Funding Requirements: Example 2
Semper permanent funding requirement for its operating assets is
25 + 100 + 60 − 50 = $135,
and its maximum funding requirement is
25 + 750 + 400− 50 = $1,125.
Hence Semper’s seasonal funding requirement is
1,125− 135 = $990.
41

14.2 The Cash Conversion Cycle
Funding Strategies: Semper
Semper’s permanent funding requirement is $135 and its
seasonal needs vary between $0 and $990, for an average of
$101.25.
Semper can borrow short-term funds at 6.25% and long-term
funds at 8%, and it can earn 5% on any surplus balance.
42

14.2 The Cash Conversion Cycle
Funding Strategies: Semper
If Semper follows an aggressive funding strategy, all its seasonal
needs will be funded with short-term debt. There will not be any
surplus to invest throughout the year.
If it follows a conservative strategy, all its needs will be funded
with long-term debt. In this case, there will be surpluses
whenever funding requirements are below $1,125 and these
surpluses will be invested at the rate of 5%.
43

14.2 The Cash Conversion Cycle
Funding Strategies: Semper
Suppose Semper follows an aggressive funding strategy. Then it
uses long-term debt for its permanent funding requirement only,
which costs
8%×135 = $10.8.
Seasonal needs, which average $101.25 will be funded with
short-term debt, the cost being
6.25%×101.25 = $6.33.
44

14.2 The Cash Conversion Cycle
Funding Strategies: Semper
The total cost of the aggressive funding strategy is then
10.8 + 6.33 = $17.13.
45

14.2 The Cash Conversion Cycle
Funding Strategies: Semper
Suppose now that Semper follows a conservative funding
strategy. Then long-term debt is used to finance all operating
assets needed throughout the year, which means that $1,125 is
borrowed at the rate of 8%. This implies a cost of
8%×1,125 = $90.
46

14.2 The Cash Conversion Cycle
Funding Strategies: Semper
The cash raised with long-term debt is not used all the time.
More specifically, the average excess funding during the year is
1,125.00 − 101.25 − 135.00 = $888.75,
which will be invested at the rate of 5%, creating a revenue of
5%×888.75 = $44.44.
47

14.2 The Cash Conversion Cycle
Funding Strategies: Semper
The net cost of the conservative funding strategy is then
90.00 − 44.44 = $45.56.
Note that the aggressive funding strategy is less expensive than
the conservative strategy. The former, however, is more risky
than the latter.
48

14.2 The Cash Conversion Cycle
Strategies for Managing the Cash Conversion Cycle
1. Turn over inventory as quickly as possible without stockouts
resulting in lost sales.
2. Collect account receivable as quickly as possible without
losing sales from high-pressure collection techniques.
3. Pay accounts payable as slowly as possible without
damaging the firm’s credit rating.
49

14.3 Inventory Management
The ABC System
This concept suggests that 20 percent of the firm’s products
account for 80 percent of the firm’s sales and thus 80 percent of
the firm’s inventory. The products within this 20 percent are
classified as A items and are actively managed.
The B group consists of items that account for the next largest
investment in inventory.
The C group consists of a large number of items that require a
relatively small investment.
50

14.3 Inventory Management
The Economic Order Quantity (EOQ) Model
The EOQ is an appropriate model for the management of A and
B items. Let
S = usage in units per period,
O = order cost per order,
C = carrying cost per unit per period,
Q = order quantity in units.
51

14.3 Inventory Management
The Economic Order Quantity (EOQ) Model
The number of orders per period is the number of units used,S, divided
by the size of an order,Q, and thus total order cost per period is
Order cost= O× SQ
.
Inventory is assumed to deplete at a constant rate and thus the carrying
cost of an order per period is
Carrying cost= C× Q2
.
52

14.3 Inventory Management
The Economic Order Quantity (EOQ) Model
The total cost of inventory is then the sum of the order cost and
the carrying cost, which gives
Total cost= O× SQ
+ C× Q2
the quantity minimizing this cost, the economic order quantity
(EOQ), is
EOQ =
√2×S×O
C.
53

14.3 Inventory Management
The Economic Order Quantity (EOQ) Model: Example
MAX Company has an A group of inventory item that is vital for
the production process. This item costs $1,500 and MAX uses
1,100 units of the item per year. The order cost per order of this
item is $150 and the carrying cost per unit per year is $200. The
optimal order strategy for this item is then
EOQ =
√2×1,100×150
200= 41 units.
54