financial planning and forecasting - lakehead...
TRANSCRIPT
Financial Planning and Forecasting
Long-Term Planning
Spring 2004
4.3 Fundamentals of Preparing Pro Forma Statements
A cash budget is not the only statement that must be forecasted.
Future profits and financial needs must also be projected.
The three main outputs of financial forecasting are
1. Pro forma income statement
2. Pro forma balance sheet
3. A statement of external financing required (EFR)
2
4.3 Fundamentals of Preparing Pro Forma Statements
Preparing pro forma statements requires a set of assumptions
about
• the increase in sales,
• the increase in costs,
• the increase in assets,
• the increase in debt,
• etc...
3
4.3 Fundamentals of Preparing Pro Forma Statements
Preparing the pro forma statements requires the use ofplug
variables.
A plug variable varies to ensure that the balance sheet balances
and to ensure that the pro forma balance sheet figures are
consistent with the pro forma income statement figures.
That is, the growth assumptions cannot concern all items on the
statements. How plug variables vary will determine the firm’s
external financing required.
4

A Simple Financial Planning Model
Computerfield CorporationCurrent Financial Statements
Income Statement
Sales 1,000Costs (800)Net income 200
Balance Sheet
Assets 500 Debt 250Equity 250
Total 500 Total 500
Dividends 100Earnings retained 100
5
A Simple Financial Planning Model
Example 1Assumptions: Sales, costs, assets, debt and equity are all
expected to increase by 20% in the coming year. “Dividends” is
the plug variable:
Computerfield CorporationPro Forma Financial Statements
Income Statement
Sales 1,200Costs (960)Net income 240
Balance Sheet
Assets 600 Debt 300Equity 300
Total 600 Total 600
Dividends ?Earnings retained 50
6

A Simple Financial Planning Model
Example 1 (continued)
Equity is expected to increase by 50 while net income is
expected to be 240.
For the pro forma income statement to be consistent with the pro
forma balance sheet, dividends must be
240− 50 = 190.
“Dividends” is used at the plug variable in the present example.
The next example uses a different plug variable.
7
A Simple Financial Planning Model
Example 2Assumptions: Sales, costs, assets, are all expected to increase by
20% in the coming year. The dividend payout ratio will remain
50% of net income, so debt is the plug variable.
Computerfield CorporationPro Forma Financial Statements
Income Statement
Sales 1,200Costs (960)Net income 240
Balance Sheet
Assets 600 Debt ?Equity 370
Total 600 Total 600
Dividend 120Earnings retained 120
8

A Simple Financial Planning Model
Example 2 (continued)
Total liabilities and equity are expected to increase to 600 while
equity is expected to be 370.
For the pro forma balance sheet to balance, future debt has to be
600− 370 = 230,
i.e. debt has to be reduced by 20.
9
A Simple Financial Planning Model
In the last example, EFR is -20, i.e. the firm will be able to repay
$20 of long-term debt if the projections are correct.
There are many ways to construct pro forma statements. Two of
these are:
• The percent-of-sales approach.
• The judgemental approach.
10
The Percent-of-Sales Approach
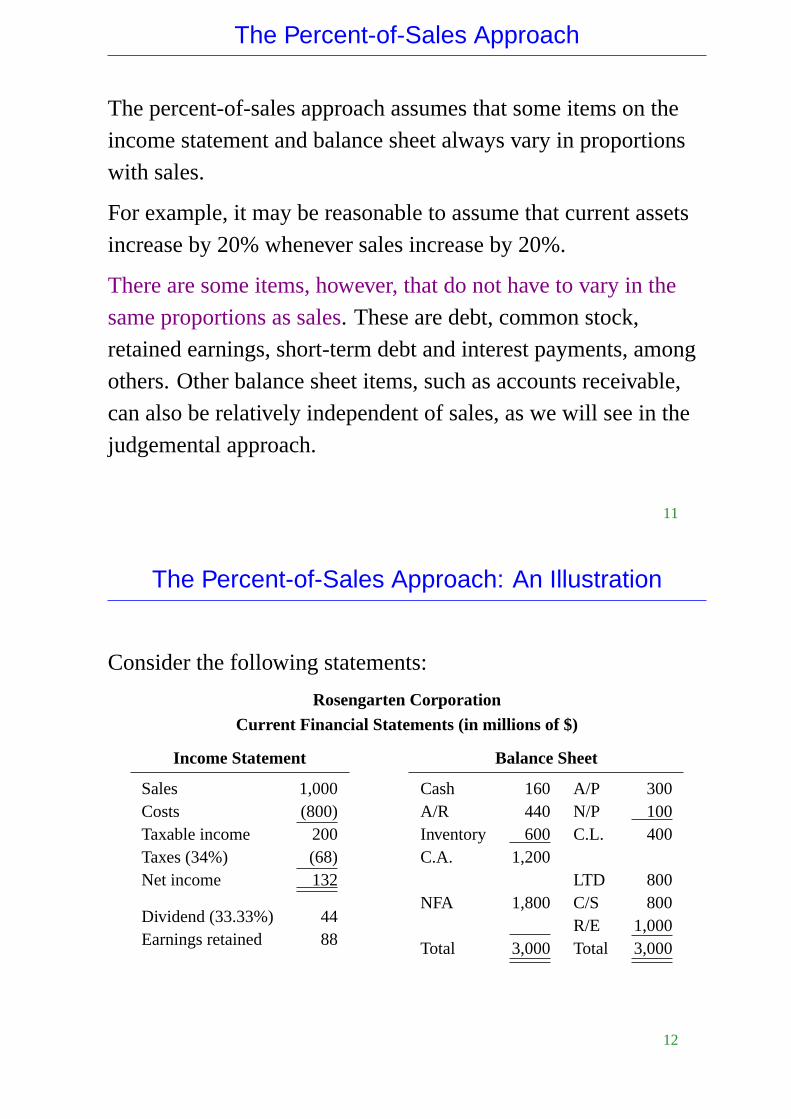
The percent-of-sales approach assumes that some items on theincome statement and balance sheet always vary in proportionswith sales.
For example, it may be reasonable to assume that current assetsincrease by 20% whenever sales increase by 20%.
There are some items, however, that do not have to vary in thesame proportions as sales. These are debt, common stock,retained earnings, short-term debt and interest payments, amongothers. Other balance sheet items, such as accounts receivable,can also be relatively independent of sales, as we will see in thejudgemental approach.
11
The Percent-of-Sales Approach: An Illustration
Consider the following statements:
Rosengarten Corporation
Current Financial Statements (in millions of $)
Income Statement
Sales 1,000Costs (800)Taxable income 200Taxes (34%) (68)Net income 132
Dividend (33.33%) 44Earnings retained 88
Balance Sheet
Cash 160 A/P 300A/R 440 N/P 100Inventory 600 C.L. 400C.A. 1,200
LTD 800NFA 1,800 C/S 800
R/E 1,000Total 3,000 Total 3,000
12

The Percent-of-Sales Approach: An Illustration
Main assumption: Sales are expected to increase by 25%.
Assumptions concerning the income statement:
• Costs are a constant fraction of sales (800/1,000= 80%).
• The tax rate is not expected to change (34%).
• Dividend payout ratio will remain constant (33.33%).
13
The Percent-of-Sales Approach: An Illustration
Assumptions concerning the balance sheet (assets):
• Each current asset is a constant fraction of sales:
1601,000
= 16% for Cash,
4401,000
= 44% for A/R,
6001,000
= 60% for inventory.
14
The Percent-of-Sales Approach: An Illustration
Assumptions concerning the balance sheet (assets):
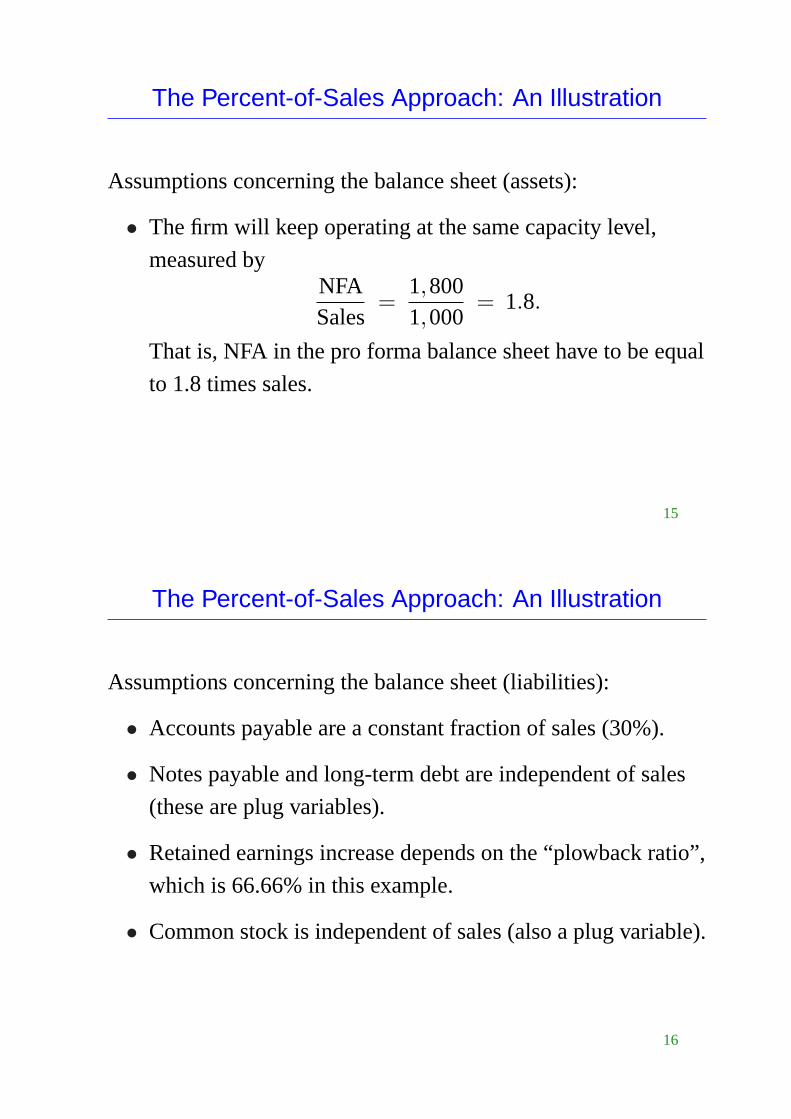
• The firm will keep operating at the same capacity level,
measured byNFASales
=1,8001,000
= 1.8.
That is, NFA in the pro forma balance sheet have to be equal
to 1.8 times sales.
15
The Percent-of-Sales Approach: An Illustration
Assumptions concerning the balance sheet (liabilities):
• Accounts payable are a constant fraction of sales (30%).
• Notes payable and long-term debt are independent of sales
(these are plug variables).
• Retained earnings increase depends on the “plowback ratio”,
which is 66.66% in this example.
• Common stock is independent of sales (also a plug variable).
16
The Percent-of-Sales Approach: An Illustration
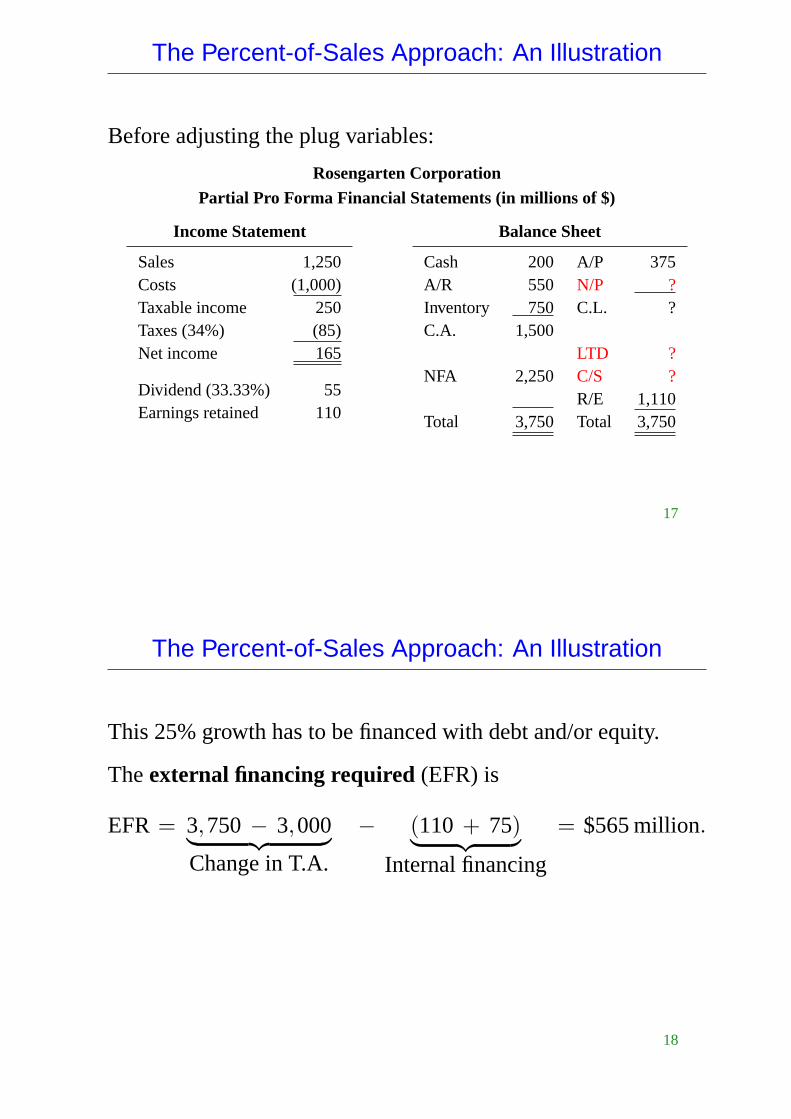
Before adjusting the plug variables:
Rosengarten Corporation
Partial Pro Forma Financial Statements (in millions of $)
Income Statement
Sales 1,250Costs (1,000)Taxable income 250Taxes (34%) (85)Net income 165
Dividend (33.33%) 55Earnings retained 110
Balance Sheet
Cash 200 A/P 375A/R 550 N/P ?Inventory 750 C.L. ?C.A. 1,500
LTD ?NFA 2,250 C/S ?
R/E 1,110Total 3,750 Total 3,750
17
The Percent-of-Sales Approach: An Illustration
This 25% growth has to be financed with debt and/or equity.
Theexternal financing required (EFR) is
EFR = 3,750− 3,000︸ ︷︷ ︸Change in T.A.
− (110 + 75)︸ ︷︷ ︸Internal financing
= $565million.
18
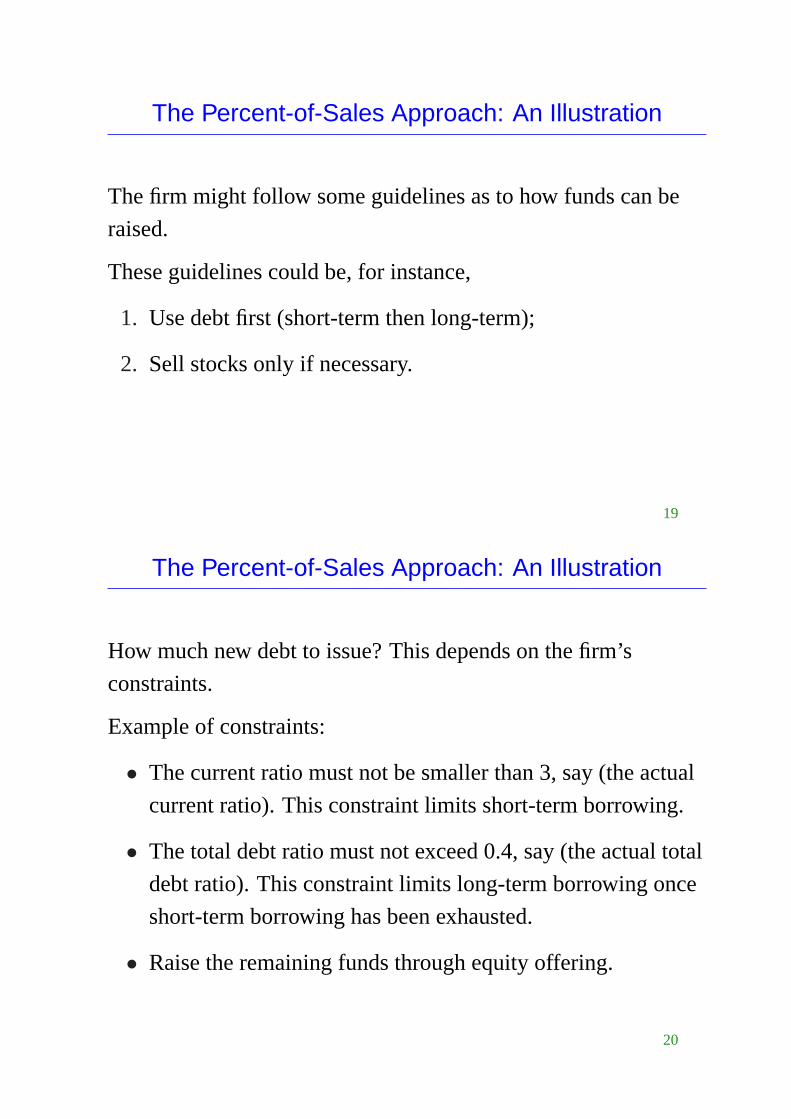
The Percent-of-Sales Approach: An Illustration
The firm might follow some guidelines as to how funds can be
raised.
These guidelines could be, for instance,
1. Use debt first (short-term then long-term);
2. Sell stocks only if necessary.
19
The Percent-of-Sales Approach: An Illustration
How much new debt to issue? This depends on the firm’s
constraints.
Example of constraints:
• The current ratio must not be smaller than 3, say (the actual
current ratio). This constraint limits short-term borrowing.
• The total debt ratio must not exceed 0.4, say (the actual total
debt ratio). This constraint limits long-term borrowing once
short-term borrowing has been exhausted.
• Raise the remaining funds through equity offering.
20
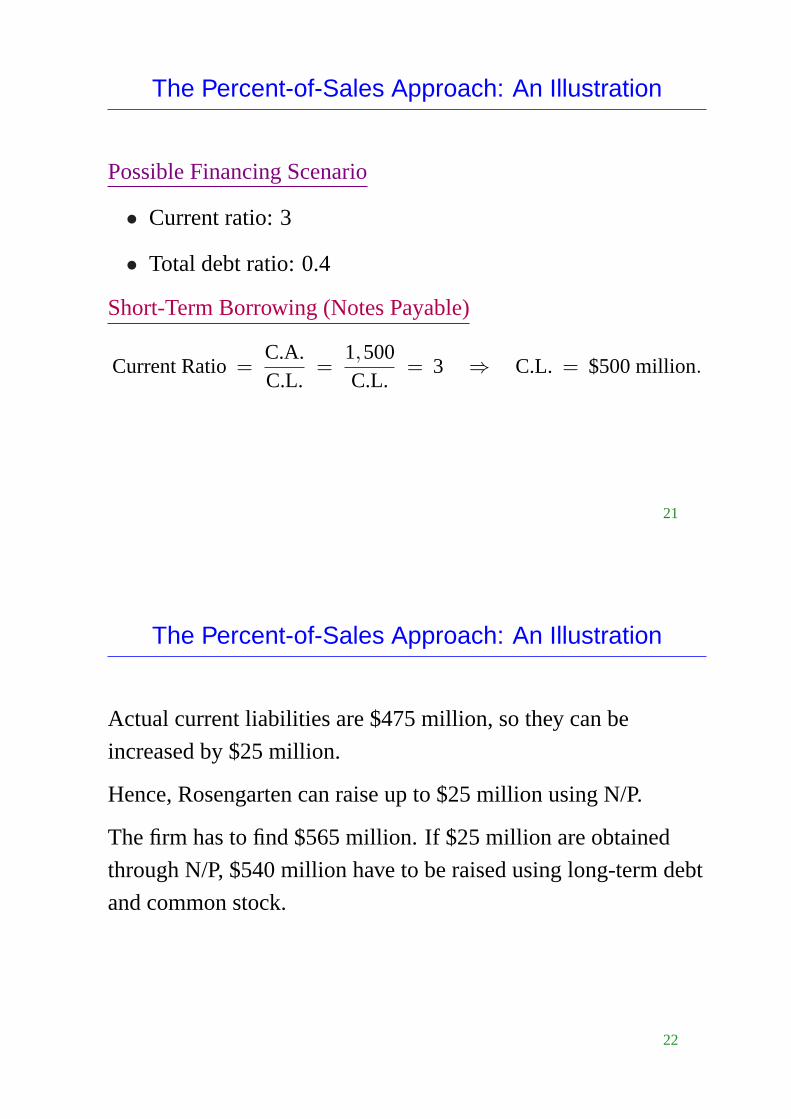
The Percent-of-Sales Approach: An Illustration
Possible Financing Scenario
• Current ratio: 3
• Total debt ratio: 0.4
Short-Term Borrowing (Notes Payable)
Current Ratio=C.A.C.L.
=1,500C.L.
= 3 ⇒ C.L. = $500million.
21
The Percent-of-Sales Approach: An Illustration
Actual current liabilities are $475 million, so they can be
increased by $25 million.
Hence, Rosengarten can raise up to $25 million using N/P.
The firm has to find $565 million. If $25 million are obtained
through N/P, $540 million have to be raised using long-term debt
and common stock.
22

The Percent-of-Sales Approach: An Illustration
Long-Term Debt
Total Debt Ratio=Total debt
Total assets=
Total debt3,750
= 0.4,
which gives
Total debt= $1,500million.
Thus the firm can raise up to
1,500− 500− 800 = $200million
in long-term debt, which leaves us with540−200= $340
million to find.
23
The Percent-of-Sales Approach: An Illustration
The remaining $340 million will be raised through a common
stock issue, which gives the following pro forma statements:
Rosengarten Corporation
Pro Forma Financial Statements (in millions of $)
Income Statement
Sales 1,250Costs (1,000)Taxable income 250Taxes (34%) (85)Net income 165
Dividend (33.33%) 55Earnings retained 110
Balance Sheet
Cash 200 A/P 375A/R 550 N/P 125Inventory 750 C.L. 500C.A. 1,500
LTD 1,000NFA 2,250 C/S 1,140
R/E 1,110Total 3,750 Total 3,750
24

Weaknesses of the Percent-of-Sales Approach
The percent-of-sales approach has three weaknesses:
1. It is unrealistic to assume that all expenses will remain
exactly the same percent of sales from one fiscal year to the
next.
2. With the percent-of-sales method, a company is essentially
locked into a given profit margin.
3. The percent-of-sales approach assumes that all of the firm’s
costs are variable. Fixed costs create “leverage”.
25
Example
Vectra ManufacturingActual and Pro Forma Income Statements (POS Approach)
2002 Percent 2003 Percent(Actual) of sales (Pro Forma) of sales
Sales 100,000 140,000Less: COGS 80,000 80% 112,000 80%Gross Margin 20,000 20% 28,000 20%Less: Operating expenses 10,000 10% 14,000 10%Operating earnings 10,000 14,000Less: Interest expenses 1,000 1% 1,400 1%Earnings before taxes 9,000 12,600Less: Taxes (15%) 1,350 1,890Net income after tax 7,650 7.7% 10,710 7.7%
Common share dividends 4,000 5,600Earnings retained 3,650 5,110
26
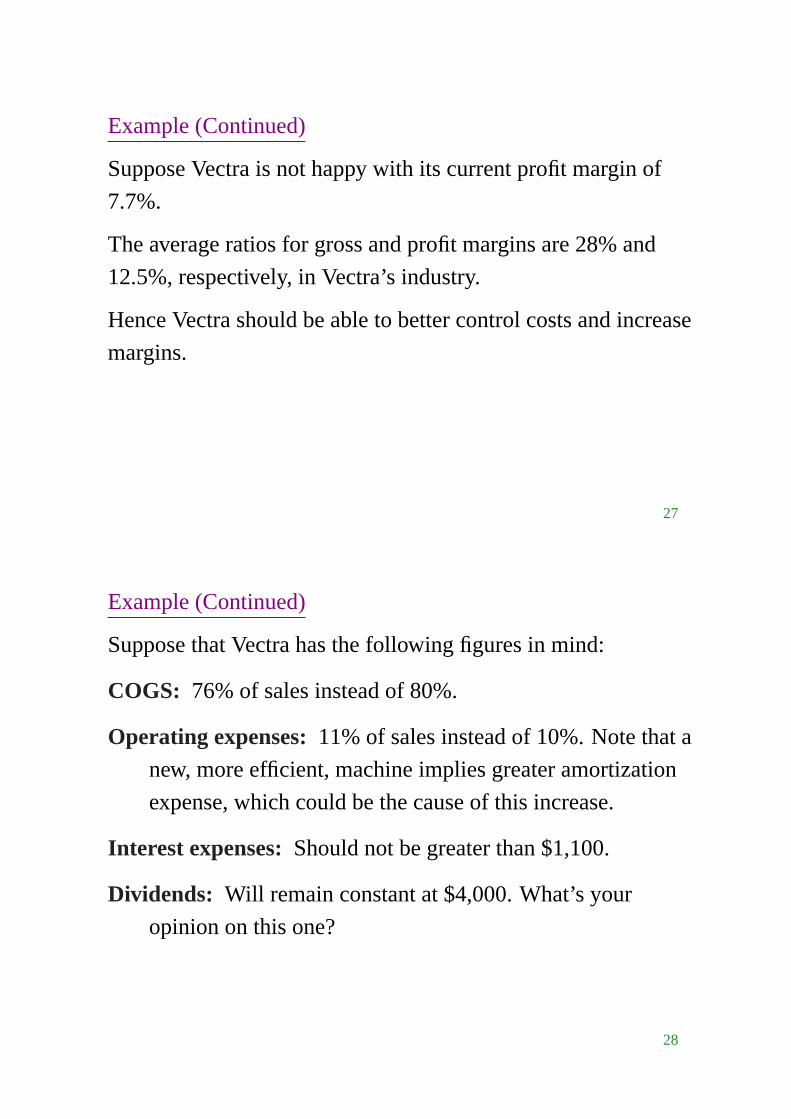
Example (Continued)
Suppose Vectra is not happy with its current profit margin of
7.7%.
The average ratios for gross and profit margins are 28% and
12.5%, respectively, in Vectra’s industry.
Hence Vectra should be able to better control costs and increase
margins.
27
Example (Continued)
Suppose that Vectra has the following figures in mind:
COGS: 76% of sales instead of 80%.
Operating expenses:11% of sales instead of 10%. Note that a
new, more efficient, machine implies greater amortization
expense, which could be the cause of this increase.
Interest expenses:Should not be greater than $1,100.
Dividends: Will remain constant at $4,000. What’s your
opinion on this one?
28
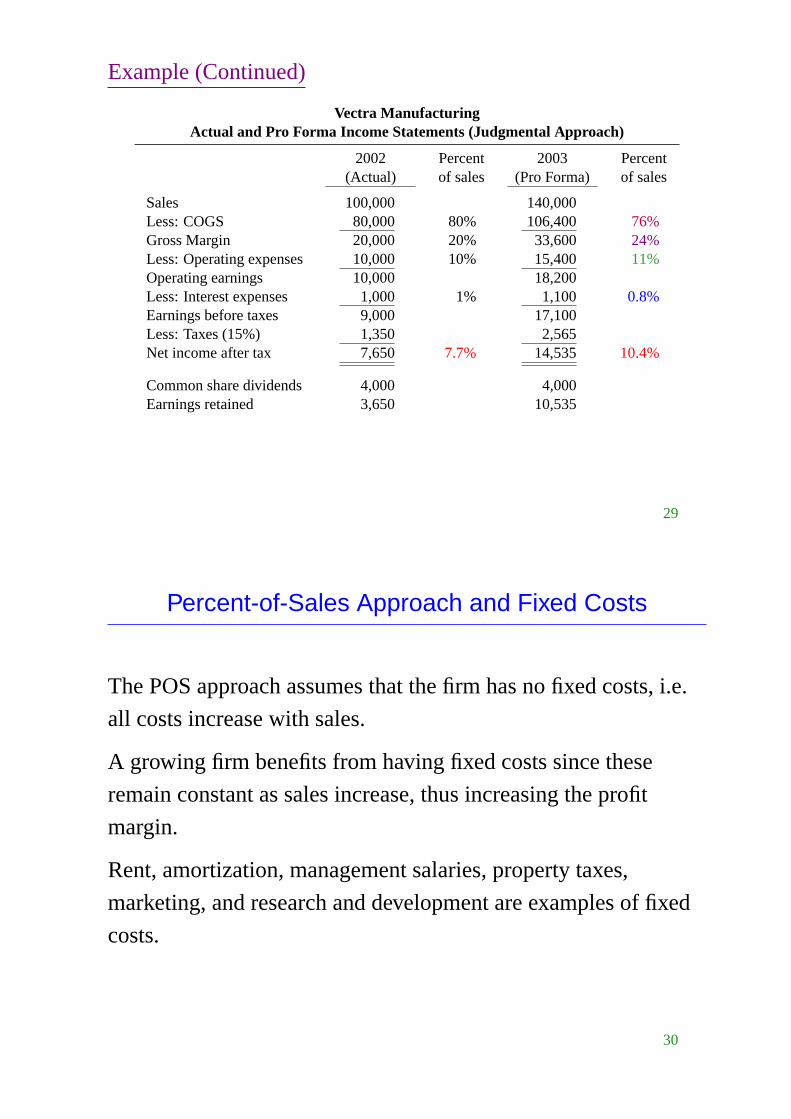
Example (Continued)
Vectra ManufacturingActual and Pro Forma Income Statements (Judgmental Approach)
2002 Percent 2003 Percent(Actual) of sales (Pro Forma) of sales
Sales 100,000 140,000Less: COGS 80,000 80% 106,400 76%Gross Margin 20,000 20% 33,600 24%Less: Operating expenses 10,000 10% 15,400 11%Operating earnings 10,000 18,200Less: Interest expenses 1,000 1% 1,100 0.8%Earnings before taxes 9,000 17,100Less: Taxes (15%) 1,350 2,565Net income after tax 7,650 7.7% 14,535 10.4%
Common share dividends 4,000 4,000Earnings retained 3,650 10,535
29
Percent-of-Sales Approach and Fixed Costs
The POS approach assumes that the firm has no fixed costs, i.e.
all costs increase with sales.
A growing firm benefits from having fixed costs since these
remain constant as sales increase, thus increasing the profit
margin.
Rent, amortization, management salaries, property taxes,
marketing, and research and development are examples of fixed
costs.
30

Variable and Semi-Variable Costs
Variable costs, on the other hand, always vary with sales.
Examples of these are raw material, labour, factory overhead and
sales commissions.
Note that there also are semi-variable costs, which vary with
sales only once they have reached a certain level. That is,
semi-variable costs will not vary for low sales levels.
Take equipment maintenance, for example. A minimum amount
of maintenance must always be performed regardless of the sales
level but more maintenance must be performed as sales increase
beyond a certain point.
31
Profit Margin and Fixed Costs
Let
S ≡ Sales (in $), v ≡ Variable costs per $ sold,
F ≡ Fixed Costs, t ≡ Corporate Tax Rate.
EBT = S− vS− F
NIAT = (1− t)((1−v)S− F),
where NIAT is net income after taxes.
32
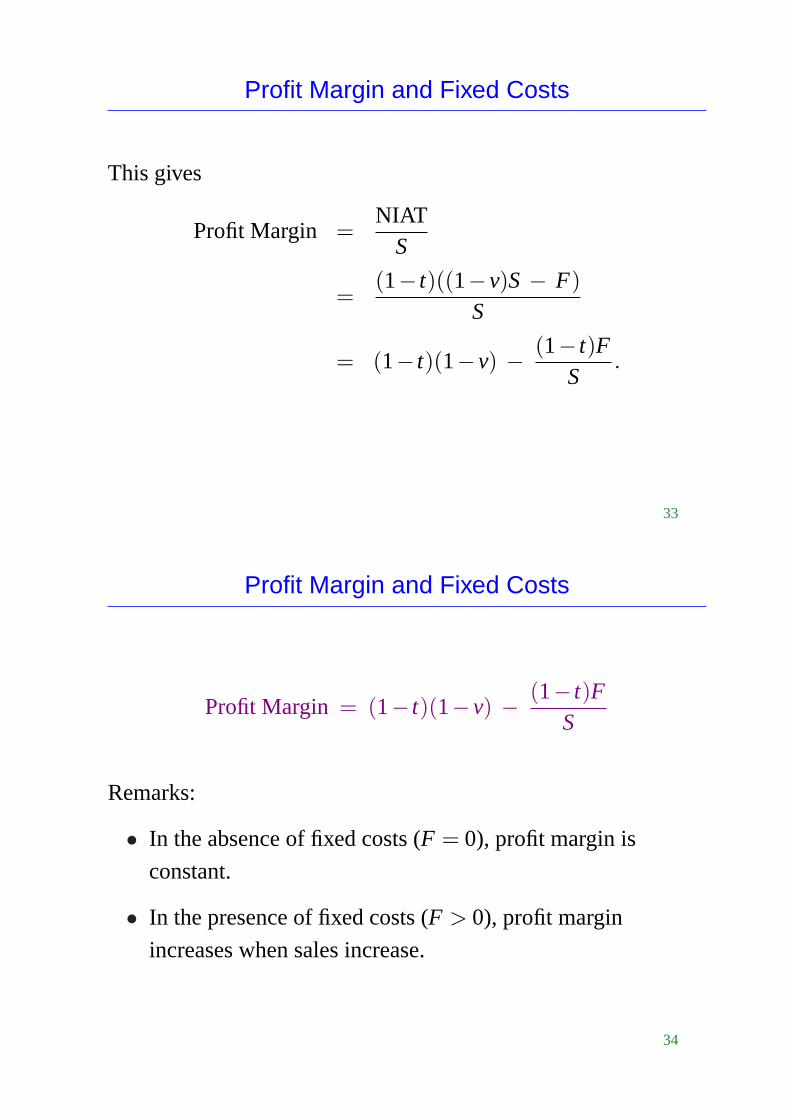
Profit Margin and Fixed Costs
This gives
Profit Margin =NIAT
S
=(1− t)((1−v)S− F)
S
= (1− t)(1−v) − (1− t)FS
.
33
Profit Margin and Fixed Costs
Profit Margin = (1− t)(1−v) − (1− t)FS
Remarks:
• In the absence of fixed costs (F = 0), profit margin is
constant.
• In the presence of fixed costs (F > 0), profit margin
increases when sales increase.
34

Profit Margin and Fixed Costs
In the Vectra example, suppose that, in 2002, fixed costs were$21,000: $12,000 in COGS, $8,000 in operating expenses (OE)and $1,000 in interest expenses. As a fraction of sales, variablecosts were then
Variable CostsSales
=Variable COGS+ Variable OE
S
=(80,000−12,000) + (10,000−8,000)
100,000
=68,000+2,000
100,000= 70%.
35
Profit Margin and Fixed Costs
If variable costs remain 70% of sales and if fixed costs remain
$21,000, net income after taxes (NIAT) in 2003 is expected to be
NIAT = (1− t)((1−v)S− F)
= 0.85× (0.30×140,000− 21,000)
= 17,850
and the profit margin is expected to be
NIATS
=17,850140,000
= 12.75%.
36

Same thing, but using the income statements.
Vectra ManufacturingActual and Pro Forma Income Statements (Judgmental Approach)
2002 Percent 2003 Percent(Actual) of sales (Pro Forma) of sales
Sales 100,000 140,000Less: COGS
Fixed 12,000 12,000Variable 68,000 68% 95,200 68%
Gross Margin 20,000 32,800Less: Operating expenses
Fixed 8,000 8,000Variable 2,000 2% 2,800 2%
Operating earnings 10,000 22,000Less: Interest expenses 1,000 1,000Earnings before taxes 9,000 21,000Less: Taxes (15%) 1,350 3,150Net income after tax 7,650 7.65% 17,850 12.75%
37
4.3 Preparing the Pro Forma Balance Sheet
In what follows, the pro forma balance sheet for Vectra
Manufacturing will be prepared using thejudgmental approach.
Vectra Manufacturing2002 Financial Statements (Actual)
Income Statement
Sales 100,000COGS (80,000)Op. expenses (10,000)Interest (1,000)EBT 9,000Taxes (15%) (1,350)Net income 7,650
Dividends 4,000Earnings ret. 3,650
Balance Sheet
Cash 6,000 A/P 7,000M/S 4,000 Taxes payable 300A/R 13,000 Line of credit 8,300Inv. 16,000 Other 3,400C.A. 39,000 C.L. 19,000
LTD 18,000NFA 51,000 C/S 30,000
R/E 23,000Total 90,000 Total 90,000
38
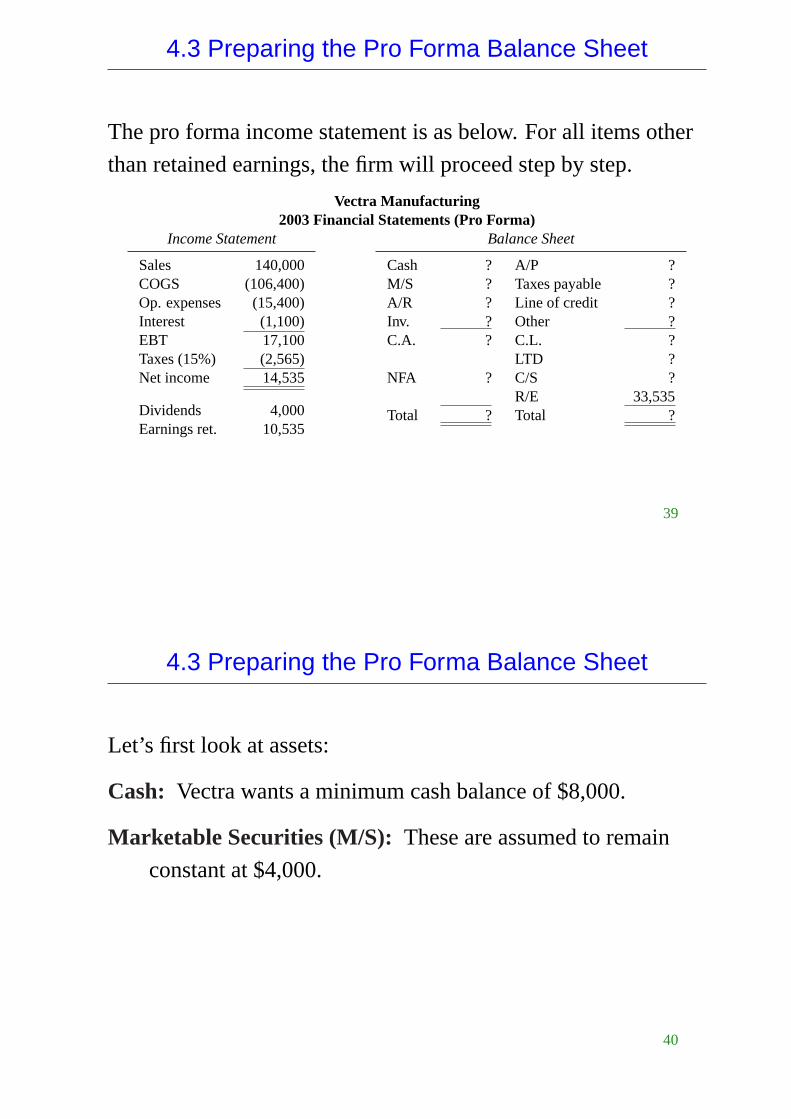
4.3 Preparing the Pro Forma Balance Sheet
The pro forma income statement is as below. For all items other
than retained earnings, the firm will proceed step by step.
Vectra Manufacturing2003 Financial Statements (Pro Forma)
Income Statement
Sales 140,000COGS (106,400)Op. expenses (15,400)Interest (1,100)EBT 17,100Taxes (15%) (2,565)Net income 14,535
Dividends 4,000Earnings ret. 10,535
Balance Sheet
Cash ? A/P ?M/S ? Taxes payable ?A/R ? Line of credit ?Inv. ? Other ?C.A. ? C.L. ?
LTD ?NFA ? C/S ?
R/E 33,535Total ? Total ?
39
4.3 Preparing the Pro Forma Balance Sheet
Let’s first look at assets:
Cash: Vectra wants a minimum cash balance of $8,000.
Marketable Securities (M/S): These are assumed to remain
constant at $4,000.
40
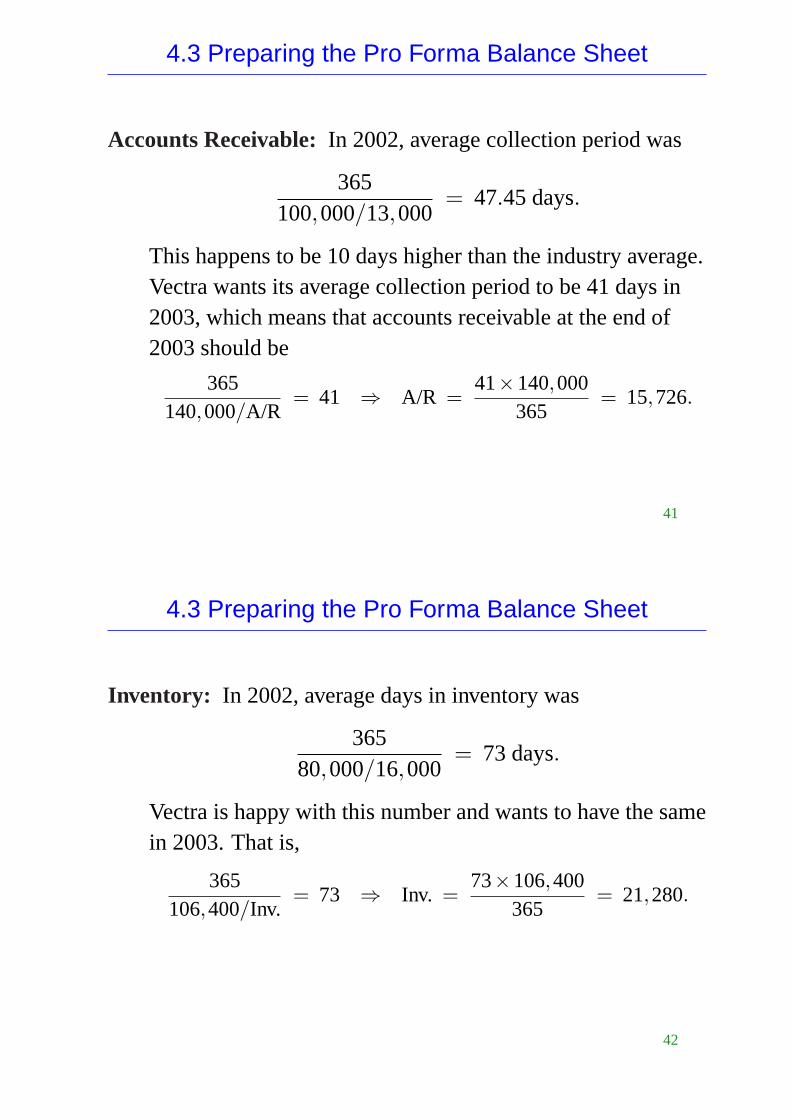
4.3 Preparing the Pro Forma Balance Sheet
Accounts Receivable:In 2002, average collection period was
365100,000/13,000
= 47.45days.
This happens to be 10 days higher than the industry average.Vectra wants its average collection period to be 41 days in2003, which means that accounts receivable at the end of2003 should be
365140,000/A/R
= 41 ⇒ A/R =41×140,000
365= 15,726.
41
4.3 Preparing the Pro Forma Balance Sheet
Inventory: In 2002, average days in inventory was
36580,000/16,000
= 73days.
Vectra is happy with this number and wants to have the samein 2003. That is,
365106,400/Inv.
= 73 ⇒ Inv. =73×106,400
365= 21,280.
42
4.3 Preparing the Pro Forma Balance Sheet
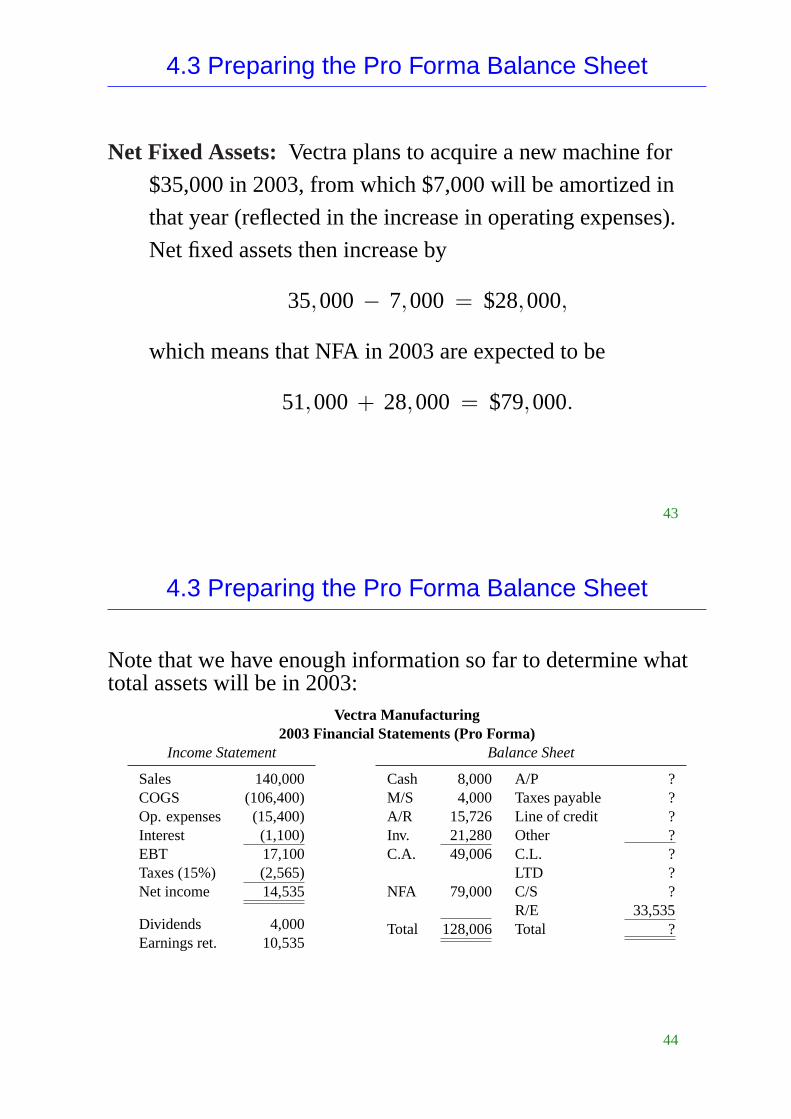
Net Fixed Assets:Vectra plans to acquire a new machine for
$35,000 in 2003, from which $7,000 will be amortized in
that year (reflected in the increase in operating expenses).
Net fixed assets then increase by
35,000− 7,000 = $28,000,
which means that NFA in 2003 are expected to be
51,000 + 28,000 = $79,000.
43
4.3 Preparing the Pro Forma Balance Sheet
Note that we have enough information so far to determine whattotal assets will be in 2003:
Vectra Manufacturing2003 Financial Statements (Pro Forma)
Income Statement
Sales 140,000COGS (106,400)Op. expenses (15,400)Interest (1,100)EBT 17,100Taxes (15%) (2,565)Net income 14,535
Dividends 4,000Earnings ret. 10,535
Balance Sheet
Cash 8,000 A/P ?M/S 4,000 Taxes payable ?A/R 15,726 Line of credit ?Inv. 21,280 Other ?C.A. 49,006 C.L. ?
LTD ?NFA 79,000 C/S ?
R/E 33,535Total 128,006 Total ?
44

4.3 Preparing the Pro Forma Balance Sheet
Let’s now consider liabilities and equity:
Accounts Payable: Purchases are 45% of COGS and Vectra’s
average payment period in 2002 was
365(0.45×80,000)/7,000
= 71days.
Suppliers want this average to be reduced to 62 days in2003, which translates into
365(0.45×106,400)/A/P
= 62days ⇒ A/P =62×0.45×106,400
365= 8,133.
45
4.3 Preparing the Pro Forma Balance Sheet
Taxes Payable:These are assumed to be 25% of the tax amount
that appears on the income statement, which is, for 2003,
25%×2,565 = 641.
Other Current Liabilities: Remain unchanged.
Line of Credit: Depends on the financing plan.
Long-Term Debt: Depends on the financing plan.
Common Stock: Depends on the financing plan.
46
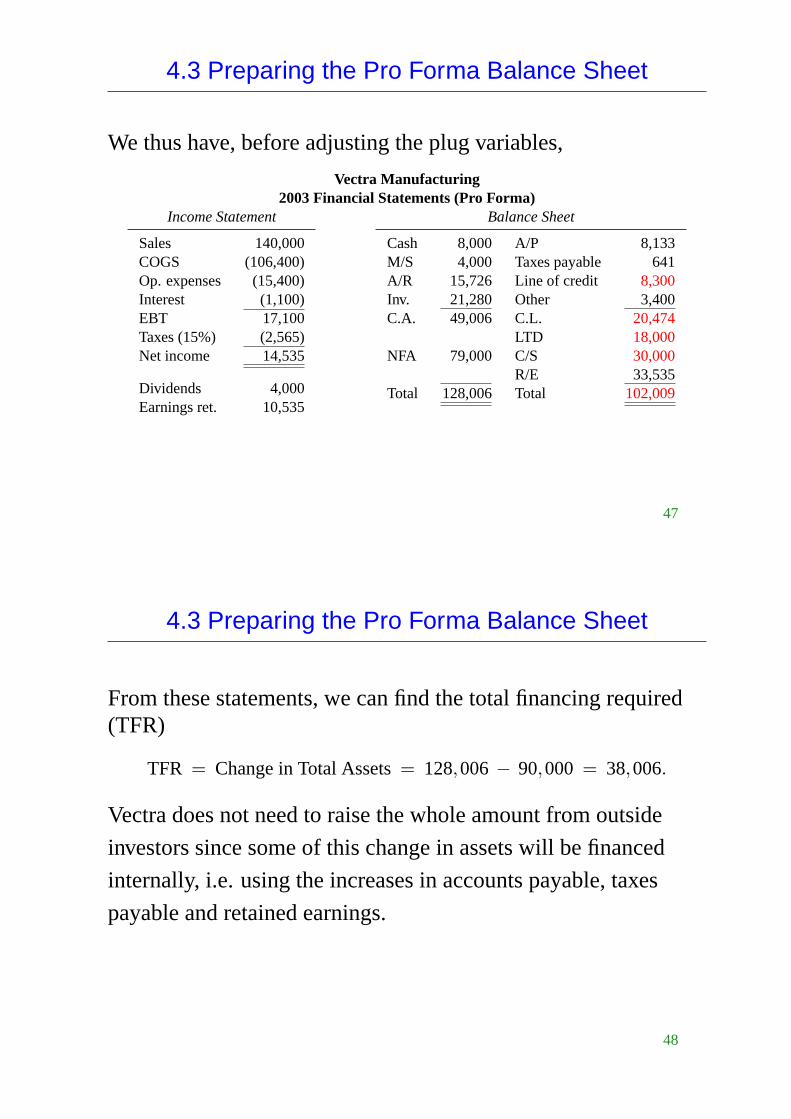
4.3 Preparing the Pro Forma Balance Sheet
We thus have, before adjusting the plug variables,
Vectra Manufacturing2003 Financial Statements (Pro Forma)
Income Statement
Sales 140,000COGS (106,400)Op. expenses (15,400)Interest (1,100)EBT 17,100Taxes (15%) (2,565)Net income 14,535
Dividends 4,000Earnings ret. 10,535
Balance Sheet
Cash 8,000 A/P 8,133M/S 4,000 Taxes payable 641A/R 15,726 Line of credit 8,300Inv. 21,280 Other 3,400C.A. 49,006 C.L. 20,474
LTD 18,000NFA 79,000 C/S 30,000
R/E 33,535Total 128,006 Total 102,009
47
4.3 Preparing the Pro Forma Balance Sheet
From these statements, we can find the total financing required(TFR)
TFR = Change in Total Assets= 128,006− 90,000 = 38,006.
Vectra does not need to raise the whole amount from outside
investors since some of this change in assets will be financed
internally, i.e. using the increases in accounts payable, taxes
payable and retained earnings.
48

4.3 Preparing the Pro Forma Balance Sheet
The funds raised from outside investors, theexternal financing
required, is found as follows:
Total financing required 38,006
Less: Internal sources
Increase in accounts payable 1,133
Increase in taxes payable 341
Reinvested profits 10,535
Total internal sources 15,009
External financing required 25,997
49
4.3 Preparing the Pro Forma Balance Sheet
Note that my example differs from the one in the book as I
assumed the dividend payment to remain $4,000.
Now that you know Vectra’s external financing required, what
are your suggestions regarding a possible financing plan?
50