workforce training results 2015 training results 2015 workforce training and education coordinating...
TRANSCRIPT

Workforce Training Results 2015
Workforce Training and Education Coordinating Board128 10th Avenue SW, PO Box 43105, Olympia, 98504-3105
360-709-4600 • www.wtb.wa.gov


Table of Contents
Workforce Training Results 2015 Executive Summary . . . . . . . . . . . . . . . . . . . . . . . . . . . . . . . 1
Apprenticeship . . . . . . . . . . . . . . . . . . . . . . . . . . . . . . . . . . . . . . . . . . . . . . . . . . . . . . . . . . . . . . . . . . . . . 4
Basic Education for Adults . . . . . . . . . . . . . . . . . . . . . . . . . . . . . . . . . . . . . . . . . . . . . . . . . . . . . . . . . . 7
Community and Technical College (CTC) Professional-Technical Education . . . . . . . . .10
Department of Services for the Blind (DSB) . . . . . . . . . . . . . . . . . . . . . . . . . . . . . . . . . . . . . . . .13
Division of Vocational Rehabilitation (DVR) . . . . . . . . . . . . . . . . . . . . . . . . . . . . . . . . . . . . . . . .16
Private Career Schools . . . . . . . . . . . . . . . . . . . . . . . . . . . . . . . . . . . . . . . . . . . . . . . . . . . . . . . . . . . .19
Secondary Career and Technical Education (CTE) . . . . . . . . . . . . . . . . . . . . . . . . . . . . . . . . . .22
Worker Retraining at Community and Technical Colleges . . . . . . . . . . . . . . . . . . . . . . . . . .25
WorkFirst . . . . . . . . . . . . . . . . . . . . . . . . . . . . . . . . . . . . . . . . . . . . . . . . . . . . . . . . . . . . . . . . . . . . . . . . . .28
Workforce Investment Act Title I-B Adult Program . . . . . . . . . . . . . . . . . . . . . . . . . . . . . . . . .30
Workforce Investment Act Title I-B Program for Dislocated Workers . . . . . . . . . . . . . . . .33
Workforce Investment Act Title I-B Youth Program . . . . . . . . . . . . . . . . . . . . . . . . . . . . . . . . .36
Workforce Development System Overall Results . . . . . . . . . . . . . . . . . . . . . . . . . . . . . . . . . . .39


Workforce Training and Education Coordinating Board Workforce Training Results 2015 | 1
WORKFORCE TRAINING RESULTS 2015 EXECUTIVE SUMMARY
Despite being five years removed from the official end of the recession, recovery has been slow, especially for populations facing challenges to finding employment. This report, which offers details on employment, wages and completion rates among workforce participants, shows that even in a slow recovery, our state’s workforce programs had mostly positive results for participants. By using common methods and applying them across a wide range of workforce programs, Workforce Training Results offers a comprehensive and consistent, program-by-program look at Washington’s workforce system.
IntroductionThe following questions and others concerning our state’s workforce development system are a driving force behind this publication and the efforts of the Workforce Training and Education Coordinating Board (Workforce Board).
• Did participants of workforce programs get the skills they needed?
• After leaving the program, were participants employed?
• How much did they earn?
• Were program participants and their employers satisfied?
• Did the participant and public get a good return on investment?
These five questions are the basis for Washington’s Workforce Core Measures. Adopted in 1996 after extensive research and stakeholder work, core measures were created to provide a common framework to measure our workforce system’s progress across a wide variety of programs. While each program typically has multiple performance measures, many of them mandated by the U.S. Department of Labor and the U.S. Department of Education, these state core measures give Washington policymakers, workforce professionals, and the public a consistent look at the results of our workforce system.
These performance measures have stood the test of time by being both balanced and revealing. These state-developed measures were a major source for the National Governors Association in making recommendations to Congress about performance measurement for the federal workforce development system. The recent reauthorization of much of that federal system through the Workforce Innovation and Opportunity Act (WIOA) includes new performance measures very similar to the State Core Measures that have been used in Washington for over 15 years.
In addition to these performance measures, we also summarize the strengths of our state’s workforce programs, along with areas for improvement and further research.
2 | Workforce Training Results 2015 Workforce Training and Education Coordinating Board
Who We AreThe Workforce Board is a partnership of business, labor, and government dedicated to helping Washington residents obtain and succeed in family-wage jobs, while meeting employers’ needs for skilled workers. We are the state’s performance accountability agent, working on behalf of Washington’s citizens and employers.
To achieve these objectives, the Workforce Board tracks the results of 12 of the state’s largest workforce programs. These programs account for about 95 percent of the federal and state dollars spent on our state’s workforce training system – nearly $780 million per year.
Our workforce participants have a broad range of ages, abilities and backgrounds--from high school students who require relevant, applied learning to stay in school, to low-skilled working adults who need more education to earn a living wage, to the recently laid off retooling for new careers.
This publication summary provides a system-wide view plus a dashboard look at each of the state’s 12 major workforce programs. For more detailed program results see: www.wtb.wa.gov/WorkforceTrainingResults.asp
How We Track Results - Workforce Core MeasuresThe following questions, and their answers, provide a simple and reliable way to analyze our system’s progress.
Did Program Participants Get the Skills They Needed?Desired Outcome: Washington’s workforce possesses the skills and abilities required in the workplace.
Participants in workforce development programs acquire a variety of skills and abilities by participating in these programs. In many programs, the attainment of skills and abilities is marked by participants receiving diplomas, certificates, degrees, or other credentials. The Skill Attainment Core Measure is the percentage or number of participants leaving the program who achieved the appropriate skill gains or were awarded the relevant educational or skill credential. The Workforce Board measures this indicator through administrative records. It’s important to note that Workforce Training Results measures skill attainment rates for ALL participants, not just those who receive training.
After Leaving the Program, Were Participants Employed?Desired Outcome: Washington’s workers are employed.
The Workforce Board evaluates the labor market outcomes of program participants by examining their employment and earnings during the third quarter after leaving a program. The Employment Core Measure for adults is the percentage of former program participants with employment six to nine months after leaving the program, using records from state and federal employment records. The measure for programs serving youth uses the same data sources but also looks at school records to account for students pursuing further education.
How Much Do Program Participants Earn?Desired Outcome: Washington’s workers achieve a family-wage standard of living.
The Earnings Core Measure is the median earnings of employed program participants six to nine months after leaving the program, excluding former participants who are enrolled in further education during that quarter. Data comes from state employment records. The Workforce Board looks at the third quarter for employment and earnings because experience has shown that the third quarter provides the most reliable information for gauging, within a useful period of time, the program’s lasting effect on participants.

Workforce Training and Education Coordinating Board Workforce Training Results 2015 | 3
Are Employers Satisfied?Desired Outcome: Employers who hire workforce program participants are satisfied with the results.
The Workforce Board uses surveys to measure customer satisfaction with workforce programs and program completers. The Employer Satisfaction Core Measure is the percentage of employers who report in the Employer Survey that they are satisfied with new employees who had completed a workforce program. Because our sample size would be too small, we do not measure employer satisfaction for those smaller programs where too few employers have experience with the program.
Are Participants Satisfied?Desired Outcome: Workforce program participants are satisfied with the results.
The Workforce Board uses surveys to measure participant satisfaction with workforce programs. The Participant Satisfaction Core Measure is the percentage of participants who report in the Participant Survey that they are satisfied overall with the programs.
Did the Participant and Public Get a Good Return on Investment?Desired Outcome: Workforce development programs provide returns that exceed program costs.
Every four years, the Workforce Board conducts net impact and cost-benefit analyses of workforce development programs. The Taxpayer Return on Investment Measure is the net impact on all tax revenue and social welfare payments compared to the cost of the services. The Participant Return on Investment Measure is the net impact on participant earnings and employer provided benefits compared to the cost of the services.
This part of the study examined earnings and employment of program participants with those of individuals who did not participate in a workforce program, but had similar characteristics and faced the same regional labor market at the same time.

4 | Workforce Training Results 2015 Workforce Training and Education Coordinating Board
Apprenticeship
Training that combines classroom instruction with paid, on-the-job training under the supervision of a journey-level craft person or trade professional. Apprenticeships are governed by the Washington State Apprenticeship and Training Council and administered by the Department of Labor and Industries (L&I).
State Core Indicator Results
Employment - Percentage of participants who were employed, as reported to the Employment Security Department during the third quarter after leaving the program.*
All 75% Completers
86%
Earnings - Median annualized earnings six to nine months after leaving the program. (Quarterly earnings are the result of hourly wage rates and the number of hours worked in a calendar quarter. To derive annualized earnings, quarterly earnings are multiplied by four.)
All $51,504 Completers
$67,551
Skills - Percentage of participants who obtained an appropriate credential. (Percentage based on all participants, including those who did not receive training through the program.)
54%
Participant Satisfaction - Percentage of participants, including non-completers, who reported satisfaction with the program, as evidenced by survey responses six to nine months after leaving the program.
Classroom Training: 87%On-The-Job
Training: 89%
Employer Satisfaction - Percentage of employers who reported satisfaction with new employees who were program completers as evidenced by survey responses.
88%
Net Employment Impact - Difference between the employment rate for all participants and the control group of non-participants, measured between two and three years after leaving the program.
9.8 percentage points
Net Earnings Impact - Difference between the average annualized earnings for all participants and the control group of non-participants, measured between two and three years after leaving the program.
$19,257
Participant Return on Public Investment - The ratio of the present values of additional lifetime participant earnings and employee benefits to public costs of the program. Additional lifetime participant earnings and benefits are additional earnings and employee benefits received (minus participant program costs, taxes on added income, and any loss in unemployment insurance benefits), when compared to the non-participant control group.
$91 to 1
Taxpayer Return on Investment - The ratio of the present values of projected additional lifetime taxes paid by the participant (plus any decrease in unemployment insurance benefits), in comparison to the public costs of the program. Additional taxes are those additional taxes projected to be paid in comparison to the taxes projected to be paid by the non-participant control group. Change in unemployment insurance benefits is the change in benefits paid to participants compared to the non-participant control group.
$23 to 1
*Includes some out-of-state employment data but not all of it and does not include data on self-employment.

Workforce Training and Education Coordinating Board Workforce Training Results 2015 | 5
Employment Rate - Percent of Apprenticeship Participants with Reported Employment in Third Quarter after Exiting Program
75%61%
2010 2011 2012 2013 2014
2010 2011 2012 2013 2014
$51,504
$41,241
0%
20%
40%
60%
80%
$0
$15,000
$30,000
$45,000
$60,000
Perc
ent E
mpl
oyed
Med
ian
Earn
ings
Earnings - Median Annualized Earnings of Participants in Third Quarter after Exiting Program (First Quarter 2014 dollars)
75%61%
2010 2011 2012 2013 2014
2010 2011 2012 2013 2014
$51,504
$41,241
0%
20%
40%
60%
80%
$0
$15,000
$30,000
$45,000
$60,000
Perc
ent E
mpl
oyed
Med
ian
Earn
ings
Employment & Earning Indicators Over Time
Apprenticeship has been proven to be a very successful training program based on both employment and earnings outcomes and cost-benefit analysis. Moreover, public costs are low, as trust funds established by employers and workers cover the majority of the expense. Employers continue to report high levels of satisfaction with the skills of those who completed an apprenticeship program, and participants report they are satisfied with the program.
This evaluation does find some areas that could be stronger. The median age of those leaving apprenticeships is 30. More should be done to enroll younger people and women (9 percent of participants are women) into apprenticeships, especially in higher paying fields. The most recent hourly wages and annual earnings of women are only 63 percent of men’s wages. Finally, while Washington’s apprenticeship program continues to enroll people of color at rates similar to their population in the state, there continues to be disparities between the post-program wages and earnings for people of color compared to whites. This suggests that minority groups may not be enrolling in the higher paying fields. This issue needs continued attention.

6 | Workforce Training Results 2015 Workforce Training and Education Coordinating Board
A related issue is the high number of apprenticeships in the construction industry. This year over half of those who found work did so in construction. This percent has risen in recent years as construction has recovered from the housing bust. In the 2011 report, only a quarter of apprenticeship employees found work in construction. While the growth in construction is positive, ideally apprenticeships would grow in other industries, which would also help address the gender imbalance.
This year’s report also found a strong return for apprenticeship participants who completed training. The employment rate for completers was 11 percentage points higher than for all participants, and earnings were 31 percent higher.
The Apprenticeship Section of the Department of Labor and Industries and the apprenticeship community recognize the importance of recruiting and retaining more women and people of color into high paying apprenticeship programs. They are engaged in activities to make this happen. For example, the Apprenticeship Section is partnering with the state’s Department of Transportation to prepare women and people of color for jobs related to highway construction and maintenance. The Apprenticeship Section is also addressing the need to enroll younger participants; for example by establishing culinary arts and early child care programs that begin in middle and high schools. The Washington State Apprenticeship and Training Council has developed and formalized an Apprenticeship Preparation Program recognition process for preparatory or pre-apprenticeship programs. The purpose is to build a recognized pipeline for apprenticeship preparation throughout the state.
For more detailed study results for this program, go to www.wtb.wa.gov/WorkforceTrainingResults.asp
Apprenticeship Continued

Workforce Training and Education Coordinating Board Workforce Training Results 2015 | 7
Basic Education for Adults (BEdA)
Literacy and math instruction for adults whose skills are at or below the eighth grade level, GED Test Preparation, high school completion for adults who want to earn an adult high school diploma and ESL instruction. Students receiving both basic skills instruction and job training are included in the evaluation of the professional-technical training or worker retraining programs and not in the evaluation of basic skills instruction. Students receive basic skills instruction at community and technical colleges (98 percent) and other organizations such as libraries and community-based organizations (2 percent).
State Core Indicator Results
Employment - Percentage of participants who were employed, as reported to the Employment Security Department during the third quarter after leaving the program.*
51%
Earnings - Median annualized earnings six to nine months after leaving the program. (Quarterly earnings are the result of hourly wage rates and the number of hours worked in a calendar quarter. To derive annualized earnings, quarterly earnings are multiplied by four.)
$17,764
Skills - Percentage of participants who obtained an appropriate credential. (Percentage based on all participants, including those who did not receive training through the program.)
n/a**
Participant Satisfaction - Percentage of participants, including non-completers, who reported satisfaction with the program, as evidenced by survey responses six to nine months after leaving the program.
94%
Employer Satisfaction - Percentage of employers who reported satisfaction with new employees who were program completers as evidenced by survey responses.
95%
Net Employment Impact - Difference between the employment rate for all participants and the control group of non-participants, measured between two and three years after leaving the program.
No Significant Positive Impact
Net Earnings Impact - Difference between the average annualized earnings for all participants and the control group of non-participants, measured between two and three years after leaving the program.
$905
Participant Return on Public Investment - The ratio of the present values of additional lifetime participant earnings and employee benefits to public costs of the program. Additional lifetime participant earnings and benefits are additional earnings and employee benefits received (minus participant program costs, taxes on added income, and any loss in unemployment insurance benefits), when compared to the non-participant control group.
No Significant Positive Impact
Taxpayer Return on Investment - The ratio of the present values of projected additional lifetime taxes paid by the participant (plus any decrease in unemployment insurance benefits), in comparison to the public costs of the program. Additional taxes are those additional taxes projected to be paid in comparison to the taxes projected to be paid by the non-participant control group. Change in unemployment insurance benefits is the change in benefits paid to participants compared to the non-participant control group.
No Significant Positive Impact
*Includes some out-of-state employment data but not all of it and does not include data on self-employment. **Not available because not measured as part of this evaluation.

8 | Workforce Training Results 2015 Workforce Training and Education Coordinating Board
Employment Rate - Percent of Basic Education for Adult Participants with Reported Employment in Third Quarter after Exiting Program
51%46%
2010 2011 2012 2013 2014
2010 2011 2012 2013 2014
$17,764$17,667
0%
20%
40%
60%
80%
$0
$15,000
$30,000
$45,000
$60,000
Perc
ent E
mpl
oyed
Med
ian
Earn
ings
Earnings - Median Annualized Earnings of Participants in Third Quarter after Exiting Program (First Quarter 2014 dollars)
51%46%
2010 2011 2012 2013 2014
2010 2011 2012 2013 2014
$17,764$17,667
0%
20%
40%
60%
80%
$0
$15,000
$30,000
$45,000
$60,000
Perc
ent E
mpl
oyed
Med
ian
Earn
ings
Employment & Earning Indicators Over Time
Basic Education for Adults has historically had a significantly higher minority enrollment than is reflected in the state’s overall population. This can be attributed, at least in part, to the higher poverty rates among some groups and higher levels of limited English proficiency, both of which Basic Education addresses. This higher minority representation was again the case this year, particularly among Hispanics who made up 22 percent of participants, but 12 percent of Washington’s wider population. Women were more prevalent (59 percent) than men among participants.
Employment and earnings are up a bit in this year’s report, although the results remain weak overall for students who participate in Basic Education for Adults without also receiving professional-technical training. This has been documented in previous Workforce Training Results reports. Although participants report high levels of satisfaction with their program, the study does not find a significant positive impact on the average participant’s employment and hourly wages. On a positive note, there has been a general trend over time toward meeting more participant needs for support services.

Workforce Training and Education Coordinating Board Workforce Training Results 2015 | 9
Basic Education for Adults (BEdA) Continued
Basic Education program administrators hope to see an increased focus on pathways to college and careers as the new Workforce Innovation and Opportunity Act is implemented in the coming year. A more direct connection between Basic Education and this far-reaching federal workforce act, with its focus on employment and training, may also increase male participation over time.
However, the findings show a significant positive impact on employment and earnings for students who participated in I-BEST, which pairs two instructors in the classroom—one to teach professional and technical content and the other to teach basic skills in reading, math, writing or English language. This combination of basic education and job skills training allows students to move through school and into employment faster. The results for I-BEST are strong evidence of the importance of investing resources in this model, which originated in Washington and has since been replicated in a number of other states.
For more detailed study results for this program, go to www.wtb.wa.gov/WorkforceTrainingResults.asp

10 | Workforce Training Results 2015 Workforce Training and Education Coordinating Board
Community and Technical College (CTC) Professional-Technical Education
Training and education for a vocational associate of arts degree or a vocational certificate.
State Core Indicator Results
Employment - Percentage of participants who were employed, as reported to the Employment Security Department during the third quarter after leaving the program.*
All 66%Completers
71%
Earnings - Median annualized earnings six to nine months after leaving the program. (Quarterly earnings are the result of hourly wage rates and the number of hours worked in a calendar quarter. To derive annualized earnings, quarterly earnings are multiplied by four.)
All $27,220Completers
$29,817
Skills - Percentage of participants who obtained an appropriate credential. (Percentage based on all participants, including those who did not receive training through the program.)
61%
Participant Satisfaction - Percentage of participants, including non-completers, who reported satisfaction with the program, as evidenced by survey responses six to nine months after leaving the program.
93%
Employer Satisfaction - Percentage of employers who reported satisfaction with new 96%
Net Employment Impact - Difference between the employment rate for all participants and the control group of non-participants, measured between two and three years after leaving the program.
10.1 percentage
points
Net Earnings Impact - Difference between the average annualized earnings for all participants and the control group of non-participants, measured between two and three years after leaving the program.
$9,467
Participant Return on Public Investment - The ratio of the present values of additional lifetime participant earnings and employee benefits to public costs of the program. Additional lifetime participant earnings and benefits are additional earnings and employee benefits received (minus participant program costs, taxes on added income, and any loss in unemployment insurance benefits), when compared to the non-participant control group.
$13 to 1
Taxpayer Return on Investment - The ratio of the present values of projected additional lifetime taxes paid by the participant (plus any decrease in unemployment insurance benefits), in comparison to the public costs of the program. Additional taxes are those additional taxes projected to be paid in comparison to the taxes projected to be paid by the non-participant control group. Change in unemployment insurance benefits is the change in benefits paid to participants compared to the non-participant control group.
$3 to 1
*Includes some out-of-state employment data but not all of it and does not include data on self-employment.
employees who were program completers as evidenced by survey responses.

Workforce Training and Education Coordinating Board Workforce Training Results 2015 | 11
Employment & Earning Indicators Over TimeEmployment Rate - Percent of Professional-Technical Education Participants with Reported Employment in Third Quarter after Exiting Program
66%61%
2010 2011 2012 2013 2014
2010 2011 2012 2013 2014
0%
20%
40%
60%
80%
$27,220$26,580
$0
$15,000
$30,000
$45,000
$60,000
Perc
ent E
mpl
oyed
Med
ian
Earn
ings
Earnings - Median Annualized Earnings of Participants in Third Quarter after Exiting Program (First Quarter 2014 dollars)
66%61%
2010 2011 2012 2013 2014
2010 2011 2012 2013 2014
0%
20%
40%
60%
80%
$27,220$26,580
$0
$15,000
$30,000
$45,000
$60,000
Perc
ent E
mpl
oyed
Med
ian
Earn
ings
Community and Technical Colleges (CTC) Professional-Technical Education training covers a broad range of occupational fields and credentials, from one-year certificates to two-year technical degrees.
While the length of time spent in the program (the median was 16 months) was relatively short, nearly two-thirds of participants earned a credential. In addition, it was found that Professional-Technical Education has substantial positive net impacts on participant employment and earnings and returns more revenue to taxpayers than the program costs (by a ratio of about 3 to 1). Employer and participant satisfaction are very high. Participant employment rates are up by 5 percentage points from the low point in 2010. Annual earnings however, have been relatively flat over the last several years. However, those earnings were 10 percent higher for those that completed training compared to the group as a whole.

12 | Workforce Training Results 2015 Workforce Training and Education Coordinating Board
There are some areas to focus on for improvement. Participant support services needs in some cases were not met, especially information on job openings, career counseling, and job search assistance. This likely reflects reductions in these services due to budget cuts. Also, the breakdown of results by subpopulations reveals the greatest disparities in labor market outcomes for students with disabilities. The employment rate for people with a disability is 22 percentage points lower than for people without a disability. The annual earnings for people with a disability is 78 percent of the earnings of those with no reported disability. Enhancing support services, especially services related to post-program employment and services for students with a disability are areas for improvement.
For more detailed study results for this program, go to www.wtb.wa.gov/WorkforceTrainingResults.asp
Community and Technical College (CTC) Professional-Technical Education Continued

Workforce Training and Education Coordinating Board Workforce Training Results 2015 | 13
Department of Services for the Blind (DSB)
Vocational rehabilitation services, counseling, training, and assistive technology to help participants achieve successful employment outcomes. To receive services, an individual must be legally blind or have a visual disability that causes an impediment to employment, and vocational rehabilitation services are required for the individual to prepare for, enter, engage in, or retain employment.
State Core Indicator Results Employment - Percentage of participants who were employed, as reported to the Employment Security Department during the third quarter after leaving the program.*
45%
Earnings - Median annualized earnings six to nine months after leaving the program. (Quarterly earnings are the result of hourly wage rates and the number of hours worked in a calendar quarter. To derive annualized earnings, quarterly earnings are multiplied by four.)
$24,362
Skills - Percentage of participants who obtained an appropriate credential. (Percentage based on all participants, including those who did not receive training through the program.)**
54%
Participant Satisfaction - Percentage of participants, including non-completers, who reported satisfaction with the program, as evidenced by survey responses six to nine months after leaving the program.
n/a
Employer Satisfaction - Survey not conducted because sample size would be too small. n/a
Net Employment Impact - Difference between the employment rate for all participants and the control group of non-participants, measured between two and three years after leaving the program.
n/a
Net Earnings Impact - Difference between the average annualized earnings for all participants and the control group of non-participants, measured between two and three years after leaving the program.
n/a***
Participant Return on Public Investment - The ratio of the present values of additional lifetime participant earnings and employee benefits to public costs of the program. Additional lifetime participant earnings and benefits are additional earnings and employee benefits received (minus participant program costs, taxes on added income, and any loss in unemployment insurance benefits), when compared to the non-participant control group.
n/a
Taxpayer Return on Investment - The ratio of the present values of projected additional lifetime taxes paid by the participant (plus any decrease in unemployment insurance benefits), in comparison to the public costs of the program. Additional taxes are those additional taxes projected to be paid in comparison to the taxes projected to be paid by the non-participant control group. Change in unemployment insurance benefits is the change in benefits paid to participants compared to the non-participant control group.
n/a
*Includes some out-of-state employment data but not all of it and does not include data on self-employment. **Completed rehabilitation plan. ***Not available because not measured as part of this evaluation.

14 | Workforce Training Results 2015 Workforce Training and Education Coordinating Board
Employment Rate - Percent of Department of Services for the Blind Participants with Reported Employment in Third Quarter after Exiting Program
45%45%
2010 2011 2012 2013 2014
2010 2011 2012 2013 2014
0%
20%
40%
60%
80%
$24,362$22,421
$0
$15,000
$30,000
$45,000
$60,000
Perc
ent E
mpl
oyed
Med
ian
Earn
ings
Earnings - Median Annualized Earnings of Participants in Third Quarter after Exiting Program (First Quarter 2014 dollars)
45%45%
2010 2011 2012 2013 2014
2010 2011 2012 2013 2014
0%
20%
40%
60%
80%
$24,362$22,421
$0
$15,000
$30,000
$45,000
$60,000
Perc
ent E
mpl
oyed
Med
ian
Earn
ings
Employment & Earning Indicators Over Time
The Department of Services for the Blind (DSB) provides vocational counseling; blindness rehabilitation assessment and skills-training services; blindness adaptive technology assessment, device matching and training services; blindness and low vision tools, equipment, and technological aids; a progression of services and work-based learning experiences for youth/students with a disability; internships and work experiences for adults; support for higher education and vocational training certifications; entrepreneurial training, business start-up services and occupational licenses; English as a Second Language and literacy training for individuals with visual impairment; and other goods and services that can be reasonably expected to help clients achieve successful employment or self-employment outcomes.
DSB program participants tend to be older (median age was 44 at entrance), and disproportionately white and African American, and female. Although their level of prior educational attainment tends to be high (only 37 percent had no postsecondary education), this population faces serious challenges. The employment and earnings results are relatively low (45 percent reported employment and median earnings of $24,362), but have improved since the previous report. In addition, the pool of participants is fairly small, meaning that the data can easily be distorted by untypical performance results from just a handful of participants.

Workforce Training and Education Coordinating Board Workforce Training Results 2015 | 15
Department of Services for the Blind (DSB) Continued
It’s because of this relatively small sample size that we do not know the full impact of the DSB program on participants. A detailed net impact evaluation, which measures the performance of participants vs. a control group with similar demographics, was conducted for the majority of workforce programs the Workforce Board evaluates. However, with DSB it was not feasible to construct a comparison group because of the unique characteristics of the participant population.
DSB program participants also were not included in the most recent participant survey for similar reasons.
DSB has implemented targeted outreach and service provision efforts to close gaps in underserved populations, and has been successful since 2012 in narrowing the service gap to Washington’s Hispanic/Latino residents.
A significant proportion of DSB customers who close services with an employment outcome are self-employed, and are not accounted for in the Employment Rate data within this report. For example, of the 192 employment outcomes that occurred in the most recent federal fiscal year 2014, 20 outcomes (or 10.4 percent) were individuals who were self-employed.
DSB has put considerable emphasis on serving young people with visual impairments by offering a series of independent-living and work-based programs for students with disabilities. The program works with blind youth from birth to 13, and their families, to provide advocacy, access to independent living skills resources and workshops, and pre-vocational awareness. DSB accepts vocational rehabilitation applications at age 14, and provides year-round transition services and summer vocational programs: a two-week work-experience program (ages 14-15); a six-week paid-work independent living skills experience (ages 16-19); and a five-week summer self-advocacy program to transition students with disabilities to managing disability needs in the higher education system.
For more detailed study results for this program, go to www.wtb.wa.gov/WorkforceTrainingResults.asp
16 | Workforce Training Results 2015 Workforce Training and Education Coordinating Board
Division of Vocational Rehabilitation (DVR)
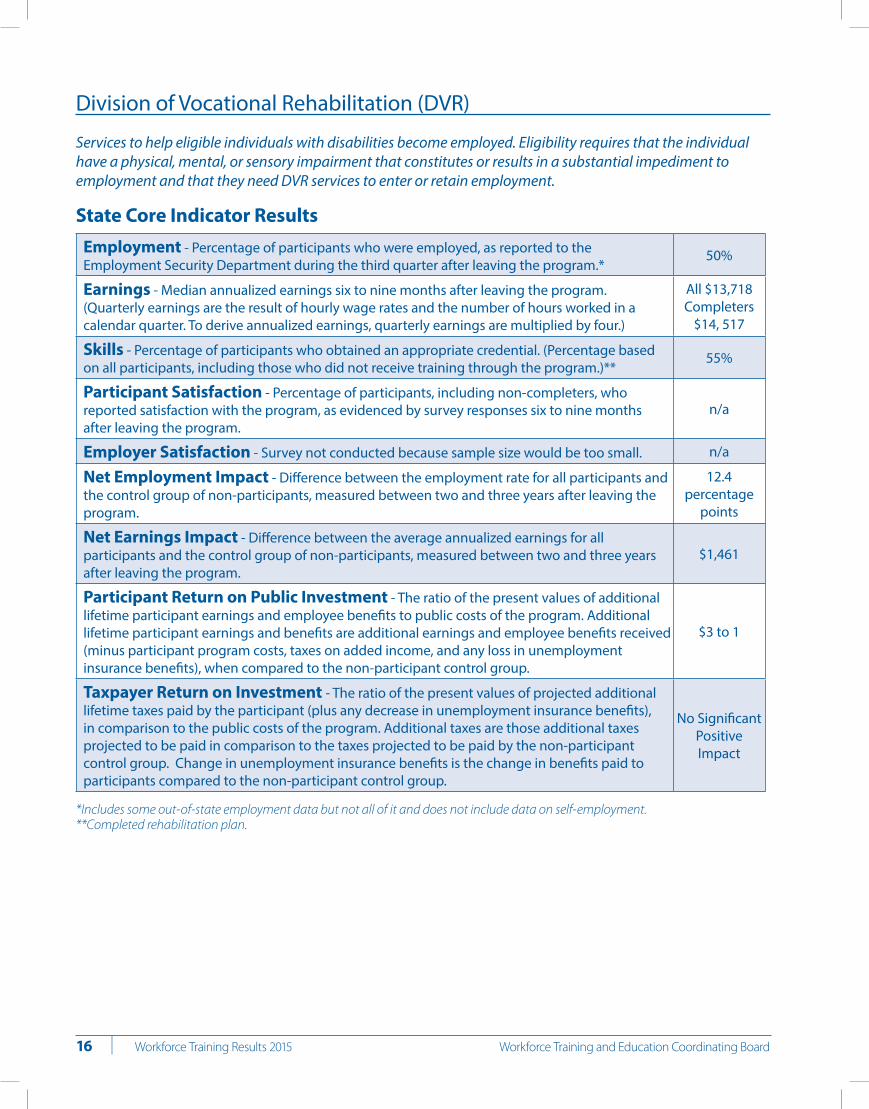
Services to help eligible individuals with disabilities become employed. Eligibility requires that the individual have a physical, mental, or sensory impairment that constitutes or results in a substantial impediment to employment and that they need DVR services to enter or retain employment.
State Core Indicator Results Employment - Percentage of participants who were employed, as reported to the Employment Security Department during the third quarter after leaving the program.*
50%
Earnings - Median annualized earnings six to nine months after leaving the program. (Quarterly earnings are the result of hourly wage rates and the number of hours worked in a calendar quarter. To derive annualized earnings, quarterly earnings are multiplied by four.)
All $13,718 Completers
$14, 517
Skills - Percentage of participants who obtained an appropriate credential. (Percentage based on all participants, including those who did not receive training through the program.)**
55%
Participant Satisfaction - Percentage of participants, including non-completers, who reported satisfaction with the program, as evidenced by survey responses six to nine months after leaving the program.
n/a
Employer Satisfaction - Survey not conducted because sample size would be too small. n/a
Net Employment Impact - Difference between the employment rate for all participants and the control group of non-participants, measured between two and three years after leaving the program.
12.4 percentage
points
Net Earnings Impact - Difference between the average annualized earnings for all participants and the control group of non-participants, measured between two and three years after leaving the program.
$1,461
Participant Return on Public Investment - The ratio of the present values of additional lifetime participant earnings and employee benefits to public costs of the program. Additional lifetime participant earnings and benefits are additional earnings and employee benefits received (minus participant program costs, taxes on added income, and any loss in unemployment insurance benefits), when compared to the non-participant control group.
$3 to 1
Taxpayer Return on Investment - The ratio of the present values of projected additional lifetime taxes paid by the participant (plus any decrease in unemployment insurance benefits), in comparison to the public costs of the program. Additional taxes are those additional taxes projected to be paid in comparison to the taxes projected to be paid by the non-participant control group. Change in unemployment insurance benefits is the change in benefits paid to participants compared to the non-participant control group.
No Significant Positive Impact
*Includes some out-of-state employment data but not all of it and does not include data on self-employment. **Completed rehabilitation plan.

Workforce Training and Education Coordinating Board Workforce Training Results 2015 | 17
Employment Rate - Percent of Division of Vocational Rehabilitation Participants with Reported Employment in Third Quarter after Exiting Program
50%46%
2010 2011 2012 2013 2014
2010 2011 2012 2013 2014
0%
20%
40%
60%
80%
$13,718$12,628
$0
$15,000
$30,000
$45,000
$60,000
Perc
ent E
mpl
oyed
Med
ian
Earn
ings
Earnings - Median Annualized Earnings of Participants in Third Quarter after Exiting Program (First Quarter 2014 dollars)
50%46%
2010 2011 2012 2013 2014
2010 2011 2012 2013 2014
0%
20%
40%
60%
80%
$13,718$12,628
$0
$15,000
$30,000
$45,000
$60,000
Perc
ent E
mpl
oyed
Med
ian
Earn
ings
Employment & Earning Indicators Over Time
The Division of Vocational Rehabilitation (DVR) offers services to help individuals with disabilities become employed. Disabled individuals often face significant challenges to employment, yet the program achieves positive net impacts on employment and earnings. The return to participants far exceeds the cost of the services. This evaluation reveals some strong results, and some possibilities of how this return could be made stronger.
While the study found positive impacts on employment and earnings, both remained lower than ideal. Half of the participants found employment within nine months of leaving the program, but median annual wages fell slightly to $13,718, from $13,808 the previous year.
The racial/ethnic composition of the DVR clients roughly reflects that of the general population but there was more variation in employment rates. Asians, Pacific Islanders, and whites had had the highest employment rates among DVR participants. Native Americans and African Americans had the lowest employment rate and Native Americans had the lowest full-time employment rate.

18 | Workforce Training Results 2015 Workforce Training and Education Coordinating Board
Division of Vocational Rehabilitation (DVR) Continued
Under the 2014 State Plan, DVR will, among other steps, make greater use of labor market and postsecondary training information to improve vocational assessments and assist participants in better selecting employment goals that match the availability of jobs; develop more relationships with employers to create opportunities for participants to gain work experience through internships and obtain employment; and meet regularly with staff from workforce partners to identify current trends in local labor markets.
For more detailed study results for this program, go to www.wtb.wa.gov/WorkforceTrainingResults.asp

Workforce Training and Education Coordinating Board Workforce Training Results 2015 | 19
Private Career Schools
Training provided by private colleges and schools for students intending to complete vocational certificates or degrees. The schools are licensed by the Workforce Board or, if they grant a degree, by the Washington Student Achievement Council.
State Core Indicator Results
Employment - Percentage of participants who were employed, as reported to the Employment Security Department during the third quarter after leaving the program.*
All 60%Completers
62%
Earnings - Median annualized earnings six to nine months after leaving the program. (Quarterly earnings are the result of hourly wage rates and the number of hours worked in a calendar quarter. To derive annualized earnings, quarterly earnings are multiplied by four.)
All $22,026Completers
$23,403
Skills - Percentage of participants who obtained an appropriate credential. (Percentage based on all participants, including those who did not receive training through the program.)
79%
Participant Satisfaction - Percentage of participants, including non-completers, who reported satisfaction with the program, as evidenced by survey responses six to nine months after leaving the program.
88%
Employer Satisfaction - Percentage of employers who reported satisfaction with new employees who were program completers as evidenced by survey responses.
9 %5
Net Employment Impact - Difference between the employment rate for all participants and the control group of non-participants, measured between two and three years after leaving the program.
3.4 percentage points
Net Earnings Impact - Difference between the average annualized earnings for all participants and the control group of non-participants, measured between two and three years after leaving the program.
$2,251
Participant Return on Public Investment - The ratio of the present values of additional lifetime participant earnings and employee benefits to public costs of the program. Additional lifetime participant earnings and benefits are additional earnings and employee benefits received (minus participant program costs, taxes on added income, and any loss in unemployment insurance benefits), when compared to the non-participant control group.
**
Taxpayer Return on Investment - The ratio of the present values of projected additional lifetime taxes paid by the participant (plus any decrease in unemployment insurance benefits), in comparison to the public costs of the program. Additional taxes are those additional taxes projected to be paid in comparison to the taxes projected to be paid by the non-participant control group. Change in unemployment insurance benefits is the change in benefits paid to participants compared to the non-participant control group.
**
*Includes some out-of-state employment data but not all of it and does not include data on self-employment. **This return is not estimated because the major public investment is student financial aid which is outside the scope of this study.
20 | Workforce Training Results 2015 Workforce Training and Education Coordinating Board
Employment Rate - Percent of All Private Career School Participants with Reported Employment in Third Quarter after Exiting Program
60%60%
2010 2011 2012 2013 2014
2010 2011 2012 2013 2014
0%
20%
40%
60%
80%
$22,026$22,465
$0
$15,000
$30,000
$45,000
$60,000
Perc
ent E
mpl
oyed
Med
ian
Earn
ings
Earnings - Median Annualized Earnings of All Participants in Third Quarter after Exiting Program (First Quarter 2014 dollars)
60%60%
2010 2011 2012 2013 2014
2010 2011 2012 2013 2014
0%
20%
40%
60%
80%
$22,026$22,465
$0
$15,000
$30,000
$45,000
$60,000
Perc
ent E
mpl
oyed
Med
ian
Earn
ings
Employment & Earning Indicators Over Time
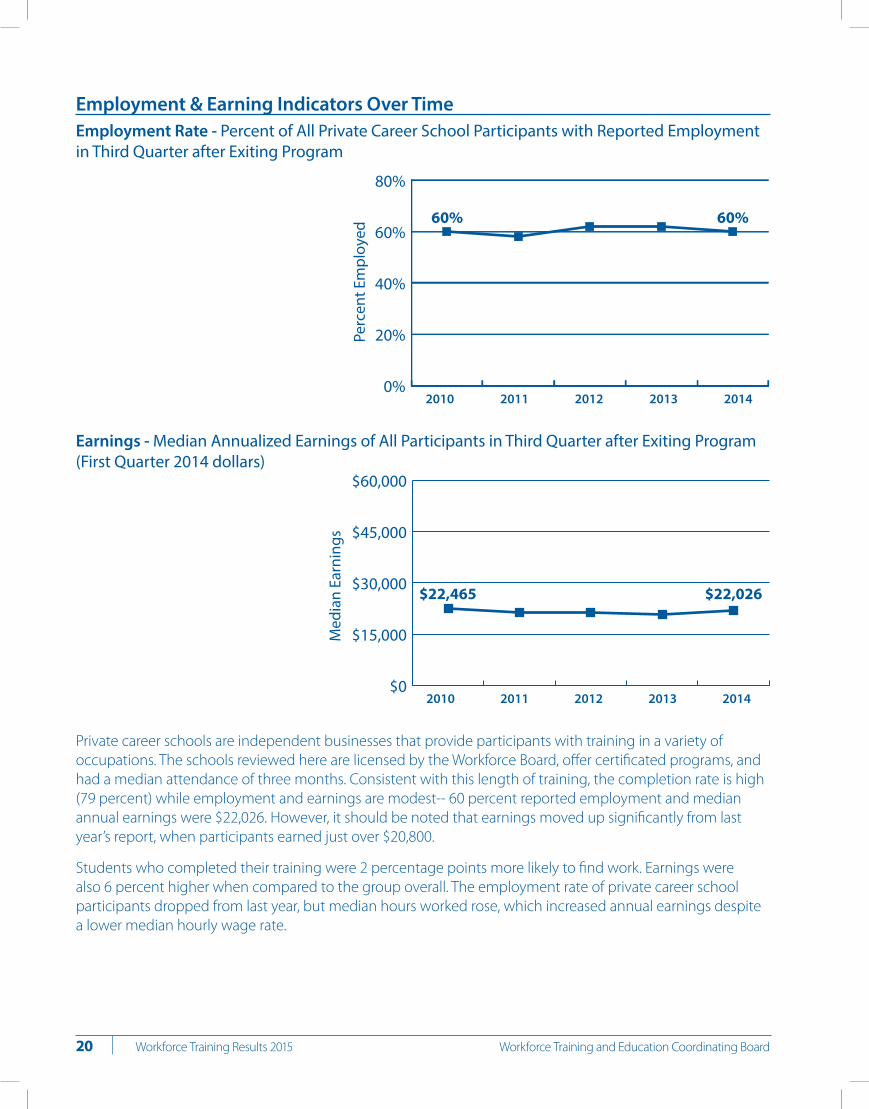
Private career schools are independent businesses that provide participants with training in a variety of occupations. The schools reviewed here are licensed by the Workforce Board, offer certificated programs, and had a median attendance of three months. Consistent with this length of training, the completion rate is high (79 percent) while employment and earnings are modest-- 60 percent reported employment and median annual earnings were $22,026. However, it should be noted that earnings moved up significantly from last year’s report, when participants earned just over $20,800.
Students who completed their training were 2 percentage points more likely to find work. Earnings were also 6 percent higher when compared to the group overall. The employment rate of private career school participants dropped from last year, but median hours worked rose, which increased annual earnings despite a lower median hourly wage rate.

Workforce Training and Education Coordinating Board Workforce Training Results 2015 | 21
Private Career Schools Continued
Participants reported relatively high rates of disconnect between their training programs and employment. For example, 36 percent said their training was unrelated to their job and 34 percent reported their training was unhelpful in getting hired. Despite this unfavorable feedback, participants reported that job-specific training “helped a lot.” Generally speaking, the percent of students reporting unmet needs has declined over time, but job opening information continues to be the biggest need that private career school students say isn’t being met.
The long-term net impact on employment and earnings is positive, but whether or not the net impact is sufficient to offset the cost of training depends on a particular program’s tuition and fees (tuition and fees vary widely among the schools), the financial aid students receive, and employment and earnings of students after they leave school. As a result, there is a premium on students being well-informed consumers when they choose a school.
For more detailed study results for this program, go to www.wtb.wa.gov/WorkforceTrainingResults.asp

22 | Workforce Training Results 2015 Workforce Training and Education Coordinating Board
Secondary Career and Technical Education (CTE)
Career and technical education helps prepare students for successful roles in families, careers, and communities. Programs are designed to develop the skills, understanding, and attitudes needed by workers in their occupations. Instructional programs organized within career pathways include agriculture, family and consumer sciences, trade and industry, marketing education, business education, diversified occupations, technology education, cosmetology, health education, and others.
State Core Indicator Results Employment - Percentage of participants who were employed, as reported to the Employment Security Department during the third quarter after leaving the program.*
79%
Earnings - Median annualized earnings six to nine months after leaving the program.** (Quarterly earnings are the result of hourly wage rates and the number of hours worked in a calendar quarter. To derive annualized earnings, quarterly earnings are multiplied by four.)
$10,930
Skills - Percentage of participants who obtained an appropriate credential. (Percentage based on all participants, including those who did not receive training through the program.)
n/a
Participant Satisfaction - Percentage of participants, including non-completers, who reported satisfaction with the program, as evidenced by survey responses six to nine months after leaving the program.
n/a
Employer Satisfaction - Percentage of employers who reported satisfaction with new employees who were program completers as evidenced by survey responses.
95%
Net Employment Impact - Difference between the employment rate for all participants and the control group of non-participants, measured between two and three years after leaving the program.
8.4 percentage points
Net Earnings Impact - Difference between the average annualized earnings for all participants and the control group of non-participants, measured between two and three years after leaving the program.
$2,157
Participant Return on Public Investment - The ratio of the present values of additional lifetime participant earnings and employee benefits to public costs of the program. Additional lifetime participant earnings and benefits are additional earnings and employee benefits received (minus participant program costs, taxes on added income, and any loss in unemployment insurance benefits), when compared to the non-participant control group.
$87 to 1
Taxpayer Return on Investment - The ratio of the present values of projected additional lifetime taxes paid by the participant (plus any decrease in unemployment insurance benefits), in comparison to the public costs of the program. Additional taxes are those additional taxes projected to be paid in comparison to the taxes projected to be paid by the non-participant control group. Change in unemployment insurance benefits is the change in benefits paid to participants compared to the non-participant control group.
$9 to 1
*Includes some out-of-state employment data but not all of it and does not include data on self-employment. **Excludes those enrolled in postsecondary education.
Workforce Training and Education Coordinating Board Workforce Training Results 2015 | 23
Employment/Higher Education Rate - Percent of Secondary CTE Students in Higher Education or with Reported Employment in Third Quarter after Exiting Program
79%72%
2010 2011 2012 2013 2014
2010 2011 2012 2013 2014
0%
25%
50%
75%
100%
$10,930$11,077
$0
$15,000
$30,000
$45,000
$60,000
Perc
ent E
mpl
oyed
Med
ian
Earn
ings
Earnings - Median Annualized Earnings of CTE Students Not in Higher Education in Third Quarter after Exiting Program (First Quarter 2014 dollars)
79%72%
2010 2011 2012 2013 2014
2010 2011 2012 2013 2014
0%
25%
50%
75%
100%
$10,930$11,077
$0
$15,000
$30,000
$45,000
$60,000
Perc
ent E
mpl
oyed
Med
ian
Earn
ings
Employment & Earning Indicators Over Time
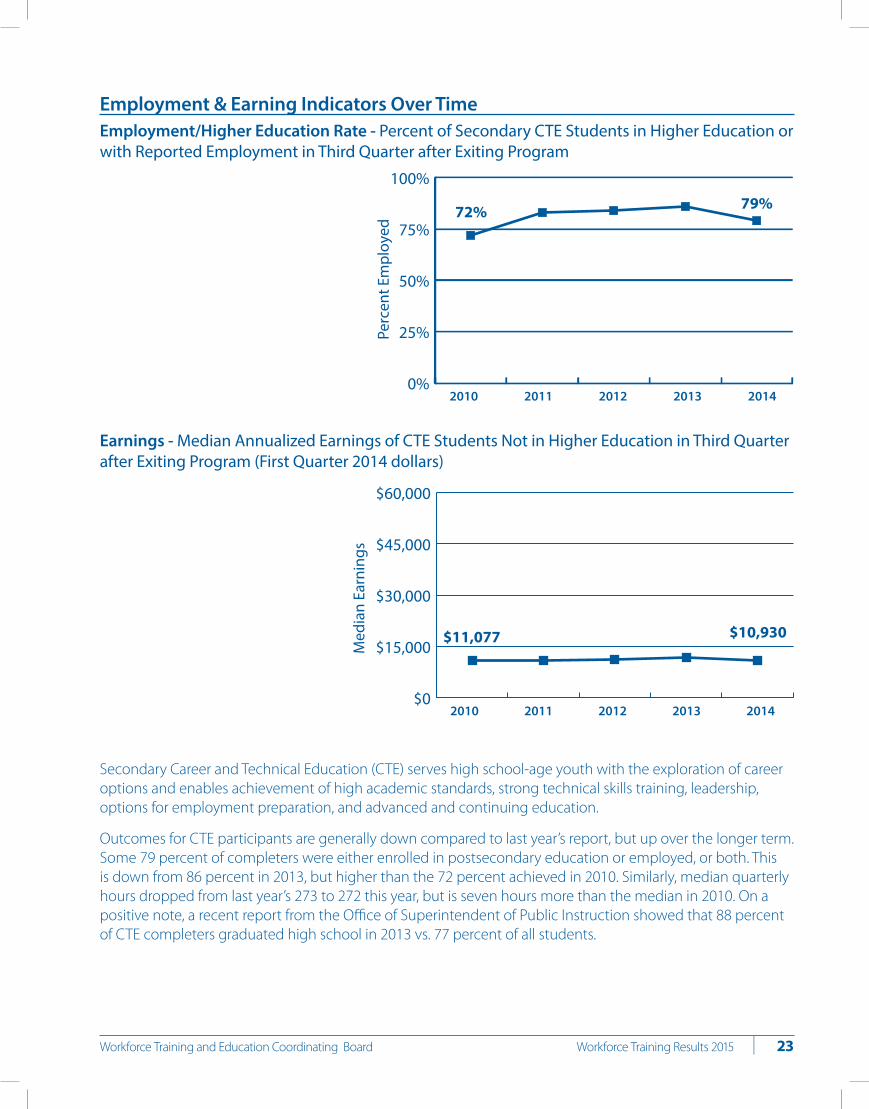
Secondary Career and Technical Education (CTE) serves high school-age youth with the exploration of career options and enables achievement of high academic standards, strong technical skills training, leadership, options for employment preparation, and advanced and continuing education.
Outcomes for CTE participants are generally down compared to last year’s report, but up over the longer term. Some 79 percent of completers were either enrolled in postsecondary education or employed, or both. This is down from 86 percent in 2013, but higher than the 72 percent achieved in 2010. Similarly, median quarterly hours dropped from last year’s 273 to 272 this year, but is seven hours more than the median in 2010. On a positive note, a recent report from the Office of Superintendent of Public Instruction showed that 88 percent of CTE completers graduated high school in 2013 vs. 77 percent of all students.

24 | Workforce Training Results 2015 Workforce Training and Education Coordinating Board
Secondary Career and Technical Education (CTE) Continued
Also, the net impact evaluation shows a strong net impact on employment rates and earnings. For example, three years after exit, CTE graduates earn an additional $2,157 per year compared to those with similar demographics, who did not participate in CTE. The cost-benefit evaluation shows that Secondary CTE returns more money in tax revenue than the program costs taxpayers.
Going forward, the CTE program may want to focus on helping CTE students focus on higher-paying occupational areas. Among all CTE graduates who were employed, 55 percent were employed in retail trade or accommodations and food services. These tend to be lower-paying industries, which is reflected in the low hourly ($9.97) and annual ($10,930) earnings achieved by completers. However, it’s also worth noting that CTE graduates are fresh from high school and often hold part-time jobs, bringing down annual wages. As they spend more time in the workforce, wages and hours worked tend to rise.
Also, it should be noted that equipping CTE classrooms with the technology required for higher-paying occupational clusters can be expensive. So this is a challenge going forward.
Finally, 22 percent of students with disabilities continued on to postsecondary education. This is a 10 percentage point reduction from last year’s report and another challenge that merits attention.
For more detailed study results for this program, go to www.wtb.wa.gov/WorkforceTrainingResults.asp
Workforce Training and Education Coordinating Board Workforce Training Results 2015 | 25
Worker Retraining at Community and Technical Colleges
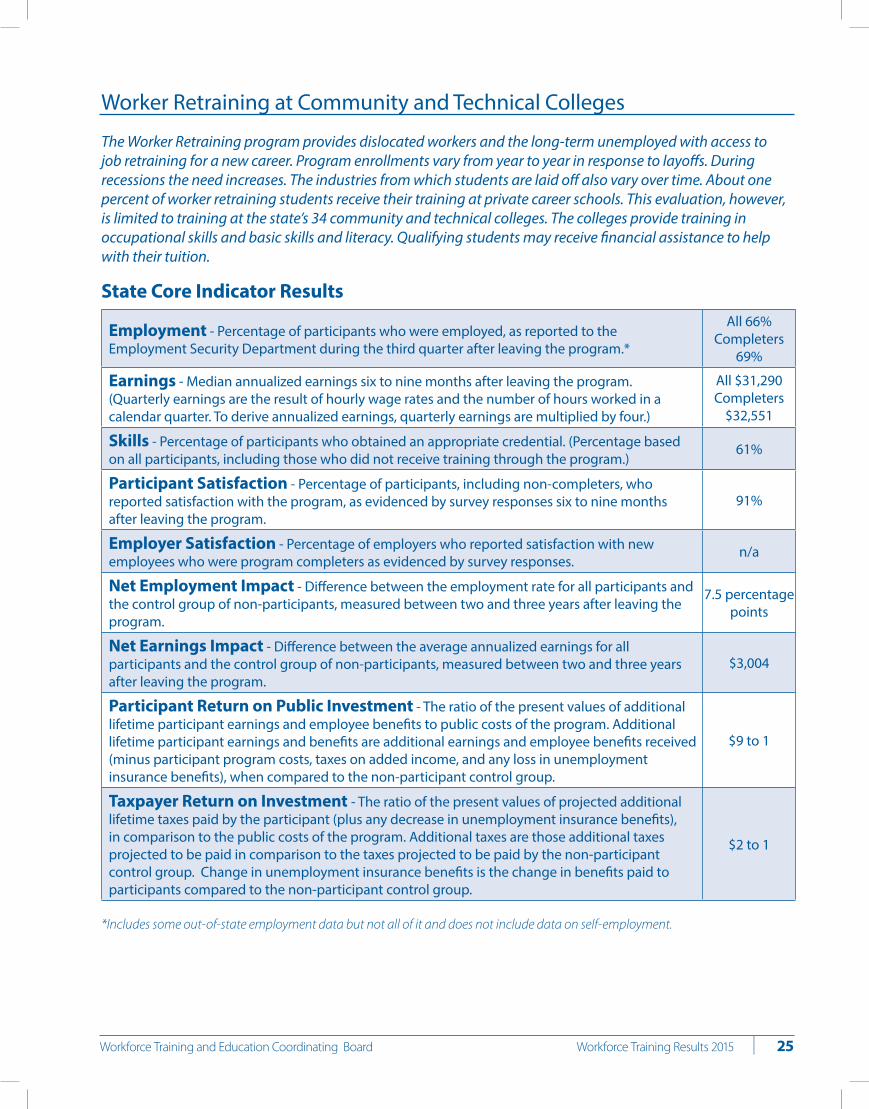
The Worker Retraining program provides dislocated workers and the long-term unemployed with access to job retraining for a new career. Program enrollments vary from year to year in response to layoffs. During recessions the need increases. The industries from which students are laid off also vary over time. About one percent of worker retraining students receive their training at private career schools. This evaluation, however, is limited to training at the state’s 34 community and technical colleges. The colleges provide training in occupational skills and basic skills and literacy. Qualifying students may receive financial assistance to help with their tuition.
State Core Indicator Results
Employment - Percentage of participants who were employed, as reported to the Employment Security Department during the third quarter after leaving the program.*
All 66% Completers
69%
Earnings - Median annualized earnings six to nine months after leaving the program. (Quarterly earnings are the result of hourly wage rates and the number of hours worked in a calendar quarter. To derive annualized earnings, quarterly earnings are multiplied by four.)
All $31,290 Completers
$32,551
Skills - Percentage of participants who obtained an appropriate credential. (Percentage based on all participants, including those who did not receive training through the program.)
61%
Participant Satisfaction - Percentage of participants, including non-completers, who reported satisfaction with the program, as evidenced by survey responses six to nine months after leaving the program.
91%
Employer Satisfaction - Percentage of employers who reported satisfaction with new employees who were program completers as evidenced by survey responses.
n/a
Net Employment Impact - Difference between the employment rate for all participants and the control group of non-participants, measured between two and three years after leaving the program.
7.5 percentage points
Net Earnings Impact - Difference between the average annualized earnings for all participants and the control group of non-participants, measured between two and three years after leaving the program.
$3,004
Participant Return on Public Investment - The ratio of the present values of additional lifetime participant earnings and employee benefits to public costs of the program. Additional lifetime participant earnings and benefits are additional earnings and employee benefits received (minus participant program costs, taxes on added income, and any loss in unemployment insurance benefits), when compared to the non-participant control group.
$9 to 1
Taxpayer Return on Investment - The ratio of the present values of projected additional lifetime taxes paid by the participant (plus any decrease in unemployment insurance benefits), in comparison to the public costs of the program. Additional taxes are those additional taxes projected to be paid in comparison to the taxes projected to be paid by the non-participant control group. Change in unemployment insurance benefits is the change in benefits paid to participants compared to the non-participant control group.
$2 to 1
*Includes some out-of-state employment data but not all of it and does not include data on self-employment.

26 | Workforce Training Results 2015 Workforce Training and Education Coordinating Board
Employment Rate - Percent of Worker Retraining Participants with Reported Employment in Third Quarter after Exiting Program
66%58%
2010 2011 2012 2013 2014
2010 2011 2012 2013 2014
0%
20%
40%
60%
80%
$31,290$28,639
$0
$15,000
$30,000
$45,000
$60,000
Perc
ent E
mpl
oyed
Med
ian
Earn
ings
Earnings - Median Annualized Earnings of Participants in Third Quarter after Exiting Program (First Quarter 2014 dollars)
66%58%
2010 2011 2012 2013 2014
2010 2011 2012 2013 2014
0%
20%
40%
60%
80%
$31,290$28,639
$0
$15,000
$30,000
$45,000
$60,000
Perc
ent E
mpl
oyed
Med
ian
Earn
ings
Employment & Earning Indicators Over Time
The Worker Retraining program provides dislocated workers and the long-term unemployed with access to job retraining for a new career. The Worker Retraining program has strong net impacts on participant’s long-term employment and earnings, and provides a positive return to taxpayers. In addition, participants report high levels of satisfaction, with 86 percent meeting their educational objectives. While results for post-program employment rates and earnings are still lower than prior to the Great Recession, employment rates and earnings are on the rebound. Earnings were 4 percent higher for those that completed training, compared to all participants.
Community and technical colleges are launching innovative programs to increase student completion rates through “intrusive” outreach and one-stop advising enrollment centers. For the 2015-17 biennium, the State Board for Community and Technical Colleges is requesting $18 million in new funding for advising, career planning, and development services. These support services help keep students on track with program requirements to ensure they graduate on time.

Workforce Training and Education Coordinating Board Workforce Training Results 2015 | 27
Worker Retraining at Community and Technical Colleges Continued
There is some room for improvement in the Worker Retraining program. While the program has relatively high participation by women and African Americans, they, and those with disabilities, tend to have lower labor market outcomes. These poorer employment outcomes are not particular to the Worker Retraining program but are generally the case for these populations, overall. However, lower employment and earnings are also tied to program choice. Better career and job counseling, and advice on program selection, could help more students prepare for higher-paying, in-demand occupations. Career and job counseling support services were rated less highly by Worker Retraining program participants than other services. Also, more than one in six students reported their need for job opening information was not met. Strengthening these services would likely benefit all students, including those program participants whose results have been lagging.
For more detailed study results for this program, go to www.wtb.wa.gov/WorkforceTrainingResults.asp

28 | Workforce Training Results 2015 Workforce Training and Education Coordinating Board
WorkFirst
Washington’s welfare-to-work program is based on the 1996 federal Temporary Assistance for Needy Families (TANF) welfare reform legislation. The aim of WorkFirst is to help TANF families become self-sufficient by providing training and support services necessary for parents to get a job, keep a job, and move up a career ladder. The program outcomes in this report are limited to WorkFirst participants who enrolled in an employment or training component.
State Core Indicator Results Employment - Percentage of participants who were employed, as reported to the Employment Security Department during the third quarter after leaving the program.*
53%
Earnings - Median annualized earnings six to nine months after leaving the program. (Quarterly earnings are the result of hourly wage rates and the number of hours worked in a calendar quarter. To derive annualized earnings, quarterly earnings are multiplied by four.)
$14,650
Skills - Percentage of participants who obtained an appropriate credential. (Percentage based on all participants, including those who did not receive training through the program.)
n/a
Participant Satisfaction - A survey was not conducted. n/a
Employer Satisfaction - A survey was not conducted. n/a
Net Employment Impact - Difference between the employment rate for all participants and the control group of non-participants, measured between two and three years after leaving the program.
n/a
Net Earnings Impact - Difference between the average annualized earnings for all participants and the control group of non-participants, measured between two and three years after leaving the program.
n/a
Participant Return on Public Investment - The ratio of the present values of additional lifetime participant earnings and employee benefits to public costs of the program. Additional lifetime participant earnings and benefits are additional earnings and employee benefits received (minus participant program costs, taxes on added income, and any loss in unemployment insurance benefits), when compared to the non-participant control group.
n/a
Taxpayer Return on Investment - The ratio of the present values of projected additional lifetime taxes paid by the participant (plus any decrease in unemployment insurance benefits), in comparison to the public costs of the program. Additional taxes are those additional taxes projected to be paid in comparison to the taxes projected to be paid by the non-participant control group. Change in unemployment insurance benefits is the change in benefits paid to participants compared to the non-participant control group.
n/a
* Includes some out-of-state employment data but not all of it and does not include data on self-employment.

Workforce Training and Education Coordinating Board Workforce Training Results 2015 | 29
Employment Rate - Percent of WorkFirst Participants with Reported Employment in Third Quarter after Exiting Program
53%
37%
2010 2011 2012 2013 2014
2010 2011 2012 2013 2014
0%
20%
40%
60%
80%
$14,650$13,556
$0
$15,000
$30,000
$45,000
$60,000
Perc
ent E
mpl
oyed
Med
ian
Earn
ings
Earnings - Median Annualized Earnings of Participants in Third Quarter after Exiting Program (First Quarter 2014 dollars)
53%
37%
2010 2011 2012 2013 2014
2010 2011 2012 2013 2014
0%
20%
40%
60%
80%
$14,650$13,556
$0
$15,000
$30,000
$45,000
$60,000
Perc
ent E
mpl
oyed
Med
ian
Earn
ings
Employment & Earning Indicators Over Time
The WorkFirst program provides job search assistance, support services, basic skills and vocational education to help parents move forward on a pathway to self-sufficiency. More than three-quarters of WorkFirst participants were women, while both genders had equal employment rates of 53 percent.
After solid increases in hours and annual earnings last year, this year the program saw a moderate setback. The hourly wage rate was nearly the same on an inflation-adjusted basis. However, the number of hours worked were down, leading to downward pressure on earnings. The employment rate remained steady at 53 percent, unchanged from last year’s report, but 13 percentage points higher than in the 2013 report.
Over half of WorkFirst participants received job search services, higher than any other service received. Of those that did find work, most found it in the service industry, accommodation and food services in particular.
For more detailed study results for this program, go to www.wtb.wa.gov/WorkforceTrainingResults.asp

30 | Workforce Training Results 2015 Workforce Training and Education Coordinating Board
Workforce Investment Act Title I-B Adult Program
The Workforce Investment Act (WIA) Adult program prepares individuals 18 years and older for participation in the labor force by providing core services and access to job training and other services. Core services, which are available to all adults, include skill assessment, labor market information, consumer reports on training programs, and job search and placement assistance. Intensive services are available for eligible adults unable to obtain jobs through core services alone. Priority is given to welfare and low-income clients. Services may include more intensive assessments, individual counseling, employment planning, and prevocational training. WIA Title I may also pay for vocational training if a participant requires training for employment and other resources are not available to cover the cost of the training. The state’s Employment Security Department administers the program. The 12 regional Workforce Development Councils oversee WIA activities in local areas.
State Core Indicator Results Employment - Percentage of participants who were employed, as reported to the Employment Security Department during the third quarter after leaving the program.*
69%
Earnings - Median annualized earnings six to nine months after leaving the program. (Quarterly earnings are the result of hourly wage rates and the number of hours worked in a calendar quarter. To derive annualized earnings, quarterly earnings are multiplied by four.)
$24,866
Skills - Percentage of participants who obtained an appropriate credential. (Percentage based on all participants, including those who did not receive training through the program.)
33%
Participant Satisfaction - Percentage of participants, including non-completers, who reported satisfaction with the program, as evidenced by survey responses six to nine months after leaving the program.
90%
Employer Satisfaction - WIA participants in general, including Adults, Youth and Dislocated Workers (A separate survey for each WIA program was not conducted because the sample size would be too small.)
91%
Net Employment Impact - Difference between the employment rate for all participants and the control group of non-participants, measured between two and three years after leaving the program.
10.8 percentage points
Net Earnings Impact - Difference between the average annualized earnings for all participants and the control group of non-participants, measured between two and three years after leaving the program.
$4,562
Participant Return on Public Investment - The ratio of the present values of additional lifetime participant earnings and employee benefits to public costs of the program. Additional lifetime participant earnings and benefits are additional earnings and employee benefits received (minus participant program costs, taxes on added income, and any loss in unemployment insurance benefits), when compared to the non-participant control group.
$8 to 1
Taxpayer Return on Investment - The ratio of the present values of projected additional lifetime taxes paid by the participant (plus any decrease in unemployment insurance benefits), in comparison to the public costs of the program. Additional taxes are those additional taxes projected to be paid in comparison to the taxes projected to be paid by the non-participant control group. Change in unemployment insurance benefits is the change in benefits paid to participants compared to the non-participant control group.
$1.20 to 1
*Includes some out-of-state employment data but not all of it and does not include data on self-employment.

Workforce Training and Education Coordinating Board Workforce Training Results 2015 | 31
Employment Rate - Percent of WIA Adult Participants with Reported Employment in Third Quarter after Exiting Program
69%65%
2010 2011 2012 2013 2014
2010 2011 2012 2013 2014
0%
20%
40%
60%
80%
$24,866$22,666
$0
$15,000
$30,000
$45,000
$60,000
Perc
ent E
mpl
oyed
Med
ian
Earn
ings
Earnings - Median Annualized Earnings of Participants in Third Quarter after Exiting Program (First Quarter 2014 dollars)
69%65%
2010 2011 2012 2013 2014
2010 2011 2012 2013 2014
0%
20%
40%
60%
80%
$24,866$22,666
$0
$15,000
$30,000
$45,000
$60,000
Perc
ent E
mpl
oyed
Med
ian
Earn
ings
Employment & Earning Indicators Over Time
The WIA program provides services for adults seeking preparation or assistance for participation in the labor force. The services depend on what participants need to find suitable employment. Approximately 55 percent of participants reviewed in this study received vocational training.
For two consecutive years, WIA Adult exiters achieved employment rates of 69 percent – the highest level since the beginning of the Great Recession. Similarly, annual earnings, even on an inflation-adjusted basis, are above pre-recession levels. The program was found to have strong net impacts on participants’ employment and earnings. The strongest net impacts were for those who received vocational training. This suggests the importance of continuing to provide vocational training to a majority of program participants.
Only 8 percent of the participants reported that their program was neither helpful in finding a job nor related to their employment. Some 78 percent of participants entered the program to learn skills for a new job, and 72 percent found the skills learned to be useful in doing their job. Some 90 percent of participants reported they were satisfied with the overall quality of the program. Also, 86 percent said their educational objectives were at least partially met.

32 | Workforce Training Results 2015 Workforce Training and Education Coordinating Board
One area that could be stronger is providing participants with information on job openings, financial assistance, and government services information. Nineteen percent of participants left their program with an unmet need for job opening information, and 15 percent with unmet needs for financial assistance and government services information.
The Workforce Development Councils indicate that they will continue to work with partners to provide job seekers with information on job openings; educating job seekers on the value of online tools; utilizing resource rooms, job clubs, workshops, and one-on-one meetings with WorkSource counselors; developing social media resources; and following up with participants one year after exit.
For more detailed study results for this program, go to www.wtb.wa.gov/WorkforceTrainingResults.asp
Workforce Investment Act Title I-B Adult Program Continued

Workforce Training and Education Coordinating Board Workforce Training Results 2015 | 33
Workforce Investment Act Title I-B Program for Dislocated Workers
The Workforce Investment Act (WIA) Dislocated Worker program provides employment and training services to meet dislocated workers’ needs; establishes early intervention for workers and firms facing substantial layoffs; and fosters labor, management, and community partnerships with government to address worker dislocation. In general, dislocated workers are people who lost jobs due to plant closures, company downsizing, or some other significant change in market conditions. In most cases, participants must be unlikely to return to their occupation, and must be eligible for (or have exhausted) unemployment compensation.
State Core Indicator Results Employment - Percentage of participants who were employed, as reported to the Employment Security Department during the third quarter after leaving the program.*
73%
Earnings - Median annualized earnings six to nine months after leaving the program. (Quarterly earnings are the result of hourly wage rates and the number of hours worked in a calendar quarter. To derive annualized earnings, quarterly earnings are multiplied by four.)
$33,972
Skills - Percentage of participants who obtained an appropriate credential. (Percentage based on all participants, including those who did not receive training through the program.)
45%
Participant Satisfaction - Percentage of participants, including non-completers, who reported satisfaction with the program, as evidenced by survey responses six to nine months after leaving the program.
89%
Employer Satisfaction - WIA participants in general, including Adults, Youth and Dislocated Workers (A separate survey for each WIA program was not conducted because the sample size would be too small.)
91%
Net Employment Impact - Difference between the employment rate for all participants and the control group of non-participants, measured between two and three years after leaving the program.
4.7 percentage points
Net Earnings Impact - Difference between the average annualized earnings for all participants and the control group of non-participants, measured between two and three years after leaving the program.
$3,622
Participant Return on Public Investment - The ratio of the present values of additional lifetime participant earnings and employee benefits to public costs of the program. Additional lifetime participant earnings and benefits are additional earnings and employee benefits received (minus participant program costs, taxes on added income, and any loss in unemployment insurance benefits), when compared to the non-participant control group.
$7 to 1
Taxpayer Return on Investment - The ratio of the present values of projected additional lifetime taxes paid by the participant (plus any decrease in unemployment insurance benefits), in comparison to the public costs of the program. Additional taxes are those additional taxes projected to be paid in comparison to the taxes projected to be paid by the non-participant control group. Change in unemployment insurance benefits is the change in benefits paid to participants compared to the non-participant control group.
$2 to 1
*Includes some out-of-state employment data but not all of it and does not include data on self-employment.

34 | Workforce Training Results 2015 Workforce Training and Education Coordinating Board
Employment Rate - Percent of WIA Dislocated Worker Participants with Reported Employment in Third Quarter after Exiting Program
73%71%
2010 2011 2012 2013 2014
2010 2011 2012 2013 2014
0%
20%
40%
60%
80%
$33,972$31,504
$0
$15,000
$30,000
$45,000
$60,000
Perc
ent E
mpl
oyed
Med
ian
Earn
ings
Earnings - Median Annualized Earnings of Participants in Third Quarter after Exiting Program (First Quarter 2014 dollars)
73%71%
2010 2011 2012 2013 2014
2010 2011 2012 2013 2014
0%
20%
40%
60%
80%
$33,972$31,504
$0
$15,000
$30,000
$45,000
$60,000
Perc
ent E
mpl
oyed
Med
ian
Earn
ings
Employment & Earning Indicators Over Time
This WIA Dislocated Worker program evaluation takes place in the aftermath of some of the worst labor market conditions since the Great Depression, and the program is intended to help individuals who lost their jobs gain new employment. Program participants hit an employment rate low of 65 percent in the 2013 report. Since that time, the rate has risen modestly to 73 percent – an improvement, but still below the 78 percent achieved in the 2008 report. When comparing the industries dislocated workers came from and where they ended up, the trend was to move from manufacturing and construction to services.
Compared to similar individuals who did not participate in a workforce development program, WIA Dislocated Worker participants were much better off after going through the program. The evaluation finds the program had strong positive net impacts on employment rates and earnings. The results were especially strong for participants who received vocational training. The report finds that approximately 51 percent of recent participants received a recognized credential, while 70 percent received some type of award (diploma, credential, or degree).

Workforce Training and Education Coordinating Board Workforce Training Results 2015 | 35
Workforce Investment Act Title I-B Program for Dislocated Workers Continued
The participants reported a high level of satisfaction with the program, with 89 percent reporting satisfaction with the overall quality of the program. One area that could be stronger is providing information on job openings. Some 21 percent of participants say they left the program with an unmet need for job opening information. This does, however, represent a substantial improvement over the past decade. The 2004 report found 30 percent of participants had unmet needs for job opening information.
The Workforce Development Councils indicate that they will continue to work with partners to provide job seekers with information on job openings; educating job seekers on the value of online tools; utilizing resource rooms, job clubs, workshops, and one-on-one meetings with WorkSource counselors; developing social media resources; and following up with participants one year after exit.
For more detailed study results for this program, go to www.wtb.wa.gov/WorkforceTrainingResults.asp

36 | Workforce Training Results 2015 Workforce Training and Education Coordinating Board
Workforce Investment Act Title I-B Youth Program
The Workforce Investment Act (WIA) Youth Program prepares youth for academic and employment success. To receive services, youth must be 14 through 21 years old, low income, and meet other criteria such as needing assistance to complete an educational program or secure and hold employment. The state Employment Security Department administers the program at the state level. Twelve regional Workforce Development Councils oversee WIA activities in local areas. Local youth councils assist with the program.
State Core Indicator Results Employment - Percentage of participants who were employed, as reported to the Employment Security Department during the third quarter after leaving the program.*
58%
Earnings - Median annualized earnings six to nine months after leaving the program. (Quarterly earnings are the result of hourly wage rates and the number of hours worked in a calendar quarter. To derive annualized earnings, quarterly earnings are multiplied by four.)
$11,952
Skills - Percentage of participants who obtained an appropriate credential. (Percentage based on all participants, including those who did not receive training through the program.)
56%
Participant Satisfaction - Percentage of participants, including non-completers, who reported satisfaction with the program, as evidenced by survey responses six to nine months after leaving the program.
95%
Employer Satisfaction - WIA participants in general, including Adults, Youth and Dislocated Workers (A separate survey for each WIA program was not conducted because the sample size would be too small.)
91%
Net Employment Impact - Difference between the employment rate for all participants and the control group of non-participants, measured between two and three years after leaving the program.
4.3 percentage points
Net Earnings Impact - Difference between the average annualized earnings for all participants and the control group of non-participants, measured between two and three years after leaving the program.
$2,055
Participant Return on Public Investment - The ratio of the present values of additional lifetime participant earnings and employee benefits to public costs of the program. Additional lifetime participant earnings and benefits are additional earnings and employee benefits received (minus participant program costs, taxes on added income, and any loss in unemployment insurance benefits), when compared to the non-participant control group.
$6 to 1
Taxpayer Return on Investment - The ratio of the present values of projected additional lifetime taxes paid by the participant (plus any decrease in unemployment insurance benefits), in comparison to the public costs of the program. Additional taxes are those additional taxes projected to be paid in comparison to the taxes projected to be paid by the non-participant control group. Change in unemployment insurance benefits is the change in benefits paid to participants compared to the non-participant control group.
No Significant Positive Impact
*Includes some out-of-state employment data but not all of it and does not include data on self-employment.

Workforce Training and Education Coordinating Board Workforce Training Results 2015 | 37
Employment/Higher Education Rate - Percent of WIA Youth Participants with Reported Employment or Enrolled in Higher Education in Third Quarter after Exiting Program
58%58%
2010 2011 2012 2013 2014
2010 2011 2012 2013 2014
0%
20%
40%
60%
80%
$11,952$11,312
$0
$15,000
$30,000
$45,000
$60,000
Perc
ent E
mpl
oyed
Med
ian
Earn
ings
Earnings - Median Annualized Earnings of Participants Not in High School or Higher Education in Third Quarter after Exiting Program (First Quarter 2014 dollars)
58%58%
2010 2011 2012 2013 2014
2010 2011 2012 2013 2014
0%
20%
40%
60%
80%
$11,952$11,312
$0
$15,000
$30,000
$45,000
$60,000
Perc
ent E
mpl
oyed
Med
ian
Earn
ings
Employment & Earning Indicators Over Time
The WIA Youth program prepares youth (14-21 years old) with substantial barriers for success in school and employment. These barriers are reflected in the program’s outcomes. After participation, 32 percent still did not possess a high school diploma or GED and were not enrolled in school. The median earnings of those working and not enrolled in education was $11,952 annually and $10.35 hourly.
Given the barriers this population faces, these outcomes must be compared to those in similar circumstances. When compared to a control group with similar characteristics, the study found a positive net impact of 4.3 percentage points on the WIA Youth employment rate, and a $2,055 net impact on annual earnings for those who participated in the program. In addition, the net impact on annual earnings for those who received training was $4,682 (compared to $2,055 for all participants).

38 | Workforce Training Results 2015 Workforce Training and Education Coordinating Board
The Workforce Development Councils indicate they will continue to work with school districts and community partners on re-engagement, retention, and completion strategies for out-of-school young adults; consortia-based service delivery approaches with multiple youth agencies; and strong connections with school staff to provide support services and address barriers to student completion.
For more detailed study results for this program, go to www.wtb.wa.gov/WorkforceTrainingResults.asp
Workforce Investment Act Title I-B Youth Program continued

Workforce Training and Education Coordinating Board Workforce Training Results 2015 | 39
Workforce Development System Overall Results
The 12 workforce programs measured by the Workforce Board serve a wide range of Washington residents with various skills, education, experience, abilities and barriers. Despite the differences among programs, it is helpful to look not only at their individual results but how they performed overall to better gauge how well Washington’s workforce system is working.
Workforce Programs Overview Youth• Secondary Career and Technical Education
• Workforce Investment Act Title I-B Youth
Adults• Apprenticeship
• Community and Technical College Professional-Technical Education
• Private Career Schools
• Workforce Investment Act Title I-B Dislocated Workers
• Worker Retraining at Community and Technical Colleges
Adults with Barriers• Basic Education for Adults
• WorkFirst1
• Workforce Investment Act Title I-B Adult
• Department of Services for the Blind
• Division of Vocational Rehabilitation
Workforce Innovation and Opportunity Act (WIOA) to replace Workforce Investment Act (WIA)The Workforce Innovation and Opportunity Act (WIOA) passed in the summer of 2014 with broad bipartisan support. It’s the first federal reform of the workforce system in 15 years. WIOA replaces and modifies the Workforce Investment Act (WIA), which started in 1998. WIOA provides a framework for better integration and seamless delivery of services across programs and funding streams, with a focus on improving economic outcomes for jobseekers and filling the skills gap for employers. The majority of WIOA provisions become effective on July 1, 2015, with additional requirements set for July 1, 2016. The Workforce Board has been designated by Governor Inslee to oversee planning and policy development for Washington’s effective implementation of WIOA. The WIA program remains in effect as WIOA is implemented over the coming year.
1 No net impact or return on investment information available.

40 | Workforce Training Results 2015 Workforce Training and Education Coordinating Board
Figure 1
White
Multiracial
Native American
Hispanic
Paci�c Islanders
Asians
African American
25500
26000
26500
27000
27500
28000
28500
29000
29500
30000
30500
2005-20062003-20042001-20021999-20001997-1998
White
Native American
Multiracial
Hispanic
Asians/Paci�c Islanders
African American
Hispanic13%
Multiracial2%
Native American3%
White64%
African American9% Asian
6%
Hispanic13%
Native American2%
Paci�c Islander2%
Multiracial4%
Workforce Participant Demographics
Source: 2014 Workforce Board Participant Survey
Participant CharacteristicsThe demographic characteristics of program participants are an important factor in evaluating program results.
Programs serving participants who have significant work experience and basic skills can be expected to have better labor market outcomes than those serving participants with little work experience, low levels of literacy, and other barriers to employment.
The racial and ethnic composition of participants in our workforce development programs is typically more diverse than similarly aged populations in our state.
As of 2012, over a quarter of the state population (29 percent) was made up of minorities, while more than a third of workforce participants (36 percent) were ethnic and racial minorities.
Skill AttainmentDesired Outcome: Washington’s workforce possesses the skills and abilities required in the workplace.
For many workforce programs, the attainment of skills and abilities is marked by the awarding of a diploma, certificate, degree or other credential. Among these programs, 66 percent of workforce program participants successfully completed their programs, up from 65 percent in 2014, and 63 percent in 2013.2
2 The programs measured are: Community and Technical College Professional-Technical education, Worker Retraining, Apprenticeships and Private Career Schools.

Workforce Training and Education Coordinating Board Workforce Training Results 2015 | 41
Note: The Division of Vocational Rehabilitation and Department of Services for the Blind are not included because completion is not an outcome measure.
Workforce program participants learned a variety of skills—from how to operate computers and other machinery, to reading, writing and math, to improved teamwork and work habits. To find out whether participants gained these and other skills, the Workforce Board surveyed participants to get their feedback.
General Population
Multi andOther Racial
WhiteHispanicAsian/PIAmericanIndian
African Americans
Disabled
$11.50$11.81$11.82
$10.32
$11.94
$10.49$10.60
$10.15
59% 62% 63% 65% 66%
2010 2011 2012 2013 2014
Workforce Program Completers
Figure 2
Math
Work Habits
Reading
Diversity
Computer
Teamwork
English-Speaking
Writing
Job-Speci�c Skills
Machinery Operation
Problem Solving
47%
51%
30%
67%
27%
69%
52%
44%
45%
51%
45%
50%
42%
53%
41%
53%
49%
45%
45%
48%
48%
44%
Improved A Lot
Improved A Little
TeamworkEnglishSpeaking
WorkHabits
WritingReadingDiversityMathComputerProblemSolving
MachineryOperation
JobSpeci�c
23%
74%
27%
69%
40%
57%
42%
54%
42%
52%
43%
51%
46%
51%
46%
50%
44%
49%
47%
48%
48%
46%
Workforce Program Participants Receiving Various Skills Training who Reported Their Skills Improved a Little or a Lot
Helped a lot Helped a little
Figure 3
Source: Workforce Board Participant Survey conducted in 2013.

42 | Workforce Training Results 2015 Workforce Training and Education Coordinating Board
EmploymentDesired Outcome: Washington’s workers are employed.
Participants of workforce training programs encountered a job market that was gaining strength since the depths of the Great Recession. Washington’s unemployment rate—one barometer for the state’s relative economic health—continued a steady downward trend. Since early 2011, unemployment has trended downward, approaching pre-recession employment levels. For a more nuanced assessment of Washington’s employment health as a whole, it is useful to consider regional differences. Employment prospects vary greatly depending on whether jobseekers are in rural or urban parts of the state, for example. Also, a more comprehensive look at the state’s employment outlook should account for people who have stopped looking for work all together and who are, therefore, not included in the official labor force. In general, however, lower unemployment rates typically mean a brighter hiring picture for those seeking work.
The Workforce Board evaluates the labor market outcomes of program participants by examining their employment and earnings during the third quarter after leaving a program. Washington Employment Security Department records, along with records from neighboring states and the federal government, show that 59 percent of workforce program participants were employed in the third quarter after they exited a program.3 This is an increase of 1 percentage point from recorded employment in the 2014 report. Employment rates varied considerably from one program to another, ranging from 45 percent for Department of Services for the Blind to 75 percent for the Apprenticeship program.
The Workforce Board’s Participant Survey also asked participants if their program was related to the job they held three quarters after exit, if their training helped them get the job, and if the skills they learned were useful in that job. The majority of employed participants indicated the program was related to the job, and the training was useful in getting the job. Among training program participants, those in apprenticeships most frequently reported their training was related to employment; their training or work experience helped them get their job; and the skills they learned in the training program were useful in their job.
Math
Work Habits
Reading
Diversity
Computer
Teamwork
English-Speaking
Writing
Job-Speci�c Skills
Machinery Operation
Problem Solving
47%
51%
30%
67%
27%
69%
52%
44%
45%
51%
45%
50%
42%
53%
41%
53%
49%
45%
45%
48%
48%
44%
Improved A Lot
Improved A Little
Not UsefulUsefulNot HelpfulHelpfulNot RelatedRelated
Very46% 31%
22% 18%
Moderately 23%
Essential39%
Very50%
Moderately17%
A Little 15%A Little 7%Moderately 13%
Very18%
How related was your program to your job? How helpful was your training to getting hired? How useful are the skills you learnedin the training program in doing your job?
Source: Workforce Board Participant Survey conducted in 2013.
3 These records do not include self-employment or employment outside the Northwest, typically understating total employment by about 10 percent.
Relatedness of Training to EmploymentAmong Workforce Participants
Figure 4

Workforce Training and Education Coordinating Board Workforce Training Results 2015 | 43
EarningsDesired Outcome: Washington’s workers achieve a family-wage standard of living.
We look at the earnings of participants (those who are not in higher education) three quarters after exit from their program.
Previous editions of Workforce Training Results have shown that how much people earn after participating in a workforce program is closely related to the program’s overall demographics. Young people, for example, had the lowest earnings across all workforce programs. Youth completing high school Career and Technical Education (CTE) programs had median annualized earnings of $10,930, and Workforce Investment Act-Youth participants earned $12,152.
Programs that served adults with significant barriers to employment also recorded low post-program participant earnings—although those earnings could also vary widely. For example, Division of Vocational Rehabilitation participants earned $14,124 per year, while WIA Adults participants earned $25,435.
Those with the highest earnings after completing a workforce program included participants in Apprenticeship ($51,414), WIA-Dislocated Worker program ($34,127), Worker Retraining program ($31,378), and Community and Technical College Professional-Technical education ($27,541). Those participating in a Private Career Schools program earned $23,176.
Math
Work Habits
Reading
Diversity
Computer
Teamwork
English-Speaking
Writing
Job-Speci�c Skills
Machinery Operation
Problem Solving
47%
51%
30%
67%69%
52%
44%
45%
51%
45%
50%
42%
53%
41%
53%
49%
45%
45%
48%
48%
44%
Improved A Lot
Improved A Little
$0
$10,000
$20,000
$30,000
$40,000
$50,000
$60,000
WIA Youth
Secondary CTE
WorkFirst
Services fo
r the Blin
d
Vocational R
ehabilitatio
n
WIA Adult
Basic Educatio
n for A
dults
WIA Dislocated Worker
Worker R
etraining
Apprenticeship
Private Career Schools
CTC Professional-Te
chnical
74%$27,541$23,176
$51,414
$34,127
$17,329$14,124
$25,435 $24,362
$15,049$10,930 $12,152
$31,378
Source: Based on Employment Security Department wage records.
Median Annualized Earnings for Workforce Participants
Figure 5

44 | Workforce Training Results 2015 Workforce Training and Education Coordinating Board
Women and men: Wage gap persists In most instances, women who participated in a workforce program had lower median hourly wages and annual earnings than male participants. Since 2011, the median hourly wage of women relative to men has held fairly constant (women earn around 15 percent less than men) across a range of workforce programs. Women workforce program participants now earn 86 percent of male workforce program participants, 2 percentage points less than in 2014.
General Population
Multi andOther Racial
WhiteHispanicAsian/PIAmericanIndian
African Americans
Disabled
$11.50$11.81$11.82
$10.32
$11.94
$10.49$10.60
$10.15
87% 85% 84% 88% 86%
2010 2011 2012 2013 2014
Source: Based on Employment Security Department wage records.
Earnings were also lower for workforce program participants with disabilities when compared to those without disabilities. Earnings were generally lower for ethnic/racial minority workforce participants than for whites. The differences in post-program wages and earnings by gender, disability, and race/ethnicity generally reflect differences observed in the overall labor market.
Math
Work Habits
Reading
Diversity
Computer
Teamwork
English-Speaking
Writing
Job-Speci�c Skills
Machinery Operation
Problem Solving
47%
51%
30%
67%69%
52%
44%
45%
51%
45%
50%
42%
53%
41%
53%
49%
45%
45%
48%
48%
44%
Improved A Lot
Improved A Little
AllParticipants
WhiteMultiracialHispanicPaci�cIslander
AsianNativeAmerican
AfricanAmericans
Disabled
$11.55 $11.85$12.91
$11.09$12.77 $13.40 $12.89$13.46
$11.81
Source: Based on Employment Security Department wage records.
Figure 6
Figure 7
Women’s Wages as a Share of Men’s Wages
Median Hourly Wage Among Different Populations

Workforce Training and Education Coordinating Board Workforce Training Results 2015 | 45
Employer Satisfaction Desired Outcome: Employers of workforce program participants are satisfied with the results.
The Workforce Board surveys employers every two years to measure their satisfaction with employees who have exited from these programs. Employers were generally satisfied with the overall work quality of new employees who recently completed one of these programs.
20122010200820062004
Very Satis�ed Somewhat Satis�ed Overall Satis�ed
20122010200820062004
40%42%49% 53%
91% 93%
46% 48%
93%
48% 47%
95%
49% 45%
94%
20132011200920072005
90%
95%
95%
91%90%88%87%
Source: Workforce Board Employer Survey conducted in 2012.
Are Participants Satisfied? Desired Outcome: Workforce program participants are satisfied with their program.
The Workforce Board uses surveys to measure participant satisfaction with workforce programs. The Participant Satisfaction measure is the percentage of participants who report in the Participant Survey that they are satisfied with their program overall.
20122010200820062004
Very Satis�ed Somewhat Satis�ed Overall Satis�ed
20122010200820062004
40%42%49% 53%
91% 93%
46% 48%
93%
48% 47%
95%
49% 45%
94%
20132011200920072005
90%
95%
95%
91%90%88%87%
Source: Biennial Workforce Board Participant Survey. Responses reflect average satisfaction across multiple workforce programs.
Employer Satisfaction with Quality of Work for All Workforce Participants
Figure 8
Overall Participants Satisfaction with Workforce ProgramsFigure 9

46 | Workforce Training Results 2015 Workforce Training and Education Coordinating Board
When asked about specific program components, participants tended to be most satisfied with facilities, times, locations, and teaching quality; and least satisfied with advice provided to them in selecting a training program (results varied by individual programs).
Participants were also asked if they needed certain services. Most participants reported receiving the support services they needed while participating. However, 9 to 14 percent of participants reported unmet needs for financial assistance, career counseling, and job opening information. This is similar to earlier evaluations.4
Return on InvestmentDesired Outcome: Workforce development programs provide returns that exceed program costs.
Every four years the Workforce Board conducts net impact and cost-benefit analyses of workforce development programs.5 The net impact part of this study attempts to measure whether a program made a difference in a participant’s success.
Washington is the only state to periodically conduct rigorous net impact evaluations of its workforce programs. The Workforce Board contracted with the W.E. Upjohn Institute for Employment Research (Upjohn) to conduct the net impact and cost-benefit evaluations.
Individuals who participated in these workforce development programs were compared to similar individuals who did not. For most of the programs, the comparison group was selected from registrants with WorkSource who did not receive any other workforce services from Washington’s one-stop career center system.
Different sources of data were used for the comparison groups for Secondary Career and Technical Education, and DVR.6
For the cost-benefit analyses, Upjohn calculated the value of the net impacts on:
• Participant earnings.
• Employee benefits.
• Unemployment insurance (UI) benefits.
• Certain taxes.7
Benefits and costs were counted for the first two and a half years after the program ended, and estimated out to age 65.8
4 Unmet need refers to cases where participants report that either they did not receive the required service or what was provided did not meet their needs.
5 This year’s study examined the experience of participants observed between 2007 and 2010. The net impact and cost-benefit analyses did not include WorkFirst or Department of Services for the Blind programs.
6 A follow-up study was used to identify both students completing a CTE sequence, as well as comparable students who had not. For DVR the comparison group was selected from eligible applicants who left the program before starting a service plan. An empirical approach, called statistical matching, was used to find the employment service registrant, secondary student, DVR client who most closely matched each program participant in terms of a long list of characteristics. These include demographics (such as race and ethnicity, gender, disability status, prior education, age, region of the state), pre-program earnings and employment history, UI benefit receipt history, and pre-program receipt of public assistance.
7 Upjohn estimated the impact of the net change in earnings on Social Security, Medicare, federal income, and state sales taxes.
8 To compare benefits and costs in terms of net present values, post-program benefits and costs are discounted by 3 percent per year and all figures are stated in 2014 Q1 dollars.

Workforce Training and Education Coordinating Board Workforce Training Results 2015 | 47
In general, the findings show workforce development programs have net benefits that exceed program costs. The one clear exception is the Basic Education for Adults program, when participants did not also engage in vocational training (such as Integrated Basic Education and Skills Training—I-BEST). The study did not generally find positive net benefits from participating in Basic Education for Adults alone. This does not mean that no one benefited, but on average, participants did not benefit economically.
Long-Term Net Increases Per Participant Increased Employment Increased Annualized EarningsADULTS
Apprenticeship 9.8 percentage points $19,257 CTC Professional/Technical 10.1 percentage points $9,467
Private Career Schools 3.4 percentage points $2,251 Worker Retraining 7.5 percentage points $3,004
WIA Dislocated Worker 4.7 percentage points $3,622 ADULTS WITH BARRIERS
Basic Education for Adults No Significant Positive Impact $905DVR 12.4 percentage points $1,461
WIA Adult 10.6 percentage points $4,562YOUTH
Secondary CTE 8.4 percentage points $2,157WIA Youth 4.3 percentage points $2,055
Note: Long-term refers to impacts observed nine to 12 quarters (or between two and three years) after leaving the program. Earnings are expressed in 2014 Q1 dollars.
The following figure compares lifetime participant benefits and public benefits to public costs. For example, during the course of working life to age 65, the average Community Technical College (CTC) Professional-Technical education participant will gain about $143,900 in net earnings (earnings minus foregone earnings while in training). These are net gains compared to the earnings of similar individuals who did not receive training (discounted at 3 percent and expressed in 2014 Q1 dollars). For CTC Professional-Technical participants, the ratio of net participant benefits and costs to program costs is about $13 to $1.
Lifetime participant benefits far exceed public costs for most programs, with the exception of Basic Education for Adults (when participants do not also receive vocational training). Tax revenues are also affected by the change in participant earnings. For example, the public gains an estimated $31,378 in net tax revenues for each CTC Professional-Technical participant (taxes minus forgone taxes while participant is in training). Public benefits (estimated changes in tax receipts and UI) outweigh public costs for seven of the 10 programs in the study. Also, previous reports have shown many programs reduce social welfare costs (TANF, food stamps, and medical benefits).

48 | Workforce Training Results 2015 Workforce Training and Education Coordinating Board
Participant Benefits, Increase in Tax Receipts, and Public Costs to Age 65 Net Participant Benefit Public Benefits Public Program Costs*ADULTS
Apprenticeship $332,432 $84,829 $3,647 CTC Professional/Technical $143,899 $31,378 $11,150 Private Career Schools $2,964 $3,609 -Worker Retraining $68,404 $15,396 $7,408WIA Dislocated Worker $40,935 $12,397 $6,273 ADULTS WITH BARRIERS
Basic Education for AdultsNo Significant
Positive ImpactNo Significant
Positive Impact$2,759
DVR $21,681 $3,229 $7,637WIA Adult $44,788 $6,948 $5,772YOUTH Secondary CTE $78,834 $8,673 $922 WIA Youth $43,00 $3,367 $7,156
*Includes state and federal program costs per participant, with the exception of student financial aid programs. Earnings are expressed in 2014 Q1 dollars.
The following table shows the total number of participants in each workforce program included in the Net Impact study. It also shows the total amount of estimated earnings and benefits for each group of participants, projected through age 65, along with the total net of state tax receipts and benefits paid over those years.
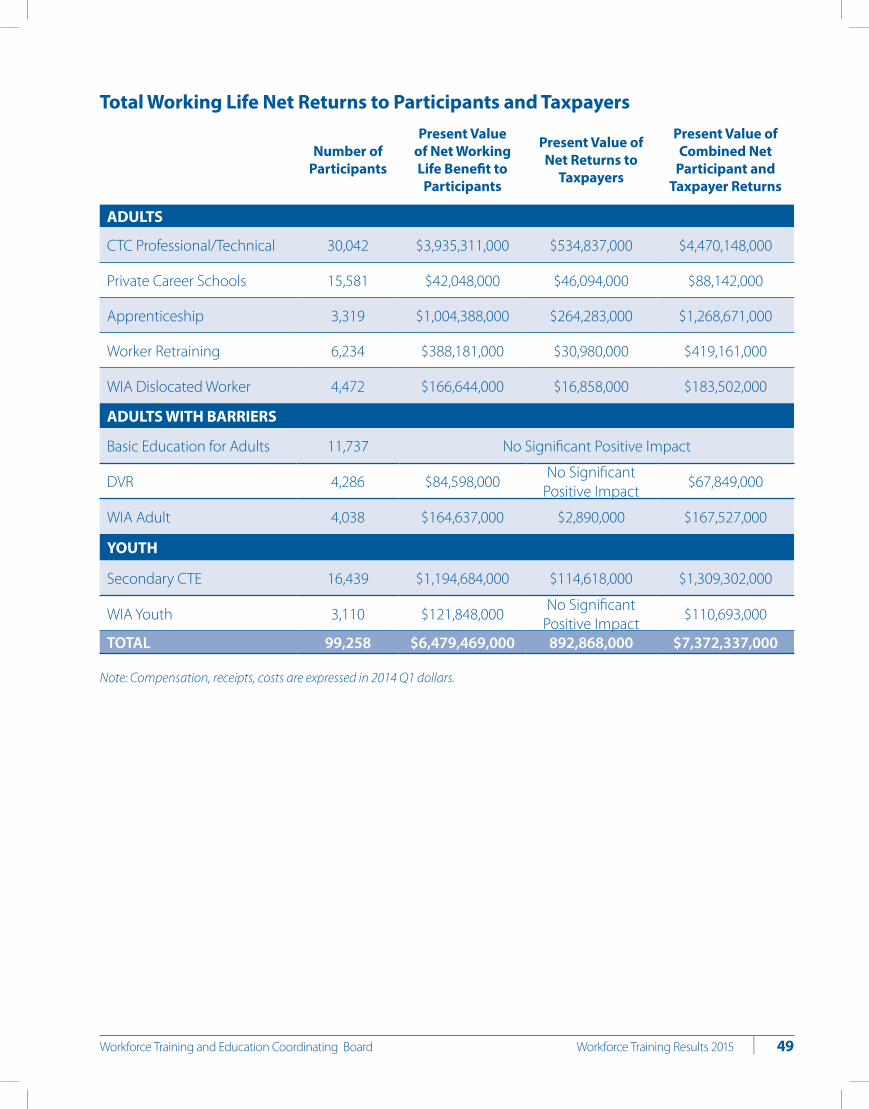
Workforce Training and Education Coordinating Board Workforce Training Results 2015 | 49
Total Working Life Net Returns to Participants and Taxpayers
Number of Participants
Present Value of Net Working Life Benefit to
Participants
Present Value of Net Returns to
Taxpayers
Present Value of Combined Net
Participant and Taxpayer Returns
ADULTS
CTC Professional/Technical 30,042 $3,935,311,000 $534,837,000 $4,470,148,000
Private Career Schools 15,581 $42,048,000 $46,094,000 $88,142,000
Apprenticeship 3,319 $1,004,388,000 $264,283,000 $1,268,671,000
Worker Retraining 6,234 $388,181,000 $30,980,000 $419,161,000
WIA Dislocated Worker 4,472 $166,644,000 $16,858,000 $183,502,000
ADULTS WITH BARRIERS
Basic Education for Adults 11,737 No Significant Positive Impact
DVR 4,286 $84,598,000No Significant
Positive Impact$67,849,000
WIA Adult 4,038 $164,637,000 $2,890,000 $167,527,000
YOUTH
Secondary CTE 16,439 $1,194,684,000 $114,618,000 $1,309,302,000
WIA Youth 3,110 $121,848,000No Significant
Positive Impact$110,693,000
TOTAL 99,258 $6,479,469,000 892,868,000 $7,372,337,000
Note: Compensation, receipts, costs are expressed in 2014 Q1 dollars.

50 | Workforce Training Results 2015 Workforce Training and Education Coordinating Board
Data Sources
Findings are based on the following data sources:
• Program records on over 118,973 individuals who left one of these programs during the 2012-13 program year, observed in 2013 and 2014. These records include information for most participants leaving these programs.
• Telephone survey responses gathered in 2012 from firms that hired new employees who had recently completed one of the programs.
• Telephone survey responses gathered in 2013 from approximately 1,716 participants who had recently left one of these programs.
• Computer matches with Washington Employment Security Department employment records and those of two other states (Idaho and Oregon) as well as federal employment records. These matches provide valuable information on employment and earnings outcomes. However, it’s worth noting that employment rates among workforce program participants is higher than the numbers show, as some forms of employment are not fully accounted for. Self-employment, for example, is not reported. Also, employment figures in states outside the Pacific Northwest are not included in this analysis.
• In order to measure post-program enrollment in higher education for Secondary CTE participants and Workforce Investment Act Youth, computer matches are made using enrollment data from the state’s 34 community and technical colleges and Washington’s public four-year institutions, along with private career schools licensed by the Workforce Board, and apprenticeships overseen by the state Department of Labor & Industries.
• With the exception of Secondary Career and Technical Education, the results presented in this report are for all participants who exited during the 2012-2013 year, not just those who completed their program. Participants are defined as individuals who entered a program and demonstrated the intent to complete a sequence of program activities. The number of participants who leave their program before completion affects program results.

WORKFORCE TRAINING AND EDUCATION COORDINATING BOARD
Our VisionWashington’s Workforce Training and Education Coordinating Board is an active and effective partnership of labor, business, and government leaders guiding the best workforce development system in the world.
Our MissionThe Workforce Training and Education Coordinating Board’s mission is to bring business, labor, and the public sector together to shape strategies to best meet the state and local workforce and employer needs of Washington in order to create and sustain a high-skill, high-wage economy.
To fulfill this Mission, Board members, with the support of staff, work together to:
` Advise the Governor and Legislature on workforce development policy.
` Promote a system of workforce development that responds to the lifelong learning needs of the current and future workforce.
` Advocate for the nonbaccalaureate training and education needs of workers and employers.
` Facilitate innovations in workforce development policy and practices.
` Ensure system quality and accountability by evaluating results and supporting high standards and continuous improvement.
Board Members
Cindy Zehnder, Chair
Representing Labor Representing Government Representing BusinessJeff JohnsonWashington State Labor Council
Marty Brown State Board for Community and Technical Colleges
Creigh H. Agnew Slade Gorton International Policy Center
Lee NewgentSeattle Building Trades Council
Randy Dorn Office of Superintendent of Public Instruction
Gary Chandler Association of Washington Business
Beth Thew Spokane Regional Labor Council, AFL-CIO
Dale Peinecke Employment Security Department
Lee Anne Caylor Microsoft Corporation
Participating OfficialsBrian Bonlender Department of Commerce
Mark Mattke Spokane Area Workforce Development Council
Kevin Quigley State Department of Social and Health Services
Chris Alejano Technology Access Foundation Representing Target Populations

Workforce Training and Education Coordinating Board128 10th Avenue SW, PO Box 43105, Olympia, WA 98504-3105
360-709-4600 • www.wtb.wa.govUNIONLABELTRADES COUNCIL
ALLIED PRINTING
WASHINGTON OREGONl
R 18