work of adhesion in laser-induced delamination along polymer-metal interfaces
TRANSCRIPT

Work of adhesion in laser-induced delamination along polymer-metal interfacesA. Fedorov, R. van Tijum, W. P. Vellinga, and J. Th. M. De Hosson
Citation: Journal of Applied Physics 101, 043520 (2007); doi: 10.1063/1.2434805 View online: http://dx.doi.org/10.1063/1.2434805 View Table of Contents: http://scitation.aip.org/content/aip/journal/jap/101/4?ver=pdfcov Published by the AIP Publishing Articles you may be interested in Investigation of the interfacial adhesion of the transparent conductive oxide films to large-area flexible polymersubstrates using laser-induced thermo-mechanical stresses J. Appl. Phys. 114, 063513 (2013); 10.1063/1.4818310 Time-resolved x-ray diffraction study of laser-induced shock and acoustic waves in single crystalline silicon J. Appl. Phys. 106, 044914 (2009); 10.1063/1.3204968 Effects of tensile and compressive in-plane stress fields on adhesion in laser induced delamination experiments J. Appl. Phys. 103, 103523 (2008); 10.1063/1.2925796 Adhesion of polymer coatings studied by laser-induced delamination J. Appl. Phys. 97, 123510 (2005); 10.1063/1.1929858 Modeling laser texturing of silicate glass J. Appl. Phys. 89, 942 (2001); 10.1063/1.1330550
[This article is copyrighted as indicated in the article. Reuse of AIP content is subject to the terms at: http://scitation.aip.org/termsconditions. Downloaded to ] IP:
67.163.49.174 On: Thu, 27 Mar 2014 05:56:56

Work of adhesion in laser-induced delamination alongpolymer-metal interfaces
A. Fedorov, R. van Tijum, W. P. Vellinga, and J. Th. M. De Hossona�
Department of Applied Physics, Materials Science Centre, University of Groningen, Nijenborgh 4, 9747 AGGroningen, The Netherlands and the Netherlands Institute for Metals Research, University ofGroningen, Nijenborgh 4, 9747 AG Groningen, The Netherlands
�Received 28 July 2006; accepted 3 December 2006; published online 26 February 2007�
Laser-induced delamination is a recent technique aimed at characterizing adhesive strength of thinpolymer coatings on metal substrates. A laser pulse is used to create a blister that initiates furtherdelamination of the film under pressure. To process the experimental data a simple elastic model wasdeveloped. The model predicts values for the blister height and pressure in fair agreement with theexperimental findings. The critical stress state required for delamination and the work of adhesionare derived. To account for possible plastic deformation computer simulations using finite elementswith a mixed mode cohesive zone were carried out. The polymer coating is described with aconstitutive law that includes an elastic response, yielding and hardening with increasing strain. Thestress fields calculated with finite element model are in agreement with those predicted by the elasticmodel and it suggests that the contribution of plastic deformation to the work of adhesion is ratherlimited. Comparative analysis of these two approaches is presented. The theoretical predictions arecompared to experimental results obtained for the 40 �m thick polyethylene terephthalate film onsteel substrate. © 2007 American Institute of Physics. �DOI: 10.1063/1.2434805�
I. INTRODUCTION
Adhesion of polymer coatings on metals is of great in-terest in various industrial applications, e.g., automotive in-dustry, food and beverage packaging, and electronics.Polymer-metal interfaces have been studied for many years,and at present numerous testing techniques are available tocharacterize the interfacial strength.1 It is a common practiceto characterize the strength of the interface with the work ofadhesion, which is defined as the work required to delami-nate a unit area of a film. During delamination, however,most of the testing techniques introduce considerable plasticdeformation in the polymer film. Therefore, one usually dis-tinguishes the thermodynamic work of adhesion and the so-called practical work of adhesion.2–4 The thermodynamicwork of adhesion is defined in wetting experiments by theYoung-Dupré equation. This definition requires that the sys-tem is in the thermodynamic equilibrium and that the processof delamination is reversible. In practice, however, delami-nation proceeds via crack propagation, which is an irrevers-ible process. In that case the interface strength is character-ized by the interfacial energy release rate related to fracturetoughness as defined from Griffith’s criterion. Only if theenergy dissipation from the system is negligible the interfa-cial energy release rate is equal to the thermodynamic workof adhesion. The practical work of adhesion comprises boththe thermodynamic work of adhesion and the plastic defor-mations introduced during testing. The latter depend on themeasuring technique.5,6
We will distinguish plastic deformation introduced nearthe crack tip at the interface from deformation introduced inthe bulk of the polymer. Plastic deformation near the crack
tip still depends on the particular method applied because ofthe mode mixity of the crack opening. However, becauseplastic deformation involves only a very small volume frac-tion its contribution to the total energy balance can be ne-glected. If other energy dissipation mechanisms can be ig-nored, the difference between the thermodynamic and thepractical work of adhesion is due to the plastic deformationsintroduced in the bulk of the polymer film.
In this work polyethylene terephthalate �PET� laminatedmetal sheets used in packaging industry were characterizedwith the laser-induced delamination technique. It will bedemonstrated that the stress fields introduced in the bulk ofthe polymer during delamination do not exceed the yieldstress of the polymer. Therefore plastic deformation does notoccur in the bulk of the polymer coating and consequentlythe work of adhesion obtained from such experiments is agood approximation of the thermodynamic work of adhe-sion.
In the laser-induced delamination technique a coatingunder study is subjected to a series of laser pulses with astepwise increase of intensity. Every shot is carried outthrough a mask resulting in the formation of two parallelcylindrically shaped blisters, as shown in Fig. 1. The imagesof the blisters shown in this figure are measured with confo-cal microscopy. A strip between the blisters is not exposed tothe laser irradiation and it is attached to the substrate at theonset of each series. The cylindrical geometry of the blistersis chosen to facilitate the procedure of measuring the blisterprofiles. Upon increasing the laser pulse intensity, the pres-sure which is formed inside the blisters reaches a criticalvalue resulting in further delamination of the central strip, asshown in Fig. 1. The moment of delamination of the centralstrip is directly related to the strength of the interface. Thea�Electronic mail: [email protected]
JOURNAL OF APPLIED PHYSICS 101, 043520 �2007�
0021-8979/2007/101�4�/043520/8/$23.00 © 2007 American Institute of Physics101, 043520-1
[This article is copyrighted as indicated in the article. Reuse of AIP content is subject to the terms at: http://scitation.aip.org/termsconditions. Downloaded to ] IP:
67.163.49.174 On: Thu, 27 Mar 2014 05:56:56

temperature spike created by the laser disappears in less thana microsecond.7 As a consequence the polymer does not havetime to develop any plastic behavior during blister formation.Another advantage of this technique is that no preliminarysample preparation is required, and polymer coated samplescan be tested directly as received.
To provide a quantitative characterization a linear elasticmodel is developed. By fitting the measured blister profilesto the theoretical description the critical stresses required forthe delamination and the work of adhesion are determined.The model developed by the authors is described in detail inearlier publications.7,8 A summary of the model is presentedbelow, including a number of simplifications. The polymer isconsidered as an unstretchable thin plate subjected only tobending deformation. Secondly, no plastic deformation istaken into account. In order to assess the validity of theseassumptions the stress fields in the film were simulated witha finite element model �FEM� with a mixed mode cohesivezone. The plastic behavior of the polymer is simulated byimplementing a realistic strain-stress relation of the PETpolymer in the stiffness tensor. A comparison between theelastic and elastic-plastic approach and a confrontation to theexperimental observations is presented.
II. THIN PLATE MODEL
A cylindrical blister aligned along the x axis can be de-scribed as a thin plate clamped along the boundaries parallelto the y axis �see Fig. 2�. Within the Kirchhoff assumptions9
the governing equation for deflection w of a thin plate undernormal uniform pressure p in two dimensional �2D� is writ-ten as
d4w
dx4 =p
D, �1�
where D=Et3 / �12�1−�2�� is the flexural rigidity, E is themodulus of elasticity, � is Poisson’s ratio, and t is the filmthickness. Naturally the blisters are overpressurized and thepressure excess over the atmospheric pressure patm is denotedby p. Then the absolute pressure inside the blister is pabs
= patm+ p.Clamped or built-in boundary conditions are used:
w = 0, w� = 0 at x = ±a
2, �2�
where a is the dimension of the blister along the x axis. Thesolution for this boundary value problem is
w�x� =pa4
24D�� x
a�2
−1
4�2
. �3�
The height of a blister H depends on the overpressure pinside the blister and the flexural rigidity D:
H =pa4
384D. �4�
The nonzero stresses obtained from Hooke’s law and byintegrating the equations of equilibrium are given by
�x = −Ez
1 − �2
pa2
6D�3� x
a�2
−1
4� , �5�
�z = −E
2�1 − �2�� z3
3−
t2
4z −
t3
12� p
D− p , �6�
�xz =E
2�1 − �2��z2 −t2
4� px
D. �7�
The maximum stress in the film is achieved for the �x
component at the clamped boundaries at the interface withthe substrate �x=−a /2 and x=a /2, z=−t /2�:
�xmax =
Et
�1 − �2�pa2
24D. �8�
In practice blisters have a finite length. It is convenient tointroduce the blister length b, measured in the y direction.The volume of the blister is obtained by integrating Eq. �3�:
V =pa5b
720D. �9�
Note that in reality the blister is also clamped at the bound-aries y=0 and y=b. However, if b�a the introduced error isnegligible. The elastic strain energy stored in the blister wallis
Ux =1
2
p2a5b
720D. �10�
Now, we consider elementary delamination that is char-acterized by the increase of the blister width, da. Upondelamination the energy of the system reduces due to therelaxation of the blister cap, dU. Secondly, the Helmholtz
FIG. 1. Schematic representation of the laser-induced delamination tech-nique. A series of subsequent laser shots is performed through the mask. Thelaser pulse intensity gradually increases from left to right. The shadowedregion between the blisters is not exposed to the laser radiation and delami-nates only under pressure, which is built up inside the blisters. The imagesof the blisters shown in this figure are taken with confocal microscopy.
FIG. 2. Cylindrical geometry of a blister used in the elastic model.
043520-2 Fedorov et al. J. Appl. Phys. 101, 043520 �2007�
[This article is copyrighted as indicated in the article. Reuse of AIP content is subject to the terms at: http://scitation.aip.org/termsconditions. Downloaded to ] IP:
67.163.49.174 On: Thu, 27 Mar 2014 05:56:56

free energy of the gas inside the blister is reduced dF=−�patm+ p�dV. The gas temperature during delamination isassumed to be constant. The energy gain is spent on fractur-ing of the interface GdS, where G is the work of adhesionand dS=b�da is the delaminated area. Furthermore, workagainst the outside pressure patm is produced: �A= patmdV,where dV is the volume change. Thus the condition fordelamination becomes
− �dF + dU� � GdS + �A . �11�
During delamination the blister volume increases and as-suming that the amount of gas inside the blister stays con-stant, �patm+ p�V=const, the blister overpressure p drops:
�p
�a= −
5p
a
�patm + p�patm + 2p
. �12�
The differentials �dU /da� and �dV /da� are found:
dV
da= � �V
�a�
p+ � �V
�p�
a�dp
da� =
5a4b
720D
p2
�patm + 2p�, �13�
dU
da= � �U
�a�
p+ � �U
�p�
a�dp
da� = −
5
2
a4b
720D
patmp2
�patm + 2p�.
�14�
Combining Eq. �11� with Eqs. �13� and �14� the expressionfor the work of adhesion is obtained:
G =pc
2ac4
288D. �15�
Index c indicates that the corresponding values relate to thecritical condition when the inequality of Eq. �11� turns intoequality. By using Eq. �4� two other expressions for the workof adhesion can be derived:
G =4
3pcHc, �16�
G = 512DHc
2
ac4 . �17�
Equation �16� is similar to the general equation for the workof adhesion in delamination experiments given by Williams10
and the expression for the standard blister test given by Cot-terell and Chen.11 In Eq. �17� the work of adhesion is ex-
pressed through the blister height H and blister width a. Thisequation is convenient to use in the laser-induced delamina-tion, because those two features are derived from a measure-ment of the blister profiles.
III. FINITE ELEMENT MODELING
In order to account for polymer plastic behavior finiteelement modeling was performed. The FEM code used in themodeling is presented in Refs. 12 and 13. The polymer coat-ing is described with a constitutive law that mimics the be-havior of PET. It includes an elastic part, yielding and hard-ening with increasing strain. The polymer-steel interfaceinteraction is described by a rate independent mixed modecohesive zone model which uses the Xu-Needleman form ofpotential:12–14
�n,t� = n + n exp�−n
�n��1 − r +
n
�n�1 − q
r − 1
− �q + � r − q
r − 1�n
�n�exp�−
t2
�t2 � , �18�
where n and t are the normal and tangential displacementcomponents, respectively. The interface strength is definedby the work of the normal �n� and the work of tangential�t� separation related to as t=nq. The correspondingtraction components Tn and Tt are calculated as follows: T�
=−� /�� ��=n , t�. The �n and �t are the characteristic nor-mal and tangential separation lengths at which the corre-sponding tractions reach the maximum in pure normal ortangential loading mode: Tn,0
max�Tn��n ,0�, T0,tmax
�Tt�0,�t /�2�. To provide a realistic behavior of the cohe-sive zone potential at normal compressive stress the param-eters q and r are both taken equal to 0.5. However, becausenormal compressive stresses are not significant during blistergrowth, the final result is not very sensitive to this assump-tion. Simulations were carried out with various input param-eters describing the cohesive zones. The input parameterstogether with the notation of the corresponding cohesivezones are summarized in Table I. In Fig. 3 the cohesive zones�CZ1, CZ3, and CZ5� with the same work of normal separa-tion n �or in other words with the same area under thecurve� but different characteristic separations �n and �t aredemonstrated.
TABLE I. Parameters of the cohesive zones used in the FEM simulations: work of normal separation n;characteristic normal and tangential separation lengths �n and �t; maximum normal �tangential� traction in purenormal �tangential� loading mode Tn,0
max �T0,tmax�; and actual maximum normal �n
max and tangential �tmax stresses
around the crack tip, estimated from the FEM simulations.
n �J /m2� �n �nm� �t �nm� Tn,0max �MPa� T0,t
max �MPa� �nmax �MPa� �t
max �MPa�
CZ1 2.5 50 70.7 18.39 15.16 6.0 12CZ2 2.5 100 141 9.19 7.60 6.0 5.5CZ3 2.5 200 282 4.6 3.8 3.8 1.8CZ4 2.5 300 424 3.06 2.52 2.5 1.3CZ5 2.5 500 707 1.83 1.57 1.7 0.65CZ6 1.0 200 282 1.8 1.5 1.6 0.65CZ7 5.0 200 282 9.2 7.6 6.7 5.0
043520-3 Fedorov et al. J. Appl. Phys. 101, 043520 �2007�
[This article is copyrighted as indicated in the article. Reuse of AIP content is subject to the terms at: http://scitation.aip.org/termsconditions. Downloaded to ] IP:
67.163.49.174 On: Thu, 27 Mar 2014 05:56:56

IV. RESULTS AND DISCUSSION
In this section the stress fields calculated with the elasticmodel and with the FEM code will be compared. Next theblister shape parameters, height H and width a, calculatedwith the elastic model and with the FEM code will be com-pared with those obtained from experiment. This will pro-vide information about the work of adhesion of the measuredpolymer-metal interface and the critical normal and tangen-tial stresses required for delamination.
A. Stress fields
A comparison of the stress fields in the blister cap cal-culated with the linear elastic model and the FEM code ispresented in Fig. 4. In the case of the elastic model thestresses �x, �z, and �xz were calculated with Eqs. �5�–�7�. Inboth models the blister is formed with the same overpressurep=0.75 atm and the blister width a is taken 1 mm. A cohe-sive zone denoted in Table I as CZ3 was used in the FEMsimulation. Other material parameters used both in the linearelastic model and FEM simulations are E=2�109 Pa and
FIG. 3. Normal �top� and tangential �bottom� traction components calcu-lated for the cohesive zones with various characteristic normal traction sepa-ration lengths �n. Tangential separation length is fixed at �t=�2�n.
FIG. 4. Stress fields �x, �z, and �xz calculated with the elastic model �left column, �a�, �c�, and �e�, respectively� and with FEM �right column, �b�, �d�, and�f�, respectively�.
043520-4 Fedorov et al. J. Appl. Phys. 101, 043520 �2007�
[This article is copyrighted as indicated in the article. Reuse of AIP content is subject to the terms at: http://scitation.aip.org/termsconditions. Downloaded to ] IP:
67.163.49.174 On: Thu, 27 Mar 2014 05:56:56

�=0.3. The shape of the blister cap and its height obtainedwith the elastic model and FEM are in agreement.
The �x component of the stress field �Figs. 4�a� and 4�b��has the largest contribution to the strain energy stored in thefilm �bending mode�. The stress is symmetric along themiddle plane of the blister cap. The maximum stress isreached at the polymer-metal interface, at the boundaries ofthe blister, and is tensile in character �x=−a /2 and x=a /2,z=−t /2�. Note that in the case of the elastic model, becauseof the clamped boundary conditions �Eq. �2�� the stress fieldis zero beyond the blister boundaries. In contrast, the FEMsimulations predict nonzero stress fields penetrating beyondthe blister boundaries. The absolute values and the pattern ofthe stress fields obtained in both calculations are in agree-ment.
The �z component calculated with the thin plate modeland FEM are shown in Figs. 4�c� and 4�d�, respectively. Atthe bottom surface the stress is equal to the overpressure andat the top surface is zero. In contrast to the thin plate modelcalculations carried out with the FEM code also predict sig-nificant stress, both compressive and tensile, at the blisterboundaries. This is due to the coupling of the normal andtangential tractions introduced in the cohesive zone. TheFEM prediction is more realistic and it also provides infor-mation about the mode mixity of the crack opening.
The shear stress fields �xz calculated by both models areshown in Figs. 4�e� and 4�f�. It is easy to conclude from Eq.�7� that the field is antisymmetric in x and that it has a qua-draticlike behavior in the z direction. The major discrepancybetween the models is again observed at the blister bound-aries.
Depending on particular blister dimensions the stressfields can deviate from those just demonstrated. However, inall cases relevant to the blisters observed in the laser-induceddelamination experiments the absolute values of the stressesin the bulk of the polymer film do not exceed the yield stressfor PET, which is about 50 MPa. That explains why the plas-tic behavior incorporated in FEM is not observed, and theelastic model provides a satisfactory description.
B. Work of adhesion
In the laser-induced delamination experiments the blisterprofiles are measured with a stylus profiler. The profiles arefitted to Eq. �3�, as shown in Fig. 5, and the blister width aand height H are obtained. Both values are used to calculatethe corresponding work of adhesion by using Eq. �17�. Theflexural rigidity of the polymer is assumed to be known. Thelatter comprises also the coating thickness that is measuredseparately. The agreement between the experimental profilesand the fit suggests that the elastic model provides a realisticdescription of the polymer film deformations.
Figure 6 presents the contour plot of the work of adhe-sion calculated with Eq. �17�. The axes of the plot are theblister width a and height H. Every contour line representscritical blister dimensions at which delamination of an inter-face characterized by the indicated work of adhesion starts.The values of the work of adhesion are given in J /m2. As theintensity of the laser pulse increases a blister height H and
width a should follow the following trend. At low intensities,when no delamination occurs, the width of the blister is con-stant and is equal to the image of the opening in the maskprojected on a sample. The height of the blister graduallyincreases with the intensity of the laser beam. As the laserintensity increases the pressure inside the blisters rises andeventually the condition for delamination described by Eq.�11� is satisfied. Both the blister width and the height in-crease following one of the contour lines given by Eq. �17�.Since the work of adhesion is the characteristic feature of theinterface all blisters involved in delamination, independentof their dimensions, will follow one of the contour lines. Thisbehavior is observed in Fig. 6 where blister dimensions ob-tained from the experiment are shown. In order to cover a
FIG. 5. The blister profilers measured with the stylus profiler �solid line�and fitted to Eq. �3�.
FIG. 6. Contour lines are defined by Eq. �17� and represent the blistercritical dimensions, height H and width b, at which delamination of aninterface characterized with the indicated work of adhesion occurs. Experi-mental data are presented by symbols. Different symbols correspond to dif-ferent series of measurements. FEM simulations carried out with the cohe-sive zone �CZ3� are shown as dashed lines.
043520-5 Fedorov et al. J. Appl. Phys. 101, 043520 �2007�
[This article is copyrighted as indicated in the article. Reuse of AIP content is subject to the terms at: http://scitation.aip.org/termsconditions. Downloaded to ] IP:
67.163.49.174 On: Thu, 27 Mar 2014 05:56:56

wide range of the blister dimensions, a number of series ofmeasurements indicated by different symbols are carried outwith different sizes of the mask. Most of the data points overa wide range of blister widths �from 700 to 1400 �m� arebound between the contour lines corresponding to 2 and3 J /m2. It can also be observed that as the blister widthincreases the data points tend to show a lower work of ad-hesion as predicted by the contour lines.
In the FEM simulations the interaction between the poly-mer and the substrate surfaces is described by the cohesivezone. The mechanical work required to separate these sur-faces, �, is equal to the work of normal separation n used inthe potential given by Eq. �18�:
� = �+ , + � − �0,0� = n. �19�
The evolution of a number of blisters with various initialdimensions is simulated with FEM code. The blister pressureis gradually increased until the delamination takes place. Tocompare the simulations with the experimental results thework of normal separation is chosen to be n=2.5 J /m2. Inthese particular simulations the cohesive zone denoted asCZ3 in Table I was used. The reasons for this choice arediscussed in the next section. The evolution of the blisterdimensions obtained in the simulations is shown in Fig. 6with a dashed line. The characteristic kink in the curve isattributed to the moment of delamination. After delaminationstarts the dashed line should follow one of the contour linesof a constant work of adhesion provided by the elasticmodel. However, because of the unstable behavior theselines could not always be followed by the FEM code.
FEM simulations with various values for the work ofnormal separation n and the initial blister width were car-ried out. The results are shown in Fig. 7. Independent of theinitial blister width all blisters simulated with the same work
of separation start to delaminate at the critical dimensionsgiven by the same contour line. The work of adhesion asso-ciated with this contour line has approximately the samevalue as the work of normal separation used in the FEMsimulations. It is noteworthy that both definitions of the workof adhesion, given by Eqs. �11� and �19�, show a fair agree-ment.
It is also shown that the results obtained with FEM cal-culations are more in line with the experimental measure-ments than the elastic model. There are a number of reasonsfor the discrepancy between FEM simulations and the ex-periments on one side and the elastic model description onthe other. Firstly, in contrast to the elastic model FEM takesstretching of the polymer film into account. Secondly, FEMuses more realistic boundary conditions and FEM simula-tions provide also a more realistic stress distribution aroundthe crack tip �see also Sec. IV A�. In addition the concept ofa thin plate model used in the elastic description is only validunder the condition that H�0.3 t,9 where t is the plate thick-ness. In the case of the 40 �m thick polymer coating used inthis work the blister height is limited with H=12 �m, whichis less than the blisters measured in the experiments.
C. Maximum traction and characteristic separationlength
So far the adhesive strength of polymer-metal interfacewas characterized only in terms of the work of adhesion. Asdemonstrated in Fig. 3 the shape of the potential used in thecohesive zone model depends also on the characteristic sepa-ration lengths �n and �t. These values define the maximumtraction Tn
max and Ttmax. Thus interfaces characterized by the
same work of adhesion may still behave in a different man-ner depending on the relation between maximum tractionsand the stresses developed at the interface. In order to definethe shape of the cohesive zone a number of FEM simulationswere carried out with various separation lengths. The normalwork of separation was fixed to 2.5 J /m2, while the normalcharacteristic separation length �n varied between 50 and500 nm. The tangential separation length �t was fixed at �t
=�2�n to keep the maximums of the normal and tangentialtraction components at the same separation length. The re-sults of the simulations are confronted to the experimentaldata in Fig. 8. The simulations carried out with greater valuesof the separation length turn into delamination regime rathersmoothly. A cohesive zone with a normal separation lengthof �n=200 nm provides the best agreement with the experi-mental data for both series. Thus the measured polymer-metal interface can be described with the cohesive zonegiven by Eq. �18� with the work of normal separation ofn=2.5 J /m2 and the characteristic normal separation lengthof �n=200 nm which is denoted as CZ3 in Table I.
The concept of the cohesive zone provides a certain in-sight into the strain and stress fields around the crack tipduring delamination. In Fig. 9 the evolution of the normaland tangential displacements of three nodes located at theblister boundary is plotted as a function of the blister pres-sure. No such information could be obtained from the elasticmodel �Sec. II�. Moreover, the elastic model predicts that the
FIG. 7. Results of FEM simulations carried out with various values of thenormal work of separation n, which values are given in the legend. Threedifferent initial blister widths were used. Contour lines of constant work ofadhesion are calculated with Eq. �17�.
043520-6 Fedorov et al. J. Appl. Phys. 101, 043520 �2007�
[This article is copyrighted as indicated in the article. Reuse of AIP content is subject to the terms at: http://scitation.aip.org/termsconditions. Downloaded to ] IP:
67.163.49.174 On: Thu, 27 Mar 2014 05:56:56
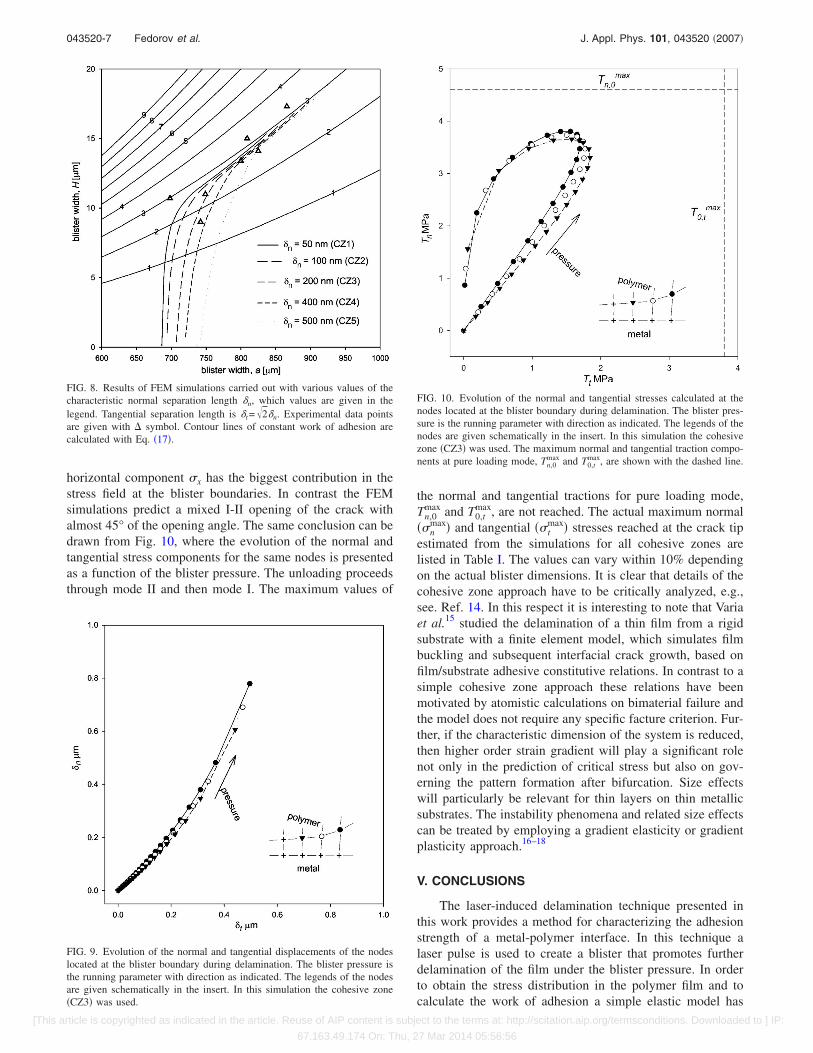
horizontal component �x has the biggest contribution in thestress field at the blister boundaries. In contrast the FEMsimulations predict a mixed I-II opening of the crack withalmost 45° of the opening angle. The same conclusion can bedrawn from Fig. 10, where the evolution of the normal andtangential stress components for the same nodes is presentedas a function of the blister pressure. The unloading proceedsthrough mode II and then mode I. The maximum values of
the normal and tangential tractions for pure loading mode,Tn,0
max and T0,tmax, are not reached. The actual maximum normal
��nmax� and tangential ��t
max� stresses reached at the crack tipestimated from the simulations for all cohesive zones arelisted in Table I. The values can vary within 10% dependingon the actual blister dimensions. It is clear that details of thecohesive zone approach have to be critically analyzed, e.g.,see. Ref. 14. In this respect it is interesting to note that Variaet al.15 studied the delamination of a thin film from a rigidsubstrate with a finite element model, which simulates filmbuckling and subsequent interfacial crack growth, based onfilm/substrate adhesive constitutive relations. In contrast to asimple cohesive zone approach these relations have beenmotivated by atomistic calculations on bimaterial failure andthe model does not require any specific facture criterion. Fur-ther, if the characteristic dimension of the system is reduced,then higher order strain gradient will play a significant rolenot only in the prediction of critical stress but also on gov-erning the pattern formation after bifurcation. Size effectswill particularly be relevant for thin layers on thin metallicsubstrates. The instability phenomena and related size effectscan be treated by employing a gradient elasticity or gradientplasticity approach.16–18
V. CONCLUSIONS
The laser-induced delamination technique presented inthis work provides a method for characterizing the adhesionstrength of a metal-polymer interface. In this technique alaser pulse is used to create a blister that promotes furtherdelamination of the film under the blister pressure. In orderto obtain the stress distribution in the polymer film and tocalculate the work of adhesion a simple elastic model has
FIG. 8. Results of FEM simulations carried out with various values of thecharacteristic normal separation length �n, which values are given in thelegend. Tangential separation length is �t=�2�n. Experimental data pointsare given with symbol. Contour lines of constant work of adhesion arecalculated with Eq. �17�.
FIG. 9. Evolution of the normal and tangential displacements of the nodeslocated at the blister boundary during delamination. The blister pressure isthe running parameter with direction as indicated. The legends of the nodesare given schematically in the insert. In this simulation the cohesive zone�CZ3� was used.
FIG. 10. Evolution of the normal and tangential stresses calculated at thenodes located at the blister boundary during delamination. The blister pres-sure is the running parameter with direction as indicated. The legends of thenodes are given schematically in the insert. In this simulation the cohesivezone �CZ3� was used. The maximum normal and tangential traction compo-nents at pure loading mode, Tn,0
max and T0,tmax, are shown with the dashed line.
043520-7 Fedorov et al. J. Appl. Phys. 101, 043520 �2007�
[This article is copyrighted as indicated in the article. Reuse of AIP content is subject to the terms at: http://scitation.aip.org/termsconditions. Downloaded to ] IP:
67.163.49.174 On: Thu, 27 Mar 2014 05:56:56

been developed. To account for possible plastic deformationcomputer simulations using a finite element model with amixed mode cohesive zone were carried out.
A fair agreement between the stress distributions in thepolymer coating predicted by both models is demonstrated.Plastic deformations are not observed in the bulk of the poly-mer. The only discrepancy between the elastic model andFEM simulations is limited to the crack tip zone but this doesnot affect the calculated value of the work of adhesion.
From a fit of the FEM results to the experimental data itwas concluded that the measured polymer-metal interfacecan be described with a cohesive zone, i.e., the work of nor-mal separation n=2.5 J /m2 and the characteristic normalseparation length of �n=200 nm. The opening of the crack atthe blister boundary appears to be of a I-II mixed mode.From the analysis of the stress fields around the crack tip thecritical normal and tangential stresses required for delamina-tion are estimated.
ACKNOWLEDGMENT
This work was funded by the Netherlands Institute forMetals Research under Project No. MC7.05223.
1A. A. Volinsky, N. R. Moody, and W. W. Gerberich, Acta Mater. 50, 441�2002�.
2H. R. Brown, IBM J. Res. Dev. 38, 379 �1994�.3I. Georgiou, H. Hadavinia, A. Ivankovic, A. J. Kinloch, V. Tropsa, and J.G. Williams, J. Adhes. 79, 239 �2003�.
4Y. Wei and J. W. Hutchinson, Int. J. Fract. 93, 315 �1998�.5L. S. Pen and E. Defex, J. Mater. Sci. 37, 505 �2002�.6D. E. Packman, Int. J. Adhes. Adhes. 23, 437 �2003�.7A. Fedorov and J. Th. M. De Hosson, J. Appl. Phys. 97, 123510 �2005�.8A. Fedorov, J. Th. M. De Hosson, R. van Tijum, and W.-P. Vellinga,Mater. Res. Soc. Symp. Proc. 875, O4.19 �2005�.
9E. Fentsel and Th. Krauthammer, Thin Plates and Shells �Dekker, NewYork, 2001�.
10J. G. Williams, Int. J. Fract. 87, 265 �1997�.11B. Cotterell and Z. Chen, Int. J. Fract. 86, 191 �1997�.12A. Abdul-Baqi, Failure of Brittle Coatings on Ductile Metallic Substrates
�Shaker, Maastricht, the Netherlands, 2002�; A. Abdul-Baqi and E. Vander Giessen, Int. J. Solids Struct. 39, 1427 �2002�.
13X.-P. Xu and A. Needleman, Modell. Simul. Mater. Sci. Eng. 1, 111�1993�.
14M. L. Falk, A. Needleman, and J. R. Rice, J. Phys. IV 11, 43 �2001�.15A. G. Varias, I. Mastorakos, and E. C. Aifantis, Int. J. Fract. 98, 195
�1999�.16E. C. Aifantis, Int. J. Plast. 3, 211 �1987�.17E. C. Aifantis, Mech. Mater. 35, 259 �2003�.18N. A. Fleck and J. W. Hutchinson, Adv. Appl. Mech. 33, 295 �1997�.
043520-8 Fedorov et al. J. Appl. Phys. 101, 043520 �2007�
[This article is copyrighted as indicated in the article. Reuse of AIP content is subject to the terms at: http://scitation.aip.org/termsconditions. Downloaded to ] IP:
67.163.49.174 On: Thu, 27 Mar 2014 05:56:56