women’s empowerment in rwandaoxfamilibrary.openrepository.com/oxfam/bitstream/1054… · ·...
TRANSCRIPT

EVAULATION: MARCH 2014 PUBLICATION: MARCH 2015
BET CAEYERS and ROB FULLER
OXFAM GB
www.oxfam.org.uk/effectiveness
WOMEN’S EMPOWERMENT IN RWANDA Evaluation of women‟s economic leadership through horticulture planting-material business
Effectiveness Review Series 2013/14
Photo credit: Simon Rawles/Oxfam

2 Women‟s Empowerment in Rwanda: Evaluation of women‟s economic leadership through horticulture planting-material business. Effectiveness Review Series 2013-14
CONTENTS
Contents ...................................................................................................................... 2
Acknowledgements .................................................................................................... 3
Executive summary .................................................................................................... 4
1 Introduction .............................................................................................................. 7
2 Project description .................................................................................................. 8
3 Evaluation design .................................................................................................. 10
4 Data ......................................................................................................................... 12
4.1 Sampling approach ........................................................................................ 12
4.2 Analysis .......................................................................................................... 13
5 Results .................................................................................................................... 15
5.1 Introduction .................................................................................................... 16
5.2 Involvement in project activities and support received ............................... 16
5.3 Agricultural production and sales ................................................................ 20
5.4 Household income and indicators of material wealth ................................. 26
5.5 Women’s empowerment ................................................................................ 29
6 Conclusions ........................................................................................................... 43
6.1 Conclusions.................................................................................................... 43
6.2 Programme learning considerations ............................................................ 44
Appendix 1: Thresholds for characteristics of women’s empowerment .............. 45
Appendix 2: Baseline statistics before matching ................................................... 47
Appendix 3: Methodology used for propensity-score matching ........................... 49
Notes ......................................................................................................................... 59

Women‟s Empowerment in Rwanda: Evaluation of women‟s economic leadership through horticulture planting-material business. Effectiveness Review Series 2013-14 3
ACKNOWLEDGEMENTS
We would like to thank the staff of Duterimbere and the Oxfam team in Rwanda for being so supportive during the Effectiveness Review. Particular thanks are due to Patrick Wajero, Julius Namanya, Dieudonne Rutware and Sharad Mahajan, as well as to Jean Chrysostome, the consultant who managed the survey work. We also thank Maria Jakobsen for research assistance.

4 Women‟s Empowerment in Rwanda: Evaluation of women‟s economic leadership through horticulture planting-material business. Effectiveness Review Series 2013-14
EXECUTIVE SUMMARY
Oxfam GB‟s Global Performance Framework is part of the organisation‟s effort to better understand and communicate its effectiveness, as well as enhance learning across the organisation. Under this Framework, a small number of completed or mature projects are selected at random each year for an evaluation of their impact, known as an „Effectiveness Review‟. The project „Women‟s Economic Leadership through Horticulture Planting-Material Business‟ was one of those selected for an Effectiveness Review in the 2013/14 financial year. The project under review was implemented in four districts of Rwanda (Muhanga, Nyagatare, Musanze and Nyamagabe), between August 2011 and March 2014, by Oxfam in conjunction with Duterimbere, a local NGO. The project aimed to strengthen women‟s capacity for engaging in the production of pineapple planting material, and thereby to enhance women‟s socio-economic status at household and community level. Another important dimension of the project was to strengthen the capacity of the microfinance division of Duterimbere to provide finance and business services to women in the planting-material business.
Evaluation design
This Effectiveness Review used a quasi-experimental evaluation design to assess the impact of the project activities approximately three years after implementation started. The review was restricted to the two districts where the project had been implemented since the first year, Muhanga and Nyagatare, where it was thought that sufficient time had elapsed to allow the project‟s effects to have become clear. The review sought to evaluate the project‟s impact among the women who directly participated in the training provided under this project. All 216 women from Muhanga and Nyagatare districts who had attended at least one training session were targeted for interview; 188 were actually located and interviewed. For comparison purposes, 415 women were selected at random from nearby cells (village clusters) where the project had not been implemented. At the analysis stage, the statistical tools of propensity-score matching and multivariate regression were used to control for demographic and baseline differences between the households surveyed in the project and comparison areas, to provide additional confidence when making estimates of the project‟s impact.
Results
The Effectiveness Review found clear evidence of the project‟s impact on engagement in the pineapple planting-material business. Eighty-four per cent of the project participants interviewed reported having engaged in the planting-material business in 2014, against only a small minority (six per cent) of the comparison households. In Nyagatare nearly all the participants (94 per cent) were producing pineapple planting-material, whereas in Muhanga the proportion was 74 per cent. On average the project participants reported that they received 33,800 Rwandan francs (approximately US$47) from the sales of pineapple planting-material during the 12 months prior to the survey. This figure was considerably higher in Nyagatare District, at 43,800 francs, than in Muhanga, where sales were only 20,100 francs on average.

Women‟s Empowerment in Rwanda: Evaluation of women‟s economic leadership through horticulture planting-material business. Effectiveness Review Series 2013-14 5
Key results of this Effectiveness Review
Outcome area Evidence of positive impact?
Comments Muhanga Nyagatare
Engagement in pineapple planting-material business
Yes Yes Most of the project participants were engaged in production of pineapple planting-material, and were generating significant revenue from sales.
Sales of agricultural products
Yes Yes
Strong evidence that the project has enabled project participants to generate more revenue from sales of agricultural products, particularly in Nyagatare District.
Improvement in indicators of material wealth
No No
Most project participants reported that their income has increased since 2010, but this is not clearly reflected in wealth indicators, such as asset ownership and housing conditions.
Improvement in women‟s access to credit
No Yes
Respondents in Nyagatare were more likely to say that they could access a loan from a formal source if necessary – but those in Muhanga were not. Actual borrowing was no more common among project participants than among comparison households in either district.
Increase in women‟s saving
No Yes
Respondents in both districts were more likely to have a personal bank account, but only in Nyagatare were they more likely to have made savings during the past month.
Women‟s empowerment
Yes Yes
Evidence of positive impact in terms of various characteristics of women‟s involvement. Project participants scored positively in 55 per cent of the characteristics on average, compared to 48 per cent among comparison respondents.
Results apply among the 188 women who participated in at least one training session provided by the project in Muhanga and Nyagatare districts, and who were available and willing to be interviewed at the time of the survey.
This production of pineapple planting-materials does not appear to have displaced households‟ other agricultural activities. Instead, project participants seem to have increased their sales of other agricultural products as well: revenue generated from agricultural sales averaged 205,000 francs among the project participants, compared participants, compared to 140,000 francs among the corresponding comparison households. In particular, the project participants were generating much more revenue from sales of products produced in a group (including the pineapple planting-material), but their sales of privately produced crops was not affected. Again, the apparent effect of the project was larger in Nyagatare District than in Muhanga. It is important to consider whether these increases in agricultural sales have led to greater net household income. There is some evidence that this is so, based on questions about respondents‟ perceptions of their income change since before the project started in 2010. (Interestingly, participants in Nyagatare District also said that their income from non-agricultural sources had increased, whereas those in Muhanga said it had decreased.) However, any such increases in income were not clearly reflected in increased asset ownership or housing conditions at the time of the survey – though this is not surprising given the relatively short timeframe over which the project‟s impact was being assessed. A detailed survey of household consumption or expenditure would be needed to assess the project‟s effect on household wellbeing with more confidence. The Effectiveness Review also provides evidence that the project has had a significant positive impact on various characteristics of women‟s empowerment. Project participants in Nyagatare District appeared to have more involvement in household decision-making than did corresponding comparison participants, while those in

6 Women‟s Empowerment in Rwanda: Evaluation of women‟s economic leadership through horticulture planting-material business. Effectiveness Review Series 2013-14
Muhanga District were more positive about their ability to influence decisions at community level. Participants in both districts expressed more positive opinions than comparison respondents about women‟s engagement in livelihood activities and about women‟s rights, and voiced more confidence in their ability to engage in business. In Nyagatare the project participants appeared to have better access to credit than comparison respondents – but the proportion of project participants in both districts who had actually taken out any loans were similar to the comparison respondents. Project participants were also more likely to have a personal bank account, and those in Nyagatare were more likely to have made savings over the past month. Finally, the project participants appeared to have stronger social connections and were participating in a larger number of community groups than were comparison respondents.
Programme learning considerations
Ensure that monitoring and evaluation of projects take account of the effects of
interventions on overall household livelihoods.
The results of this Effectiveness Review demonstrate that project interventions can sometimes have unexpected indirect effects – either positive (for example, the apparent increase in sales of communally-produced agricultural products other than pineapple planting-material, and the reported increase in income from non-agricultural sources in Nyagatare District) or negative (such as the corresponding reported decrease in income from non-agricultural sources in Muhanga). Examining indicators of production or sales of pineapple planting-materials alone would have provided only a partial understanding of the overall effects of this project. This reinforces the necessity of monitoring and evaluation work to consider the impact of interventions on the household economy as a whole. Although measuring a household‟s net income from all income sources is a very complicated undertaking, measures of household consumption, asset ownership, or even subjective reports of changes, can instead be used to give an indication of overall material wellbeing.
Continue to track changes in food security, consumption or wealth indicators
among the project participants, to understand the longer-term impacts of the
project.
Given that much of the training provided under the project had been carried out only a year or two prior to the survey, it is natural to assume that the changes in outcomes found in this Effectiveness Review provide only an interim assessment of the project‟s impact. It would be interesting at least to continue monitoring changes among the project participants over the next two or three years to see how the apparent increases in revenue from agricultural sales generated by the project translates into changes in food security or overall household income. It may even be useful in the future to carry out a follow-up survey with the same respondents as this Effectiveness Review, in order to provide a more detailed understanding of the project‟s long-term effect.
Consider how to increase the effectiveness of gender mainstreaming, and how to
track progress.
The Effectiveness Review has found evidence that the women‟s economic leadership approach applied in this project has had some positive effects on various aspects of women‟s empowerment – including those both directly and indirectly related to the project‟s interventions. Consideration should now be given to how to strengthen these results, and to whether further positive effects could be achieved through having a more active approach to promoting women‟s empowerment, beyond simply facilitating women‟s engagement in income generation. It may also be useful to identify some indicators of empowerment that can be tracked over time, to provide some insight into whether and how the project is affecting women‟s positions in their homes and communities.

Women‟s Empowerment in Rwanda: Evaluation of women‟s economic leadership through horticulture planting-material business. Effectiveness Review Series 2013-14 7
1 INTRODUCTION
Oxfam GB has put in place a Global Performance Framework (GPF) as part of its effort to better understand and communicate its effectiveness, as well as enhance learning across the organisation. This framework requires project/programme teams annually to report output data across six thematic indicator areas. In addition, modest samples of mature projects (e.g. those closing during a given financial year) under each thematic indicator area are being randomly selected each year and rigorously evaluated. One key focus is on the extent they have promoted change in relation to relevant OGB global outcome indicators. This Effectiveness Review took place in March 2014 and was intended to evaluate the success of the project „Women‟s Economic Leadership through Horticulture Planting-Material Business‟ in promoting the empowerment of women among the project participants. This project was implemented by Oxfam in four districts (Muhanga, Nyagatare, Musanze and Nyamagabe), between August 2011 and March 2014 in conjunction with Duterimbere, a local NGO. The focus of this review was on the activities in Muhanga and Nyagatare districts, where activities had taken place since the first year of implementation. In the other two districts implementation started one year later and hence the potential impact was expected to be limited at the time of review. This report presents the findings of the project effectiveness review. Section 2 begins by reviewing the intervention logic of the project, and Section 3 follows by describing the evaluation design. Section 4 describes the data collection process, including the descriptive statistics on the population surveyed and the differences in outcome measures between the intervention and comparison groups at baseline. Section 5 presents the results of the data analysis. Section 6 concludes the document with a summary of the findings and some programme learning considerations.

8 Women‟s Empowerment in Rwanda: Evaluation of women‟s economic leadership through horticulture planting-material business. Effectiveness Review Series 2013-14
2 PROJECT DESCRIPTION
The project under review was part of a larger programme with the objective that women should be recognised as key drivers in the horticulture value chain in Rwanda. The interventions focused on the cultivation of pineapple planting material, particularly in Muhanga and Nyagatare. Although the wider programme aimed at strengthening women‟s capacity at each stage of the value chain, including processing and marketing, the focus of this particular project was on production. The expected contributions of this project to women‟s empowerment in this sector can be summarised by the following three objectives:
1. Contributing to the development of good practice in planting-material business models and their adoption by others.
2. Strengthening microfinance institutions to provide business services to women clients/producers in the planting-material business.
3. Enhancing the socio-economic status of women at household and community, and within institutions such as local government and cooperatives.
Figure 2.2: Simplified logic model for the project
Among the key project activities was the provision of training and mentorship (by Oxfam staff directly and through local project facilitators) in improved agricultural planting-material techniques and in business development. These capacity-building exercises made use of various training methods, including basic information sessions, broadcasting of instruction videos, distribution of leaflets, hands-on demonstrations of the use of water pumps and irrigation systems, and exposure visits to model nurseries and research institutes in other parts of the country.

Women‟s Empowerment in Rwanda: Evaluation of women‟s economic leadership through horticulture planting-material business. Effectiveness Review Series 2013-14 9
One important intermediate objective of the training and the hands-on technical support was to improve the skills and capacities of the women in the production of planting materials. Topics covered included the following:
Pests and disease management, i.e. learning how to protect plants from pesticides and diseases, for instance through the use of jik as a disinfectant during the plantation period.
Drought management, e.g. encouraging the use of water pumps or the use of plastic sheets to collect water.
Nursery preparation and management.
New technologies, such as macro-propagation of pineapple planting-material (a technique of seed multiplication).
In addition, women were trained in various business development skills, including:
enterprise development
how to access and manage credit
conflict management
marketing
development and management of producer groups. Finally, women were also trained in cross-cutting issues, such as HIV/AIDS and gender promotion, building awareness about the role of women in their community and in their households. Together with the training on agricultural production and business skills, this training aimed to improve women‟s confidence in the area of planting-material production and business development. The project worked mainly with women who were already members of producers‟ cooperatives or informal producers‟ groups. In areas where no such groups existed, the implementers encouraged women to form groups. Training was provided to local facilitators, who were then responsible for disseminating the training among other members of their groups and in their communities. In addition to these capacity building objectives, the project aimed to improve women farmers‟ access to credit through microfinance. Before the start of the project, microfinance institutions in the intervention area did not have any financial products suitable for women who were not able to offer collateral. Oxfam partnered with the microfinance division of Duterimbere to develop new financial products (credit and market information) suitable for planting-material producers. In addition to providing credit to smallholder farmers at favourable rates, the organisation distributed water pumps at factory prices. By strengthening the organisation‟s capacity to provide business services to women farmers engaged in producing planting materials, in addition to building women‟s confidence in planting material businesses, the partners intended to improve women‟s access to credit. In turn, by improving women‟s skills and confidence in the production and business development of planting materials, and by improving their access to credit services, the partners expected women to become stronger and more confident players in the horticulture value chain, as producers, suppliers and traders of planting materials.

10 Women‟s Empowerment in Rwanda: Evaluation of women‟s economic leadership through horticulture planting-material business. Effectiveness Review Series 2013-14
3 EVALUATION DESIGN
The central problem in the evaluation of any social programme is how to compare the outcomes that result from that programme with what would have been the case without that programme having been carried out. In the case of this Effectiveness Review, the situation of women in the villages where the project was implemented were examined through a household questionnaire – but clearly it was not possible to observe what their situation would have been had they not had the opportunity to participate in this project. In any evaluation, this „counterfactual‟ situation cannot be directly observed, it can only be estimated. In the evaluation of programmes that involve a large number of units (whether individuals, households, or communities), common practice is to make a comparison between units that were subject to the programme and units that were not. Units where the programme was not implemented can, indeed, provide a good estimate of the counterfactual as long as these – at the outset of the project – can be assumed to be similar to the project participants in all respects except for the implementation of the specific programme. An ideal approach to an evaluation such as this is to select at random the units in which the programme will be implemented. Random selection minimises the probability of there being systematic differences between programme and non-programme units, and so maximises the confidence that any differences in outcomes ex-post are due to the effects of the programme. In the case of the project examined in this Effectiveness Review, the selection of sites where the project was implemented was not made at random. The project was implemented in specific „cells‟ – clusters of villages that are the lowest administrative unit in Rwanda. Cells were deliberately chosen by Duterimbere and Oxfam for inclusion in the project, based on their having particularly high potential for pineapple planting-material production. However, discussions with the implementation staff highlighted that there were more suitable cells within the project areas than were included in the project. This allowed a „quasi-experimental‟ evaluation design to be adopted, in which the situation of women in the non-project cells was assumed to provide a reasonable counterfactual for the situation of women in the implementation cells. It is important to note that, within the project cells, the women who participated in the project were not selected at random. Instead women came to participate in the project activities firstly through connections with the local facilitators, and secondly through their having made an active decision to participate. However, in the comparison cells it could not be known who would have participated in the project activities had they had the opportunity. For that reason, the women interviewed in the comparison cells were selected at random from among the households in those cells. Of course, it is likely that people who elect to participate in a project differ from the average person in a community. For instance, they may be more motivated, or more confident in their ability to succeed in producing a planting material. To minimise this concern, efforts were made to collect data on as many observable baseline characteristics as possible. At the data analysis stage, project participants were „matched‟ with women with similar characteristics in the non-project (or „comparison‟) cells. Matching was performed on the basis of a variety of characteristics – including household size, education level, productive activities, and indicators of material wellbeing, such as housing conditions and ownership of assets. Since some of these characteristics may have been affected by the project itself (particularly those relating to productive activities and wealth indicators), matching was performed on the

Women‟s Empowerment in Rwanda: Evaluation of women‟s economic leadership through horticulture planting-material business. Effectiveness Review Series 2013-14 11
basis of these indicators before the implementation of the project. Since baseline data were not available, survey respondents were asked to recall some basic information about their household‟s situation from before the project was implemented. While this recall data is unlikely to be completely accurate, it should not lead to significant bias in the estimates as long as measurement errors due to the recall data are not significantly different for respondents in the intervention and comparison groups. The survey data provided a large number of baseline household characteristics on which matching could be carried out. One practical problem is that it would be very difficult to find households in the comparison villages that correspond exactly in all these characteristics to households in the project villages. Instead, these characteristics were used to calculate a „propensity score‟, the conditional probability of the woman being a project participant, given particular background variables or observable characteristics. Women in the project and comparison cells were then matched based on their having propensity scores within certain ranges. Tests were carried out after matching to assess whether the distributions of each characteristic were similar between the two groups. As a check on the results derived from the propensity-score matching process, results were also estimated using multivariate regression models. Like propensity-score matching, multivariate regression also controls for measured differences between intervention and comparison groups, but it does so by isolating the variation in the outcome variable, explained by being in the intervention group after the effects of other explanatory variables have been accounted for. It should be noted that both propensity-score matching and multivariate regression models rely on the assumption that the „observed‟ characteristics (those that are collected in the survey and controlled for in the analysis) capture all of the relevant differences between the two groups. If there are „unobserved‟ differences between the groups, then estimates of outcomes derived from them may be misleading. Unobserved differences between the groups could potentially include differences in attitudes or motivation, differences in community leadership, or local-level differences in weather or other contextual conditions faced by producers. These factors give particular cause for caution when interpreting the results of an evaluation for a project such as this, in which participants were to some extent self-selected. This point is further discussed in the context of the results in Section 5.

12 Women‟s Empowerment in Rwanda: Evaluation of women‟s economic leadership through horticulture planting-material business. Effectiveness Review Series 2013-14
4 DATA
4.1 SAMPLING APPROACH The first stage in identifying an appropriate comparison group is to understand the process by which project participants were selected. In the case of this project, there were effectively three levels of selection. Within Nyagatare and Muhanga districts, specific sectors – i.e. administrative sub-units of the district – were selected for implementation, based on their suitability for planting-material production. The second stage in the selection process was for the local partner organisation to identify farmers within those sectors who were interested in planting-material production and to invite them for intensive training on project facilitation. Those trained facilitators were subsequently charged with raising awareness of the project in their respective cells (administrative sub-units of the sector). Across the two districts in which the Effectiveness Review was carried out, the project was implemented in a total of 27 cells. The third stage of selection was for individual farmers within beneficiary cells to decide whether or not to participate in the project activities: that is, they were self-selected. All farmers within the project cells were eligible for participation. Although the project reached both male and female farmers, the focus of this study will be on female participants, as only these formed the main targeted group. A woman was considered to have participated in the project if she attended at least one training session organised under the project. Using records of attendance at project training events, a list was compiled of all female farmers who had attended at least one such training session: 216 individuals in total. Efforts were made to visit each of these women for interview, though only 188 of them were found to be available and willing to be interviewed. Three cases had to be dropped due to data-quality problems, resulting in a total of 185 project participants who were included in the analysis. For comparison purposes, project staff identified, for each of the selected project cells, one nearby comparison cell with similar baseline characteristics in terms of their approximate size, livelihoods activities, and distance to major roads. Efforts were made to select a neighbouring cell within the same sector as the intervention cell, but in cases where all of the cells in a particular sector had been included in the project, a comparison cell was selected in a neighbouring sector. While the project cells were said to have been selected as among the most suitable for production of pineapple planting materials, the implementation staff felt that the comparison cells would also have been eligible to participate had the resources been available to implement the project in more cells. The required sample size for each comparison community was determined by the number of project participants in the neighbouring cell that it was associated with. Specifically, the number of households sampled in a comparison cell had to be at least double the number of women sampled in the equivalent intervention cell. A sample of 415 comparison respondents were interviewed in total. On arriving in each comparison cell, the survey supervisor first met with local officials and worked to produce a map of how households were distributed across the cell. Within each local cluster of houses, a linear route was drawn up which covered every household. The number of interviews required in total for the cell was divided approximately proportionately between each of these different routes. Within each route, households were then selected for interview by systematic random sampling along the linear order. If no adult female member was present and willing to be interviewed at the time of the survey team‟s visit to a selected household, or if the

Women‟s Empowerment in Rwanda: Evaluation of women‟s economic leadership through horticulture planting-material business. Effectiveness Review Series 2013-14 13
household had not been engaged in farming in 2010, no interview was carried out, and the survey team instead moved to the next household on the route.
Table 4.1: Number of respondents interviewed
District Sector Total number of
project participants
Number of
project participants
intervieweda
Number of
comparison
respondents
interviewedb
Muhanga
Mushishiro 57 52 122
Nyarusange 26 26 54
Nyamabuye 12 12 0
Shyogwe 1 1 32
Nyagatare
Musheri 41 33 73
Rwempasha 17 13 21
Nyagatare 9 9
0
Matimba 6 6 12
Rukomo 21 16 31
Katabagemu 26 17 70
216 185 415 a As discussed above, not all project participants were available for interview, which yields the number of women
actually being interviewed being slightly lower than the number of participants in the project. b In the sectors Nyamabuye and Nyagatare all the cells had received support and therefore comparison cells were
selected from neighbouring sectors – hence the zero entry for these sectors.
4.2 ANALYSIS Households in project and comparison villages were compared in terms of their demographic characteristics, livelihoods activities and economic situation in 2009. These data were based on information recalled during the questionnaire or reconstructed from the household composition at the time of the survey. The full comparison is shown in Appendix 2. Some important differences were found between the project participants and comparison respondents. For example, a higher proportion of the project participants were heads of household (38 per cent, against only 29 per cent of the comparison respondents), and on average they were older and had larger households. There were also significant differences between the households of project participants and comparison respondents in their education levels, their livelihoods activities in 2009, and their geographic location (distance to the village centre, market, or water source). These differences, which existed before the project, have the potential to bias any comparison between the project and comparison cells. It was therefore important to control for these baseline differences when making such comparisons. As described in Section 3, the main approach used in this Effectiveness Review to control for the baseline differences was propensity-score matching (PSM). The full details of the matching procedure applied are described in Appendix 3. After matching, women in the project and comparison cells were well-balanced in terms of the recalled baseline data, with very few significant differences between them. However, unfortunately matches could not be found for all of the project participants interviewed. In particular, 11 of the 91 project participants surveyed in Muhanga could not be matched and were dropped

14 Women‟s Empowerment in Rwanda: Evaluation of women‟s economic leadership through horticulture planting-material business. Effectiveness Review Series 2013-14
from the analysis; this applied to only one of the 94 project participants surveyed in Nyagatare. The consequence of this is that the estimates of the project‟s impact presented in Section 5 are not based on a fully representative sample of households in the project communities, but exclude a non-random minority. All the results described in Section 5 of the report were tested for robustness by estimating them with several alternative statistical models, including alternative PSM models and linear or probit regression models. Where the alternative statistical models produce markedly different results from those shown in the tables in Section 5, this is discussed in the text or in the footnotes. It is important to recall, as highlighted in Section 3, that PSM and regression models can control only for the baseline differences between the households in project and comparison communities for which data was collected in the survey. If there are any „unobserved‟ pre-existing differences between the two groups – such as individuals‟ attitudes, motivation, skills or confidence – then these may bias the estimates of outcomes described in Section 5. Given that the project participants are a self-selected group, this possibility cannot be excluded and must be borne in mind when interpreting the results.

Women‟s Empowerment in Rwanda: Evaluation of women‟s economic leadership through horticulture planting-material business. Effectiveness Review Series 2013-14 15
5 RESULTS
Statistics primer
This report is intended to be free from excessive technical jargon, with more detailed technical information being restricted to the footnotes and appendices. However, there are some statistical concepts that cannot be avoided in discussing the results.
Effect size
The size or magnitude of an effect when evaluating outcomes refers to the size of the difference between groups. In this report, results will usually be stated as the average difference between the project participants (that is, the „intervention group‟) and the matched women interviewed in the communities where the project was not implemented (the „comparison group‟).
Statistical significance
When we refer to „impact‟ in this report, we mean differences between the project participants and comparison respondents that are statistically significant. For example, imagine that we find that the average project participant is cultivating two hectares of land at the time of the survey, while the average comparison respondent is cultivating only one hectare. This seems to be a large difference between the two groups. However, it is important to remember that this estimated average impact is derived from data on a sample of comparison respondents, rather than data on the whole population. It is possible that, by chance, we happen to have interviewed comparison respondents who are cultivating relatively small areas of land, but that the land area cultivated in the overall pool of women in the comparison communities is similar to that found among the project participants. For this reason, it is necessary to take into consideration the statistical probability of finding a difference of one hectare if there were in reality no difference in land area cultivated between the project participants and comparison respondents. This probability is usually referred to as the p-value. p-values help to evaluate study hypotheses. The default hypothesis is always that there are no differences between the intervention and comparison groups. When a difference is detected, the p-value is used to evaluate whether the default hypothesis (that there is no difference between the intervention and comparison groups) should be rejected – that is, to conclude that the project had an impact. If the p-value is small, for instance one per cent, this means that the probability that our sample would show project participants cultivating one extra hectare of land compared to comparison respondents when the true difference is only one per cent. This is a small probability, and so we would have confidence in rejecting the default hypothesis that the project had no impact on this outcome. We would then say that the result is „statistically significant‟. Note that the smaller the sample size and the greater the variation in the outcome measures among the sampled households, the larger the p-value will be, and hence the less likely we are to be able to conclude that a result is statistically significant. In the tables of results on the following pages, statistical significance will be indicated with asterisks, with three asterisks (***) indicating a p-value of less than one per cent, two asterisks (**) indicating a p-value of less than five per cent and one asterisk (*) indicating a p-value of less than 10 per cent. The higher the p-value, the less confident we are that the measured estimate reflects the true impact. Results with a p-value of more than 10 per cent are usually not considered to be statistically significant.

16 Women‟s Empowerment in Rwanda: Evaluation of women‟s economic leadership through horticulture planting-material business. Effectiveness Review Series 2013-14
5.1 INTRODUCTION This section presents a comparison of the respondents interviewed in the project and comparison cells in terms of various outcome measures relevant to the project. In the tables of results, asterisks are used to indicate where the differences are statistically significant at at least the 10 per cent significance level. The results are shown after correcting for apparent baseline differences between the project participants (the „intervention group‟) and the respondents in comparison cells, using a propensity-score matching (PSM) procedure. More information about the procedure applied is found in Appendix 3. All outcomes discussed here have also been tested for robustness with alternative statistical models. Where those alternative models produce markedly different results from those shown in the tables in this section, this is discussed in the text or in the footnotes. It is important to stress that the results presented in this section are average results across all the project participants in the two districts where the survey was carried out. With this evaluation design, it was not possible to investigate differences in the project‟s impact between the different sectors or cells. Two further points should be recalled when interpreting the results presented in this section of the report. Firstly, a minority of the project participants surveyed (11 of the 91 surveyed in Muhanga District, but only one of the 94 surveyed in Nyagatare) were excluded from the analysis during the matching process. This means that the results shown in the tables in this section are not based on a fully representative sample of the project participants interviewed. However, some of the alternative statistical models tested (and discussed in the text or in footnotes where appropriate) do include the full set of households interviewed in the project villages. Secondly, the statistical estimation procedures used to derive estimates of outcomes are based only on „observable‟ baseline characteristics of the respondents and their households. If there are any „unobserved‟ pre-existing differences between the project participants and comparison respondents – such as individuals‟ attitudes, motivation, skills or confidence – then these may bias the estimates of outcomes described in this section. Given that the project participants are a self-selected group, this possibility cannot be excluded and must be borne in mind when interpreting the results.
5.2 INVOLVEMENT IN PROJECT
ACTIVITIES AND SUPPORT RECEIVED The first step in understanding what impact this project has had is to examine the extent to which respondents participated in the activities implemented under the project. This is important both as a confirmation that the project participants received the training and support that the project delivered, and also to confirm that comparison respondents did not receive equivalent types of support during the project‟s lifetime. Table 5.1 shows the proportions of project participants and comparison respondents who reported having received various types of training since 2010. As expected, the project participants were significantly more likely than comparison respondents to report having received most of these types of training. In particular, the majority (62 per cent) of project participants reported having received training on the production of planting material, against only a small number (13 per cent) of comparison

Women‟s Empowerment in Rwanda: Evaluation of women‟s economic leadership through horticulture planting-material business. Effectiveness Review Series 2013-14 17
respondents. There were also significant differences between the proportions of households receiving training on entrepreneurship, HIV/AIDS, gender promotion, producer group development and management, conflict management, and perhaps (though less clearly) on access to credit.1 Very few respondents (only one per cent overall) reported that any household member had received training in marketing. Overall, out of the nine training topics listed in the questionnaire, on average the project participants reported that they participated in training on more than two of these topics, while the comparison respondents participated in training on only one of these topics.2 However, for those who did receive training, the average number of training sessions in which they participated was approximately the same between the project participants and comparison respondents. It will be observed from Table 5.1 that, despite being larger than among the comparison respondents, the proportions of project participants who reported participating in some of these types of training were fairly small. Only in the case of training on planting-material production did more than half the project participants report taking part. However, it should be recalled that most training provided under this project was carried out by local facilitators. It is possible that, when asked about their participation in training, survey respondents were not thinking of these more informal training sessions provided by facilitators from within their community. Project staff were more often present during training on production techniques, which perhaps meant that these events were recognised more clearly as formal training sessions: this would explain the larger proportion of project participants who recalled having participated in training on production techniques. As a follow-up to the question about their participation in training, respondents were asked whether they had in fact applied the knowledge or practices they had learned in those sessions. For two thirds (66 per cent) of the types of training they had received, the project participants said that they had „often‟ applied what they had learned; the corresponding proportion among the comparison respondents was only 57 per cent.3 In particular, most of project participants who recalled having received training in the production of planting material said that they had often applied the lessons of that training. In contrast, even among the small number of comparison respondents who received such training, the majority said that they only occasionally applied what they had learned. Another follow-up question asked respondents when, since 2010, was the first time they received training on each topic. It is interesting to note from these responses that the majority of training provided under the project seems to have taken place since January 2012, and that more than a third of project participants said that they had participated in their first training session only since January 2013. This pattern was particularly clear in the key types of training delivered under the project – training in production of planting material and in producer group development and management. This confirms the reports of implementing partners that the delivery of some of the training carried out under this project was delayed (partly as a result of delays in funding being received). It should be recalled in interpreting the results of later sections that the results represent only the short- or medium-term impact of the project activities, one to two years after implementation.

18 Women‟s Empowerment in Rwanda: Evaluation of women‟s economic leadership through horticulture planting-material business. Effectiveness Review Series 2013-14
Table 5.1: Respondents’ participation in training since 2010
1 2 3 4 5 6 7 8
Training on
entrepreneur-
ship
%
Training on
marketing
%
Training on
production of
planting
material
%
Training on
HIV/AIDS
%
Gender
promotion
%
Training on
producer group
development
and
management
%
Training on
conflict
management
%
Training on
use of credit
%
Overall
Intervention group mean: 35.3 1.7 61.8 34.1 29.5 41.6 21.4 12.7
Comparison group mean: 17.3 1.2 12.7 15.0 18.8 3.2 10.4 8.5
Difference: 18.0*** (4.2)
0.6 (1.2)
49.2*** (4.7)
19.1*** (4.7)
10.7** (4.7)
38.4*** (3.8)
11.0*** (4.0)
4.2 (3.4)
Observations (intervention group): 173 173 173 173 173 173 173 173
Observations (total): 548 548 548 548 548 548 548 548
Muhanga
Intervention group mean: 33.8 2.5 53.8 32.5 31.3 45.0 23.8 13.8
Comparison group mean: 23.1 2.1 15.2 14.8 15.8 4.8 6.7 6.0
Difference: 10.6 (6.9)
0.4 (2.3)
38.6*** (6.6)
17.7*** (6.4)
15.4** (7.0)
40.2*** (5.7)
17.0*** (5.0)
7.7* (4.2)
Observations (intervention group): 80 80 80 80 80 80 80 80
Observations (total): 256 256 256 256 256 256 256 256
Nyagatare
Intervention group mean: 36.6 1.1 68.8 35.5 28.0 38.7 19.4 11.8
Comparison group mean: 12.3 0.3 10.5 15.2 21.4 1.90 13.6 10.6
Difference: 24.3*** (5.7)
0.7 (1.2)
58.3*** (6.2)
20.2*** (6.3)
6.6 (6.7)
36.8*** (5.0)
5.7 (6.1)
1.2 (5.2)
Observations (intervention group): 93 93 93 93 93 93 93 93
Observations (total): 292 292 292 292 292 292 292 292
Standard errors in parentheses; * p<0.1, ** p<0.05, *** p<0.01; PSM estimates are bootstrapped with 1,000 repetitions.

Women‟s Empowerment in Rwanda: Evaluation of women‟s economic leadership through horticulture planting-material business. Effectiveness Review Series 2013-14 19
Table 5.2 shows the proportion of respondents who reported that their households had received various types of practical support – other than training – since 2010. Considerably more of the project participants (or other members of their households) had taken part in exposure visits and had received ongoing advice and technical support than comparison households had. Few respondents reported having received information about planting-material production in public meetings, or having been provided with water pumps at factory prices.
Table 5.2: Households receiving other forms of support since 2010
1 2 3 4
Exposure visits
to model farms
or nurseries
%
Technical
support on
farming and
nursery
techniques
%
Information
about planting-
material
production
during public
meetings
%
Provision of
water pumps
at factory
prices
%
Overall
Intervention group mean: 21.4 32.9 9.2 1.7
Comparison group mean: 9.1 6.5 4.5 1.5
Difference: 12.3*** (3.8)
26.4*** (4.1)
4.8 (3.1)
0.3 (1.3)
Observations (intervention group): 173 173 173 173
Observations (total): 548 548 548 548
Muhanga
Intervention group mean: 22.5 22.5 6.2 2.5
Comparison group mean: 8.8 5.9 2.1 1.3
Difference: 13.7** (5.8)
16.6*** (5.4)
4.1 (3.1)
1.2 (2.2)
Observations (intervention group): 80 80 80 80
Observations (total): 256 256 256 256
Nyagatare
Intervention group mean: 20.4 41.9 11.8 1.1
Comparison group mean: 9.3 7.1 6.5 1.6
Difference: 11.2** (5.4)
34.9*** (5.8)
5.3 (4.7)
-0.5 (1.7)
Observations (intervention group): 93 93 93 93
Observations (total): 292 292 292 292
Standard errors in parentheses; * p<0.1, ** p<0.05, *** p<0.01; PSM estimates are bootstrapped with 1,000 repetitions.

20 Women‟s Empowerment in Rwanda: Evaluation of women‟s economic leadership through horticulture planting-material business. Effectiveness Review Series 2013-14
5.3 AGRICULTURAL PRODUCTION AND
SALES As discussed in Section 2, the project under review intended to achieve its aim of enhancing the socio-economic status of women by building women‟s engagement in the horticulture value chain as producers, suppliers and traders. To that end, this section will examine the evidence provided by the data for changes in producers‟ agricultural production and sales. The first indicator of households‟ investment in agriculture is the land-area cultivated. Survey respondents were asked about the total area their household had cultivated during the 12 months prior to the survey, including land used for nurseries for planting material as well as that used for crop production. The first column of Table 5.3 shows That households of project participants generally cultivated a much larger land area than the comparison households in that year: an average of 1.6 hectares, compared to only 1.0 hectare among the comparison households. When comparing this to the recalled baseline data, it appears that the area of land cultivated by project participant households increased significantly since 2010.
Table 5.3: Land cultivated in the 12 months prior to the survey
1 2 3 4
Total area of
land cultivated
(hectares)
Area of land
cultivated
privately
(hectares)
Area of land
cultivated in a
group
(hectares)
Proportion of
households that
can irrigate at
least parts of
their land
(%)
Overall
Intervention group mean: 1.63 0.81 0.82 10.4
Comparison group mean: 1.00 0.67 0.34 14.4
Difference: 0.63*** (0.11)
0.14** (0.07)
0.49*** (0.07)
-3.9 (3.3)
Observations (intervention group):
173 173 173 173
Observations (total): 548 548 548 548
Muhanga
Intervention group mean: 1.55 0.61 0.94 20.0
Comparison group mean: 1.03 0.50 0.53 25.0
Difference: 0.52*** (0.16)
0.11 (0.10)
0.40*** (0.10)
-5.0 (6.4)
Observations (intervention group):
80 80 80 80
Observations (total): 256 256 256 256
Nyagatare
Intervention group mean: 1.71 0.99 0.72 2.2
Comparison group mean: 0.98 0.81 0.17 5.2
Difference: 0.73*** (0.15)
0.17* (0.10)
0.56*** (0.09)
-3.1 (2.5)
Observations (intervention group):
93 93 93 93
Observations (total): 292 292 292 292
Standard errors in parentheses; * p<0.1, ** p<0.05, *** p<0.01; PSM estimates are bootstrapped with 1,000 repetitions.

Women‟s Empowerment in Rwanda: Evaluation of women‟s economic leadership through horticulture planting-material business. Effectiveness Review Series 2013-14 21
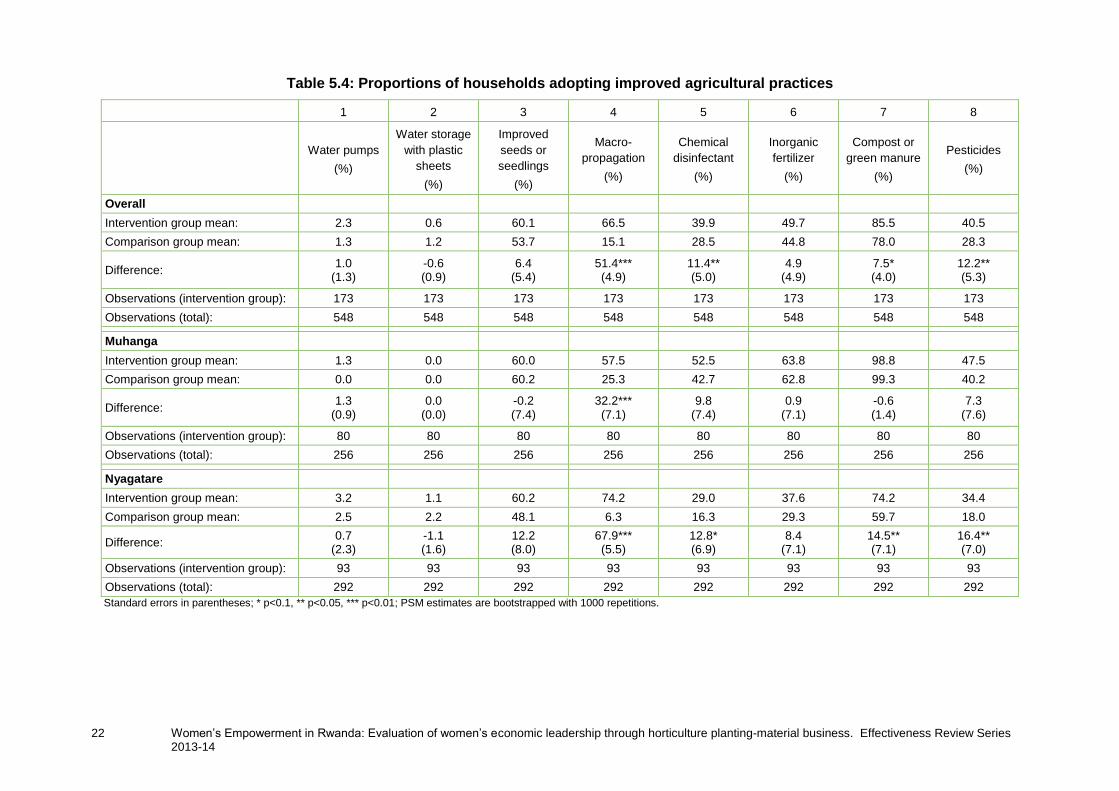
Respondents were also asked to specify how much of this land was cultivated privately by their household, and how much was cultivated jointly with others. The results in columns 2 and 3 of Table 5.3 show that most of the difference in the quantity of land cultivated by project and comparison households was in land cultivated jointly with others – as expected, since the nurseries for pineapple planting-material were mostly managed jointly in groups. However, there is also some evidence that the quantity of land cultivated privately increased among project participants more than among comparison households.4 Column 4 of Table 5.3 shows that there is no indication of a difference between the project participants and comparison households in terms of their access to irrigation. As part of the project, women were trained in the use of various improved agricultural practices. Table 5.4 shows that women appear to having adopted some of these practices – especially macropropagation and the use of chemical disinfectant and pesticides – at greater rates than the comparison households. In addition, the use of compost or manure was clearly higher among project participants than among comparison households in Nyagatare District. (In Muhanga, use of compost was almost universal even among comparison households.) Approximately half of respondents reported using inorganic fertiliser, and slightly more than half using improved seeds or seedlings; in both cases there is some evidence of a difference between the project participants and comparison households in Nyagatare District, though the evidence is not conclusive.5 Very few respondents from either district reported using water pumps or plastic sheets for water storage.
22 Women‟s Empowerment in Rwanda: Evaluation of women‟s economic leadership through horticulture planting-material business. Effectiveness Review Series 2013-14
Table 5.4: Proportions of households adopting improved agricultural practices
1 2 3 4 5 6 7 8
Water pumps
(%)
Water storage
with plastic
sheets
(%)
Improved
seeds or
seedlings
(%)
Macro-
propagation
(%)
Chemical
disinfectant
(%)
Inorganic
fertilizer
(%)
Compost or
green manure
(%)
Pesticides
(%)
Overall
Intervention group mean: 2.3 0.6 60.1 66.5 39.9 49.7 85.5 40.5
Comparison group mean: 1.3 1.2 53.7 15.1 28.5 44.8 78.0 28.3
Difference: 1.0
(1.3) -0.6 (0.9)
6.4 (5.4)
51.4*** (4.9)
11.4** (5.0)
4.9 (4.9)
7.5* (4.0)
12.2** (5.3)
Observations (intervention group): 173 173 173 173 173 173 173 173
Observations (total): 548 548 548 548 548 548 548 548
Muhanga
Intervention group mean: 1.3 0.0 60.0 57.5 52.5 63.8 98.8 47.5
Comparison group mean: 0.0 0.0 60.2 25.3 42.7 62.8 99.3 40.2
Difference: 1.3
(0.9) 0.0
(0.0) -0.2 (7.4)
32.2*** (7.1)
9.8 (7.4)
0.9 (7.1)
-0.6 (1.4)
7.3 (7.6)
Observations (intervention group): 80 80 80 80 80 80 80 80
Observations (total): 256 256 256 256 256 256 256 256
Nyagatare
Intervention group mean: 3.2 1.1 60.2 74.2 29.0 37.6 74.2 34.4
Comparison group mean: 2.5 2.2 48.1 6.3 16.3 29.3 59.7 18.0
Difference: 0.7
(2.3) -1.1 (1.6)
12.2 (8.0)
67.9*** (5.5)
12.8* (6.9)
8.4 (7.1)
14.5** (7.1)
16.4** (7.0)
Observations (intervention group): 93 93 93 93 93 93 93 93
Observations (total): 292 292 292 292 292 292 292 292
Standard errors in parentheses; * p<0.1, ** p<0.05, *** p<0.01; PSM estimates are bootstrapped with 1000 repetitions.

Women‟s Empowerment in Rwanda: Evaluation of women‟s economic leadership through horticulture planting-material business. Effectiveness Review Series 2013-14 23
Production and sales of pineapple planting material
Clearly the main area in which we would expect to see impact of the project to be demonstrated is in the production and sales of pineapple planting-material. Table 5.5 shows that most (84 per cent) of the intervention group reported having been engaged in production of pineapple planting-materials in 2014, against only a small minority (six per cent) of the comparison group. In Nyagatare nearly all the participants (94 per cent) were producing pineapple planting-material, whereas in Muhanga, a quarter, (26 per cent) were not. Those who did not engaged in producing pineapple planting-material were asked why not. Approximately half of the comparison respondents said that they did not have the skills or knowledge needed; interestingly, another quarter of comparison respondents mentioned that they did not have access to sufficient land. The project participants reported that they received an average of 33,800 Rwandan francs (approximately US$47) from the sales of pineapple planting-material during the 12 months prior to the survey. This figure was considerably higher in Nyagatare District, at 43,800 francs, than in Muhanga, where sales were only 20,100 francs on average. (Among the few comparison respondents who were producing planting material, average sales were much smaller.) Most of the sales were reported to have been made in local or district markets, though 31 per cent of the project participants in Nyagatare and 15 per cent in Muhanga reported having made sales through a producer group. In response to questions about how they feel about their planting-material activities, just over half of the project participants who had made sales said that they were satisfied with the quantity they had sold during the past year, and nearly all said that they expected to continue producing pineapple planting-material in the next year.
Table 5.5: Engagement in pineapple planting material activities
Household engaged in production of pineapple planting
materials at the time of the survey
%
Overall
Intervention group mean: 84.4
Comparison group mean: 6.4
Difference: 76.1*** (3.8)
Observations (intervention group): 173
Observations (total): 548
Muhanga
Intervention group mean: 75.0
Comparison group mean: 7.6
Difference: 67.4*** (6.1)
Observations (intervention group): 80
Observations (total): 256
Nyagatare
Intervention group mean: 92.5
Comparison group mean: 8.9
Difference: 83.5*** (4.7)
Observations (intervention group): 93
Observations (total): 292 a Among households that engaged in producing pineapple planting-material during the 12 months prior to the survey.
Standard errors in parentheses; * p<0.1, ** p<0.05, *** p<0.01; PSM estimates are bootstrapped with 1,000 repetitions.

24 Women‟s Empowerment in Rwanda: Evaluation of women‟s economic leadership through horticulture planting-material business. Effectiveness Review Series 2013-14
Total agricultural sales
Table 5.6 compares intervention group women and comparison group women in terms of total sales of agricultural produce, including pineapple planting-material and all other crops. The first column of the table shows the value of sales reported by households. In the second column these figures are shown in logarithmic form, so as to reduce the influence on the average figures of any households with particularly large reported sales. It can be seen that there are very large differences in the sales revenue generated by households of project participants and those of comparison respondents. In particular, the logarithmic value of average sales revenue in Nyagatare District is consistent with sales being approximately twice as high among the project participants than among comparison households. On the other hand, the difference in terms of the logarithmic coefficient in Muhanga is not statistically significant. Further detail on these results is provided by the remaining columns of Table 5.6, where total sales revenue is disaggregated into (a) revenue from sales of agricultural products produced privately by the household, and (b) revenue from sales of agricultural products produced in a group (including pineapple planting-material). It can be seen in columns 3 and 4 that there is no indication of any difference between the project and comparison households in sales of crops grown privately. However, columns 5 and 6 show that the project participants generated income several times higher from crops grown in a group than did the project participants. In fact 80 per cent of the project participants reported generating some revenue from sales of crops grown in a group, against only 37 per cent of the comparison households. These results imply, then, that the project has successfully enabled participants to generate higher sales of crops produced in a group, without negatively affecting revenue generated from households‟ private production. By comparing these results with data on sales of pineapple planting-material, it is clear that the planting-material activities make up only part of the difference in sales revenue shown in Table 5.6; that is, the project appears to have enabled participants to generate higher revenue from other crops as well. This may be the result of the training and support provided in the project in negotiation and marketing having positive effects on participants‟ capacity to access markets for products other than pineapple planting material. Of course, the fact that revenue generated from sales of agricultural products is higher among the intervention households does not necessarily imply that overall household income has seen such a large increase. It is likely that the intervention group has also faced higher costs of production in generating their additional revenue. To determine the net effect on income generated from agricultural activities, it would be necessary to take account of the costs of production – including the costs of inputs, rent for land on which products are grown (or the value of potential alternative uses for the land), and transportation and other costs involved in making sales. Just as important would be to account for whether household members had diverted time into agricultural production which would otherwise have been spent on other productive activities (i.e. opportunity costs of production). Making a calculation of costs and opportunity costs in this way would be complicated, and would require more detailed data than is available in this effectiveness review. However, some indication of the project‟s net effect on household income is provided by indicators considered in Section 5.4.

Women‟s Empowerment in Rwanda: Evaluation of women‟s economic leadership through horticulture planting-material business. Effectiveness Review Series 2013-14 25
Table 5.6: Agricultural sales in the 12 months prior to the survey
1 2 3 4 5 6
Total value
of
agricultural
produce
sold
(Rwandan
francs)
Total value
of
agricultural
produce
sold
(logarithm of
Rwandan
francs)
Value of
private
agricultural
produce
sold
(Rwandan
francs)
Value of
private
agricultural
produce
sold
(logarithm of
Rwandan
francs)
Share of
value of
agricultural
produce
sold in a
group
(Rwandan
francs)
Share of
value of
agricultural
produce
sold in a
group
(logarithm of
Rwandan
francs)
Overall
Intervention group mean:
204 659 11.5 107 928 10.5 96 731 9.0
Comparison group mean:
140 045 11.1 100 129 10.6 39 916 4.2
Difference: 64 614*** (21 833)
0.5** (0.2)
77 98 (18 482)
-0.1 (0.2)
56 815*** (9 659)
4.8*** (0.5)
Observations (intervention group):
173 173 173 173 173 173
Observations (total):
548 548 548 548 548 548
Muhanga
Intervention group mean:
178 080 11.3 58 706 10.1 119 374 9.8
Comparison group mean:
128 746 11.1 64 184 10.4 64 562 6.4
Difference: 49 334** (19 339)
0.2 (0.3)
-5 478 (8 258)
-0.3 (0.3)
54 812*** (14 746)
3.4*** (0.7)
Observations (intervention group):
80 80 80 80 80 80
Observations (total):
256 256 256 256 256 256
Nyagatare
Intervention group mean:
227 522 11.7 150 269 10.8 77 253 8.3
Comparison group mean:
149 764 11.1 131 050 10.7 18 715 2.3
Difference: 77 757** (36 569)
0.7*** (0.2)
19 219 (32 035)
0.0 (0.3)
58 538*** (11 542)
6.0*** (0.7)
Observations (intervention group):
93 93 93 93 93 93
Observations (total):
292 292 292 292 292 292
Standard errors in parentheses; * p<0.1, ** p<0.05, *** p<0.01; PSM estimates are bootstrapped with 1,000 repetitions.
26 Women‟s Empowerment in Rwanda: Evaluation of women‟s economic leadership through horticulture planting-material business. Effectiveness Review Series 2013-14
5.4 HOUSEHOLD INCOME AND
INDICATORS OF MATERIAL WEALTH In a separate section of the questionnaire, respondents were asked to estimate whether their household‟s income from various activities had increased or decreased since 2010. The results of these questions are shown in Table 5.7. The first column of the table shows that the majority of project participants estimated that their income from agricultural activities had increased since 2010, a significantly larger proportion than among the comparison respondents. Contrary to the results about revenue generated from crop sales (Table 5.6), this difference was larger Muhanga: in fact, it is not clear that there is a statistically significant difference between the participants and comparison respondents in Nyagatare – interestingly, nearly half of project participants in Nyagatare instead reported that their non-agricultural income had increased (a significantly higher proportion than among the comparison respondents), whereas those in Muhanga were more likely than the comparison group to say that their income from non-agricultural activities had decreased. It appears from Table 5.7, then, that the project participants in Muhanga had been concentrating their efforts on agriculture at the expense of non-agricultural livelihoods activities, whereas those in Nyagatare appear to have been investing in (and apparently experienced an increase in income from) non-agricultural activities. It should be noted that „non-agricultural‟ in this case may have been understood by the survey respondents to include milk production, which is known to be a particularly important source of income in Nyagatare District. Again, it is possible that the capacity building in marketing and negotiation in milk production has enabled project participants to realise greater gains in sales of milk and other products, rather than simply pineapple planting-material. It is important to note that the measures analysed in Table 5.7 rely on respondents‟ subjective impressions of the changes in income that they have experienced. These results should therefore be treated with caution: they are likely to be affected by respondents‟ level of optimism or attitudes towards the project, as well as by their actual change in income. It is important, therefore, to investigate alternative indicators of wellbeing. It was not possible to include a full income or consumption module in the survey for this Effectiveness Review, but some indication of each household‟s economic situation was gained from the use of some simple wealth indicators. Specifically, respondents were asked to provide information about their household‟s ownership of various assets (including livestock, productive equipment and household goods), as well as about the conditions of the family‟s house, both in 2010 and at the time of the survey. If each of those assets and housing characteristics are indicators of household wealth, they should be correlated with each other. That is, a household that scores favourably on one particular wealth indicator should be more likely to do so for other wealth indicators. A small number of items that had low correlations with the others were therefore not considered to be good wealth indicators and so were excluded from the index.6

Women‟s Empowerment in Rwanda: Evaluation of women‟s economic leadership through horticulture planting-material business. Effectiveness Review Series 2013-14 27
Table 5.7: Subjective measures of changes in household income since 2010
1 2 3 4
Respondent
reports that
income from
agricultural
activities has
increased
(%)
Respondent
reports that
income from
agricultural
activities has
decreased
(%)
Respondent
reports that
income from
non-agricultural
activities has
increased
(%)
Respondent
reports that
income from
non-agricultural
activities has
decreased
(%)
Overall
Intervention group mean:
60.7 20.2 38.2 11.0
Comparison group mean:
48.6 22.0 29.5 16.3
Difference: 12.1** (5.3)
-1.8 (4.4)
8.7* (4.7)
-5.3 (4.0)
Observations (intervention group):
173 173 173 173
Observations (total): 548 548 548 548
Muhanga
Intervention group mean:
68.8 10.0 26.3 3.75
Comparison group mean:
53.5 17.1 25.3 17.0
Difference: 15.3** (7.0)
-7.1 (4.9)
1.0 (6.6)
-13.3*** (4.5)
Observations (intervention group):
80 80 80 80
Observations (total): 256 256 256 256
Nyagatare
Intervention group mean:
53.8 29.0 48.4 17.2
Comparison group mean:
44.5 26.2 33.1 15.7
Difference: 9.3
(7.7) 2.8
(6.7) 15.3** (6.5)
1.5 (6.5)
Observations (intervention group):
93 93 93 93
Observations (total): 292 292 292 292
Standard errors in parentheses; * p < 0.1, ** p < 0.05, *** p < 0.01; PSM estimates are bootstrapped with 1,000 repetitions.
A data reduction technique called principal component analysis (PCA) was used to produce two indices of overall wealth, one based on the recalled data from 2010, and one based on the household‟s situation at the time of the survey. PCA produces a measure that maximises the variation in asset types by assigning more weight to those assets that are most highly correlated with the inter-item variation. Hence, each household‟s weighted index score was determined by both the number of assets it owned, and by the weight assigned to each asset type. The resulting index enables the relative wealth status of the households to be compared. The wealth index for 2010 is the measure that has been used throughout this analysis to control (to the greatest extent possible) for baseline differences in wealth status among the households of the various treatment groups. After calculating the wealth index for both 2010 and the date of the survey, households were categorised according to the quintile in which they lie – that is, the top 20 per cent of households according to wealth indicators were categorised together, as were those

28 Women‟s Empowerment in Rwanda: Evaluation of women‟s economic leadership through horticulture planting-material business. Effectiveness Review Series 2013-14
in the next 20 per cent, and so on. The measure reported in Table 5.8 is based on households moving between quintiles. For example, a household that changed from being among the bottom 20 per cent of the sample in 2010 to being in the 20–40 per cent quintile at the time of the survey would be given a score of +1. A household that moved from the middle quintile to the bottom quintile would have a score of –2. It can be seen from the table that there is little evidence of any difference in the wealth indicators between the households of project participants and the comparison households in their change in wealth indicators since 2010. The estimated differences are positive in Nyagatare District and negative in Muhanga District, but are not clearly statistically significant in either case.
Table 5.8: Indices of wealth indicators
Number of quintiles of wealth index in which
household increased
Overall
Intervention group mean: 0.01
Comparison group mean: -0.03
Difference: 0.04
(0.07)
Observations (intervention group): 173
Observations (total): 548
Muhanga
Intervention group mean: -0.09
Comparison group mean: 0.00
Difference: -0.09 (0.13)
Observations (intervention group): 80
Observations (total): 256
Nyagatare
Intervention group mean: 0.10
Comparison group mean: -0.05
Difference: 0.15
(0.09)
Observations (intervention group): 93
Observations (total): 292
Standard errors in parentheses; * p < 0.1, ** p < 0.05, *** p < 0.01; PSM estimates are bootstrapped with 1,000 repetitions.
To summarise the evidence for the project‟s effect on household livelihoods, it seems clear that the project resulted in a large increase in sales of crops that were produced on communal plots, without affecting sales of the household‟s private crop production. Participants were more likely to report that they had seen an increase in income from agriculture over the lifetime of the project. Participants in Nyagatare District said that their income from non-agricultural sources had also increased, while those in Muhanga said it had decreased. In any case, any such increases in income were not reflected in increased asset ownership or housing conditions at the time of the survey. There are at least two possibilities that are consistent with these results. It is possible that project participants have generated greater revenue from agricultural products, but also experienced higher costs, so that the overall effect on wellbeing is small. Alternatively, it may be that net income has increased, but that the surplus has either been used for immediate needs (such as food) or re-invested into livelihoods activities, rather than translating into longer-term indicators of wellbeing, such as asset ownership. This would not be surprising given the short time-frame over which the impact of the project

Women‟s Empowerment in Rwanda: Evaluation of women‟s economic leadership through horticulture planting-material business. Effectiveness Review Series 2013-14 29
activities was being evaluated: it will be recalled from Section 5.2 that much of the training carried out under the project started only one to two years before the survey was carried out. A more detailed survey of household consumption or expenditure would be needed to assess the project‟s effect on household wellbeing with more clarity.
5.5 WOMEN‟S EMPOWERMENT The project under review was specifically aimed at increasing women‟s empowerment. In order to assess a multi-dimensional concept, such as women‟s empowerment, Oxfam GB has adopted and adapted an approach that assesses several dimensions of women‟s empowerment. This approach builds on the „Women‟s Empowerment in Agriculture Index‟7 (WEAI) developed by the Oxford Poverty and Human Development Initiative with support from the United States Agency for International Development (USAID) and the International Food Policy Research Institute (IFPRI). Using the WEAI approach, the index used in this effectiveness review assesses 5 dimensions of women’s empowerment. Several indicators have been specified for each of these five dimensions. There is no one generic set of „women‟s empowerment‟ characteristics that are applicable to all contexts. Given this, efforts were made to specify characteristics relevant to the specific area where the survey was carried out. The characteristics identified are listed in Table 5.9. It is important to note at this stage that while not all characteristics considered in this Effectiveness Review may be directly linked to the project activities, all are deemed to be important to a women‟s empowerment in this particular context. The questionnaire used in the effectiveness review included questions relating to each of the characteristics listed in Table 5.9. For each characteristic, a benchmark was defined, based on what it means for a woman to be faring reasonably well in relation to the characteristic in question. The particular benchmarks used for each characteristic are described in the sections that follow, and are presented in summary form in Appendix 1. There is inevitably a degree of arbitrariness in defining such cut-offs. However, the results presented in subsequent sections also include some complementary measures, which act as a check on the robustness of the results obtained from applying the cut-offs. In the pages that follow, we will consider how project participants differ from comparison women in each of the women‟s empowerment characteristics listed in Table 5.9. First, however, we examine how all of the characteristics combine to provide an overall measure of women‟s empowerment.

30 Women‟s Empowerment in Rwanda: Evaluation of women‟s economic leadership through horticulture planting-material business. Effectiveness Review Series 2013-14
Table 5.9: Specific characteristics of women’s empowerment examined in this Effectiveness Review
Dimension Characteristic
Ability to make and influence decisions
Involvement in productive decisions of the household
Involvement in expenditure decisions of the household
Involvement in household-management decisions
Influence in community decision-making
Influence in group decision-making
Self-perception
Self-efficacy
Attitude to women‟s roles
Attitude to women‟s rights
Confidence in business skills
Personal freedom Freedom of movement
Attitude to gender-based violence
Access to and control over resources
Independent income
Ownership of strategic assets
Access to credit
Use of credit
Savings
Ownership of a bank account
Support from social networks Social connectivity in the community
Group membership
The first measure of overall women‟s empowerment, which was used to derive the results detailed below, is the proportion of characteristics in which the woman scored positively, which we define as the base empowerment index. This is the measure for which the results are shown in column 1 of Table 5.10. Further, a woman was defined as having positive empowerment overall if she met the cut-off for positive women empowerment in at least two thirds of these characteristics. A second women‟s empowerment index was then created, which takes a value of 1 if the woman reaches that benchmark for overall women‟s empowerment and otherwise is equal to the proportion of characteristics in which the woman scored positively. This modified index is known as the Alkire-Foster empowerment index.8 The results from applying this measure are shown in column 2 of Table 5.10.

Women‟s Empowerment in Rwanda: Evaluation of women‟s economic leadership through horticulture planting-material business. Effectiveness Review Series 2013-14 31
Table 5.10: Overall indices of women’s empowerment
1 2 3
Base
empowerment
index
AF
empowerment
index
Respondents
meeting global
indicator for
women‟s
empowerment
(%)
Overall
Intervention group mean: 0.55 0.79 71.7
Comparison group mean: 0.49 0.71 51.2
Difference: 0.06*** (0.02)
0.09*** (0.02)
22.2*** (5.1)
Observations (intervention group): 173 173 173
Observations (total): 548 548 548
Muhanga
Intervention group mean: 0.53 0.77 70.0
Comparison group mean: 0.48 0.70 54.2
Difference: 0.05** (0.03)
0.07** (0.03)
15.8** (7.7)
Observations (intervention group): 80 80 80
Observations (total): 256 256 256
Nyagatare
Intervention group mean: 0.55 0.79 83.9
Comparison group mean: 0.47 0.68 56.2
Difference: 0.08*** (0.03)
0.11*** (0.03)
27.7*** (6.7)
Observations (intervention group): 93 93 93
Observations (total): 292 292 292
Standard errors in parentheses; * p < 0.1, ** p < 0.05, *** p < 0.01; PSM estimates are bootstrapped with 1,000 repetitions.
Finally, the Oxfam GB global indicator for women‟s empowerment is based on whether women are doing better in terms of overall women‟s empowerment than a „typical‟ woman in the area. This is defined by comparing each woman‟s empowerment index with the median of the comparison group. In particular, the global indicator takes the value of 1 if the base empowerment index is greater than the median of the comparison group and zero otherwise. Column 3 of Table 5.14 shows the comparison between project participants and comparison respondents in terms of this measure. As can be seen from the first column of the table, on average the project participants scored positively in 55 per cent of the characteristics, compared to 49 per cent among comparison respondents. The difference in terms of the Alkire-Foster index is slightly larger. On both indices, the differences are larger in Nyagatare District than in Muhanga. It is clear from column 3 of the table that substantially more of the project participants met the global indicator for women‟s empowerment than did the comparison respondents. Again, the difference is larger in Nyagatare District than in Muhanga. These results imply that the project has resulted in some positive effect on empowerment among the participants. This raises the question of which specific dimensions and characteristics of empowerment have seen this increase. The split between project participants and comparison respondents in each of the characteristics
32 Women‟s Empowerment in Rwanda: Evaluation of women‟s economic leadership through horticulture planting-material business. Effectiveness Review Series 2013-14
of empowerment considered in this review is shown in Figure 5.1. The following sub-sections describe these results in more detail.
Dimension 1: Ability to make and influence decisions
The first dimension of women‟s empowerment considered in the effectiveness review focused on women‟s influence in decision-making processes in their household and in their community. We will look at the results for each of these two levels separately. The results regarding women‟s decision-making power in the household are based on questions in the survey that addressed household decision-making in three different areas, specifically:
1. Decisions on productive activities: Decisions relating to the conduct of a household‟s farming activities (e.g. type of crops a household grows), to household businesses (e.g. how the business is managed, how many days to work, etc.) and to the sales or purchases of agricultural and non-agricultural produce/assets.
2. Decisions on household’s expenditures: Decisions on how the money earned from various agricultural and non-agricultural activities is spent.
3. Decisions on household management: Decisions on participation in or contributions to community events, decisions about the education of children and how to respond when a household member becomes ill, and so on.
For each of these decision-making areas, the respondent was first asked who normally takes the decisions about that area (if it was applicable to the household) and then, if the woman reported not to be the one responsible or not to be the only one responsible, to what extent she thinks she could influence the decision, on a scale from „not at all‟ to „a large extent‟. A woman scored positively on the measure of involvement in productive decisions if she reported being involved to at least a medium extent in at least half of the productive decision-making areas in which the household was active. The same applies to the indicators for involvement in expenditure decisions and household-management decisions. The results for these three measures of involvement in household decision-making are shown in Table 5.11. There is some indication that women‟s involvement in all three decision-making areas may be higher among the project participants than comparison respondents – but in Nyagatare District only.9
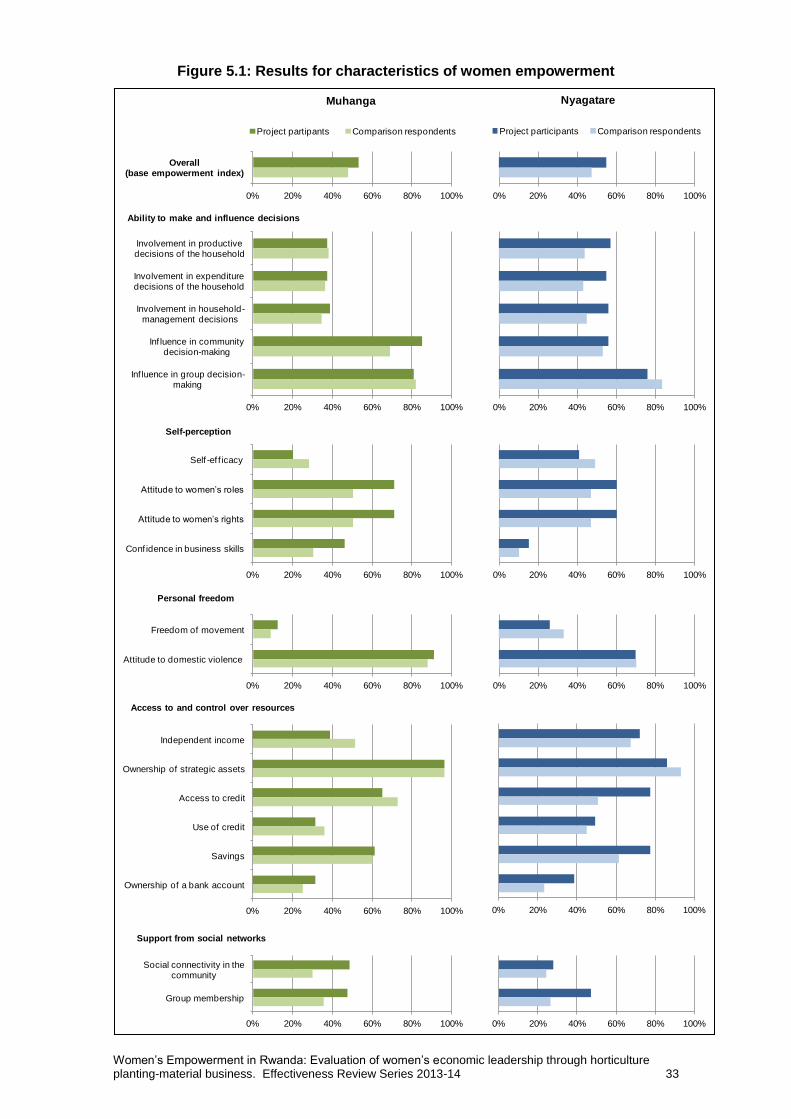
Women‟s Empowerment in Rwanda: Evaluation of women‟s economic leadership through horticulture planting-material business. Effectiveness Review Series 2013-14 33
Figure 5.1: Results for characteristics of women empowerment
0% 20% 40% 60% 80% 100%
Overall(base empowerment index)
Project partipants Comparison respondents
0% 20% 40% 60% 80% 100%
Involvement in productive decisions of the household
Involvement in expenditure decisions of the household
Involvement in household-management decisions
Inf luence in community decision-making
Inf luence in group decision-making
Ability to make and influence decisions
0% 20% 40% 60% 80% 100%
Self -ef f icacy
Attitude to women‟s roles
Attitude to women‟s rights
Conf idence in business skills
Self-perception
0% 20% 40% 60% 80% 100%
Freedom of movement
Attitude to domestic violence
Personal freedom
0% 20% 40% 60% 80% 100%
Independent income
Ownership of strategic assets
Access to credit
Use of credit
Savings
Ownership of a bank account
Access to and control over resources
0% 20% 40% 60% 80% 100%
Social connectivity in the community
Group membership
Support from social networks
0% 20% 40% 60% 80% 100%
0% 20% 40% 60% 80% 100%
Project participants Comparison respondents
0% 20% 40% 60% 80% 100%
0% 20% 40% 60% 80% 100%
0% 20% 40% 60% 80% 100%
0% 20% 40% 60% 80% 100%
Muhanga Nyagatare

34 Women‟s Empowerment in Rwanda: Evaluation of women‟s economic leadership through horticulture planting-material business. Effectiveness Review Series 2013-14
Table 5.11: Respondent scoring positively on characteristics of women’s involvement in household decision-making
1 2 3
Involvement in
productive
decisions in the
household
%
Involvement in
expenditure
decisions in the
household
%
Involvement in
household-
management
decisions
%
Overall
Intervention group mean: 48.0 46.8 48.0
Comparison group mean: 41.2 40.0 40.2
Difference: 6.8
(5.4) 6.8
(5.6) 7.8
(5.2)
Observations (intervention group): 173 173 173
Observations (total): 548 545 548
Muhanga
Intervention group mean: 37.5 37.5 38.8
Comparison group mean: 38.1 36.5 34.7
Difference: -0.6 (7.5)
1.0 (7.5)
4.1 (7.2)
Observations (intervention group): 80 80 80
Observations (total): 256 254 256
Nyagatare
Intervention group mean: 57.0 54.8 55.9
Comparison group mean: 43.9 43.0 44.9
Difference: 13.1* (7.5)
11.8 (7.2)
11.0 (7.9)
Observations (intervention group): 93 93 93
Observations (total): 292 291 292
Standard errors in parentheses; * p < 0.1, ** p < 0.05, *** p < 0.01; PSM estimates are bootstrapped with 1,000 repetitions.
This dimension also includes indicators of women‟s influence in their communities, for which indicators are shown in Table 5.12. Respondents were asked to state the extent to which they agreed or disagreed with these four statements:10
Public forums held in your village are quite intimidating – it is difficult for a woman like you to stand up and voice any concerns.
You would never hesitate to stand up in a public forum to dispute decisions that would negatively affect your lives and those of your children.
It would be extremely difficult for you to obtain an important leadership position in your community even if you really wanted one.
You don‟t mind speaking in front of many people, even if a community leader is around.
It will be noted that two of the statements are presented in a positive sense, and two of them in a negative sense. Respondents were scored positively if they responded in a positive sense to at least two of the four statements.11 As shown in column 1 of Table 5.12, there was a positive difference between project participants and comparison respondents in Muhanga District. It is not clear whether any such difference exists in Nyagatare District.12

Women‟s Empowerment in Rwanda: Evaluation of women‟s economic leadership through horticulture planting-material business. Effectiveness Review Series 2013-14 35
Table 5.12: Respondent scoring positively on characteristics of women’s influence in the community
1 2 3
Influence in community
decision-making
%
Influence in community
group decision-making
a
%
Respondent received visitors from outside the cell to observe
agricultural practices during
the past four years
%
Overall
Intervention group mean: 69.4 78.1 34.7
Comparison group mean: 60.5 83.0 12.2
Difference: 8.9* (5.1)
-4.9 (5.1)
22.5*** (4.6)
Observations (intervention group): 173 151 173
Observations (total): 548 381 548
Muhanga
Intervention group mean: 85.0 80.9 31.3
Comparison group mean: 69.0 82.1 21.4
Difference: 16.0*** (6.2)
-2.2 (6.8)
9.9 (6.6)
Observations (intervention group): 80 68 80
Observations (total): 256 166 256
Nyagatare
Intervention group mean: 55.9 75.9 37.6
Comparison group mean: 53.2 83.6 4.3
Difference: 2.7
(7.8) -7.1 (7.1)
33.3*** (5.8)
Observations (intervention group): 93 83 93
Observations (total): 292 215 292 a Among women who were regularly attending meetings of at least one type of community group at the time of the survey.
Standard errors in parentheses; * p < 0.1, ** p < 0.05, *** p < 0.01; PSM estimates are bootstrapped with 1,000 repetitions. The second indicator of influence in the community was the involvement of respondents in the decision-making processes in community groups, such as agricultural producer groups, political groups, credit/savings groups, civic groups and religious groups. Each respondent was scored positively on this measure if she reported being involved to at least a medium extent in the decision-making process of at least half of the groups of which she was regularly attending meetings. As can be seen in column 2 of Table 5.12, there is no indication of a difference between project participants and comparison respondents in this measure. Although attention from outsiders for women‟s agricultural practices is not one of the women‟s empowerment core dimensions, it is worth mentioning it in this context. Because of the success of the project it has received growing attention from local government officials. There is also a potential spillover effect from the project activities. When asked whether the respondent in the last four years had received any visitors from outside her cell with the purpose of observing your agricultural practices and to learn from it, 35 per cent of the women from the intervention group responded positively compared to only 12 per cent in the comparison group. The difference is clearest in Nyagatare District; the difference in Muhanga is positive, though not statistically significant.

36 Women‟s Empowerment in Rwanda: Evaluation of women‟s economic leadership through horticulture planting-material business. Effectiveness Review Series 2013-14
Dimension 2: Self-perception
The second dimension of women‟s empowerment considered in this report includes four different elements of women‟s self-perception. The first of these is self-efficacy – a measure of a person‟s self-confidence and ability to overcome difficulties. The questionnaire included an adapted version of the General Self-Efficacy Scale (GSE), in which the respondent was asked to state whether the following statements were „true‟, „sometimes true‟ or „false‟:13
You can always manage to solve difficult problems if you try hard enough.
It is easy for you to stick to your aims and accomplish your goals.
You are confident that you could deal efficiently with unexpected events.
If you are in trouble, you can usually think of a solution.
You can usually handle whatever comes your way. Respondents scored positively on this measure if they agreed with at least three out of these five statements. The results of the comparison between the intervention and comparison women are shown in column 1 of Table 5.13. There is no indication on this measure of any significant difference between the scores of project participants and comparison respondents.
Table 5.13: Respondent scoring positively on characteristics of women’s self-perception
1 2 3 4
Self-efficacy
%
Attitude to
women‟s roles
%
Attitude to women‟s rights
%
Confidence in business skills
%
Overall
Intervention group mean: 31.2 65.3 83.2 29.5
Comparison group mean: 39.4 48.5 70.1 19.5
Difference: -8.2 (5.3)
16.8*** (5.4)
13.1*** (4.6)
10.0** (4.1)
Observations (intervention group):
173 173 173 173
Observations (total): 548 548 548 548
Muhanga
Intervention group mean: 20.0 71.3 83.8 46.3
Comparison group mean: 28.2 50.5 70.0 30.4
Difference: -8.2 (6.6)
20.8*** (7.5)
13.8** (6.2)
15.8** (7.3)
Observations (intervention group):
80 80 80 80
Observations (total): 256 256 256 256
Nyagatare
Intervention group mean: 40.9 60.2 82.8 15.1
Comparison group mean: 49.1 46.9 70.2 10.2
Difference: -8.2 (7.9)
13.3* (7.8)
12.6** (6.1)
4.9 (4.5)
Observations (intervention group):
93 93 93 93
Observations (total): 292 292 292 292
Standard errors in parentheses; * p < 0.1, ** p < 0.05, *** p < 0.01; PSM estimates are bootstrapped with 1,000 repetitions.
Women‟s Empowerment in Rwanda: Evaluation of women‟s economic leadership through horticulture planting-material business. Effectiveness Review Series 2013-14 37
The next two indicators considered under this dimension examined women‟s attitudes towards women‟s roles and rights, both in the home and outside the home. Both these indicators are generated from respondents‟ reactions to a set of statements that were presented to them during the questionnaire; again, women were asked to state the extent of their agreement or disagreement with each of the statements, on a four-point scale. The first indicator looks at the extent women agree or disagree with the following statements relating to women’s role in productive activities:14
A man‟s job is to earn money; a woman‟s job is to look after the home and family.
If you wanted to participate in a group meeting or group activities, your husband or relatives would help by taking care of the children or housework.
A man and women should share responsibility for both earning money and caring for the home and family.
Men are more important than women in ensuring that the food and income needs of the family are met.
Women are just as capable as men of contributing to household income.
If a child falls ill, it is the mother‟s duty rather than the father‟s to take time away from productive activities to look after the child.
Again, it will be noted that some of these statements are presented in a positive sense and some in a negative sense as regards women‟s empowerment. Respondents were scored positively for this indicator if they responded positively to at least three of the six statements.15 As can be seen in column 2 of the table, this applied to a significantly larger proportion of the project participants than of the comparison respondents, particularly in Muhanga District. Five further statements were used to assess respondents‟ opinions regarding women’s rights:16
A man should have the final word about decisions in his home.
A wife should obey her husband, even if she disagrees with him.
A wife should never question the decisions made by her husband.
A good marriage is more important for a girl than a good education.
Once a husband has paid his dowry, his wife should oblige and take care of all the household chores.
Respondents scored positively on this outcome if they responded positively to at least three of these five statements. It can be seen in column 3 of the table that the majority of respondents met this threshold, but that the proportion was significantly higher among the project participants in both districts. Finally, three statements were used to assess respondents‟ confidence in her business skills:17
You feel confident that you can start up a new economic activity.
You understand very well where to get information you need to start up a new economic activity.
You feel passionate and motivated to start a new economic activity as soon as possible.
Women were scored positively if they strongly agreed with at least two of these three statements. Only a minority of respondents overall met this threshold, but again this applied to significantly more of the project participants than the comparison respondents.
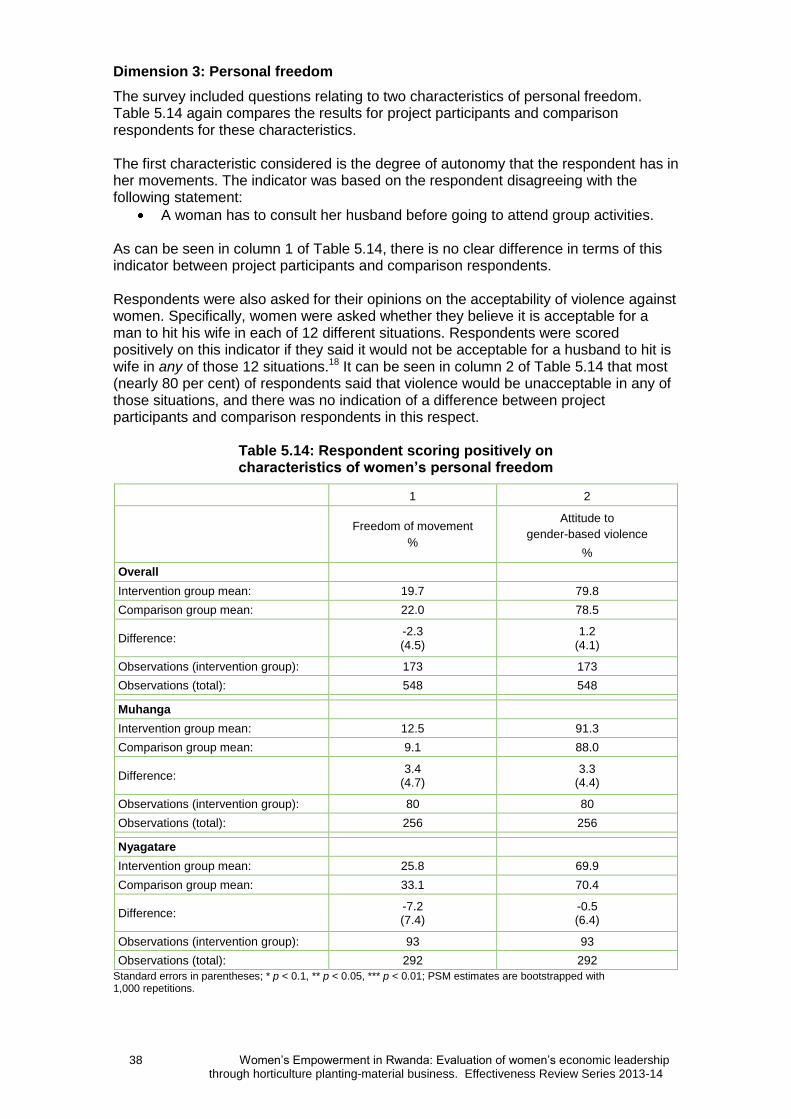
38 Women‟s Empowerment in Rwanda: Evaluation of women‟s economic leadership through horticulture planting-material business. Effectiveness Review Series 2013-14
Dimension 3: Personal freedom
The survey included questions relating to two characteristics of personal freedom. Table 5.14 again compares the results for project participants and comparison respondents for these characteristics. The first characteristic considered is the degree of autonomy that the respondent has in her movements. The indicator was based on the respondent disagreeing with the following statement:
A woman has to consult her husband before going to attend group activities. As can be seen in column 1 of Table 5.14, there is no clear difference in terms of this indicator between project participants and comparison respondents. Respondents were also asked for their opinions on the acceptability of violence against women. Specifically, women were asked whether they believe it is acceptable for a man to hit his wife in each of 12 different situations. Respondents were scored positively on this indicator if they said it would not be acceptable for a husband to hit is wife in any of those 12 situations.18 It can be seen in column 2 of Table 5.14 that most (nearly 80 per cent) of respondents said that violence would be unacceptable in any of those situations, and there was no indication of a difference between project participants and comparison respondents in this respect.
Table 5.14: Respondent scoring positively on characteristics of women’s personal freedom
1 2
Freedom of movement
%
Attitude to
gender-based violence
%
Overall
Intervention group mean: 19.7 79.8
Comparison group mean: 22.0 78.5
Difference: -2.3 (4.5)
1.2 (4.1)
Observations (intervention group): 173 173
Observations (total): 548 548
Muhanga
Intervention group mean: 12.5 91.3
Comparison group mean: 9.1 88.0
Difference: 3.4
(4.7) 3.3
(4.4)
Observations (intervention group): 80 80
Observations (total): 256 256
Nyagatare
Intervention group mean: 25.8 69.9
Comparison group mean: 33.1 70.4
Difference: -7.2 (7.4)
-0.5 (6.4)
Observations (intervention group): 93 93
Observations (total): 292 292
Standard errors in parentheses; * p < 0.1, ** p < 0.05, *** p < 0.01; PSM estimates are bootstrapped with 1,000 repetitions.

Women‟s Empowerment in Rwanda: Evaluation of women‟s economic leadership through horticulture planting-material business. Effectiveness Review Series 2013-14 39
Dimension 4: Access to and control over resources
Six different characteristics of women‟s access to and control over resources were examined in the survey. The results of the analysis of these outcomes is shown in Table 5.15. The first indicator considered was whether a woman has access to some independent income, independently from her spouse. To assess this, respondents were asked to estimate the proportion of income that she personally contributes to household income and resources, and was considered to score positively on this basis if she reported that she personally contributes at least half. As shown in the first column of Table 5.15, the majority of respondents reached that level. Despite the apparently substantial difference between of project participants and comparison respondents scoring positively in Muhanga District, it does not appear that this is a statistically significant result.19
Table 5.15: Respondent scoring positively on characteristics of women’s access to and control over resources
1 2 3 4 5 6
Independent
income
%
Ownership
of strategic
assets
%
Access to
credit
%
Use of
credit
%
Savings
%
Ownership
of a bank
account
%
Overall
Intervention group mean: 56.6 90.8 71.7 41.0 69.9 35.3
Comparison group mean: 60.0 94.6 60.8 40.8 60.8 24.3
Difference: -3.4 (5.1)
-3.8 (2.6)
10.8** (5.1)
0.2 (5.2)
9.1* (5.1)
11.0** (4.9)
Observations (intervention group):
173 173 173 173 173 173
Observations (total): 548 548 548 548 548 548
Muhanga
Intervention group mean: 38.8 96.3 65.0 31.3 61.3 31.3
Comparison group mean: 51.5 96.2 72.7 36.1 60.1 25.2
Difference: -12.8 (8.0)
0.0 (2.7)
-7.7 (7.2)
-4.9 (7.2)
1.1 (7.5)
6.0 (7.2)
Observations (intervention group):
80 80 80 80 80 80
Observations (total): 256 256 256 256 256 256
Nyagatare
Intervention group mean: 72.0 86.0 77.4 49.5 77.4 38.7
Comparison group mean: 67.4 93.1 50.7 44.9 61.4 23.4
Difference: 4.7
(6.5) -7.1* (4.2)
26.8*** (7.0)
4.6 (7.5)
16.0** (6.8)
15.3** (7.2)
Observations (intervention group):
93 93 93 93 93 93
Observations (total): 292 292 292 292 292 292
Standard errors in parentheses; * p < 0.1, ** p < 0.05, *** p < 0.01; PSM estimates are bootstrapped with 1,000 repetitions.
The second characteristic examined under this dimension was women‟s ownership of strategic assets, such as land, livestock, agricultural equipment and household goods. As already noted in Section 5.4, respondents were asked about their household‟s ownership of various types of assets. As a follow-up to these questions, they were then asked to specify which household member has decision-making control over these

40 Women‟s Empowerment in Rwanda: Evaluation of women‟s economic leadership through horticulture planting-material business. Effectiveness Review Series 2013-14
assets: that is, who could make decisions about whether to sell an item if necessary. Respondents were deemed to have scored positively if they reported having at least joint decision-making control over at least half the types of strategic assets that the household owns.20 Most of the women interviewed met this criterion, with no indication of any difference between the project participants and comparison respondents. The remaining four indicators considered under this dimension of women‟s empowerment all relate to women‟s access to credit and savings. As an indicator of access to credit, respondents were asked whether they would personally be able to borrow 50,000 Rwandan francs (approximately US$70) from any credit source if they needed it to invest in an income-generating activity. Respondents were scored positively if they reported that they would be able to borrow this some from at least one more formal source of credit – including a commercial moneylender, a local savings or loans group, a church, or a bank or microfinance institution (MFI) – other than through borrowing from neighbours or relatives. Overall, approximately two thirds of respondents said that they would be able to borrow from one of these sources if necessary. As can be seen in column 3 of Table 5.15, there was no difference in this respect between project participants and comparison respondents in Muhanga District. However, there was a clear difference in Nyagatare, where only half of comparison respondents said that they could access credit from one of the more formal sources. Notably, 37 per cent of the project participants in Nyagatare said that they would be able to borrow 50,000 francs from a bank or microfinance institution if necessary, compared to only 22 per cent of the comparison respondents. (In Muhanga District that proportion was 35 per cent, and did not differ significantly between the project participants and comparison respondents.) Next, the respondents were asked about their actual borrowing over the 12 months prior to the survey. The use of credit was considered as an indicator of empowerment because lack of finance is seen as a key barrier preventing women from expanding their livelihoods activities. To that end, respondents were scored positively on this indicator if they said that they had borrowed from one of the more formal sources of credit (a commercial moneylender, a local savings or loans group, a bank, an MFI, or a savings and credit cooperative) at all during the 12-month period. This applied to 34 per cent of respondents in Muhanga District and 47 per cent in Nyagatare, with no apparent differences between the project participants and comparison respondents. It is worth noting that eight per cent of the project participants said that they had borrowed from a bank or MFI, against only five per cent of the comparison respondents, though this difference is not clearly statistically significant.21 Respondents who had not borrowed specifically from an MFI were asked for their reasons not for doing so. Apart from having no need for credit, the most common reason cited for not borrowing from an MFI was lack of access to collateral: this was mentioned by approximately 30 per cent of those who had not borrowed, including project participants and comparison respondents. (This response was more common in Muhanga District, with 44 per cent of respondents, than in Nyagatare, with 18 per cent of respondents.) The second most commonly cited reason not for borrowing from an MFI was lack of knowledge, although there are indications that this was less of a problem among project participants than comparison respondents. The survey also asked respondents they had personally saved any money during the previous month, and through what channels. Respondents were deemed to score positively on this indicator if they reported that they had made any savings through a formal or semi-formal channel, including a community group, a bank, an MFI, or a savings and credit cooperative. Column 5 of Table 5.15 shows that this proportion was higher among the project participants than among the comparison respondents, though this effect seems to be confined to Nyagatare District.
Women‟s Empowerment in Rwanda: Evaluation of women‟s economic leadership through horticulture planting-material business. Effectiveness Review Series 2013-14 41
Finally, respondents were asked whether they personally have a bank account: this proportion was clearly higher among the project participants than among comparison respondents, as shown in column 6 of Table 5.15. It is perhaps interesting to note that the proportions who said that their household owns a bank account did not differ between the project participants and comparison respondents.
Dimension 5: Social connectivity
The final two characteristics included in the Effectiveness Review attempted to evaluate the strength of respondents‟ social networks. The results of the comparison for women in project and comparison communities in terms of these characteristics are shown in Table 5.16. The first characteristic attempted to evaluate each woman‟s degree of social connectivity by presenting four statements, and asking respondents the extent to which they agreed or disagreed with them:22
Other people in the community sometimes ask you to take care of their children.
You would be able to ask others in the community for advice or support if you needed it.
Other people in the community often ask you for advice or support when they need it.
You are usually invited if there is a celebration in the community. A respondent was scored positively on this indicator if she strongly agreed with at least two of these four statements. As can be seen in the first column of Table 5.16, that applied to more of the project participants than the comparison respondents, at least in Muhanga District.23 Respondents were also asked which community groups they participate in, such as agricultural groups, credit or microfinance groups, parent/teacher associations, charitable groups, religious groups, or political groups. Respondents were considered to have scored positively if they reported participating in at least three different types of community group. The results, in the second column of Table 5.16, show that this applied to a larger proportion of the project participants than the comparison respondents. On average, project participants said that they were attending meetings of 2.8 different types of community group, compared to an average of 1.7 among the comparison respondents.24 This is to be expected, given that the project worked with members of producers‟ groups and (in some cases) facilitated the formation of new groups.

42 Women‟s Empowerment in Rwanda: Evaluation of women‟s economic leadership through horticulture planting-material business. Effectiveness Review Series 2013-14
Table 5.16: Respondent scoring positively on characteristics of women’s social connectivity
1 2
Social connectivity in the community
%
Group membership
%
Overall
Intervention group mean: 37.6 47.4
Comparison group mean: 26.9 30.7
Difference: 10.7** (5.0)
16.7*** (5.3)
Observations (intervention group): 173 173
Observations (total): 548 548
Muhanga
Intervention group mean: 48.8 47.5
Comparison group mean: 30.0 35.5
Difference: 18.8*** (7.2)
12.0 (7.6)
Observations (intervention group): 80 80
Observations (total): 256 256
Nyagatare
Intervention group mean: 28.0 47.3
Comparison group mean: 24.3 26.5
Difference: 3.7
(6.5) 20.8*** (7.1)
Observations (intervention group): 93 93
Observations (total): 292 292
Standard errors in parentheses; * p < 0.1, ** p < 0.05, *** p < 0.01; PSM estimates are bootstrapped with 1000 repetitions.
Summary of results on women’s empowerment
The Effectiveness Review also found evidence for positive differences between the project participants and comparison respondents in terms of various characteristics of women‟s empowerment. Project participants in Nyagatare District appeared to have more involvement in household decision-making than did corresponding comparison participants, while those in Muhanga District were more positive about their ability to influence decisions at community level. Participants in both districts expressed more positive opinions than comparison respondents about women‟s engagement in livelihood activities and about women‟s rights, and voiced more confidence in their ability to engage in business. In Nyagatare the project participants appeared to have better access to credit than comparison respondents – though the proportion of project participants who had actually taken out any loans was similar to the comparison respondents, in both districts. Project participants were also more likely to have a personal bank account, and those in Nyagatare were more likely to have made savings over the past month. Finally, the project participants appeared to have stronger social connections and were participating in a larger number of community groups than were comparison respondents. It should be recalled when interpreting these findings that the project participants were a self-selected group: they had deliberately decided to take part in the project. For that reason, it may be natural to expect that some of their characteristics of empowerment would be different from those of the comparison respondents, who were selected at random. However, in the cases where corroborating evidence is available – such as in group participation, for which respondents were asked to recall their baseline situation – it does appear that the project has had a significant impact.
Women‟s Empowerment in Rwanda: Evaluation of women‟s economic leadership through horticulture planting-material business. Effectiveness Review Series 2013-14 43
6 CONCLUSIONS
6.1 CONCLUSIONS The Effectiveness Review provides clear evidence of the project‟s impact on engagement in the pineapple planting-material business. Eighty-four per cent of the project participants interviewed reported having engaged in the planting-material business in 2014, against only a small minority (six per cent) of the comparison households. In Nyagatare nearly all the participants (94 per cent) were producing pineapple planting-material, whereas in Muhanga the proportion was 74 per cent. On average the project participants reported that they received 33,800 Rwandan francs (approximately US$47) from the sales of pineapple planting-material during the 12 months prior to the survey, a figure that is consistent with the project making a positive contribution to income, but not being the main source of income for the average household. The revenue generated from sales of pineapple planting material was found to be considerably higher in Nyagatare District than in Muhanga. This engagement in producing pineapple-planting materials does not appear to have displaced households‟ other agricultural activities. Instead, project participants seem to have increased their sales of other agricultural products as well: revenue generated from agricultural sales averaged 205,000 francs among the project participants, compared to 140,000 francs among the corresponding comparison households. In particular, the project participants were generating much more revenue from sales of products produced in a group (including the pineapple planting material), but there was apparently no reduction in sales of crops produced privately by the household. Again, the apparent effect of the project was larger in Nyagatare District than in Muhanga. It is important to consider whether the increases in agricultural sales have led to greater net household income. There is some evidence that this is so, based on questions about respondents‟ perceptions of their income change since before the project started in 2010. Interestingly, participants in Nyagatare District also said that their income from non-agricultural sources had increased, whereas those in Muhanga said it had decreased, perhaps as they engaged more in producing pineapple planting-material at the expense of alternative livelihoods activities. Any such increases in income were not clearly reflected in increased asset ownership or housing conditions at the time of the survey – though this is not surprising given the relatively short timeframe over which the project‟s impact was being assessed. A detailed survey of household consumption or expenditure would be needed to assess the project‟s effect on food security or household wellbeing with more confidence. The Effectiveness Review also provides evidence that the project has had a significant positive impact on various characteristics of women‟s empowerment. Some of these are directly related to the project activities, such as the increased access to credit among participants in Nyagatare District, increased participation in producers‟ groups, and an increase in women‟s confidence to engage in business. However, there were also significant differences found in terms of characteristics less directly linked to the project activities, including attitudes towards women‟s rights and women‟s economic roles, social connections, and involvement in decision-making in the household or community. These factors suggest that the project has, to some extent, been successful in bringing about more wide-ranging changes in participants‟ position in their households and communities.

44 Women‟s Empowerment in Rwanda: Evaluation of women‟s economic leadership through horticulture planting-material business. Effectiveness Review Series 2013-14
6.2 PROGRAMME LEARNING
CONSIDERATIONS
Ensure that monitoring and evaluation of projects take account of the effects of
interventions on overall household livelihoods.
The results of this Effectiveness Review demonstrate that project interventions can sometimes have unexpected indirect effects – either positive (for example, the apparent increase in sales of communally produced agricultural products other than pineapple planting-material, and the reported increase in income from non-agricultural sources in Nyagatare District) or negative (such as the corresponding reported decrease in income from non-agricultural sources in Muhanga). Examining indicators of production or sales of pineapple planting-materials alone would have provided only a partial understanding of the overall effects of this project. This reinforces the necessity of monitoring and evaluation work to consider the impact of interventions on the household economy as a whole. Although measuring a household‟s net income from all income sources is a very complicated undertaking, measures of household consumption, asset ownership, or even subjective reports of changes can instead be used to give an indication of overall material wellbeing.
Continue to track changes in food security, consumption or wealth indicators
among the project participants, to understand the longer-term impacts of the
project.
Given that much of the training provided under the project had been carried out only a year or two prior to the survey, it is natural to assume that the changes in outcomes found in this Effectiveness Review provide only an interim assessment of the project‟s impact. It would be interesting at least to continue monitoring changes among the project participants over the next two or three years, to see how the apparent increases in revenue from agricultural sales generated by the project translates into changes in food security or overall household income. It may even be useful in the future to carry out a follow-up survey with the same respondents as this Effectiveness Review, in order to provide a more detailed understanding of the project‟s long-term effect.
Consider how to increase the effectiveness of gender mainstreaming, and how to
track progress.
The Effectiveness Review has found evidence that the women‟s economic leadership approach applied in this project has had some positive effects on various aspects of women‟s empowerment – including those both directly and indirectly related to the project‟s interventions. Consideration should now be given to how to strengthen these results, and to whether further positive effects could be achieved through having a more active approach to promoting women‟s empowerment, beyond simply facilitating women‟s engagement in income generation. It may also be useful to identify some indicators of empowerment that can be tracked over time, to provide some insight into whether and how the project is affected by women‟s positions in their homes and communities.

Women‟s Empowerment in Rwanda: Evaluation of women‟s economic leadership through horticulture planting-material business. Effectiveness Review Series 2013-14 45
APPENDIX 1: THRESHOLDS FOR CHARACTERISTICS OF WOMEN‟S
EMPOWERMENT Dimension Characteristic Threshold: respondent scores positively if...
Ability to make and influence decisions
Involvement in productive decisions of the household
Respondent reports having sole control or a large degree of influence in at least half of the number of productive decisions that were listed in the questionnaire that the household engages in (out of five types of decision in total).
Involvement in expenditure decisions of the household
Respondent reports having sole control or a large degree of influence in at least half of the number of expenditure decisions that were listed in the questionnaire that the household engages in (out of three types of decision in total).
Involvement in household-management decisions
Respondent reports having sole control or a large degree of influence in at least half of the number of household-management decisions that were listed in the questionnaire that the household engages in (out of 10 types of decision in total).
Influence in community decision-making Respondent strongly agrees with at least two out of the four statements relating to her or other women‟s influence in the community.
Influence in group decision-making Respondent reports having influence in the decision-making process of at least half of the number of community groups of which she is a member (out of 11 types of community group in total).
Self-perception
Self-efficacy Respondent agrees with at least three of the five statements relating to her level of self-efficacy.
Attitude to women‟s roles Respondent agrees with at least three of the six statements relating to her productive role in the household.
Attitude to women‟s rights Respondent agrees with at least three of the five statements relating to general women rights.
Confidence in business skills Respondent agrees with at least two of the three statements relating to her confidence in her business skills.
Personal freedom
Freedom of movement Respondent agrees with the statement relating to her freedom of movement in the community.
Attitude to domestic violence Respondent does not agree that a husband has the right to hit his wife under any of the 12 hypothetical scenarios described.
Access to and control over resources
Independent income Respondent reports that she personally contributes more than 50 per cent of the household‟s income.
Ownership of strategic assets Respondent has sole or joint decision-making control (whether to sell, to trade or to give away) at least half of the types of strategic assets owned by the household (from a list of 17 types of strategic assets presented in the questionnaire).
Access to credit Respondent reports that she would be able to borrow 50,000 Rwandan francs from at least one source (including commercial moneylenders, local savings and loans groups, churches, banks and microfinance institutions) if needed to invest in a business opportunity.

46 Women‟s Empowerment in Rwanda: Evaluation of women‟s economic leadership through horticulture planting-material business. Effectiveness Review Series 2013-14
Dimension Characteristic Threshold: respondent scores positively if...
Use of credit Respondent reports that she has personally borrowed from a local savings and loans group, a savings and credit cooperative, a bank, or a microfinance institutions during the 12 months prior to the survey.
Savings Respondent reports that she has personally saved money with one or more of a community group, a bank, an MFI, or a savings and credit cooperative during the month prior to the survey.
Ownership of a bank account Respondent reports that she personally has a bank account.
Support from social networks
Social connectivity in the community Respondent strongly agrees with at least two of the four statements relating to her social connectivity in the village.
Group membership Respondent reports that she regularly attends meetings of at least three different types of community group.

Women‟s Empowerment in Rwanda: Evaluation of women‟s economic leadership through horticulture planting-material business. Effectiveness Review Series 2013-14 47
APPENDIX 2: BASELINE STATISTICS BEFORE MATCHING Overall Muhanga Nyagatare
Intervention
mean Comparison
mean Difference
Intervention mean
Comparison mean
Difference Intervention
mean Comparison
mean Difference
Number of members of household in 2010 5.52 4.87 0.66*** 5.45 4.90 0.55** 5.60 4.83 0.77***
Household head is female % 37.8 29.4 8.44** 42.9 34.6 8.24 33.0 24.2 8.82
Proportion of household members who were less than six years old in 2010
% 14.7 16.5 -1.85 12.1 15.0 -2.87 17.2 18.1 -0.92
Proportion of household members who were greater than 60 years old in 2010
% 5.48 2.80 2.68*** 6.71 2.13 4.58*** 4.28 3.46 0.82
Proportion of adult household members in 2010 who were male % 32.4 32.4 0.039 36.5 34.0 2.51 28.4 30.7 -2.30
Age of household head in 2010 years 47.3 42.0 5.30*** 49.6 42.6 7.03*** 45.1 41.4 3.64**
Household head has some primary education % 70.8 74.7 -3.89 71.4 78.8 -7.42 70.2 70.5 -0.32
Household head completed primary education % 44.9 39.8 5.11 44.0 41.3 2.61 45.7 38.2 7.58
Household head has at least some higher education % 11.9 10.4 1.53 6.59 9.13 -2.54 17.0 11.6 5.43
Age of respondent in 2010 years 43.9 38.6 5.30*** 46.9 39.3 7.60*** 41.0 37.9 3.09**
Respondent has some primary education % 70.8 74.5 -3.65 67.0 81.3 -14.2*** 74.5 67.6 6.84
Respondent completed primary education % 41.1 38.8 2.29 45.1 47.1 -2.06 37.2 30.4 6.80
Respondent has at least some higher education % 10.8 9.64 1.17 12.1 8.65 3.43 9.57 10.6 -1.05
Proportion of adult household members in 2010 with some primary education
% 74.8 72.8 1.98 74.0 76.2 -2.21 75.5 69.4 6.17**
Proportion of adult household members in 2010 who completed primary education
% 33.3 29.1 4.19* 36.1 31.0 5.10 30.6 27.2 3.38
Proportion of adult household members in 2010 with some higher education
% 17.0 13.0 4.04** 15.5 12.3 3.21 18.5 13.7 4.82*
Household head‟s main occupation in 2010 was farming % 81.1 77.3 3.73 87.9 82.7 5.22 74.5 72.0 2.49
Household head‟s main occupation in 2010 was other agricultural activities
% 3.24 2.41 0.83 1.10 0 1.10 5.32 4.83 0.49
Household head‟s main occupation in 2010 was a non-agricultural business
% 2.16 4.34 -2.18 1.10 5.29 -4.19* 3.19 3.38 -0.19
Household head‟s main occupation in 2010 was casual labour % 5.41 6.75 -1.34 1.10 3.37 -2.27 9.57 10.1 -0.57
Household head‟s main occupation in 2010 was a salaried job % 4.86 5.78 -0.92 4.40 7.21 -2.82 5.32 4.35 0.97
Household head‟s main occupation in 2010 was a civil servant % 1.08 0.96 0.12 0 0 0 2.13 1.93 0.20
Respondent‟s main occupation in 2010 was farming % 90.3 88.9 1.35 96.7 94.7 1.99 84.0 83.1 0.95
Respondent‟s main occupation in 2010 was other agricultural activities % 0 1.20 -1.20 0 0.48 -0.48 0 1.93 -1.93
Respondent‟s main occupation in 2010 was a non-agricultural business % 3.24 2.65 0.59 0 1.92 -1.92 6.38 3.38 3.00
Respondent‟s main occupation in 2010 was casual labour % 2.70 5.54 -2.84 0 1.44 -1.44 5.32 9.66 -4.34
Respondent‟s main occupation in 2010 was a salaried job % 3.24 0.72 2.52** 2.20 0.48 1.72 4.26 0.97 3.29*

48 Women‟s Empowerment in Rwanda: Evaluation of women‟s economic leadership through horticulture planting-material business. Effectiveness Review Series 2013-14
Overall Muhanga Nyagatare
Intervention
mean Comparison
mean Difference
Intervention mean
Comparison mean
Difference Intervention
mean Comparison
mean Difference
Some household member(s) engaged in farming in 2010 % 77.8 75.2 2.66 79.1 73.6 5.56 76.6 76.8 -0.22
Some household member(s) engaged in horticulture in 2010 % 64.9 55.2 9.68** 75.8 67.8 8.04 54.3 42.5 11.7*
Some household member(s) engaged in agricultural processing in 2010 % 13.0 10.6 2.37 18.7 16.8 1.85 7.45 4.35 3.10
Some household member(s) engaged in rearing livestock in 2010 % 52.4 48.0 4.48 53.8 49.0 4.81 51.1 46.9 4.20
Some household member(s) engaged in dairy production in 2010 % 13.5 9.88 3.63 11.0 8.17 2.82 16.0 11.6 4.36
Some household member(s) engaged in a non-agricultural business in 2010
% 10.8 8.92 1.90 4.40 7.69 -3.30 17.0 10.1 6.88*
Some household member(s) engaged in casual labour in 2010 % 31.4 39.3 -7.93* 47.3 43.3 3.98 16.0 35.3 -19.3***
Some household member(s) engaged in unskilled salaried work in 2010 % 13.5 8.92 4.60* 12.1 8.65 3.43 14.9 9.18 5.71
Some household member(s) engaged in skilled salaried work in 2010 % 9.19 8.92 0.27 9.89 9.62 0.27 8.51 8.21 0.30
Some household member(s) engaged in renting out land in 2010 % 19.5 17.8 1.63 33.0 31.3 1.72 6.38 4.35 2.04
Average area of land cultivated privately in 2010 hectares 0.66 0.65 0.0057 0.43 0.48 -0.049 0.87 0.82 0.053
Average area of land cultivated in group in 2010 hectares 0.39 0.23 0.16*** 0.37 0.26 0.10 0.41 0.20 0.21**
Household able to irrigate parts of their land if necessary % 10.8 12.8 -1.96 19.8 23.1 -3.30 2.13 2.42 -0.29
Household was in the poorest 20% of the sample according to wealth indicators recalled from 2010
a
% 19.5 20.5 -1.02 23.1 18.8 4.33 16.0 22.2 -6.26
Household was in the second 20% of the sample according to wealth indicators recalled from 2010
a
% 22.7 18.8 3.91 23.1 18.8 4.33 22.3 18.8 3.50
Household was in the middle 20% of the sample according to wealth indicators recalled from 2010
a
% 17.3 21.2 -3.91 17.6 21.2 -3.57 17.0 21.3 -4.23
Household was in the fourth 20% of the sample according to wealth indicators recalled from 2010
a
% 19.5 20.2 -0.78 17.6 21.2 -3.57 21.3 19.3 1.95
Household was in the upper 20% of the sample according to wealth indicators recalled from 2010
a
% 21.1 19.3 1.80 18.7 20.2 -1.51 23.4 18.4 5.05
Distance to the village centre in 2010
minutes on foot 21.7 18.0 3.69** 18.7 13.0 5.74*** 24.5 23.0 1.53
Distance to the nearest market in 2010
minutes on foot 61.7 49.0 12.6*** 57.8 35.7 22.0*** 65.5 62.4 3.05
Distance to the nearest source of drinking water in 2010
minutes on foot 42.7 35.2 7.49** 33.8 24.7 9.14*** 51.3 45.8 5.50
Number of observations 185 415 600 91 208 299 94 207 301 a The construction of the wealth index is described in Section 5.4.
* p < 0.1, ** p < 0.05, *** p < 0.01; 2. Variables dated 2010 are estimates, based on recall data or reconstructed from the composition of the household at the time of the survey.

Women‟s Empowerment in Rwanda: Evaluation of women‟s economic leadership through horticulture planting-material business. Effectiveness Review Series 2013-14 49
APPENDIX 3: METHODOLOGY USED
FOR PROPENSITY-SCORE MATCHING The analysis of outcome variables, presented in Section 5 of this report, involved group mean comparisons using propensity-score matching (PSM). The basic intuition of PSM is to match each participant with a non-participant that was observationally similar at baseline and to obtain the programme treatment effect by averaging the differences in outcomes across the two groups after project completion. For this Effectiveness Review, matching was done by district, i.e. separately for Muhanga and Nyagatare. Unsurprisingly, there are different approaches to matching, i.e. to determining whether or not a woman is observationally „similar‟ to another woman. For an overview, we refer to Caliendo and Kopeinig (2008).25 The following sections describe and test the specific matching procedure followed in this Effectiveness Review.
Estimating propensity scores
Given that it is extremely hard to find two individuals with exactly the same characteristics, Rosenbaum and Rubin (1983)26 demonstrate that it is possible to match individuals using a prior probability for an individual to be in the intervention group, naming it propensity score. More specifically, propensity scores are obtained by pooling the units from both the intervention and comparison groups and using a statistical probability model (e.g. a probit regression) to estimate the probability of participating in the project, conditional on a set of observed characteristics. Tables A3.1 to A3.3 present the probit regression results used to estimate the propensity scores in our context, separately for Muhanga and Nyagatare districts. Table A3.1 shows the probit results for the non-parsimonious model entering the full set of matching variables considered in this study. To guarantee that none of the matching variables was affected by the intervention, we only considered variables related to baseline, and only those variables that were unlikely to have been influenced by anticipation of project participation (Caliendo and Kopeinig, 2008).

50 Women‟s Empowerment in Rwanda: Evaluation of women‟s economic leadership through horticulture planting-material business. Effectiveness Review Series 2013-14
Table A3.1: Estimating the propensity score: non-parsimonious models
Muhanga District Nyagatare District
Coefficient
Standard error
p-value Coefficient Standard
error p-value
Number of members of household in 2010
0.112 (0.061) 0.067 0.085 (0.060) 0.160
Household head is female = 1 0.269 (0.243) 0.267 0.638 (0.274) 0.020
Proportion of household members who were less than six years old in 2010
0.339 (0.814) 0.677 -0.024 (0.772) 0.975
Proportion of household members who were greater than 60 years old in 2010
1.113 (1.039) 0.284 0.883 (0.922) 0.338
Proportion of adult household members in 2010 who were male
-0.378 (0.666) 0.570 0.165 (0.730) 0.821
Age of household head in 2010
years -0.010 (0.018) 0.583 0.026 (0.018) 0.154
Household head has some primary education = 1
0.187 (0.325) 0.564 -0.458 (0.298) 0.124
Household head completed primary education = 1
0.024 (0.275) 0.932 0.720 (0.324) 0.026
Household head has at least some higher education = 1
-0.913 (0.537) 0.089 -0.132 (0.368) 0.720
Age of respondent in 2010 years 0.027 (0.020) 0.171 -0.022 (0.019) 0.252
Respondent has some primary education = 1
-0.312 (0.320) 0.330 0.421 (0.292) 0.150
Respondent completed primary education = 1
0.039 (0.280) 0.890 0.068 (0.295) 0.816
Respondent has at least some higher education = 1
0.971 (0.478) 0.042 -0.895 (0.442) 0.043
Proportion of adult household members in 2010 with some primary education
-0.465 (0.690) 0.501 0.664 (0.697) 0.341
Proportion of adult household members in 2010 who completed primary education
0.928 (0.676) 0.169 -1.502 (0.833) 0.071
Proportion of adult household members in 2010 with some higher education
-0.094 (0.871) 0.914 1.483 (0.972) 0.127
Household head‟s main occupation in 2010 was farming = 1
-0.730 (0.707) 0.302 4.944 (163.288) 0.976
Household head‟s main occupation in 2010 was other agricultural activities = 1
a 4.541 (163.289) 0.978
Household head‟s main occupation in 2010 was a non-agricultural business = 1
-1.301 (1.056) 0.218 4.001 (163.290) 0.980
Household head‟s main occupation in 2010 was casual labour = 1
-0.807 (1.048) 0.441 4.905 (163.289) 0.976
Household head‟s main occupation in 2010 was a salaried job = 1
-1.267 (0.822) 0.123 4.934 (163.289) 0.976
Household head‟s main occupation in 2010 was a civil servant = 1
a 4.982 (163.290) 0.976
Respondent‟s main occupation in 2010 was farming = 1
-0.483 (1.201) 0.688 3.379 (292.948) 0.991
Respondent‟s main occupation in 2010 was other agricultural activities = 1
a a
Respondent‟s main occupation in 2010 was a non-agricultural business = 1
a 4.188 (292.948) 0.989
Respondent‟s main occupation in 2010 was casual labour = 1
a 3.527 (292.948) 0.990
Respondent‟s main occupation in 0.743 (1.469) 0.613 5.046 (292.948) 0.986
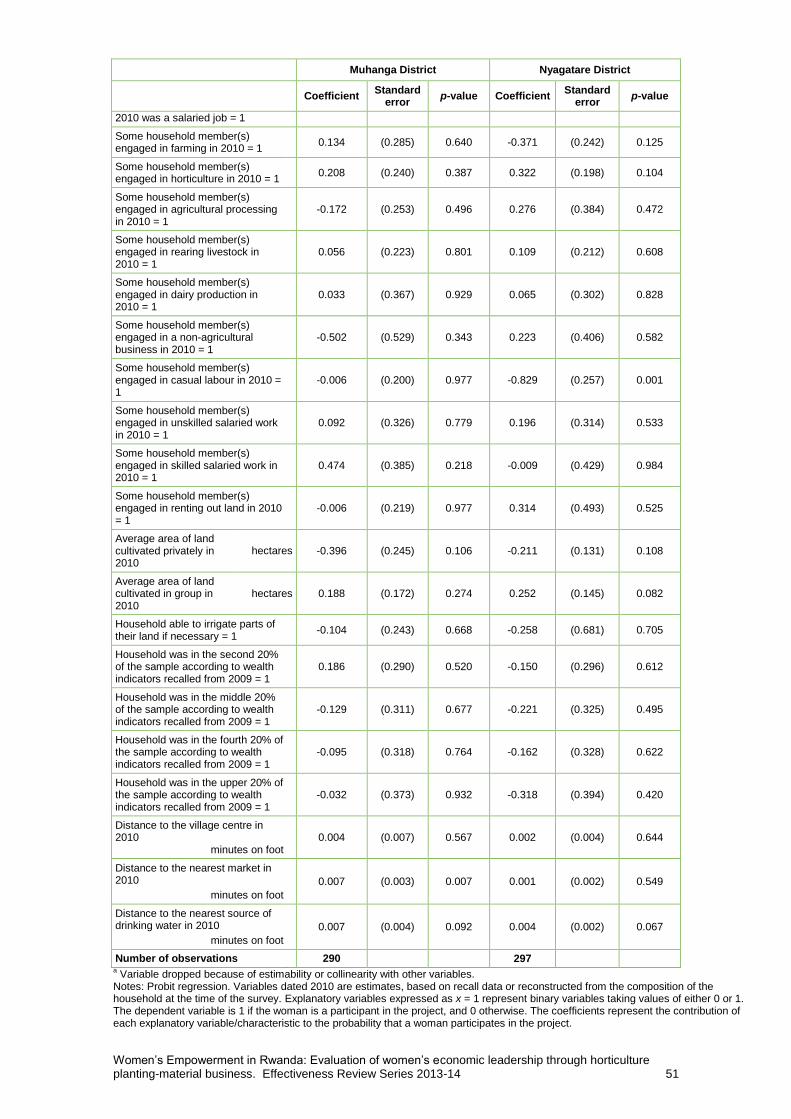
Women‟s Empowerment in Rwanda: Evaluation of women‟s economic leadership through horticulture planting-material business. Effectiveness Review Series 2013-14 51
Muhanga District Nyagatare District
Coefficient
Standard error
p-value Coefficient Standard
error p-value
2010 was a salaried job = 1
Some household member(s) engaged in farming in 2010 = 1
0.134 (0.285) 0.640 -0.371 (0.242) 0.125
Some household member(s) engaged in horticulture in 2010 = 1
0.208 (0.240) 0.387 0.322 (0.198) 0.104
Some household member(s) engaged in agricultural processing in 2010 = 1
-0.172 (0.253) 0.496 0.276 (0.384) 0.472
Some household member(s) engaged in rearing livestock in 2010 = 1
0.056 (0.223) 0.801 0.109 (0.212) 0.608
Some household member(s) engaged in dairy production in 2010 = 1
0.033 (0.367) 0.929 0.065 (0.302) 0.828
Some household member(s) engaged in a non-agricultural business in 2010 = 1
-0.502 (0.529) 0.343 0.223 (0.406) 0.582
Some household member(s) engaged in casual labour in 2010 = 1
-0.006 (0.200) 0.977 -0.829 (0.257) 0.001
Some household member(s) engaged in unskilled salaried work in 2010 = 1
0.092 (0.326) 0.779 0.196 (0.314) 0.533
Some household member(s) engaged in skilled salaried work in 2010 = 1
0.474 (0.385) 0.218 -0.009 (0.429) 0.984
Some household member(s) engaged in renting out land in 2010 = 1
-0.006 (0.219) 0.977 0.314 (0.493) 0.525
Average area of land cultivated privately in 2010
hectares -0.396 (0.245) 0.106 -0.211 (0.131) 0.108
Average area of land cultivated in group in 2010
hectares 0.188 (0.172) 0.274 0.252 (0.145) 0.082
Household able to irrigate parts of their land if necessary = 1
-0.104 (0.243) 0.668 -0.258 (0.681) 0.705
Household was in the second 20% of the sample according to wealth indicators recalled from 2009 = 1
0.186 (0.290) 0.520 -0.150 (0.296) 0.612
Household was in the middle 20% of the sample according to wealth indicators recalled from 2009 = 1
-0.129 (0.311) 0.677 -0.221 (0.325) 0.495
Household was in the fourth 20% of the sample according to wealth indicators recalled from 2009 = 1
-0.095 (0.318) 0.764 -0.162 (0.328) 0.622
Household was in the upper 20% of the sample according to wealth indicators recalled from 2009 = 1
-0.032 (0.373) 0.932 -0.318 (0.394) 0.420
Distance to the village centre in 2010
minutes on foot
0.004 (0.007) 0.567 0.002 (0.004) 0.644
Distance to the nearest market in 2010
minutes on foot
0.007 (0.003) 0.007 0.001 (0.002) 0.549
Distance to the nearest source of drinking water in 2010
minutes on foot
0.007 (0.004) 0.092 0.004 (0.002) 0.067
Number of observations 290 297 a Variable dropped because of estimability or collinearity with other variables.
Notes: Probit regression. Variables dated 2010 are estimates, based on recall data or reconstructed from the composition of the household at the time of the survey. Explanatory variables expressed as x = 1 represent binary variables taking values of either 0 or 1. The dependent variable is 1 if the woman is a participant in the project, and 0 otherwise. The coefficients represent the contribution of each explanatory variable/characteristic to the probability that a woman participates in the project.

52 Women‟s Empowerment in Rwanda: Evaluation of women‟s economic leadership through horticulture planting-material business. Effectiveness Review Series 2013-14
The final set of variables used in the matching process were identified using a backwards stepwise regression for each of the two groups, to identify those variables correlated with being in an intervention group at p-values of 0.20 or less. For the households in Muhanga District, 13 such variables were identified, and in Nyagatare District, 16 such variables were identified. Tables A3.2 and A3.3 show the results of the probit models restricted to these final (restricted) sets of matching variables.
Table A3.2: Estimating the propensity score: parsimonious model for Muhanga District
Coefficient
Standard error
p-value
Number of members of household in 2010 0.099 (0.049) 0.044
Proportion of household members who were greater than 60 years old in 2010
1.210 (0.935) 0.196
Household head has at least some higher education = 1 -0.626 (0.441) 0.156
Age of respondent in 2010 years 0.019 (0.009) 0.027
Respondent has at least some higher education = 1 0.728 (0.362) 0.045
Proportion of adult household members in 2010 with some primary education
-0.746 (0.468) 0.111
Proportion of adult household members in 2010 who completed primary education
0.791 (0.390) 0.043
Respondent‟s main occupation in 2010 was a salaried job = 1 1.296 (0.814) 0.111
Some household member(s) engaged in horticulture in 2010 = 1 0.289 (0.195) 0.139
Some household member(s) engaged in a non-agricultural business in 2010 = 1
-0.620 (0.416) 0.136
Average area of land cultivated privately in 2010 hectares -0.381 (0.209) 0.069
Distance to the nearest market in 2010
minutes on foot 0.007 (0.002) 0.001
Distance to the nearest source of drinking water in 2010
minutes on foot 0.009 (0.004) 0.027
Number of observations 290
Notes: Probit regression. Variables dated 2009 are estimates, based on recall data or reconstructed from the composition of the household at the time of the survey. Explanatory variables expressed as x = 1 represent binary variables taking values of either 0 or 1. The dependent variable is 1 if the woman is a member of a self-help group supported by the project, and 0 otherwise. The coefficients represent the contribution of each explanatory variable/characteristic to the probability that a woman participates in the project.

Women‟s Empowerment in Rwanda: Evaluation of women‟s economic leadership through horticulture planting-material business. Effectiveness Review Series 2013-14 53
Table A3.3: Estimating the propensity score: parsimonious model for Nyagatare District
Coefficient
Standard error
p-value
Number of members of household in 2010 0.085 (0.046) 0.065
Household head is female = 1 0.524 (0.209) 0.012
Age of household head in 2010 years 0.015 (0.008) 0.07
Household head completed primary education = 1 0.501 (0.233) 0.032
Respondent has some primary education = 1 0.402 (0.215) 0.062
Respondent has at least some higher education = 1 -0.781 (0.354) 0.027
Proportion of adult household members in 2010 who completed primary education
-1.169 (0.612) 0.056
Proportion of adult household members in 2010 with some higher education
1.124 (0.704) 0.11
Household head‟s main occupation in 2010 was farming = 1 0.402 (0.247) 0.104
Household head‟s main occupation in 2010 was casual labour = 1
0.472 (0.361) 0.192
Respondent‟s main occupation in 2010 was a non-agricultural business = 1
0.842 (0.418) 0.044
Respondent‟s main occupation in 2010 was a salaried job = 1 1.682 (0.627) 0.007
Some household member(s) engaged in casual labour in 2010 = 1
-0.747 (0.221) 0.001
Average area of land cultivated privately in 2010 hectares -0.191 (0.113) 0.092
Average area of land cultivated in group in 2010 hectares 0.247 (0.128) 0.054
Distance to the nearest source of drinking water in 2010
minutes on foot 0.003 (0.002) 0.062
Number of observations 297
Notes: Probit regression. Variables dated 2009 are estimates, based on recall data or reconstructed from the composition of the household at the time of the survey. Explanatory variables expressed as x = 1 represent binary variables taking values of either 0 or 1. The dependent variable is 1 if the woman is a member of a self-help group supported by the project, and 0 otherwise. The coefficients represent the contribution of each explanatory variable/characteristic to the probability that a woman participates in the project.
Defining the region of common support
After estimating the propensity scores, the presence of a good common support area needs to be checked. The area of common support is the region where the propensity-score distributions of the treatment and comparison groups overlap. The common support assumption ensures that „treatment observations have a comparison observation “nearby” in the propensity score distribution‟ (Heckman, LaLonde and Smith, 199927). Since some significant differences were found between the intervention and comparison groups in terms of their baseline characteristics (as detailed in Section 4.3), some of the women in the intervention group are too different from the comparison group to allow for meaningful comparison. We developed a minima and maxima comparison, deleting all observations whose propensity score is smaller than the minimum and larger than the maximum in the opposite group (Caliendo and Kopeinig, 2008). In Muhanga, 11 of the 81 project participants and 32 of the 208 women surveyed in the comparison cells were dropped because they lay outside the area of common support. In Nyagatare, only one of the 94 project participants and eight of the 207 women surveyed in the comparison cells were dropped for this reason. The consequence of dropping project participant households is that the estimates of differences in outcome characteristics between the various treatment groups only apply to those intervention households that were not dropped; that is, they do not represent the surveyed population as a whole. Figures A3.1 and A3.2 illustrate the propensity scores and show the proportion of women lying on and off the areas of common support, by treatment group.

54 Women‟s Empowerment in Rwanda: Evaluation of women‟s economic leadership through horticulture planting-material business. Effectiveness Review Series 2013-14
Figure A3.1: Propensity score on and off area of common support:
Muhanga District
Figure A3.2: Propensity score on and off area of common support: Nyagatare District
Matching intervention and comparison women
Following Rosenbaum and Rubin (1983), after estimating the propensity scores and defining the area of common support, individuals are matched on the basis of their propensity score. The literature has developed a variety of matching procedures. For the main results presented in this Effectiveness Review we chose to employ the method of kernel matching (note that we use alternative matching procedures as a means of robustness checks in Appendix 4). The kernel matching method weights the contribution of each comparison group member, attaching greater weight to those comparison observations that provide a better match with the treatment observations.
0 .2 .4 .6 .8 1Propensity Score
Untreated: Off support Untreated: On support
Treated: On support Treated: Off support
0 .2 .4 .6 .8Propensity Score
Untreated: Off support Untreated: On support
Treated: On support Treated: Off support

Women‟s Empowerment in Rwanda: Evaluation of women‟s economic leadership through horticulture planting-material business. Effectiveness Review Series 2013-14 55
One common approach is to use the normal distribution with mean zero as a kernel, and weights given by the distribution of the differences in propensity score. Thus „good‟ matches get a larger weight than „poor‟ matches. We use the psmatch2 module in STATA using the default bandwidth of 0.06, restricting the analysis to the area of common support. When using PSM, standard errors of the estimates were bootstrapped using 1,000 repetitions to account for the additional variation caused by the estimation of the propensity scores and the determination of the common support.28
Check balancing
For PSM to be valid, the intervention group and the matched comparison group need to be balanced in that they need to be similar in terms of their observed baseline characteristics. This should be checked. The most straightforward method to do this is to test whether there are any statistically significant differences in baseline covariates between the intervention and comparison group in the matched sample. Efforts were made to ensure that the covariates were balanced across groups at p-values greater than 0.20. The balances of each of the matching variables after kernel matching are shown in Tables A3.4 and A3.5. None of the variables implemented for the matching are statistically significant once the matched sample is used. Moreover, the matching variables are jointly statistically insignificant in the matched sample, whereas they were jointly statistically significant in the unmatched model.
Table A3.4: Balancing test on the restricted set of matching variables in Muhanga District
Treated Untreated p-value
Number of members of household in 2010 5.538 5.547 0.975
Proportion of household members who were greater than 60 years old in 2010
0.043 0.034 0.607
Household head has at least some higher education = 1 0.075 0.071 0.923
Age of respondent in 2010 years 44.825 44.639 0.914
Respondent has at least some higher education = 1 0.113 0.126 0.794
Proportion of adult household members in 2010 with some primary education
0.741 0.751 0.760
Proportion of adult household members in 2010 who completed primary education
0.357 0.348 0.819
Respondent‟s main occupation in 2010 was a salaried job = 1 0.013 0.014 0.938
Some household member(s) engaged in horticulture in 2010 = 1 0.750 0.757 0.913
Some household member(s) engaged in a non-agricultural business in 2010 = 1
0.050 0.056 0.863
Average area of land cultivated privately in 2010 hectares 0.436 0.460 0.685
Distance to the nearest market in 2010
minutes on foot 49.225 51.976 0.681
Distance to the nearest source of drinking water in 2010
minutes on foot 30.637 30.715 0.982
Number of observations 80 176
Notes: Variables dated 2010 are estimates, based on recall data or reconstructed from the composition of the household at the time of the survey. Explanatory variables expressed as x = 1 represent binary variables taking values of either 0 or 1.

56 Women‟s Empowerment in Rwanda: Evaluation of women‟s economic leadership through horticulture planting-material business. Effectiveness Review Series 2013-14
Table A3.5: Balancing test on the restricted set of matching variables in Nyagatare District
Treated Untreated p-value
Number of members of household in 2010 5.602 5.653 0.872
Household head is female = 1 0.333 0.330 0.961
Age of household head in 2010 years 0.097 0.136 0.411
Household head completed primary education = 1 0.097 0.095 0.969
Respondent has some primary education = 1 0.032 0.019 0.583
Respondent has at least some higher education = 1 45.226 46.123 0.601
Proportion of adult household members in 2010 who completed primary education
0.858 0.835 0.840
Proportion of adult household members in 2010 with some higher education
0.388 0.421 0.786
Household head‟s main occupation in 2010 was farming = 1 0.065 0.082 0.645
Household head‟s main occupation in 2010 was casual labour = 1
0.161 0.165 0.951
Respondent‟s main occupation in 2010 was a non-agricultural business = 1
0.753 0.773 0.747
Respondent‟s main occupation in 2010 was a salaried job = 1 0.305 0.326 0.624
Some household member(s) engaged in casual labour in 2010 = 1
0.187 0.198 0.756
Average area of land cultivated privately in 2010 hectares 0.452 0.454 0.974
Average area of land cultivated in group in 2010 hectares 50.871 53.502 0.730
Distance to the nearest source of drinking water in 2010
minutes on foot 0.742 0.745 0.968
Number of observations 93 199
Notes: Variables dated 2010 are estimates, based on recall data or reconstructed from the composition of the household at the time of the survey. Explanatory variables expressed as x = 1 represent binary variables taking values of either 0 or 1.
Similarly, as shown in Table A3.6, we also pass the balance tests when using the full (unrestricted) set of matching variables. None of the matching variables are unbalanced with p-values of less than 0.2 among the matched samples in Muhanga, and only one of the matching variables (the household‟s engagement in horticulture in 2010) is unbalanced in Nyagatare.
Table A3.6: Balancing tests on the full set of baseline covariates
Muhanga District Nyagatare District
Treated Untreated p-value Treated Untreated p-value
Number of members of household in 2010
5.538 5.547 0.975 5.602 5.653 0.872
Household head is female = 1 0.425 0.353 0.356 0.333 0.330 0.961
Proportion of household members who were less than six years old in 2010
0.130 0.127 0.904 0.167 0.166 0.967
Proportion of household members who were greater than 60 years old in 2010
0.043 0.034 0.607 0.043 0.044 0.963
Proportion of adult household members in 2010 who were male
0.352 0.353 0.965 0.285 0.285 0.998
Age of household head in 2010
years 47.575 47.602 0.989 45.226 46.123 0.601
Household head has some primary education = 1
0.725 0.712 0.857 0.699 0.738 0.561
Household head completed primary education = 1
0.450 0.430 0.799 0.452 0.454 0.974
Household head has at least some higher education = 1
0.075 0.071 0.923 0.172 0.198 0.655

Women‟s Empowerment in Rwanda: Evaluation of women‟s economic leadership through horticulture planting-material business. Effectiveness Review Series 2013-14 57
Muhanga District Nyagatare District
Treated Untreated p-value Treated Untreated p-value
Age of respondent in 2010 years 44.825 44.639 0.914 41.183 42.400 0.479
Respondent has some primary education = 1
0.688 0.723 0.624 0.742 0.745 0.968
Respondent completed primary education = 1
0.475 0.449 0.748 0.366 0.406 0.577
Respondent has at least some higher education = 1
0.113 0.126 0.794 0.097 0.136 0.411
Proportion of adult household members in 2010 with some primary education
0.741 0.751 0.760 0.757 0.753 0.903
Proportion of adult household members in 2010 who completed primary education
0.357 0.348 0.819 0.305 0.326 0.624
Proportion of adult household members in 2010 with some higher education
0.156 0.154 0.951 0.187 0.198 0.756
Household head‟s main occupation in 2010 was farming = 1
0.863 0.890 0.596 0.753 0.773 0.747
Household head‟s main occupation in 2010 was other agricultural activities = 1
0.013 0.000 0.319 0.043 0.046 0.933
Household head‟s main occupation in 2010 was a non-agricultural business = 1
0.013 0.036 0.343 0.032 0.047 0.601
Household head‟s main occupation in 2010 was casual labour = 1
0.013 0.005 0.593 0.097 0.095 0.969
Household head‟s main occupation in 2010 was a salaried job = 1
0.050 0.051 0.978 0.054 0.021 0.239
Household head‟s main occupation in 2010 was a civil servant = 1
0.000 0.000 . 0.022 0.007 0.387
Respondent‟s main occupation in 2010 was farming = 1
0.975 0.973 0.923 0.849 0.822 0.617
Respondent‟s main occupation in 2010 was other agricultural activities = 1
0.000 0.004 0.555 0.000 0.005 0.487
Respondent‟s main occupation in 2010 was a non-agricultural business = 1
0.000 0.007 0.449 0.065 0.082 0.645
Respondent‟s main occupation in 2010 was casual labour = 1
0.000 0.002 0.700 0.054 0.071 0.629
Respondent‟s main occupation in 2010 was a salaried job = 1
0.013 0.014 0.938 0.032 0.019 0.583
Some household member(s) engaged in farming in 2010 = 1
0.775 0.750 0.710 0.763 0.790 0.665
Some household member(s) engaged in horticulture in 2010 = 1
0.750 0.757 0.913 0.538 0.415 0.095
Some household member(s) engaged in agricultural processing in 2010 = 1
0.175 0.193 0.767 0.075 0.051 0.497
Some household member(s) engaged in rearing livestock in 2010 = 1
0.525 0.531 0.936 0.505 0.513 0.913
Some household member(s) engaged in dairy production in 2010 = 1
0.075 0.069 0.887 0.151 0.125 0.614
Some household member(s) engaged in a non-agricultural business in 2010 = 1
0.050 0.056 0.863 0.172 0.158 0.794
Some household member(s) 0.488 0.426 0.437 0.161 0.165 0.951

58 Women‟s Empowerment in Rwanda: Evaluation of women‟s economic leadership through horticulture planting-material business. Effectiveness Review Series 2013-14
Muhanga District Nyagatare District
Treated Untreated p-value Treated Untreated p-value
engaged in casual labour in 2010 = 1
Some household member(s) engaged in unskilled salaried work in 2010 = 1
0.138 0.143 0.915 0.151 0.134 0.742
Some household member(s) engaged in skilled salaried work in 2010 = 1
0.113 0.090 0.638 0.086 0.057 0.448
Some household member(s) engaged in renting out land in 2010 = 1
0.363 0.350 0.869 0.065 0.039 0.434
Average area of land cultivated privately in 2010
hectares 0.436 0.460 0.685 0.858 0.835 0.840
Average area of land cultivated in a group in 2010
hectares 0.377 0.266 0.254 0.388 0.421 0.786
Household able to irrigate parts of their land if necessary = 1
0.200 0.243 0.515 0.022 0.025 0.866
Household was in the second 20% of the sample according to wealth indicators recalled from 2009 = 1
0.225 0.178 0.462 0.226 0.211 0.804
Household was in the middle 20% of the sample according to wealth indicators recalled from 2009 = 1
0.175 0.216 0.513 0.172 0.225 0.364
Household was in the fourth 20% of the sample according to wealth indicators recalled from 2009 = 1
0.163 0.214 0.404 0.215 0.259 0.485
Household was in the upper 20% of the sample according to wealth indicators recalled from 2009 = 1
0.188 0.204 0.795 0.226 0.199 0.653
Distance to the village centre in 2010
minutes on foot
16.613 16.149 0.842 24.129 24.564 0.907
Distance to the nearest market in 2010
minutes on foot
49.225 51.976 0.681 65.194 66.403 0.854
Distance to the nearest source of drinking water in 2010
minutes on foot
30.637 30.715 0.982 50.871 53.502 0.730
Number of observations 80 176 93 199
Notes: Variables dated 2010 are estimates, based on recall data or reconstructed from the composition of the household at the time of the survey. Explanatory variables expressed as x = 1 represent binary variables taking values of either 0 or 1.

Women‟s Empowerment in Rwanda: Evaluation of women‟s economic leadership through horticulture planting-material business. Effectiveness Review Series 2013-14 59
NOTES
1 For participation in training on access to credit, the differences estimated by the various PSM and linear and probit regression models tested are all positive, but they are not all statistically significant.
2 The nine topics of training are those listed in Table 5.1, as well as an „other‟ category, for which results are not shown in the table. There was no evidence of a difference between the project participants and comparison households in the proportions receiving „other‟ types of training.
3 This difference is statistically significant at at least the 10 per cent level under most of the PSM and regression models tested (with the exception of the PSM nearest-neighbour model).
4 The various PSM and linear regression models tested all produce estimates of a difference between project and comparison households in the overall sample that is positive, and (under most of the models) statistically significant at at least the 10 per cent level. Difference-in-difference estimates derived using the recalled baseline data on land area cultivated are of approximately the same magnitude as those shown in column 2 of Table 5.3 and (for the overall sample) are also consistently positive and statistically significant at at least the 10 per cent level.
5 In both cases the estimates derived from each of the various PSM and linear regression models tested are positive, but only some of them are statistically significant at the 10 per cent level.
6 Cronbach‟s alpha was used to measure this inter-item correlation. The Cronbach‟s alphas obtained for all the indicators for the recalled 2010 data in Muhanga and Nyagatare were 0.80 and 0.76, respectively. These alphas was increased to 0.82 and 0.79, respectively by removing those items that had a low correlation with the others. The alphas derived for the index of change in wealth indicators were originally 0.81 and 0.79 in Muhanga and Nyagatare, respectively, and were increased to 0.85 and 0.82, respectively by removing those items that had a low correlation with the others.
7 http://www.ifpri.org/publication/womens-empowerment-agriculture-index
8 It will be noted that in calculating these overall measures of women‟s empowerment, each of the individual characteristics presented in Figure 5.3 was weighted equally. This means that the index is weighted more towards characteristics of dimensions „Women‟s ability to make decisions and influence‟ and „Women‟s access to and control over resources‟, and less so towards the other three dimensions. Alternative weights could be given to the various characteristics and dimensions, which would necessarily result in changes in the overall indices and potentially in the magnitude of differences between the intervention and comparison groups.
9 The estimated differences shown in column 1 of Table 5.11 are mostly not statistically significant. However, the estimates derived from parametric PSM models and linear and probit regression models are all positive and statistically significant at the 1 per cent level, for all three outcome measures.
10 The correlation between the different statements was tested using Cronbach‟s alpha: the alpha of 0.52 demonstrates that the responses to the statements used to assess self-efficacy are not highly consistent. However, excluding any one of the statements would not significantly increase the consistency (as measured by Cronbach‟s alpha), so all four have been retained in this measure.
11 „Responding positively‟ here means that the respondent agreed strongly with the statement if the statement was expressed in a positive sense, or either disagreed or disagreed strongly with the statement if the statement was presented in a negative sense. It was observed in the course of the fieldwork that respondents had a tendency to agree by default with all the statements with which they were presented – hence the requirement for strong agreement with positive statements, whereas any level of disagreement seems sufficient with positive statements.
12 The estimates derived from the various statistical models for the result in Nyagatare District are not consistently positive.
13 Adapted from the General Self-Efficacy Scale, http://userpage.fu-berlin.de/~health/engscal.htm. Cronbach‟s alpha, the measure of consistency for the responses to the five statements, was 0.73.
14 Cronbach‟s alpha, the measure of consistency for the responses to the six statements, was 0.64.
15 As described in note 10, „responding positively‟ in this and subsequent indicators based on agree/disagree statements means that the respondent agreed strongly with the statement if the statement was expressed in a positive sense, or either disagreed or disagreed strongly with the statement if the statement was presented in a negative sense.
16 Responses to one other statement were found to be only weakly correlated with these five, and so was excluded from the analysis. Cronbach‟s alpha, the measure of consistency for the responses to the remaining five statements, was 0.65.
17 Cronbach‟s alpha, the measure of consistency for the responses to the three statements, was 0.64.
18 Cronbach‟s alpha, the measure of consistency for the responses to the 12 statements, was 0.91.
19 Most of the estimates produced by the various PSM and linear and probit regression models for the binary indicator reported in column 1 of Table 5.15 are negative and statistically significant at at least the 10 per cent level. However, when the respondents‟ share of household income is examined directly as a (quasi-continuous) outcome variable, the PSM and linear regression estimates, while still negative, are mostly not statistically significant.

60 Women‟s Empowerment in Rwanda: Evaluation of women‟s economic leadership through horticulture planting-material business. Effectiveness Review Series 2013-14
20 Asset types included in this measure were all types of livestock, agricultural land, bicycles, motorbikes
or other vehicles, wheelbarrows, mobile phones, refrigerator, water pump, plastic sheets, agricultural tools, and the family‟s dwelling.
21 The estimates derived from probit regression models for this outcome are statistically significant at the 10 per cent level, but those derived from the PSM models and linear regression models are not.
22 Cronbach‟s alpha, the measure of consistency for the responses to the 12 statements, was 0.82.
23 The estimates of the difference in Nyagatare District are mostly not statistically significant at conventional levels, though they are consistently positive.
24 Respondents were also asked to recall which type of community groups they were participating in at the project‟s notional baseline, in 2010. Using this recalled baseline data to generate difference-in-difference estimates of the number of groups in which the respondents were participating confirms that there is a statistically significant difference from the project in group participation in the overall sample and in Nyagatare District, though the magnitudes of these differences are less than those implied by column 2 of Table 5.16. However, the difference-in-difference estimates for Muhanga District are not statistically significant. Since the degree of bias in the recalled baseline data is not known, it cannot be determined whether the difference-in-difference estimates or the single difference estimates provide the more accurate indication of the project‟s effect.
25 Marco Caliendo and Sabine Kopeinig „Some Practical Guidance for the Implementation of Propensity Score Matching‟, Journal of Economic Surveys, vol. 22(1) (2008), pages 31–72.
26 Paul R. Rosenbaum and Donald B. Rubin, „The Central Role of the Propensity Score in Observational Studies for Causal Effects‟, Biometrika, vol. 70(1) (1983), pages 41–55.
27 James J. Heckman, Robert J. LaLonde and Jeffrey A. Smith, „The Economics and Econometrics of Active Labor Market Programs‟, Handbook of Labor Economics, vol. 3, part A (1999), pages 1865–2097.
28 Bootstrapping is a statistical procedure where repeated samples are drawn from the original sample with replacement. This results in a statistical distribution of parameter estimates (the sampling distribution). The bootstrapped standard error is the standard deviation of this sampling distribution and it can be shown that as the number of repeated samples becomes large, provided certain technical conditions are met this is a good estimate for the standard error of the estimate.

Women‟s Empowerment in Rwanda: Evaluation of women‟s economic leadership through horticulture planting-material business. Effectiveness Review Series 2013-14 61
Oxfam Effectiveness Reviews
For more information, or to comment on this report, email [email protected]
© Oxfam GB March 2015
This publication is copyright but the text may be used free of charge for the purposes of advocacy,
campaigning, education, and research, provided that the source is acknowledged in full. The copyright
holder requests that all such use be registered with them for impact assessment purposes. For copying in
any other circumstances, or for re-use in other publications, or for translation or adaptation, permission
must be secured and a fee may be charged. E-mail [email protected].
The information in this publication is correct at the time of going to press.
Oxfam GB, Oxfam House, John Smith Drive, Cowley, Oxford, OX4 2JY, UK.
OXFAM Oxfam is an international confederation of 17 organisations networked together in over 90 countries, as
part of a global movement for change, to build a future free from the injustice of poverty:
Oxfam America (www.oxfamamerica.org)
Oxfam Australia (www.oxfam.org.au)
Oxfam-in-Belgium (www.oxfamsol.be)
Oxfam Canada (www.oxfam.ca)
Oxfam France (www.oxfamfrance.org)
Oxfam Germany (www.oxfam.de)
Oxfam GB (www.oxfam.org.uk)
Oxfam Hong Kong (www.oxfam.org.hk)
Oxfam India (www.oxfamindia.org)
Intermón Oxfam (www.intermonoxfam.org)
Oxfam Ireland (www.oxfamireland.org)
Oxfam Italy (www.oxfamitalia.org)
Oxfam Japan (www.oxfam.jp)
Oxfam Mexico (www.oxfammexico.org)
Oxfam New Zealand (www.oxfam.org.nz)
Oxfam Novib (www.oxfamnovib.nl)
Oxfam Québec (www.oxfam.qc.ca)
Please write to any of the agencies for further information, or visit www.oxfam.org.
www.oxfam.org.uk/effectiveness