wolters kluwer full year 2003 results nancy mckinstry chairman executive board boudewijn beerkens...
TRANSCRIPT
Wolters Kluwer Wolters Kluwer
Full Year 2003 ResultsFull Year 2003 Results
Nancy McKinstry Chairman Executive Board
Boudewijn Beerkens Member Executive Board / CFO
8 March 2004 - Amsterdam

AgendaAgenda
Highlights
Market / Divisional Review
Financials
Divisional 2004 Plans
Outlook & Summary
Q&A

38 March 2004 Full Year 2003 Results
Highlights
New strategy firmly in place
Ordinary net income of € 349 million, -8% in constant currencies (OAP: € 343 million -12% in constant currencies; 1st half 03, -26%)
Revenues €3,436 million; ordinary EBITA €610 million; ordinary EBITA margin 18% (OAP: Revenues € 3,352 million; ordinary EBITA € 601 million)
Strong revenue growth in Canada, Italy, CEE, Spain as well as Tax Compliance, Teleroute and Professional & Education
Significant cost reductions of € 79 vs 2002 million achieved; one third structural
Reduction of 521 ultimo FTEs achieved (organic)
Maintained dividend at € 0.55 for 2003
Ordinary EPS fully diluted of € 1.18 (OAP: € 1.16)

48 March 2004 Full Year 2003 Results
Key Financials 2003 (NAP)
Constant % Currencies
2003 %EUR million
Revenues
Ordinary EBITA
Ordinary EBITA margin %
EBITA margin %
Ordinary Net Income
Ordinary EPS (fully diluted)
Ordinary free Cash flow
3,436
610
18
15
349
1.18
393
3,969
763
19
19
442
1.50
400
(4)
(10)
(8)
2002
(13)
(20)
(21)

58 March 2004 Full Year 2003 Results
Revenue growth*
Ordinary EBITA margin(After exceptional items)
Cash conversion
Ordinary Free Cash Flow
ROIC % **
Ordinary EPS (€)***
Key Operational Measures
Key Financial Measures
0%
18%
15%
109%
2003
€393 mln
7
1.18
Key Performance Indicators
* Excl. divestments ** After Tax *** Fully diluted
-1%
14%
HY 2003
€74 mln
0.42
68 March 2004 Full Year 2003 Results
Restructuring Costs*€ mln
Total Cost Savings
€ mln
Health
Education
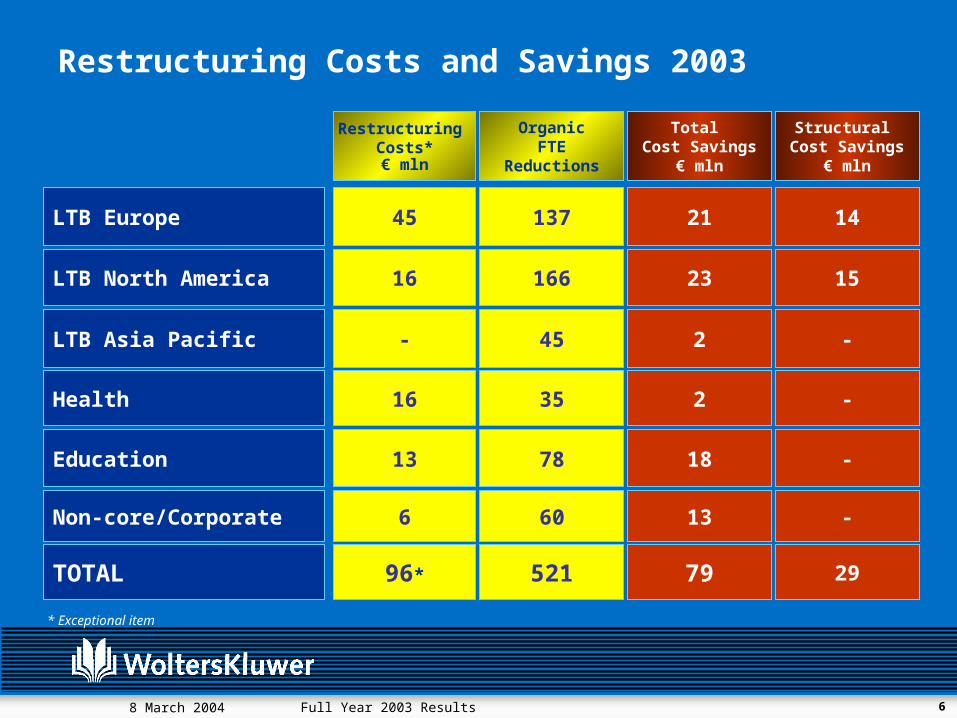
16 2
13 18
LTB Europe
LTB North America
45 21
16 23
TOTAL 96* 79
Structural Cost Savings
€ mln
-
-
14
15
29
Restructuring Costs and Savings 2003
Non-core/Corporate 6 13 -
LTB Asia Pacific - 2 -
* Exceptional item
OrganicFTE
Reductions
35
78
137
166
521
60
45

Market / Divisional Review
Nancy McKinstry Chairman Executive Board

88 March 2004 Full Year 2003 Results
LTB Europe
98 March 2004 Full Year 2003 Results
LTB Europe
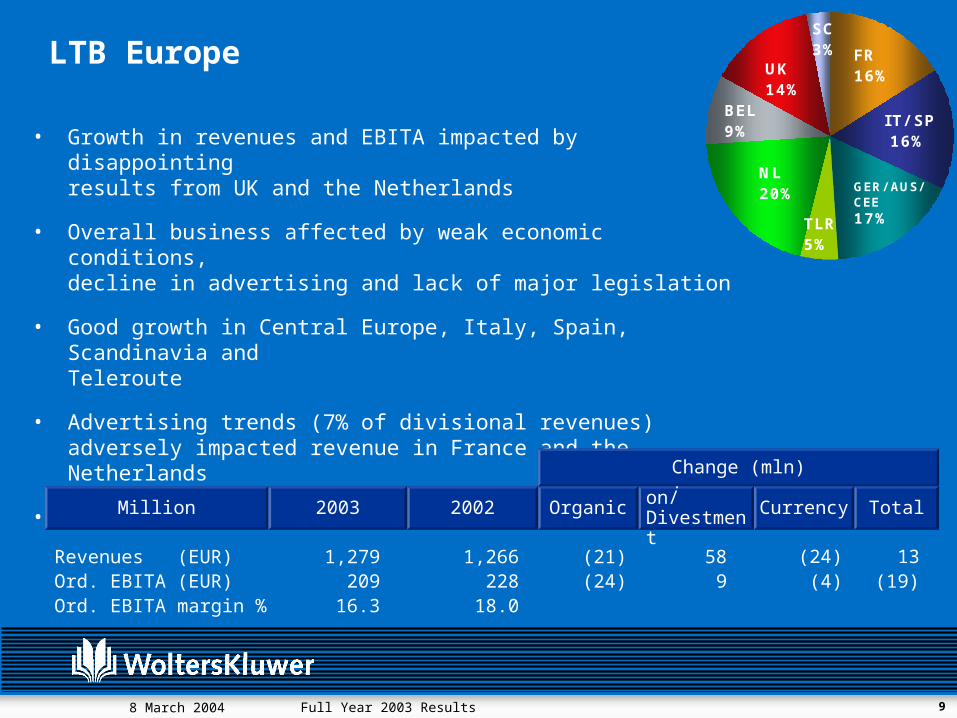
• Growth in revenues and EBITA impacted by disappointing results from UK and the Netherlands
• Overall business affected by weak economic conditions, decline in advertising and lack of major legislation
• Good growth in Central Europe, Italy, Spain, Scandinavia and Teleroute
• Advertising trends (7% of divisional revenues) adversely impacted revenue in France and the Netherlands
• 28% of cluster revenues are electronic
FR16%
TLR5%
I T/ SP16%
GER/ AUS/CEE17%
BEL9%
SC3%
UK14%
NL20%
Revenues (EUR) Ord. EBITA (EUR)Ord. EBITA margin %
1,27920916.3
1,26622818.0
(21)(24)
58 9
(24)(4)
13(19)
Million TotalCurrencyAcquisition/DivestmentOrganic20022003
Change (mln)

108 March 2004 Full Year 2003 Results
LTBE • Online legal database in France, Belgium and Spain have been migrated onto the EIP
• The Symphony project (common chart of account and finance hierarchy) is progressing well and according to plan
• Chief Publishing Officer (CPO) and Chief Services Officer (CSO) roles in all countries have been established
• 137 FTEs were reduced
• Restructuring plans begun in Belgium led to stabilized revenues and improved profitability
• Consolidation into a single financial system progressing well
Belgium
• Launched legal attack plan products; a collection of horizontal law books/CDs and on-line products
Germany
Accomplishments 2003
118 March 2004 Full Year 2003 Results
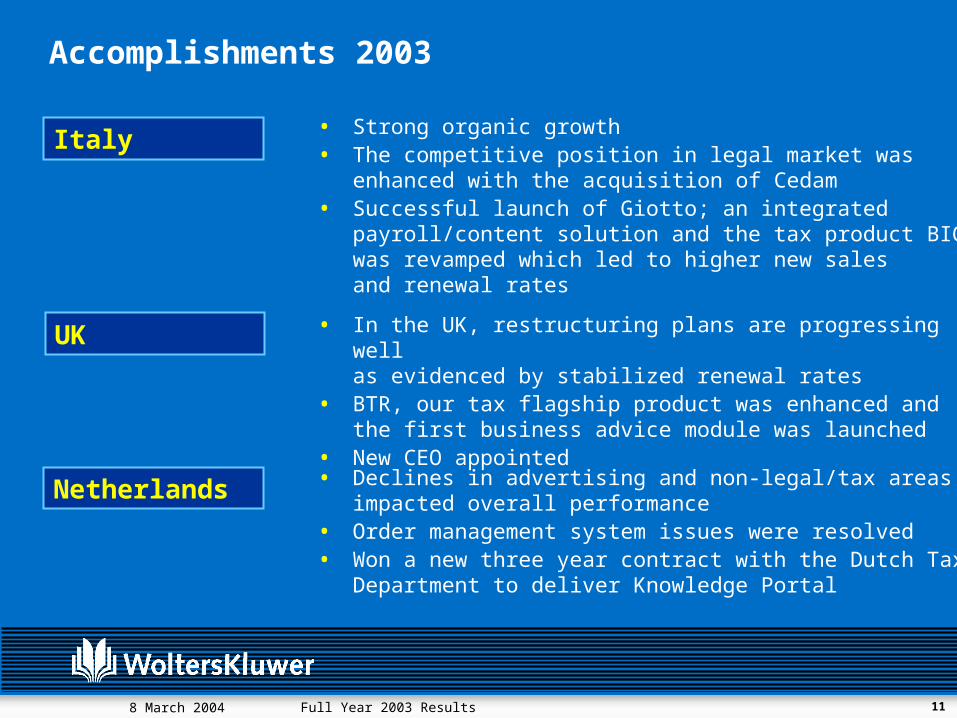
• Strong organic growth• The competitive position in legal market was
enhanced with the acquisition of Cedam• Successful launch of Giotto; an integrated
payroll/content solution and the tax product BIG was revamped which led to higher new sales and renewal rates
• In the UK, restructuring plans are progressing well as evidenced by stabilized renewal rates
• BTR, our tax flagship product was enhanced and the first business advice module was launched
• New CEO appointed
Italy
UK
• Declines in advertising and non-legal/tax areas impacted overall performance
• Order management system issues were resolved• Won a new three year contract with the Dutch Tax Department
to deliver Knowledge Portal
Netherlands
Accomplishments 2003

128 March 2004 Full Year 2003 Results
LTB North America

138 March 2004 Full Year 2003 Results
LTB North America
• Despite challenging economic conditions, good revenue growth was achieved LIS, Tax Compliance and CCH Canada
• Aspen’s business performance has stabilized and systems issues have been fixed
• Stronger year-end renewal performance positioned these units for improved results in 2004
• Electronic sales 46% of cluster revenues
12%
15%
4% 14%
27%
28%
BSIAspen
CCH LIS
CCH Tax Compliance
CCH Canadian
CCH US Publishing
Ord. EBITA margin %
Revenues (USD)(EUR)
Ord. EBITA (USD)(EUR)
1,1581,025
302267
20
2
(202)
(58)
(22)
4
(204)
(52)
1,1601,229
302319
26.1 26.0
Million TotalCurrencyAcquisition/DivestmentOrganic20022003
Change (mln)

148 March 2004 Full Year 2003 Results
LTB NA• Restructuring executed according to plan; 4 operating
units organized around customer units (into 2 divisions)• Significant cost savings were achieved to improve operating
margin levels to 26% for the full year• 166 FTEs were reduced
• Product line was rationalized to sharpen the focus on legal customers; revenues were reduced by approximately US $40 mln
• Systems-related issues were fixed • Integration with the CCH legal unit going well
• Market share gains driven by strength of software solutions• Extended leading position in the corporate legal market
through the acquisition of TyMetrix, the #1 provider of e-billing services
Aspen
LIS
Accomplishments 2003

158 March 2004 Full Year 2003 Results
• Tax Compliance showed strong organic growth (7%)• Launch of the enhanced TRN (Tax Research Network)
product in November further strengthened position in the tax research market
BSI
CCH Tax
• Performance impacted by lack of significant legislation, slow new sales of software and delays in new sales of Patriot Act related products
• Successful launch of Expere; product targeted at the national bank market and won a major contract
Accomplishments 2003
168 March 2004 Full Year 2003 Results
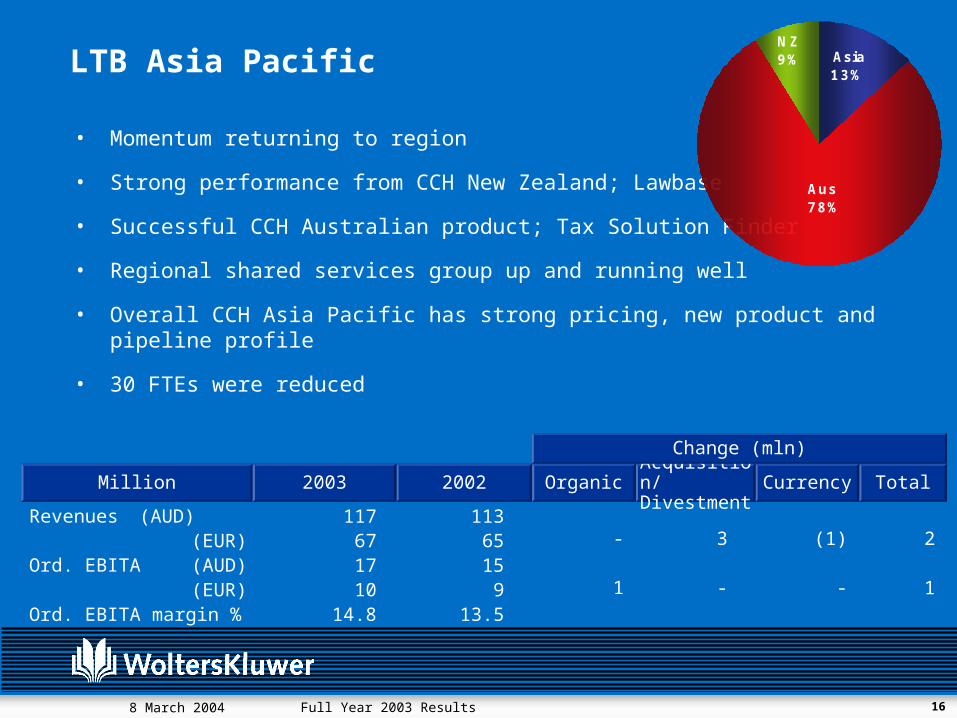
LTB Asia Pacific
• Momentum returning to region
• Strong performance from CCH New Zealand; Lawbase
• Successful CCH Australian product; Tax Solution Finder
• Regional shared services group up and running well
• Overall CCH Asia Pacific has strong pricing, new product and pipeline profile
• 30 FTEs were reduced
Asia13%
NZ9%
Aus78%
Revenues (AUD)(EUR)
Ord. EBITA (AUD)(EUR)
Ord. EBITA margin %
117671710
14.8
3
-
(1)
-
-
1
2
1
1136515
913.5
Million TotalCurrencyAcquisition/DivestmentOrganic20022003
Change (mln)

178 March 2004 Full Year 2003 Results
Health

188 March 2004 Full Year 2003 Results
Health• Health division is mid way through a major
restructuring program that began in November 2002
• Overall 2003 performance below expectations due to setbacks in the journal business, a weak advertising market, flat library budgets, and the bankruptcy of European distributor
• The revitalization of core publishing program is achieving good results
• OVID on-line revenues continue to grow through a combination of increased market penetration and usage growth, journal business was challenged by the loss of a major publication
• Weak advertising trends (7% of divisional revenues)
• Electronic sales 30% of cluster revenues
18%33%
8%
41%
Medical Research
Pharma Solutions
Prof. & Education
Clinical Tools
Revenues (USD)(EUR)
Ord. EBITA (USD)(EUR)
Ord. EBITA margin %
75066311710315.6
4
-
(125)
(20)
(9)
(7)
(130)
(27)
74979312313016.4
Million TotalCurrencyAcquisition/DivestmentOrganic20022003
Change (mln)

198 March 2004 Full Year 2003 Results
Professional & Education
• Solid revenue growth (2%) due to the rejuvenation of core publishing program; e.g. launch of a new journal Nursing Made Incredibly Easy was launched
• Strong market share gains in education
• Usage of Ovid online increased by 22%; with organic growth over 2%
• Strong international sales from customers who added OVID to print subscriptions
• 2 key society wins; the American College of Obstetrics and Gynecology (ACOG) and the American Academy of Medical Colleges
Medical Research
Health • Reorganized business around four major customer segments
• 35 FTEs were reduced
Accomplishments 2003

208 March 2004 Full Year 2003 Results
• Increase in third party re-print sales impact margin levels • Six new journal titles were launched • The Medical Communications business showed strong
improvement in Europe/ Asia-Pacific with significant gains in new clients
• Completed Medi-Span & Facts and Comparisons integration
• E-facts sales gaining momentum • Launched SkolarMD@OVID
Pharma Solutions
Clinical Tools
Accomplishments 2003

218 March 2004 Full Year 2003 Results
Education
228 March 2004 Full Year 2003 Results
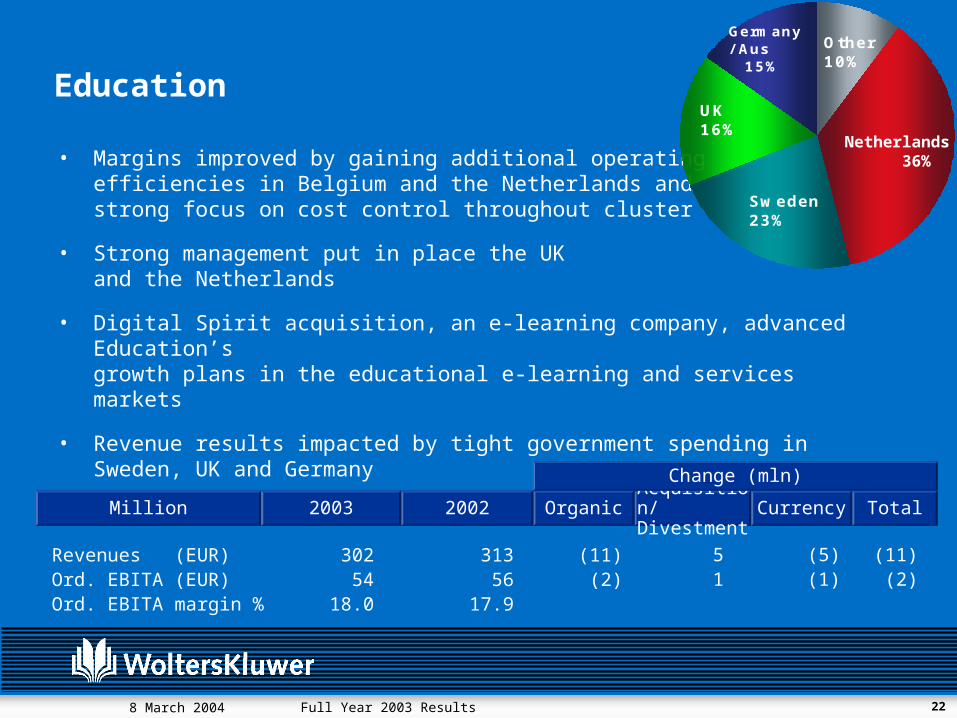
Education
• Margins improved by gaining additional operating efficiencies in Belgium and the Netherlands and strong focus on cost control throughout cluster
• Strong management put in place the UK and the Netherlands
• Digital Spirit acquisition, an e-learning company, advanced Education’s growth plans in the educational e-learning and services markets
• Revenue results impacted by tight government spending in Sweden, UK and Germany
Other10%
UK16%
Sweden23%
Germany/ Aus 15%
Netherlands 36%
Revenues (EUR) Ord. EBITA (EUR)Ord. EBITA margin %
30254
18.0
31356
17.9
(11)(2)
51
(5)(1)
(11)(2)
Million TotalCurrencyAcquisition/DivestmentOrganic20022003
Change (mln)

238 March 2004 Full Year 2003 Results
NL
Germany • Digital Spirit performance exceeded expectations• Exiting Austrian co-operative deal; Austria now integrated
into Germany
Education• Significant cost savings achieved• SAP Klopotek implementation well underway• 78 FTEs were reduced
• Q4 organic revenue improved to a large order for Primary Education and stronger Secondary Education sales
• Tight government spending continues
Accomplishments 2003
248 March 2004 Full Year 2003 Results
Sweden
Belgium • Strong EBITA improvement level against last year due to tighter operating control by new management
• At Liber Hermods, focus shifting to corporate E-learning; benefiting from the Digital Spirit customer base and products
UK• Moorhouse Black showed strong growth (40%)• New management delivering; product development pipe-
line stronger; sales & marketing receiving greater attention
Accomplishments 2003

258 March 2004 Full Year 2003 Results
Non-Core
• Successful divestment of KAP, BSL and ISBW
• Strong focus on cost control which led to significant improvements in margins in the second half of 2003
• Stabilized revenues despite weak advertising trends (21% of revenues)
• 50 FTEs were reduced
Revenues (EUR) Ord. EBITA (EUR)Ord. EBITA margin %
10010
10.2
30358
19.3
(8)1
(193)(49)
(2) (203)(48)
Million TotalCurrencyAcquisition/DivestmentOrganic20022003
Change (mln)

Financials
Boudewijn Beerkens Member Executive Board / CFO
278 March 2004 Full Year 2003 Results
Financial Highlights NAP Ordinary net income -8% in constant currencies
Currency effects translation results
Lower financing charges of € 114 mln (2002: € 141 mln) Due to lower interest rates / lower net debt balance
Net debt reduced by 29% from € 2.7 bln to € 1.9 bln
Successful bond buy-back program of € 1.1 bln and new bond issue of € 700 mln
Effective tax rate on ordinary net income 28.6% (27.2% in 2002)
Wolters Kluwer moving closer to IFRS
Positive cash flow and tighter working capital control; Free cash flow of € 393 mln
Stricter policy led to fewer acquisitions
288 March 2004 Full Year 2003 Results
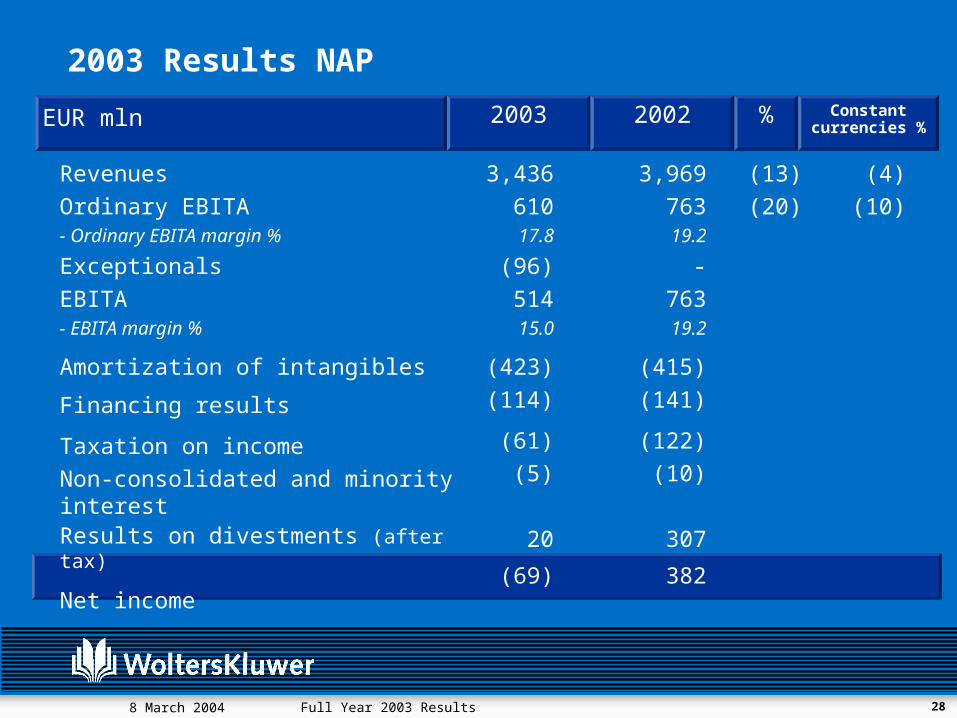
2003 Results NAP
2003 %2002 Constant currencies %
EUR mln
RevenuesOrdinary EBITA- Ordinary EBITA margin %
ExceptionalsEBITA- EBITA margin %
Amortization of intangibles
Financing results
Taxation on incomeNon-consolidated and minority interestResults on divestments (after tax)
Net income
3,96976319.2
-76319.2
(415)(141)
(122)(10)
307
382
(13)(20)
(4)(10)
3,43661017.8
(96)51415.0
(423)(114)
(61)(5)
20
(69)

298 March 2004 Full Year 2003 Results
2003 Results NAP (cont)
Net income
Amortization of intangibles
Taxation on amortization
Results on divestments (after tax)
Exceptional items (after tax)
Ordinary Net Income
Ordinary EPS € (fully diluted)
(69)
423
(46)
(20)
61
349
1.18
382
415
(48)
(307)
-
442
1.50
2003 %2002 Constant currencies %
EUR mln
(21) (8)

308 March 2004 Full Year 2003 Results
Wolters Kluwer closer to IFRS
Wolters Kluwer prepares financial statements in accordance with Dutch GAAP
Dutch accounting standards are moving towards IFRS
Wolters Kluwer has implemented changes in Dutch standards in its financial statements 2003, bringing WK closer to IFRS
Year-end 2003 results will include these accounting changes
– RJ 270 (profit and loss accounting, corresponding with IAS 18);
– RJ 271 (employee benefits, corresponding with IAS 19);
– RJ 160 (which relates to post balance sheet events, corresponding with IAS 10).
Equity opening
balance 2003 Revenues
2003 2002
RJ 270 (67) 84RJ 271 (58) - Total 31 84
EUR mln (after tax)
75 -
75
Net Income 2003 2002
9
6
(7)
54
(3) 61RJ 160 156 - - - -
318 March 2004 Full Year 2003 Results
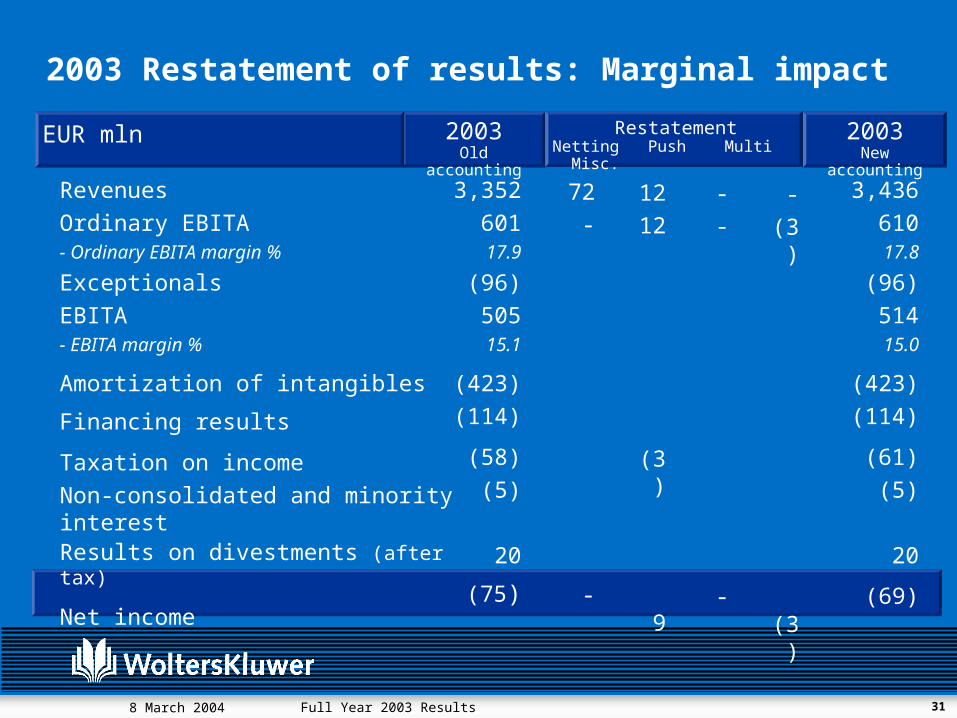
2003 Restatement of results: Marginal impact
2003Old accounting
2003New accounting
EUR mln
RevenuesOrdinary EBITA- Ordinary EBITA margin %
ExceptionalsEBITA- EBITA margin %
Amortization of intangibles
Financing results
Taxation on incomeNon-consolidated and minority interestResults on divestments (after tax)
Net income
3,35260117.9
(96)50515.1
(423)(114)
(58)(5)
20
(75)
3,43661017.8
(96)51415.0
(423)(114)
(61)(5)
20
(69)
RestatementNetting Push Multi Misc.
72-
-
1212
(3)
9
--
-
-(3)
(3)

328 March 2004 Full Year 2003 Results
Consolidated Balance Sheet2003EUR mln 2002
Total fixed assets
Total current assets
Total current liabilities
Working capital
Capital Employed
Shareholders’ equity
Perpetual subordinated bond
Convertible bond
Minority interests
ProvisionsLong term loans
Total Financing
3,299
1,745
(1,353)
392
3,691
861
225
490
3
306
1,806
3,691
4,107
2,054
(1,571)
483
4,590
1,278
225
700
3
394
1,990
4,590
338 March 2004 Full Year 2003 Results
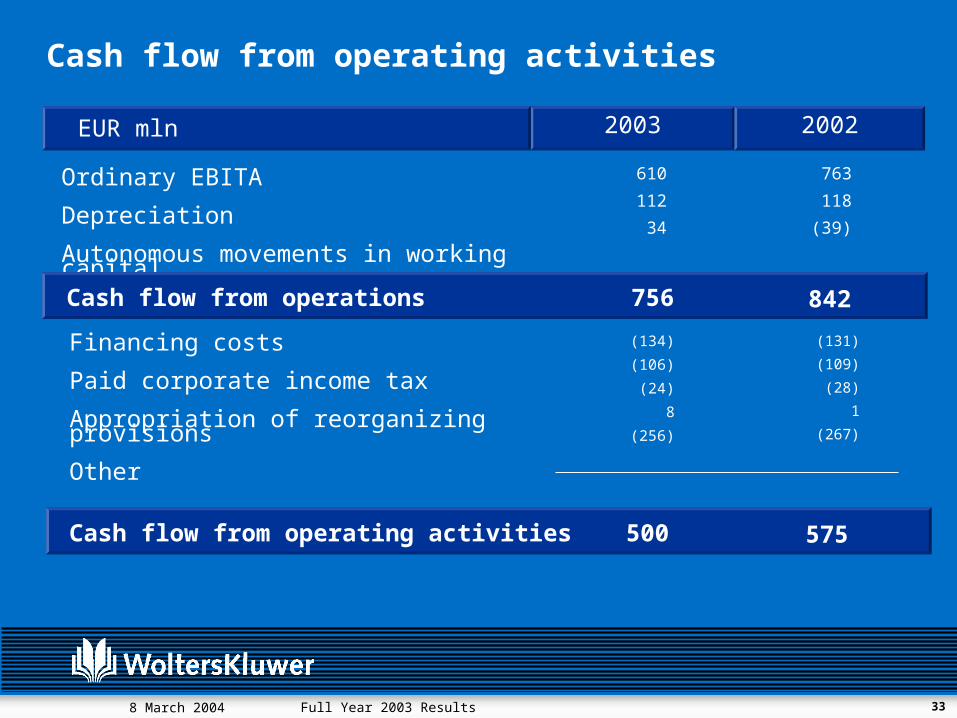
Cash flow from operating activities
610
112
34
2003 EUR mln 2002
763
118
(39)
Ordinary EBITA
Depreciation
Autonomous movements in working capital
Cash flow from operations 756 842
(131)
(109)
(28)
1
(267)
(134)
(106)
(24)
8
(256)
Financing costs
Paid corporate income tax
Appropriation of reorganizing provisions
Other
Cash flow from operating activities 500 575
348 March 2004 Full Year 2003 Results
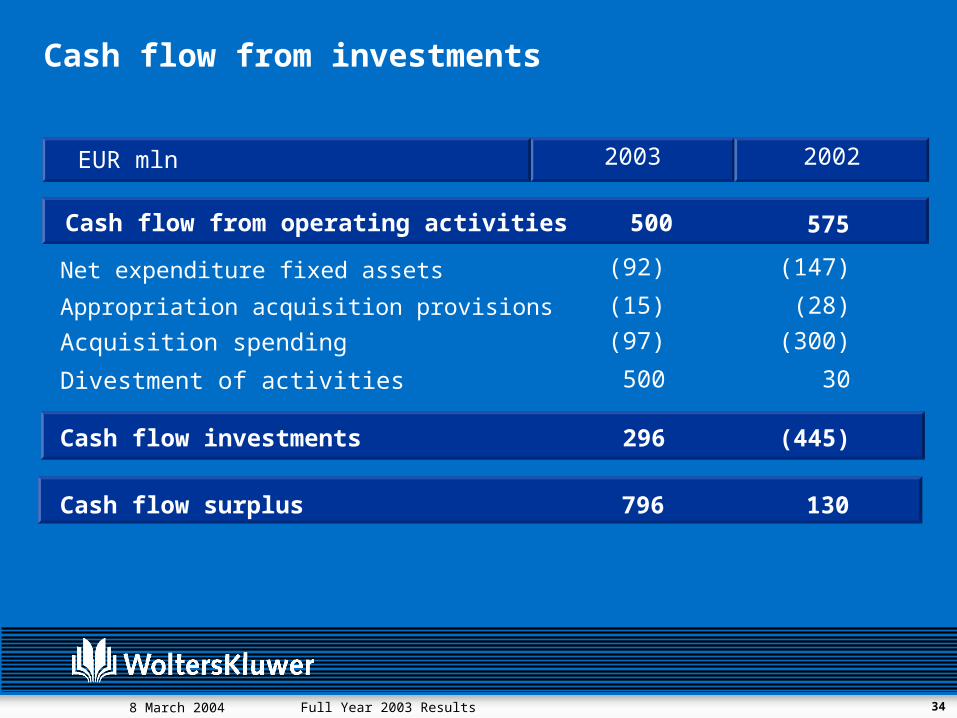
Cash flow from investments
2003 EUR mln 2002
130796Cash flow surplus
(445)296Cash flow investments
Acquisition spending
Divestment of activities
(300)
30
(97)
500
(147)
(28)
(92)
(15)
Net expenditure fixed assets
Appropriation acquisition provisions
Cash flow from operating activities 500 575

358 March 2004 Full Year 2003 Results
Cash flow from financing
2003 EUR mln 2002
130796Cash flow surplus1
-
43
(92)
(24)
-
23
(616)
(73)
(10)
Exercise of stock options
Swap gains
Movement in long term loans/bonds/debts
Dividend payments
Repurchased shares
(72)(676)Cash flow financing

368 March 2004 Full Year 2003 Results
2003 EUR mln 2002
239
(4)
235
293
(9)
284
Cash and cash equivalents as at Jan. 1
Exchange differences on cash equivalents
400393Free cash flow
58120Net cash flow
293404Cash and cash equivalents as at Dec. 31
Free cash flow
Cash flow from operating activities 500 575
Net expenditure fixed assets (92) (147)
Appropriation of acquisition provisions (15) (28)
(72)(676)Cash flow financing
(445)296Cash flow investments
Cash flow from operating activities 500 575

378 March 2004 Full Year 2003 Results
Currency Translation Impacts Results 2003 NAP
Total organic
Acquisitions
Divestments
In constant currencies
Currency
Total
Revenues Ordinary EBITA
(2) (4)
2 1
(5) (7)
(4) (10) (8)
(9) (10) (13)
(13) (20) (21)
Ordinary Net Incomein %

388 March 2004 Full Year 2003 Results
Exposure management
Goal: to mitigate the effects of exchange rate and interest rate movements on results, balance sheet and cash flow
Identified risks:
- Liquidity risk → Ample headroom, funding at least 1 year in advance
- Interest rate risk → Large part of fixed rate debt reflecting stable business
- Currency risk → Preference for ‘natural’ hedges
- Credit risk → Restrictions on counterparties
Strict policies and governance in place, identified ranges
398 March 2004 Full Year 2003 Results
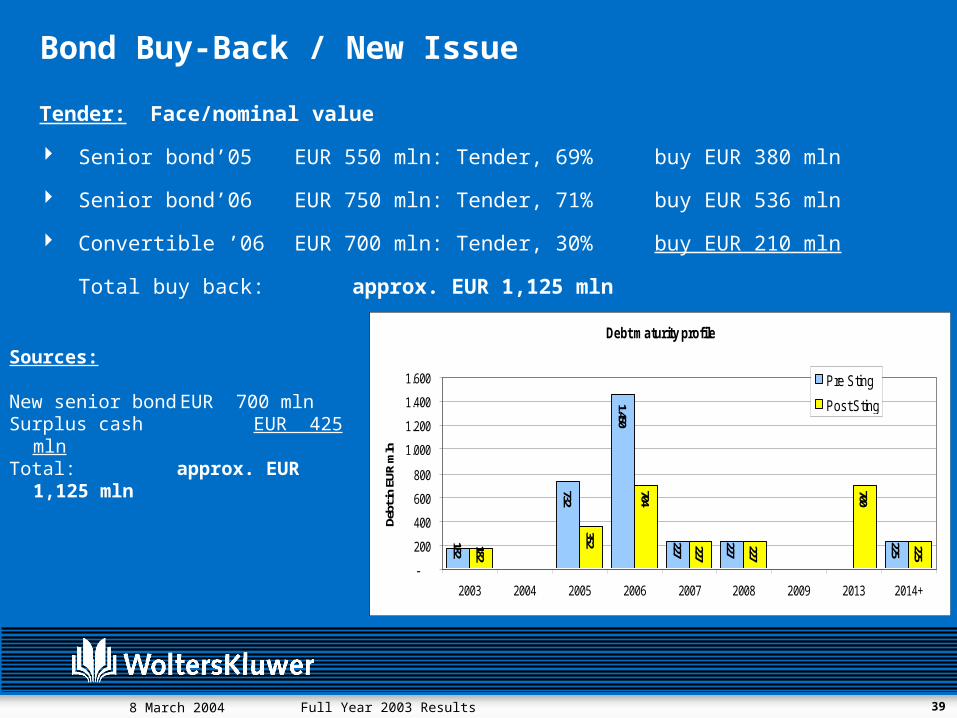
Bond Buy-Back / New Issue
Tender: Face/nominal value
Senior bond’05 EUR 550 mln: Tender, 69% buy EUR 380 mln
Senior bond’06 EUR 750 mln: Tender, 71% buy EUR 536 mln
Convertible ’06 EUR 700 mln: Tender, 30% buy EUR 210 mln
Total buy back: approx. EUR 1,125 mln
Sources: New senior bond EUR 700 mln Surplus cash EUR 425
mln Total: approx. EUR 1,125 mln
Debt maturity profile
182
732
1.450
227
227
225182
227
227
700
225
704
352
-
200
400
600
800
1.000
1.200
1.400
1.600
2003 2004 2005 2006 2007 2008 2009 2013 2014+
Debt
in E
UR m
lnPre Sting
Post Sting

408 March 2004 Full Year 2003 Results
Acquisitions and Divestments 2003 Stricter policy led to fewer strategic acquisitions:
- Manual Industrial Property - Cedam
- Digital Spirit - TyMetrix
- Atchley - Stanford Skolar
Total acquisition commitment € 115 mln; cash out € 51mln
Annualized revenues € 59 mln
Sales multiplier 1.9
Earn-out deals
3 companies were divested:
- ISBW
- Educational assets of Aspen
- Public Law assets of KLI

418 March 2004 Full Year 2003 Results
Return on invested capital (ROIC)
One of the six key performance indicators
Numerator: Full year ordinary EBITA after tax
Denominator: average invested capital, defined as capital employed adjusted for non-operating items, exceptional items, cash, cumulative goodwill and publishing rights amortization and goodwill charged to equity
The 2004 ROIC effected by additional product development spending
Target 2004
2007 onwards
2003
ROIC
Key Financial Measure
6% ≥ WACC7%

428 March 2004 Full Year 2003 Results
Financial position in good shape to support the new strategy
Prepared for IFRS
No material debt has to be refinanced in 2004
Strong liquidity, reduced net debt and pushed out maturities
Cash flow remains strong asset
Results will to a certain extent remain exposed to currency fluctuations

Divisional Action Plans 2004
Nancy McKinstry Chairman Executive Board

448 March 2004 Full Year 2003 Results
Focused on:
• Focus on health/medical market
• Reinforce our leadership in institutional research
• Revitalize the core text and reference business
• Pursue growth in global, pharmaceutical and clinical tools markets
Health Strategy
458 March 2004 Full Year 2003 Results
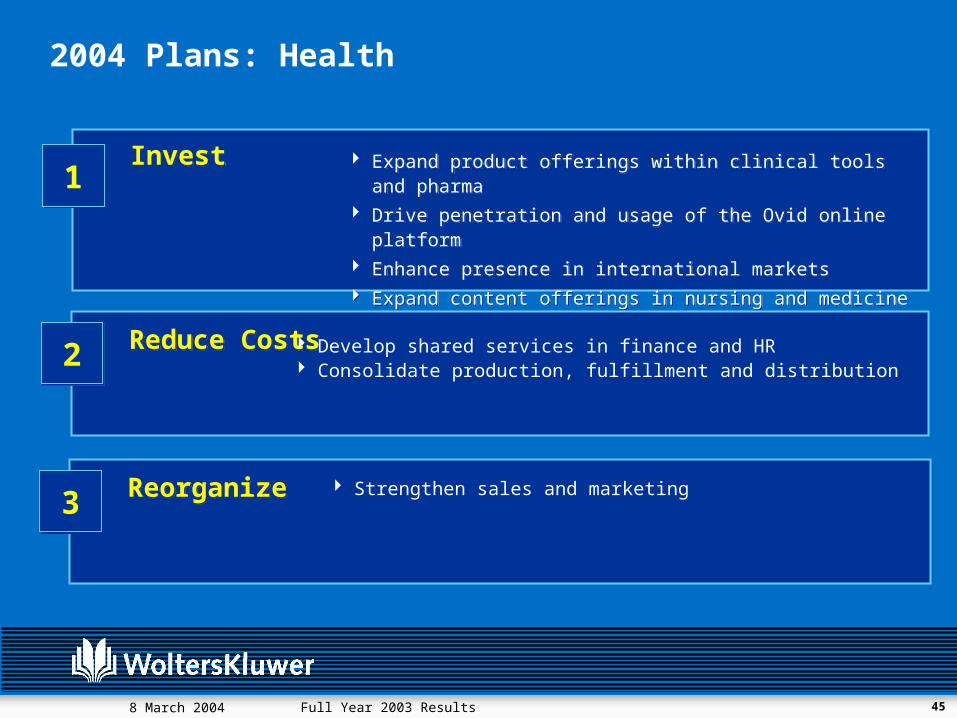
2004 Plans: Health
Reduce CostsReduce Costs22
Reorganize Reorganize Strengthen sales and marketing33
InvestInvest11
Expand product offerings within clinical tools and pharma Drive penetration and usage of the Ovid online platform Enhance presence in international markets Expand content offerings in nursing and medicine
Expand product offerings within clinical tools and pharma Drive penetration and usage of the Ovid online platform Enhance presence in international markets Expand content offerings in nursing and medicine
Develop shared services in finance and HR Consolidate production, fulfillment and distribution

468 March 2004 Full Year 2003 Results
Example Ovid
Strengthen And Expand Customer Relationships
Value Added ProductsResearchers
Workflow Integration
Value Added ProductsContent Creators
Ovid@Hand
SkolarMD@Ovid
Society Membership Module
Society Portal Creation
MS Office Research Pane
HP Medical Desktop
Pay Per View Access
Paperless Workflow
Peer Review Tracking Software
Portal Toolkit
LinkSolver
Higher Retention Rates
Broader Distribution
Increased Revenue and Profit
OvidResearcher
Article Pre-publication

478 March 2004 Full Year 2003 Results
OVID

488 March 2004 Full Year 2003 Results
Demo

498 March 2004 Full Year 2003 Results
Focused on:
• Strengthen position in corporate legal workflow tools
• Build integrated solutions for banking, brokerage and insurance
• Expand into adjacent markets with banking compliance solutions
• Outsource select technology functions
• Develop shared services for HR and Finance
• Streamline/automate service fulfillment workflows
Corporate & Financial Services Strategy

508 March 2004 Full Year 2003 Results
2004 Plans: Corporate & Financial Services
Reduce CostsReduce Costs22
Reorganize Reorganize 33
InvestInvest11
CFS Investor / Analyst Day – 27th of April, 2004 New York
Migrate to hybrid offshore development model Implement new contact management system to support Expere Drive data center consolidation
Migrate to hybrid offshore development model Implement new contact management system to support Expere Drive data center consolidation
Reorganize into customer-facing units Improve marketing and selling effectiveness Integrate new products transferred from CCH business with LIS
and BSI units
Reorganize into customer-facing units Improve marketing and selling effectiveness Integrate new products transferred from CCH business with LIS
and BSI units
Continue development of integrated compliance and practice management suite (e.g. hCue) for corporate law market
Complete development of Expere integrated loan compliance system for large bank market
Develop next generation of end to end solutions in banking, insurance and securities compliance
Integrate TyMetrix e-billing with CT representation services

518 March 2004 Full Year 2003 Results
Tax & Accounting Strategy
Focused on:
• Expand #1 market position by:
• Delivering integrated content solutions
• Continuing to build out software suites (e.g launch of Client Write Up)
• Upgrading publishing platform (TRN)
• Extend publishing content in accounting market and improve software position within State Tax Group
• Reduce the cost base by moving to shared services for support functions, streamlining technology platforms and leveraging off-shore development

528 March 2004 Full Year 2003 Results
2004 Plans: Tax & Accounting
Reduce CostsReduce Costs Outsource select technology functions Develop shared services in Finance and HR (with CLS unit) Drive data center consolidation
22
Reorganize Reorganize 33
InvestInvest11
Enhance publishing platform (TRN) throughout 2004 and build next generation delivery platform to achieve one common, global system
Improve state tax software product through enhancements and partnerships
Launch new tax and accounting content and additional software modules (e.g. business valuation)
Increase sales coverage
Complete reorganization of division Combine Aspen accounting unit with Tax Integrate tax research and publishing units

538 March 2004 Full Year 2003 Results
Legal Strategy
Focused on:
• Re-energize the core business
• Continue stabilization of Aspen
• Increase sales and marketing to support existing products
• Launch key integrated libraries (CCH and Aspen content)
• Accelerate development of electronic product offerings
• Refocus Loislaw as value leader
• Reduce cost base through shared services and combined Aspen / CCH fulfillment

548 March 2004 Full Year 2003 Results
2004 Plans: Legal
Reduce CostsReduce Costs Develop shared services in Finance and HR (with CLS unit)
Drive data center consolidation Develop integration plan for combined CCH/Aspen
fulfillment
22
Reorganize Reorganize Complete Integration of CCH and Aspen33
InvestInvest11
Increase sales and marketing to support existing products Launch key integrated libraries (CCH and Aspen content) Continue the focus of of Aspen on the legal market
Increase sales and marketing to support existing products Launch key integrated libraries (CCH and Aspen content) Continue the focus of of Aspen on the legal market

558 March 2004 Full Year 2003 Results
ProSystems
568 March 2004 Full Year 2003 Results
Demo

578 March 2004 Full Year 2003 Results
Legal, Tax & Regulatory Europe Strategy
Focused on:
• Improve operating performance in UK and Netherlands; continue implementation of restructuring plan in Belgium
• Grow online products and software tools across all core markets
• Expand the European Internet Platform
• Develop shared back-office services

588 March 2004 Full Year 2003 Results
Reduce CostsReduce Costs
Achieve SAP milestones Extend Mercury (purchasing, production efficiencies) to
other countries Develop more aggressive restructuring plan in Netherlands
22
Reorganize Reorganize Strengthen management team selectively Complete reorganization and rationalization of sales and
marketing approach in UK33
InvestInvest11 Develop and execute market expansion plans in France,
Germany, Italy Accelerate of the European Internet Platform (EIP)
implementation plan Extend product offering in software tools with tax markets
Develop and execute market expansion plans in France, Germany, Italy
Accelerate of the European Internet Platform (EIP) implementation plan
Extend product offering in software tools with tax markets
2004 Plans: Legal, Tax & Regulatory Europe

598 March 2004 Full Year 2003 Results
Education Strategy
Focused on:
• Reinforce text book publishing leadership position
• Expand market share by investing and marketing blended learning solutions (e.g. mixed media)
• Pursue growth in adjacent markets (e.g. e-learning)
• Develop shared back-office services

608 March 2004 Full Year 2003 Results
Reduce Costs Right size in country operations Achieve €15 million reduction in cost base
(2003-2006) Develop additional shared back office opportunities
Right size in country operations Achieve €15 million reduction in cost base
(2003-2006) Develop additional shared back office opportunities
22
Reorganize 33
Invest11
Drive product development, sales and marketing to increase market share as as new curriculum is adopted
Increase launch of integrated packages (books plus
ICT components) and move to value pricing Extend success with Digital Spirit and Moorhouse Black
within division
Drive product development, sales and marketing to increase market share as as new curriculum is adopted
Increase launch of integrated packages (books plus
ICT components) and move to value pricing Extend success with Digital Spirit and Moorhouse Black
within division
2004 Plans: Education
Continue to strengthen sales and marketing Continue to strengthen sales and marketing

618 March 2004 Full Year 2003 Results
Revenue growth*
Ordinary EBITA margin(After exceptional items)
Cash conversion
Ordinary Free Cash Flow
ROIC % **
Ordinary EPS***
Key Operational Measures
Key Financial Measures
0-1%
14-15%
13-14%
85-95%
Target 2004
€ 150 -200 mln
6%
€ 0.99
3-4%
19-20%
85-90%
2007 onwards
> €300 mln
WACC
> € 1.40
Outlook - Key Performance Indicators
0%
18%
15%
109%
2003
€393 mln
7%
€ 1.18 * Excl. divestments ** After Tax *** Fully diluted WACC is currently 8% after tax At constant currencies
628 March 2004 Full Year 2003 Results
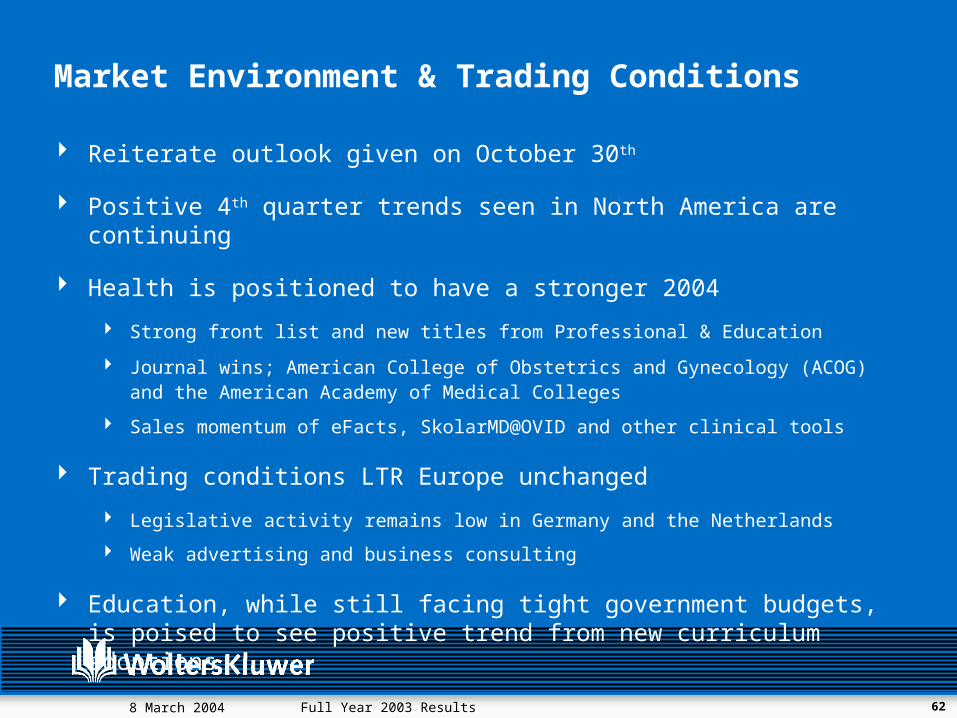
Market Environment & Trading Conditions
Reiterate outlook given on October 30th
Positive 4th quarter trends seen in North America are continuing
Health is positioned to have a stronger 2004
Strong front list and new titles from Professional & Education
Journal wins; American College of Obstetrics and Gynecology (ACOG) and the American Academy of Medical Colleges
Sales momentum of eFacts, SkolarMD@OVID and other clinical tools
Trading conditions LTR Europe unchanged
Legislative activity remains low in Germany and the Netherlands
Weak advertising and business consulting
Education, while still facing tight government budgets, is poised to see positive trend from new curriculum adoptions

SummarySummary
Progress in line with expectations
First year of three-year plan set out in October 2003
Further capitalizing on valuable market positions
Healthy free cash flow
Balance sheet strengthened to support future growth
Overall confidence; sound medium and long-term prospects

The Professional’s First ChoiceProvide information, tools and solutions to
help professionals make their most critical decisionseffectively and improve their productivity
The Professional’s First ChoiceProvide information, tools and solutions to
help professionals make their most critical decisionseffectively and improve their productivity

AppendixAppendix

Publication Annual Report – April 6
CFS Investor/Analyst Day - April 27, New York
Q1 Results – May 13, conference call
Half Year Results – August 10, presentation
Q3 Results – November 17, conference call
CalendarCalendar
678 March 2004 Full Year 2003 Results
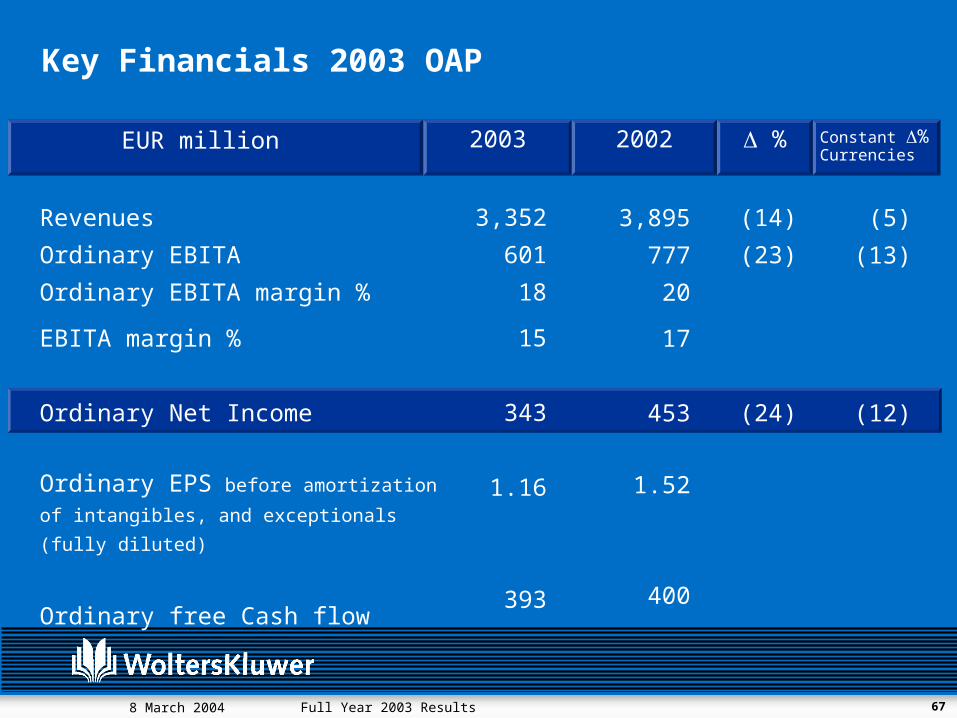
Key Financials 2003 OAP
Constant % Currencies
2003 %EUR million
Revenues
Ordinary EBITA
Ordinary EBITA margin %
EBITA margin %
Ordinary Net Income
Ordinary EPS before amortization of
intangibles, and exceptionals (fully diluted)
Ordinary free Cash flow
3,352
601
18
15
343
1.16
393
3,895
777
20
17
453
1.52
400
(5)
(13)
(12)
2002
(14)
(23)
(24)

688 March 2004 Full Year 2003 Results
2003 Results OAP
2003 %2002 Constant currencies %
EUR mln
RevenuesOrdinary EBITA- Ordinary EBITA margin %
ExceptionalsEBITA- EBITA margin %
Amortization of intangibles
Financing results
Taxation on incomeNon-consolidated and minority interestResults on divestments (after tax)
Net income
3,35260117.9
(96)50515.1
(423)(114)
(58)(5)
20
(75)
3,89577720.0
(98)67920.5
(415)(141)
(88)(10)
303
328
(14)(23)
(5)(13)

698 March 2004 Full Year 2003 Results
2003 Results OAP (cont)
Net income
Amortization of intangibles
Taxation on amortization
Results on divestments (after tax)
Exceptional items (after tax)
Ordinary Net Income
Ordinary EPS € (fully diluted)
(75)
423
(46)
(20)
61
343
1.16
328
415
(48)
(303)
61
453
1.52
2003 %2002 Constant currencies %
EUR mln
(24) (12)

708 March 2004 Full Year 2003 Results
Currency Translation Impacts Results 2003 OAP
Total organic
Acquisitions
Divestments
In constant currencies
Currency
Total
Revenues Ordinary EBITA
(2) (7)
2 1
(5) (7)
(5) (13) (12)
(9) (10) (12)
(14) (23) (24)
Ordinary Net Incomein %

718 March 2004 Full Year 2003 Results
Q4 2003 Performance OAP
LTB Europe
LTB North America
Ord. EBITA margin %
Revenues (USD)(EUR)
Ord. EBITA (USD)(EUR)
33428311195
2
1
(57)
(19)
(1)
(4)
(56)
(22)
337339114117
33.1 33.8
Million TotalCurrencyAcquisition/DivestmentOrganicQ402Q403
Change (mln)
Revenues (EUR) Ord. EBITA (EUR)Ord. EBITA margin %
37885
22.6
37791
24.2
(10)(7)
17 2
(6)(1)
1(6)
Million TotalCurrencyAcquisition/DivestmentOrganicQ402Q403
Change (mln)

728 March 2004 Full Year 2003 Results
LTB Asia Pacific
Health
Revenues (AUD)(EUR)
Ord. EBITA (AUD)(EUR)
Ord. EBITA margin %
2917
64
21.4
-
-
-
-
1
1
1
1
2916
53
16.4
Million TotalCurrencyAcquisition/DivestmentOrganicQ402Q403
Change (mln)
Revenues (USD)(EUR)
Ord. EBITA (USD)(EUR)
Ord. EBITA margin %
1951644438
22.5
-
-
(34)
(8)
-
4
(34)
(4)
1971984142
20.7
Million TotalCurrencyAcquisition/DivestmentOrganicQ402Q403
Change (mln)
Q4 2003 Performance OAP

738 March 2004 Full Year 2003 Results
Education
Non-Core
Revenues (EUR) Ord. EBITA (EUR)Ord. EBITA margin %
47(1)(2)
46(3)(7)
(2)2
41
(1)(1)
12
Million TotalCurrencyAcquisition/DivestmentOrganicQ402Q403
Change (mln)
Revenues (EUR) Ord. EBITA (EUR)Ord. EBITA margin %
3313
38.8
8523
27.3
(4)3
(48)(13)
--
(52)(10)
Million TotalCurrencyAcquisition/DivestmentOrganicQ402Q403
Change (mln)
Q4 2003 Performance OAP

748 March 2004 Full Year 2003 Results
Performance 2003 OAP
LTB Europe
LTB North America
Revenues (EUR) Ord. EBITA (EUR)Ord. EBITA margin %
1,27121516.9
1,25823418.6
(21)(23)
58 8
(24)(4)
13(19)
Million TotalCurrencyAcquisition/DivestmentOrganic20022003
Change (mln)
Ord. EBITA margin %
Revenues (USD)(EUR)
Ord. EBITA (USD)(EUR)
1,123993282249
20
2
(197)
(55)
(44)
(24)
(221)
(77)
1,1471,214
308326
25.1 26.8
Million TotalCurrencyAcquisition/DivestmentOrganic20022003
Change (mln)

758 March 2004 Full Year 2003 Results
LTB Asia Pacific
Health
Performance 2003 OAP
Revenues (AUD)(EUR)
Ord. EBITA (AUD)(EUR)
Ord. EBITA margin %
117671710
14.8
3
-
(1)
-
-
1
2
1
1136515
913.5
Million TotalCurrencyAcquisition/DivestmentOrganic20022003
Change (mln)
Revenues (USD)(EUR)
Ord. EBITA (USD)(EUR)
Ord. EBITA margin %
71363011710316.4
3
-
(124)
(21)
2
(7)
(119)
(28)
70875012313117.4
Million TotalCurrencyAcquisition/DivestmentOrganic20022003
Change (mln)

768 March 2004 Full Year 2003 Results
Education
Non-Core
Performance 2003 OAP
Revenues (EUR) Ord. EBITA (EUR)Ord. EBITA margin %
29156
19.2
30056
18.7
(10)-
51
(4)(1)
(9)0
Million TotalCurrencyAcquisition/DivestmentOrganic20022003
Change (mln)
Revenues (EUR) Ord. EBITA (EUR)Ord. EBITA margin %
10011
10.9
30958
18.9
(14)2
(193)(49)
(2)-
(209)(47)
Million TotalCurrencyAcquisition/DivestmentOrganic20022003
Change (mln)

778 March 2004 Full Year 2003 Results
2%6%
10%13% 13%
20%
18%
25%
16%
16%
17%
17%
1999 2000 2001 2002 2003 2006E
Internet Other Electronic
Electronic Revenues 31% of Total
18%
22%
27%
30%
45%
31%

788 March 2004 Full Year 2003 Results
Electronic Revenues
Internet/ On-line
CD-ROM
Electronic
65
293
358
5
23
28
64
254
318
5
20
25
LTB Europe (EUR mln) 2003 %2002%
Internet/On-line
CD-ROM
Electronic
245
271
516
22
24
46
227
279
506
20
24
44
LTB NA (USD mln) 2003 %2002%

798 March 2004 Full Year 2003 Results
Electronic Revenues
Internet/On-line
CD-ROM
Electronic
14
19
33
12
16
28
9
26
35
8
23
31
LTB AsiaPacific(AUDmln) 2003 %2002%
Internet/On-line
CD-ROM
Electronic
157
54
211
22
8
30
138
77
215
20
11
31
Health (USD mln) 2003 %2002%
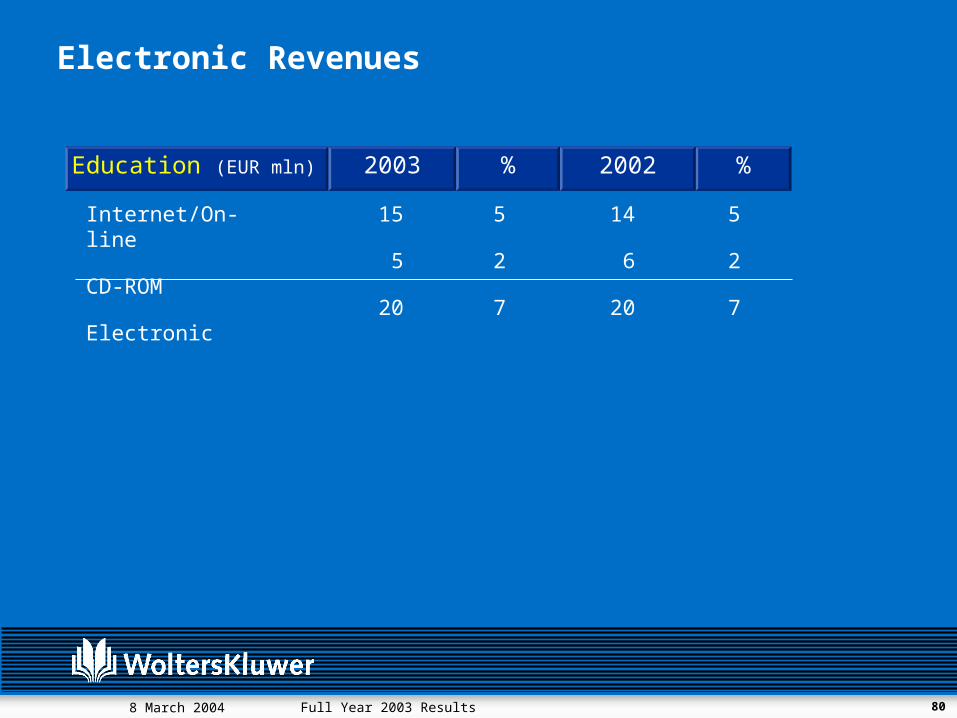
808 March 2004 Full Year 2003 Results
Electronic Revenues
Internet/On-line
CD-ROM
Electronic
15
5
20
5
2
7
14
6
20
5
2
7
Education (EUR mln) 2003 %2002%

818 March 2004 Full Year 2003 Results
Key Performance Indicators
Revenue growthGrowth in revenues over a period with respect to the previous comparable period (includes impact of organic growth, acquisitions and divestments and currency movements, unless specifically denominated “in constant currencies”)
Ordinary EBITA EBITA before exceptional items such as results on divestments and exceptional reorganization provisions
Ordinary EBITA marginOrdinary EBITA as a % of revenues
Cash conversionCash flow from operations less net expenditure on fixed assets divided by Ordinary EBITA
Free cash flowCash flow from operating activities, less the net expenditure on fixed assets and the release/appropriation of acquisition provisions
ROIC (Return on Invested Capital)Full year Ordinary EBITA after estimated allocated tax, divided by average invested capital, defined as capital employed adjusted for non-operating items, exceptional items, cash, cumulative goodwill and publishing rights amortization and goodwill charged to equity
Ordinary EPS fully dilutedOrdinary net income plus interest adjustment divided by the fully diluted weighted average number of shares