wmo statement on the status of the global climate in 2011
TRANSCRIPT

WMO statement on the status of the
global climate in 2011
WMO-No. 1085
WMO in collaboration with Members issues since 1993 annual statements on the status of the global climate. This publication was issued in collaboration with the Hadley Centre of the UK Meteorological Office, United Kingdom of Great Britain and Northern Ireland; the Climatic Research Unit (CRU), University of East Anglia, United Kingdom; the Climate Prediction Center (CPC), the National Climatic Data Center (NCDC), the National Environmental Satellite, Data, and Information Service (NESDIS), the National Hurricane Center (NHC) and the National Weather Service (NWS) of the National Oceanic and Atmospheric Administration (NOAA), United States of America; the Goddard Institute for Space Studies (GISS) operated by the National Aeronautics and Space Administration (NASA), United States; the National Snow and Ice Data Center (NSIDC), United States; the European Centre for Medium-Range Weather Forecasts (ECMWF), United Kingdom; the Global Precipitation Climatology Centre (GPCC), Germany; and the Dartmouth Flood Observatory, United States. Other contributors are the National Meteorological and Hydrological Services or equivalent climate institutions of Argentina, Armenia, Australia, Austria, Belarus, Belgium, Brazil, Bulgaria, Burkina Faso, Canada, China, Colombia, Croatia, Cyprus, Czech Republic, Denmark, Estonia, Fiji, Finland, France, Georgia, Germany, Greece, Hungary, Iceland, India, Indonesia, Ireland, Israel, Italy, Japan, Jordan, Kenya, Latvia, Lebanon, Lithuania, Luxembourg, Malaysia, Mauritius, Mexico, Montenegro, Morocco, Namibia, Netherlands, New Zealand, Norway, Pakistan, Panama, Poland, Portugal, Republic of Korea, Republic of Moldova, Romania, Russian Federation, Serbia, Singapore, Slovakia, Slovenia, South Africa, Spain, Sweden, Switzerland, Thailand, the former Yugoslav Republic of Macedonia, Tunisia, Turkey, Ukraine, United Kingdom, United Republic of Tanzania, United States, and Venezuela (Bolivarian Republic of). The WMO Regional Association VI (Europe) Regional Climate Centre on Climate Monitoring, the African Centre of Meteorological Applications for Development (ACMAD, Niamey), the International Research Centre on El Niño (CIIFEN, Guayaquil, Ecuador), the Intergovernmental Authority on Development (IGAD) Climate Prediction and Applications Centre (ICPAC, Nairobi), the Global Atmosphere Watch (GAW) and the World Climate Research Programme (WCRP) also contributed.
WMO-No. 1085
© World Meteorological Organization, 2012
The right of publication in print, electronic and any other form and in any language is reserved by WMO. Short extracts from WMO publications may be reproduced without authorization, provided that the complete source is clearly indicated. Editorial correspondence and requests to publish, reproduce or translate this publication in part or in whole should be addressed to:
Chair, Publications BoardWorld Meteorological Organization (WMO)7 bis, avenue de la Paix Tel.: +41 (0) 22 730 84 03P.O. Box 2300 Fax: +41 (0) 22 730 80 40CH-1211 Geneva 2, Switzerland E-mail: [email protected]
ISBN 978-92-63-11085-5
NOTE
The designations employed in WMO publications and the presentation of material in this publication do not imply the expression of any opinion whatsoever on the part of the Secretariat of WMO concerning the legal status of any country, territory, city or area, or of its authorities, or concerning the delimitation of its frontiers or boundaries.
Opinions expressed in WMO publications are those of the authors and do not necessarily reflect those of WMO. The mention of specific companies or products does not imply that they are endorsed or recommended by WMO in preference to others of a similar nature which are not mentioned or advertised.
Cover: A drop more. Illustration by Diana Carolina Hinojosa Campana, 15 years old, Ecuador

1
ForewordThe annual “WMO Statement on the Status of the Global Climate” series has continued to gain in popularity since its initiation in 1993 by the World Meteorological Organization, through its Commission for Climatology, and in cooperation with its 189 Members. The series stands today as an internationally rec-ognized authoritative source of information for the scientific community, the media and the public at large. The present WMO Statement on the Status of the Global Climate in 2011 is the latest addition to this successful series.
Although global mean surface temperatures in 2011 did not reach the record-setting levels of 2010, they were nevertheless the highest observed in a La Niña year. A number of climate extremes, in particular precipitation extremes, were recorded around the world. Many of the extremes associated with one of the stron-gest La Niña events of the past 60 years had major impacts worldwide. Significant flood-ing was recorded in many places, the most severe in South-East Asia, which caused about 1 000 deaths, while a major drought in East Africa led to a humanitarian disaster. Arctic sea ice continued its declining trend with an extent falling to near-record-low levels. Despite below-average global tropical cyclone activ-ity, the United States of America experienced one of its most destructive tornado seasons on record.
The year 2011 will be remembered as the year in which the Sixteenth World Meteorological Congress focused on the launching of the implementation of the Global Framework for Climate Services. This initiative opens a new era in helping nations to access improved climate data and services, particularly the most climate-vulnerable countries.
I wish to express the appreciation of WMO to all the Centres and the National Meteorological and Hydrological Services of its 189 Members that collaborated with WMO and contributed to this key publication. As with the previous editions, I would like to underscore the importance of your feedback. WMO looks forward to your comments on the WMO Statement on the Status of the Global Climate in 2011 and to your welcome suggestions for its further improvement.
(M. Jarraud)
Secretary-General

2
The year 2011 was a year of climate extremes around the world. Precipitation extremes, many of them associated with one of the strongest La Niña events of the past 60 years, had major impacts on the world. Significant flooding occurred in many places throughout the world, while major droughts affected parts of East Africa and North America. Global mean temperatures in 2011 did not reach the record-setting levels of 2010, but were still the highest observed in a La Niña year, and Arctic sea-ice extent fell to near-record-low levels. Global tropical cyclone activity was below average, but the United States had one of its most destructive tornado seasons on record.
Global temperatures in 2011
Temperatures averaged over the globe in 2011 were not as warm as the record-setting values seen in 2010 but were nevertheless well above the long-term average. Globally averaged temperatures in 2011 were estimated to be 0.40°C ± 0.09°C above the 1961–1990 annual average of 14°C. This makes 2011 nominally the eleventh warmest year on record in records dating back to 1880. The 2011 nominal value of +0.40°C1 is also the warmest ever to occur in
1 The analysis is based on three indepen-dent datasets, maintained by the Hadley Centre of the Meteorological Office, UK, and the Climatic Research Unit of the University of East Anglia (Had-CRU) in the United Kingdom, the National Climatic Data Center of the National Oceanic and Atmo-spheric Administration (NCDC–NOAA) in the United States, and the Goddard Institute of Space Studies (GISS) operated by the National Aeronautics and Space Administration (NASA) in the United States. The NCDC and GISS datasets (and hence the com-bined dataset) extend back to 1880 and the HadCRU dataset extends back to 1850.
a moderate or strong La Niña year. Data from the ECMWF Interim Reanalysis (ERA) were also consistent with the trends in surface datasets.
The 2002–2011 ten-year average of 0.46°C above the 1961–1990 mean matched 2001–2010 as the world’s warmest ten-year period on record. This was 0.21°C warmer than the warm-est ten-year period of the twentieth century, 1991–2000. In turn, 1991–2000 was clearly warmer than previous decades, consistent with a long-term warming trend.
Major large-scale influences on the global climate in 2011
The year began with a strong La Niña event established in the Pacific. This event, which began in the second half of 2010, was near peak intensity at the start of the year with sea sur-face temperatures widely 1.5°C to 2°C below average in the central and eastern equatorial Pacific (the Niño 3.4 index was −1.64°C in January). The 2010–2011 La Niña event ranked as one of the strongest of the past 60 years. While the sea surface temperature anomalies at the event’s peak (monthly Niño 3.4 index of −1.68°C in October) were slightly weaker than those at the peak of the 2007–2008 event (−1.89°C), atmospheric indicators of the event were at record or near-record levels. Positive anomalies in early 2011 of outgoing long-wave radiation, which is an indicator of cloudiness, near 180° longitude and of trade winds in the east-central Pacific were both at the high-est levels since consistent records of those indicators began in the 1970s. The six-month Southern Oscillation Index of +22 for the period November 2010–April 2011 was the highest such value since 1917.
Figure 1. Global surface temperature anomalies (relative to 1961–1990) for the period 1950– 2011; years that started with a moderate or strong La Niña already in place shown in blue
Figure 2. Global ranked surface temperatures for the warmest 50 years. Inset shows global ranked surface temperatures from 1880. The size of the bars indicates the 95 per cent confidence limits associated with each year. Values are simple area-weighted averages for the whole year. (Source: Met Office Hadley Centre, UK, and Climatic Research Unit, University of East Anglia, United Kingdom)
10 20 30 40 50Rank of hottest years to coldest
–0.2
0.0
0.2
0.4
0.6
Tem
per
atu
re d
iffe
ren
ce (
°C)
fro
m 1
961–
1990
ave
rag
e
2010
2005
1998
2003
2002
2009
2006
2007
2004
2001
2011
1997
2008
1995
1999
2000
1990
1991
1988
1987
1983
1996
1994
1981
1989
1980
1993
1944
1992
1973
1977
1986
1979 18
7819
4118
7719
8419
82 1880
1969
1963
1958
1953 19
43 1938
1940
1985
1962
1961
19452000–2010
1990–19991970–19891950–19691930–19491910–19291850–1909
0 50 100 150Rank
–0.5
0.0
0.5
0.6
0.5
0.4
0.3
0.2
0.1
0
–0.1
–0.2
–0.3
–0.4
1950 1960 1970 1980 1990 2000 2010
Other
La Niña
Tem
per
atu
re a
no
mal
y (°
C)
Year

3
The La Niña event weakened during the early months of 2011, with sea surface tempera-tures returning to the neutral range by May. It redeveloped during the northern hemisphere autumn, although with much less strength than the previous year, with Niño 3.4 near −1°C in November and December. The atmospheric response, however, was again strong, with the monthly Southern Oscillation Index reaching +23 in December and a mean of +14 for the September–December period.
After very strong negative values in late 2010, both the Arctic Oscillation and North Atlantic Oscillation shifted into positive mode by February 2011 and remained there through
1850 1900 1950 2000Year
–0.8
–0.6
–0.4
–0.2
0
0.2
0.4
0.6
Glo
bal
ave
rag
e te
mp
erat
ure
an
om
aly
(°C
) Met Office Hadley Centre and Climatic Research Unit
NOAA National Climatic Data CenterNASA Goddard Institute for Space Studies
180 120W 60W 0 60E 120E 18090S
60S
30S
0
30N
60N
90N
–10 –5 –3 –1 –0.5 –0.2 0 0.2 0.5 1 3 5 10
Figure 3 (above). Annual global average temperature anomalies (relative to 1961–1990) from 1850 to 2011 from the Hadley Centre/CRU (HadCRUT3) (black line and grey area, representing mean and 95 per cent uncertainty range), the NOAA National Climatic Data Center (red); and the NASA Goddard Institute for Space Studies (blue) (Source: Met Office Hadley Centre, UK, and Climatic Research Unit, University of East Anglia, United Kingdom)
Figure 4. Global land surface and sea surface temperature anomalies (°C) for 2011, relative to 1961–1990 (Source: Met Office Hadley Centre, UK, and Climatic Research Unit, University of East Anglia, United Kingdom)
mid-spring. They were also strongly posi-tive towards the end of the year, especially in December. The December value of the North Atlantic Oscillation (+2.25) was the highest on record for December, while the Arctic Oscillation ranked second behind December 2006 – both in marked contrast to the near-record negative values observed in December 2010. The Antarctic Oscillation, also known as the Southern Annular Mode, also behaved somewhat differently to 2010, with strongly negative values in the July–September period, although by the end of the year it was strongly positive. The Indian Ocean Dipole index, after being strongly negative in the second half of 2010, was weakly positive for most of 2011, with slightly above-average temperatures in both the west and east of the equatorial Indian Ocean.
Regional temperatures in 2011
Temperatures were above the 1961–1990 aver-age in the vast majority of the world’s land areas in 2011. While none of the 23 subregions analysed had their warmest year on record in 2011, compared with the six that did so in 2010, 22 experienced above-normal2 temperatures, the only exception being northern Australia.
As was the case in 2010, the largest departures of temperatures from normal were in the high latitudes of the northern hemisphere.
2 In this brochure, “normal” refers to the WMO standard climatological normal for the period 1961–1990. Where a different averaging period is used or the averaging period is unclear, the term “average” is used.

Maximum winds 215 km/hAfter transitioning to an extratropical storm, Katia on 12 September impacted the United Kingdom with wind gusts over 129 km/h – the highest recorded in the region since Hurricane Lili in 1996.
Maximum winds 250 km/hYasi was the most intense system at landfall on the east coast of Australia since 1918.
Maximum winds 185 km/hBingiza brought heavy rains and strong winds, affecting over 25 000 people.
Maximum winds 120 km/hCarlos brought heavy rain to parts of Western Australia, producing floods and setting new rainfall records in Darwin.
A November Bering Sea storm affected Alaska’s Bering Sea coast. This was the most powerful storm to affect the area since 1974.
Maximum winds 150 km/hBeatriz brought heavy rainsand floods to some drought-stricken areas in Mexico.
Maximum winds 100 km/hThe deadliest cyclone to hit Japan since 2004, Talas dumped as much as 1 652 mm of rain ina 72-hour period, a Japanese record.
Maximum winds 195 km/hFirst hurricane to make landfall in the United States since Hurricane Ike in 2008
Maximum winds 100 km/hWashi caused deadly flash floods and slides across the Philippines. Nearly 1 260 fatalities were reported.
During its annual maximum, the Arctic reached its second lowest sea-ice extent (behind 2006) since records began in 1979. Second lowest extent on record during its melt season, behind 2007.
ENSO began 2011 in a cold phase (La Niña), transitioning to neutral conditions by May. In August 2011, ENSO returned to a cold phase (La Niña).
Above average activity19 storms, 7 hurricanes
Below average activity11 storms, 10 hurricanes
Below average activity9 storms, 5 cyclones
Below average activity 2 storms, 1 cyclone
Below average activity11 storms, 6 cyclonesJanuary was the first January that the South-West Indian Ocean failed to record a single tropical storm since reliable records began in 1998.
Below average activity21 storms, 9 typhoons
Well below average activity 74 storms38 hurricanes/typhoons/cyclones
Crippling drought gripped much of the Horn of Africa during most of the year. Two consecutive seasons of poor rainfall contributed to one of the driest years since 1950–1951. Some locations had their driest 12-month period on record.
The country experienced its harshest winter in decades. Temperatures were below freezing for 40 consecutive days, resulting in the longest cold spell since 1945.
Monsoonal rains during the first two weeks of January were the heaviest to occur over such a short period of time on record.
Heavy rain, the heaviest in30 years, fell across the nation during January. Rare snowfall fell across
parts of New Zealand during 14–16 August.
Extremely dry conditions resulted in extreme drought, the worst to affect Cuba in 50 years.
For the first time since 1986,Japan experienced belownormal January temperatures.
The Atacama Desert, one ofthe driest places on Earth, had its heaviest snowfall in 20 years on 7 July.
Wettest year since records began in 1900; 2011 tied with 1990 and 2006 as the warmest year since national records began
> 249210−249178−209154−177
63−118119−153
Heavy spring rains, resulting in billions of dollars worth of damage and over 400 fatalities; 3 million people were affected
Torrential rains during September caused deadly floods across Sichuan, Shaanxi and Henan. The floods were the worst in Sichuan since records began in 1847.
Storms and heavy monsoonal rains from July–October contributed to the worst flooding in Thailand since 1942.
May tied with May 1974as the driest May since records began in 1918.
During August, central and southern Europe experienced one of its worst heatwaves since 2003. France, Spain and Switzerland had their warmest year since national records began.
Torrential rainfall during 26–29 Augustacross parts of south-western Nigeria led to the worst flood in 12 years.
An EF-3 tornado, the most powerful recorded in Ontario in over a decade, struck the town of Goderich on 21 August.
Germany and Belgium had their secondwarmest March–May on record. April ranked as Germany’s second warmest Aprilsince national records began in 1881.
Copious rain fell across Central America, triggering major floods and landslides during 11–20 October and affecting 1 million people.
Unusually heavy rain fell acrossAustralia during summer 2010/2011,resulting in the second wettest summersince national records began in 1901.2011 ranked as the second wettest yearon record.
Warmest spring and second warmest year (behind 2006)since national records began in 1910
Three days of heavy downpours prompted deadly floods and landslides.
June–August was the fourth warmest such period since nationalrecords began in the early 1900s.
Hurricane Katia 29 August–10 September
Cyclone Yasi26 January–3 February
Cyclone Bingiza9–18 February
Cyclone Carlos12–27 February
2011 extratropical storm6–10 November
Hurricane Beatriz19–22 June
Tropical Storm Talas23 August–5 September
Hurricane Irene20–29 August
Tropical Storm Washi13–19 December
Arctic sea-ice extent
El Niño–Southern Oscillation (ENSO)
Atlantic hurricane season
Eastern North Pacific hurricane season
South Pacific tropicalcyclone season
North Indian Oceancyclone season
South Indian Ocean cyclone season
Western North Pacifictyphoon season
Global tropical cyclone activity
East Africa
Democratic People’s Republic of Korea
Sri Lanka
South-eastern Brazil Zimbabwe
New Zealand
Cuba
Japan
Chile
Norway
Colombia
China
Thailand
Alaska
Europe
Republic of Korea
Nigeria
CanadaGermany and Belgium
Central America
United States of America
Australia
United Kingdom
Bolivia
Finland
Cyclone maximumwind legend
(km/h)
Persistent, scorching heat across the United States during the summer contributed to several southern states experiencing their warmest summer since records began in 1895.
The country had its wettest summer onrecord. Monsoonal rains in July prompteddeadly floods and landslides. On 27 July,the heaviest single-day rainfall since 1907occurred in Seoul (over 300 mm).
Third lowest sea-ice extent during its melt season. During its annual maximum, the Antarctic sea-ice extent reached its fourteenth largest sea-ice extent, tying with 1981 since records began in 1979.
Antarctic sea-ice extent
A week of heavy rain in January prompted deadly floods andlandslides. Nearly 900 fatalities were reported. This was oneof the worst natural disasters in Brazil’s history.
4
Tropical cyclone category
Hurricane, cyclone and typhoon are different terms for the same weather phenomenon that is accompanied by torrential rain and maximum sustained wind speeds (near centre) exceeding 119 kilometres per hour. Such a weather phenomenon is referred to by the following name depend-ing on the region:
• Hurricane: Western North Atlantic, central and eastern North Pacific, Caribbean Sea and Gulf of Mexico;
• Typhoon: Western North Pacific;
• Cyclone: Bay of Bengal and Arabian Sea;
• Severe tropical cyclone: Western South Pacific and South-East Indian Ocean;
• Tropical cyclone: South-West Indian Ocean.
Maximum winds 215 km/hAfter transitioning to an extratropical storm, Katia on 12 September impacted the United Kingdom with wind gusts over 129 km/h – the highest recorded in the region since Hurricane Lili in 1996.
Maximum winds 250 km/hYasi was the most intense system at landfall on the east coast of Australia since 1918.
Maximum winds 185 km/hBingiza brought heavy rains and strong winds, affecting over 25 000 people.
Maximum winds 120 km/hCarlos brought heavy rain to parts of Western Australia, producing floods and setting new rainfall records in Darwin.
A November Bering Sea storm affected Alaska’s Bering Sea coast. This was the most powerful storm to affect the area since 1974.
Maximum winds 150 km/hBeatriz brought heavy rainsand floods to some drought-stricken areas in Mexico.
Maximum winds 100 km/hThe deadliest cyclone to hit Japan since 2004, Talas dumped as much as 1 652 mm of rain ina 72-hour period, a Japanese record.
Maximum winds 195 km/hFirst hurricane to make landfall in the United States since Hurricane Ike in 2008
Maximum winds 100 km/hWashi caused deadly flash floods and slides across the Philippines. Nearly 1 260 fatalities were reported.
During its annual maximum, the Arctic reached its second lowest sea-ice extent (behind 2006) since records began in 1979. Second lowest extent on record during its melt season, behind 2007.
ENSO began 2011 in a cold phase (La Niña), transitioning to neutral conditions by May. In August 2011, ENSO returned to a cold phase (La Niña).
Above average activity19 storms, 7 hurricanes
Below average activity11 storms, 10 hurricanes
Below average activity9 storms, 5 cyclones
Below average activity 2 storms, 1 cyclone
Below average activity11 storms, 6 cyclonesJanuary was the first January that the South-West Indian Ocean failed to record a single tropical storm since reliable records began in 1998.
Below average activity21 storms, 9 typhoons
Well below average activity 74 storms38 hurricanes/typhoons/cyclones
Crippling drought gripped much of the Horn of Africa during most of the year. Two consecutive seasons of poor rainfall contributed to one of the driest years since 1950–1951. Some locations had their driest 12-month period on record.
The country experienced its harshest winter in decades. Temperatures were below freezing for 40 consecutive days, resulting in the longest cold spell since 1945.
Monsoonal rains during the first two weeks of January were the heaviest to occur over such a short period of time on record.
Heavy rain, the heaviest in30 years, fell across the nation during January. Rare snowfall fell across
parts of New Zealand during 14–16 August.
Extremely dry conditions resulted in extreme drought, the worst to affect Cuba in 50 years.
For the first time since 1986,Japan experienced belownormal January temperatures.
The Atacama Desert, one ofthe driest places on Earth, had its heaviest snowfall in 20 years on 7 July.
Wettest year since records began in 1900; 2011 tied with 1990 and 2006 as the warmest year since national records began
> 249210−249178−209154−177
63−118119−153
Heavy spring rains, resulting in billions of dollars worth of damage and over 400 fatalities; 3 million people were affected
Torrential rains during September caused deadly floods across Sichuan, Shaanxi and Henan. The floods were the worst in Sichuan since records began in 1847.
Storms and heavy monsoonal rains from July–October contributed to the worst flooding in Thailand since 1942.
May tied with May 1974as the driest May since records began in 1918.
During August, central and southern Europe experienced one of its worst heatwaves since 2003. France, Spain and Switzerland had their warmest year since national records began.
Torrential rainfall during 26–29 Augustacross parts of south-western Nigeria led to the worst flood in 12 years.
An EF-3 tornado, the most powerful recorded in Ontario in over a decade, struck the town of Goderich on 21 August.
Germany and Belgium had their secondwarmest March–May on record. April ranked as Germany’s second warmest Aprilsince national records began in 1881.
Copious rain fell across Central America, triggering major floods and landslides during 11–20 October and affecting 1 million people.
Unusually heavy rain fell acrossAustralia during summer 2010/2011,resulting in the second wettest summersince national records began in 1901.2011 ranked as the second wettest yearon record.
Warmest spring and second warmest year (behind 2006)since national records began in 1910
Three days of heavy downpours prompted deadly floods and landslides.
June–August was the fourth warmest such period since nationalrecords began in the early 1900s.
Hurricane Katia 29 August–10 September
Cyclone Yasi26 January–3 February
Cyclone Bingiza9–18 February
Cyclone Carlos12–27 February
2011 extratropical storm6–10 November
Hurricane Beatriz19–22 June
Tropical Storm Talas23 August–5 September
Hurricane Irene20–29 August
Tropical Storm Washi13–19 December
Arctic sea-ice extent
El Niño–Southern Oscillation (ENSO)
Atlantic hurricane season
Eastern North Pacific hurricane season
South Pacific tropicalcyclone season
North Indian Oceancyclone season
South Indian Ocean cyclone season
Western North Pacifictyphoon season
Global tropical cyclone activity
East Africa
Democratic People’s Republic of Korea
Sri Lanka
South-eastern Brazil Zimbabwe
New Zealand
Cuba
Japan
Chile
Norway
Colombia
China
Thailand
Alaska
Europe
Republic of Korea
Nigeria
CanadaGermany and Belgium
Central America
United States of America
Australia
United Kingdom
Bolivia
Finland
Cyclone maximumwind legend
(km/h)
Persistent, scorching heat across the United States during the summer contributed to several southern states experiencing their warmest summer since records began in 1895.
The country had its wettest summer onrecord. Monsoonal rains in July prompteddeadly floods and landslides. On 27 July,the heaviest single-day rainfall since 1907occurred in Seoul (over 300 mm).
Third lowest sea-ice extent during its melt season. During its annual maximum, the Antarctic sea-ice extent reached its fourteenth largest sea-ice extent, tying with 1981 since records began in 1979.
Antarctic sea-ice extent
A week of heavy rain in January prompted deadly floods andlandslides. Nearly 900 fatalities were reported. This was oneof the worst natural disasters in Brazil’s history.
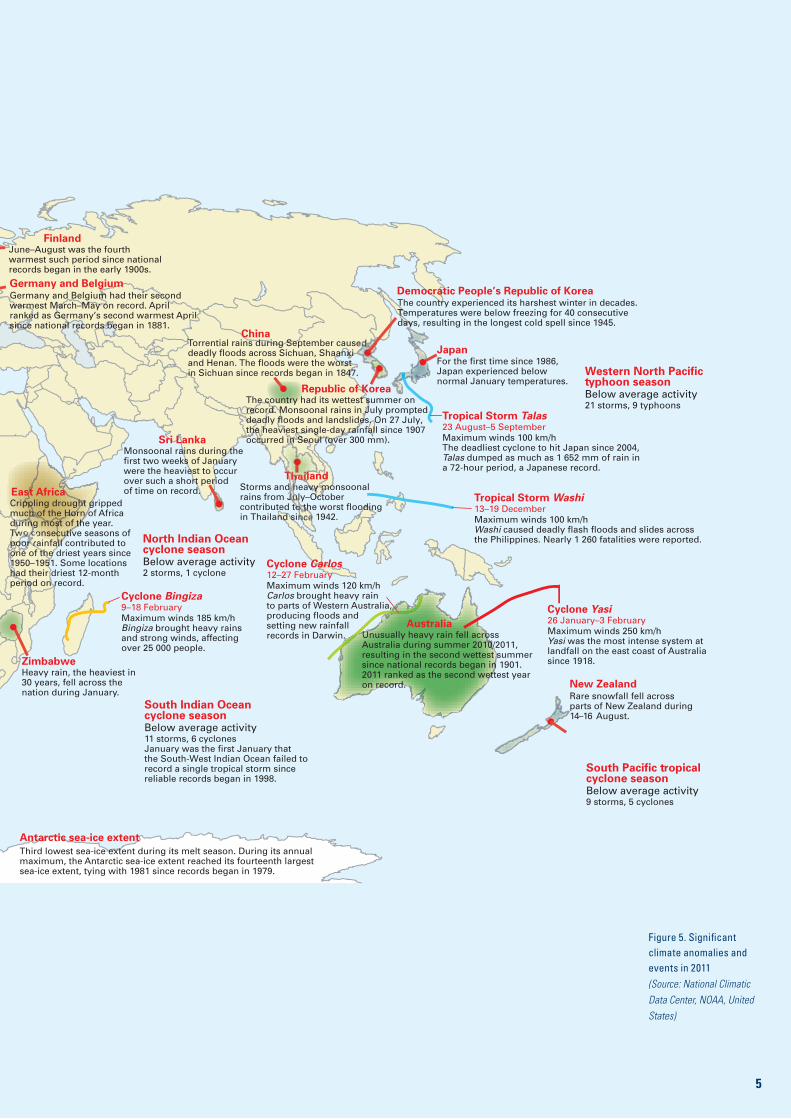
Figure 5. Significant climate anomalies and events in 2011(Source: National Climatic Data Center, NOAA, United States)
5

6
Mean annual temperatures were as much as 5°C above normal in parts of the Arctic coast of the Russian Federation and were 3°C or more above normal over substantial areas in the north of both the Russian Federation and Canada, although most of northern Canada had been even warmer in 2010. Temperatures were at least 1°C above normal over most land areas north of 55°N in both North America and Eurasia, as well as over large parts of central-western and south-western Europe, the southern United States and northern Mexico, the Sahara Desert and Arabian Peninsula, parts of southern Asia, and the south-western corner of Australia.
Only limited land areas experienced below-normal temperatures in 2011. These included most of the northern half of Australia, parts of eastern China and the Indochina Peninsula, Kazakhstan and adjacent border regions of the Russian Federation, the Caucasus region, and the far west of the United States. Ocean temperatures were below normal over large parts of the central and eastern Pacific as a result of the year’s La Niña events, but were well above normal in many subtropical oceans, especially the Indian Ocean, as well as at higher latitudes of the North Atlantic and North-West Pacific. Sea surface temperatures off the west coast of Western Australia were at record levels.
Europe and northern and central AsiaIn Europe and northern Asia, 2011 was a gener-ally warm year. It was the fourth-warmest year on record for the northern European region and ninth-warmest for the Mediterranean region. Despite a relatively mild summer with near-aver-age temperatures, France, Spain, Switzerland, Brussels and Luxembourg all reported their warmest years on record, while the United Kingdom had its second-warmest year on record despite its coolest summer since 1993. In parts of Ireland it was the coolest summer since 1962. Norway also had its equal- warm-est year on record. The year had a warm start and finish. Following generally above-average temperatures in January and February, except in north-eastern Europe where the snow depth at St Petersburg, Russian Federation, reached a record level in early February, spring was espe-cially warm in western and northern Europe, with numerous countries setting seasonal and monthly records. September, November and
December were also warmer than average, with an especially mild finish to the year in the Nordic countries and north-eastern Europe.
The Russian Federation had its third-warmest year on record, with Siberia experiencing its warmest year, while the +5°C annual anomalies reported on the Arctic coast east of Novaya Zemlya were the largest ever recorded in the country. While summer conditions in western areas were not as extreme as in 2010, heat was more consistent across the country, leading to the second-hottest summer on record for the Russian Federation as a whole. The only region to experience below-normal temperatures was an area in the south-central part of the country, and adjacent areas of Kazakhstan.
Elsewhere in Asia, temperatures were closer to normal. The Eastern and Central Asia sub-regions both had their coolest year since 1996, although both still had above-normal regional temperatures. In parts of Eastern Asia, January was particularly cold – the coldest in Japan, China and the Republic of Korea since 1986, 1977 and 1981, respectively.
South Asia and the PacificThere were significant areas of below-normal temperatures in eastern China, especially the south-east, and the Indochina Peninsula. Temperatures were above normal, although mostly cooler than those of 2010, over southern Asia as far east as the Indian subcontinent. Australia had its coolest year since 2000, with temperatures generally below normal in the north and above normal in the south. It was the coolest year on record in some parts of interior northern Australia where mean annual temperatures were up to 1.5°C below normal, whereas the south-west corner was especially warm with many locations having their warmest year on record. New Zealand temperatures were slightly above normal.
The AmericasNorth America was generally warmer than normal in 2011. Temperatures in Canada fell short of their record-breaking levels of 2010, but were still well above normal, ranking ninth warmest on record (1.4°C above normal). All seasons were warmer than normal except spring, with autumn (2.2°C above normal) rank-ing as the third-warmest and summer (1.2°C above normal) fourth-warmest on record. All

7
parts of the country were warmer than normal in 2011 except for the south-west – Alberta, Saskatchewan and southern British Columbia – where temperatures were close to normal.
In the continental United States temperatures were generally above normal in the eastern two thirds of the country and near normal in the western third; locally, they were below normal in the north-west. For the country as a whole, 2011 ranked as the twenty-second warmest year on record, 0.6°C above the average for the twentieth century. It was the warmest year on record for Delaware and ranked in the top ten for all other north-eastern states, while Texas had its second-hottest year on record. Summer was especially hot, ranking as the second hottest on record after 1936 (1.3°C above average), with records set in Texas, Louisiana, Oklahoma and New Mexico. Spring was particularly cool in the north-western states, as well as in adjacent parts of western Canada. Annual mean temperatures in Alaska were close to average.
It was a very warm year in the region compris-ing Central America, Mexico and southern Texas. The northern half of Mexico was severely affected by drought. For this region as a whole, it was the third-warmest year on record (1.01°C above normal), only missing a record because of a relatively cool November and December.
South American temperatures were slightly above normal, with annual anomalies of +0.27°C in the south and +0.29°C in the north. In Argentina it was the eleventh warmest year on record (0.34°C above normal), with a cold winter but temperatures well above normal from September onwards. Northern South America had above-average temperatures through most of the year, although in eastern Brazil temperatures were near average in the September–November period.
Africa and the Arabian Peninsula regionIt was another very warm year for most parts of Africa, although less so than in 2010, which was clearly the continent’s hottest year on record. Only southern Africa missed out to some extent, largely as a result of the wet 2010–2011 rainy season in the region; it was the region’s coolest year since 2000, although still 0.55°C above normal.
The Saharan/Arabian Peninsula region had its third-warmest year on record (1.27°C above normal), the three warmest years being the last three. North-western Africa was especially warm throughout 2011, particularly in the early months of the year; north-eastern Africa had a warm second half of the year but near-average temperatures in winter and spring. It was also a warm year in West Africa (0.75°C above normal, fifth-warmest) and East Africa (1.17°C above normal, sixth-warmest); in the case of East Africa the ten warmest individual years have been the last ten, clearly making 2002–2011 the region’s warmest ten years on record.
Major heatwaves and extreme high temperatures
There were no heatwaves in 2011 on the scale of that which occurred in the Russian Federation and eastern Europe in 2010, but significant heat still occurred in many areas.
In the United States, Oklahoma’s summer (June–August) mean temperature of 30.5°C, which was 4.0°C above the long-term aver-age, was the highest ever recorded for any American state, with Texas also breaking the previous record. The heat was marked by its consistency rather than its extreme intensity; relatively few all-time record highs were broken, but many records were set for the greatest number of days of 37.8°C (100°F) or above. Dallas had 40 consecutive days of 37.8°C or above in July and August, nar-rowly missing the record of 42 days set in 1980. At times the extreme heat spread to the eastern United States, with Newark (42.2°C) and Washington–Dulles Airport (40.6°C) both setting all-time records on 22 July.
Extreme heat affected the Caucasus region and parts of the Middle East in late July. A national record of 43.7°C was set at Meghri, Armenia, on 31 July, while several station records were set in Azerbaijan. There were numerous temperatures above 50°C in the Islamic Republic of Iran, Iraq and Kuwait in late July and early August, including 53.3°C at Mitribah, Kuwait, on 3 August and 52.6°C at Omidieh, Islamic Republic of Iran, on 27 July.
While most of western and central Europe had a relatively cool summer, abnormal heat

8
occurred in both the spring and autumn. Numerous sites in the region set records in April for the earliest dates on which tempera-tures over 25°C or 30°C had occurred, while a late-season heatwave saw national records set for October in the United Kingdom, Denmark and Slovakia. Two notable temperatures in Spain were 37.4°C at Murcia on 9 April and 36.5°C at Jerez de la Frontera on 12 October, respectively the highest temperatures ever recorded in mainland Spain so early and so late in the year.
Two notable southern hemisphere observa-tions occurred in February. Timaru reached 41.3°C on 6 February, the highest temperature in New Zealand since 1973, and Puerto Deseado (47.73°S) recorded 40.1°C on 11 February, the furthest south that a temperature of 40°C has ever occurred in Argentina. Shortly afterwards, Mumbai, India, had its hottest day on record with 41.6°C on 16 March. At the end of the year, the South Pole had its highest temperature on record, reaching −12.3°C on 25 December.
Snow and extreme cold
There were three exceptional snow events in the southern hemisphere during the winter. In mid-August, New Zealand had its most significant low-level snowfalls since 1976. Snow was lying to sea level over large parts of the South Island. Snow also covered many suburbs of Wellington, although not in the city centre itself, while flurries were observed in Auckland. Auckland Airport and Rotorua both had their coldest day on record on 15 August, with a daily maximum temperature of 8.1°C and 5.7°C, respectively. The event was prolonged over several days and caused major disrup-tions to transport and deliveries. Unusually heavy snowfalls also occurred in eastern South Africa on 25–26 July, and in elevated parts of the Atacama region in Chile in early July.
Abnormally cold weather affected the south-ern United States and northern Mexico on a number of occasions early in the year. The most significant events were in early February. Ciudad Juarez, Mexico, recorded a tempera-ture of −18°C on 4 February, the coldest in the city since at least 1950, and Nowata set a state record for Oklahoma with −35°C on 10 February. Many parts of the northern United
States received above-average seasonal snow-fall in the 2010/2011 winter, but the year’s most notable snow was on 29–30 October when an exceptional early-season event produced between 30 and 80 cm of snow in many parts of the north-east from West Virginia to New England. New York City received a total of 7 cm on 29 October, the city’s heaviest daily October snowfall on record. The heavy wet snow, at a time of year when trees were still in full leaf, caused extensive vegetation damage and major power outages across the region; 22 deaths also were attributed to the storm.
The early weeks of the year were cold in East Asia and there were significant snowfalls in some locations. Some of the heaviest falls occurred in the east of the Republic of Korea, where Samcheok received 100 cm between 11 and 14 February. Snow also badly disrupted transport in January in parts of southern China.
Precipitation
Main featuresAccording to the United States National Climatic Data Center, globally averaged land surface precipitation was the second-highest on record in 2011, 46 mm above the 1961–1990 average, ranking only behind 2010 (52 mm above normal), but with marked contrasts between wet and dry regions. Major areas that experienced substantially above-normal rainfall included most of Australia, large parts of South-East Asia and the islands of the westernmost parts of the Pacific (Japan, the Philippines and Indonesia), southern Africa, substantial areas of Brazil, Colombia and the Bolivarian Republic of Venezuela, Pakistan and western India, the north-central and north-eastern United States, and the north-western fringe of Europe. Most of these regions experienced significant flooding at some point during the year (see section on flooding below). Major areas of below-normal rainfall included the southern United States, especially Texas, and northern Mexico, large parts of Europe away from the far north-west, and much of southern China. Despite the extreme drought there for most of the year (see section on major droughts below), heavy rains late in the year resulted in East Africa having annual totals for 2011 that were mostly close to average.

9
Europe and the United StatesBoth Europe and the United States had marked geographical contrasts in precipitation. In the United States, it was much wetter than average over most north-central and north-eastern parts of the country, and 2011 was the wet-test year on record for seven states and for numerous major cities, including Cincinnati, Detroit, Philadelphia and Newark. By contrast, it was very dry over most of the south. The dry conditions were at their most extreme in Texas, which had its second driest year on
record behind 1917, with statewide rainfall 46 per cent below average. Northern Mexico was also very dry, with the states of Durango and Aguascalientes experiencing their driest years of the post-1941 period and several other states ranking in the driest three years.
Most of the European continent had a sig-nificant annual precipitation deficit in 2011, with the driest conditions in spring and again in autumn. It was the driest spring on record in many parts of western Europe, and
Figure 6. Annual precipitation anomalies for global land areas for 2011; gridded 1.0-degree raingauge-based analysis as percentages of average focusing on the 1951–2000 base period (Source: Global Precipitation Climatology Centre, Deutscher Wetterdienst, Germany)
Figure 7. Precipitation anomalies for Europe for spring (March–May, left) and autumn (September–November, right) for 2011; gridded 1.0-degree raingauge-based analysis as percentages of average focusing on the 1951–2000 base period (Source: Global Precipitation Climatology Centre, Deutscher Wetterdienst, Germany)
120W 60W180 0 60E 120E 180
90N
60N
30N
EQ
30S
60S
90S
20 40 60 80 100 125 167 250 500
0 10E10W20W30W 20E 30E 40E 50E
80N
75N
70N
60N
50N
40N
30N
65N
55N
45N
35N
20 40 60 80 100 125 167 250 500
0 10E10W20W30W 20E 30E 40E 50E
80N
75N
70N
60N
50N
40N
30N
65N
55N
45N
35N
20 40 60 80 100 125 167 250 500

10
national records were set in France and the Netherlands. After wetter conditions during the summer, especially in the north, it became very dry again during autumn. November was exceptionally dry across central Europe; many stations had no precipitation for the month, and Germany, Austria, Slovakia and Hungary all had their driest calendar month on record, as did the Prague Observatory (with more than 200 years of data). The dry conditions broke down in December with widespread above-average precipitation in western and central Europe. The most extreme dry anomalies for the year were centred in two regions. It was the driest year on record in parts of western France and the English Midlands, and the driest year since 1921 in many other parts of western Europe. Records were also set in a large part of central and south-eastern Europe, including Slovakia, where Malé Kosihy with 262 mm had the driest year ever at a Slovakian station, Hungary, Croatia, Montenegro and Slovenia. Some stations in Croatia and Montenegro received less than half their average annual precipitation. The contrast with 2010 was striking in the latter region, where Hungary followed its wettest year on record in 2010
with its second-driest in 2011 and Hurbanovo in Slovakia followed a record wet year with a record dry one; conversely, it was the second dry year in succession in much of southern and eastern England, resulting in substantial long-term moisture deficits.
In contrast to most of the continent, it was a very wet year on the north-western fringe of Europe. The contrast was especially striking in the United Kingdom, where Scotland had its wettest year on record, only a few hundred kilometres from where record low annual rain-falls were being set in central England. It was also the wettest year on record for Norway, Tórshavn (Faroes), and for parts of northern and southern Sweden. During summer the wet conditions extended southwards; the Netherlands had its wettest summer on record, Denmark its second-wettest, and record sum-mer rainfalls also occurred at numerous places in the northern half of Germany. There were also localized but extremely heavy rains in late October and November at various locations around the Mediterranean (see section on flooding below).
South Asia and the PacificIt was a very wet year over much of South-East Asia, contributing to disastrous flooding in several countries in the region, especially Thailand and Cambodia (see section on flood-ing below). Thailand had its wettest year on record with nationally averaged rainfall 24 per cent above normal. Most of Australia was also very wet, with especially heavy rains in the first three months of the year associated with the strong La Niña event. It was the country’s second wettest year on record (52 per cent above normal) and the wettest year on record for the state of Western Australia, while 2010–2011 was Australia’s wettest two-year period on record. Further west, the picture for rainfall in South Asia was mixed, with monsoon rainfall well above average in Pakistan and western India, but well below average in north-east India and Bangladesh. Monsoon season rainfall was the fifth-highest on record (72 per cent above average) for Pakistan but near average (1 per cent below average) for India.
Conditions were drier than average in 2011 over large parts of southern China. Severe drought that had affected parts of eastern China in
Figure 8. Annual rainfall anomalies in Thailand for 2011, expressed as millimetres above or below the long-term average (Source: Thai Meteorological Department)
Max. = 1811.70Min. = –622.60
Mill
imet
res
1 8001 4001 000
800600400200100
0–100–200–400–600–800
–1 000

1111
late 2010 continued into the early months of 2011. It was especially dry in the lower Yangtze basin, where the January–May rainfall was 202 mm, 53 per cent below normal and well below the previous record of 320 mm. From June onwards the dry conditions in this region were replaced by above-average rainfall, with some flooding in places, but further south in China rainfall during the summer monsoon season was well below average. Hong Kong, China had its driest year since 1963 with an annual total of 1 477 mm, 38 per cent below average.
South America and AfricaRainfall was well above normal for the second successive year in the north-west of South America, with parts of Colombia receiving more than double their normal annual rain-fall, and much of the Bolivarian Republic of Venezuela also much wetter than average. Many parts of Brazil, particularly in the Amazon basin, were also wetter than average, although not exceptionally so. Further south, it was a dry second half of the year in the northern half of Argentina with August–December rainfall widely 20 to 40 per cent below average, but no significant records were broken.
The 2010/2011 rainy season was wetter than average over many parts of southern Africa, especially the western half. Rainfall from January to March was two to four times the average over many parts of a region encom-passing Zimbabwe, Botswana, Namibia, Angola and northern South Africa, and flood-ing occurred on several occasions. Rainfall for the 12 months from July 2010 to June 2011 was more than double the average over north-western parts of South Africa. In the Sahel, totals during the rainy season were generally near or slightly below average, while in East Africa, extremely dry conditions that prevailed in places up until September (see section on major droughts below) were replaced by very wet conditions in the last three months of the year.
Major droughts
A humanitarian disaster in East AfricaSevere drought developed in parts of East Africa in late 2010 and continued through most of 2011. The most severely affected area encompassed the semi-arid regions of eastern and northern Kenya, western
Figure 9. Australian rainfall deciles for the period September 2010–March 2011, calculated using all available sources of data from 1900 onwards (Source: Australian Bureau of Meteorology)
Rainfall decile ranges
Highest onrecord
Lowest onrecord
Very muchabove average
Above average
Average
Below average
Very muchbelow average
10
8-9
4–7
2–3
1

12
Somalia and some southern border areas of Ethiopia.
In this region, rainfall was well below aver-age for two successive rainy seasons, the “short rains” of October–December 2010 and the “long rains” of March–May 2011. In eastern and northern Kenya, 2010–2011 was rated alongside 1983–1984 and 1999–2000 as the three most significant droughts of the last 60 years; it was also the driest 12-month period on record at some locations within the region. The 2004–2005 drought also had a large impact over the wider region but was less intense in Kenya. Rainfall for the 12 months from October 2010 to September 2011 was 50 –80 per cent below average over most of the area. The humanitarian impacts of the drought were severe, especially in Somalia and Kenya, with significant famine and large-scale displacement of the population. The United Nations Office for the Coordination of Humanitarian Affairs estimated that 13 million people required humanitarian aid.
There was a dramatic change to the pattern in early October, with heavy rains beginning in the second week of the month and continuing into December. Many parts of north-eastern and coastal Kenya had already received well in excess of their average rainfall for the full October–December season by early November.
In the north-east, Wajir received only 73 mm of rain in the 12 months from October 2010 to September 2011, 76 per cent below the long-term average of 310 mm, its driest 12-month period in the post-1950 period. However, it then received 508 mm for the three months October–December, 64 per cent above its annual average and its third-wettest October–December period on record. Although the rains late in the year provided relief in the worst-affected areas, the resultant flooding caused some crop damage and other disruption.
Drought and fires elsewhere in the world
Outside of East Africa, the most significant drought of the year was in the south-central United States and adjacent areas of northern Mexico. As noted earlier, numerous annual low rainfall records were set on both sides of the border. The most intense phase of the drought extended from October 2010 to October 2011, before generally above-average rains in November and December brought some relief. There were substantial losses to agriculture, and water shortages, in both countries. The dry conditions also contributed to many significant fires. The worst of these occurred in September near Austin, Texas, burning 13 000 hectares and destroying more than 1 600 homes. No deaths were reported.
18N
15N
12N
6S
9S
12S
9N
6N
3N
0
3S
27E 30E 33E 36E 39E 42E 51E45E 48E
600
400
180
25
5
1
140
110
90
70
50
18N
15N
12N
6S
9S
12S
9N
6N
3N
0
3S
27E 30E 33E 36E 39E 42E 51E45E 48E
600
400
180
25
5
1
140
110
90
70
50
Figure 10. Rainfall for East Africa for February–September 2011 (left) and October–December 2011 (right), as a percentage of the estimated 1983–2009 average calculated using blended station and satellite data (Source: NOAA Climate Prediction Center, United States)
13
Dry conditions affected large parts of Europe during the year, especially in the spring and autumn, once again with losses to agriculture in the worst-affected areas. Shipping on the Danube River was also disrupted due to low river levels in late autumn. The dry spring conditions produced elevated fire risk over many parts of western Europe, and there were several large fires in late April and early May, especially in Ireland and southern England. The dry conditions also contributed to a duststorm near Rostock, Germany, on 8 April, during which eight deaths occurred in a road accident.
One of the most destructive forest fires in Canadian history burned large parts of the town of Slave Lake, Alberta, in May. About 40 per cent of the buildings in the town were destroyed in the fire. This event was the sec-ond-largest insurance loss for any natural disaster in Canadian history, with total claims of about US$ 700 million.
The heavy rains that affected large parts of Australia in late 2010 and early 2011 caused abnormal vegetation growth in many arid regions of the central and western parts of the country, which then went on to fuel extensive fires during the second half of 2011. The very wet summer resulted in a very quiet summer fire season in eastern Australia, but in the west, a fire in early February on the south-eastern fringe of Perth resulted in the loss of 72 houses, the worst property damage from a fire in Western Australia since 1961. There were further destructive fires in the region in November.
Destructive flooding in many parts of the world
A major feature of 2011 was destructive flood-ing in many parts of the world, both long-lived flooding arising from major seasonal climate anomalies, and short-term or flash floods resulting from extreme events on timescales of days or hours.
BrazilIn terms of loss of life, one of the most extreme single events occurred in Brazil on 11–12 January. A flash flood caused by rain-falls that exceeded 200 mm in a few hours in mountainous terrain about 60 km north of Rio
de Janeiro caused at least 900 deaths, many of them as the result of a landslide. This was one of the worst natural disasters in Brazil’s history. Another event of comparable sever-ity, tropical cyclone Washi in the Philippines in December, is described in the section on tropical cyclone activity below.
South-East AsiaThe most significant event of the year, in terms of overall impact, was the flooding in South-East Asia. This resulted from consistently above-average rainfall through mid-year in the region centred on northern Thailand, where May–October rainfall was 35 per cent above average, and the Lao People’s Democratic Republic, rather than any individual extreme event. Major flooding developed in the Mekong and Chao Phraya basins in late September, causing long-lived inundation downstream over a period of weeks. Cambodia and parts of Viet Nam were badly affected by the Mekong River flooding, while in Thailand, large areas of Bangkok and the surrounding region were flooded from October to early December, causing major losses from property damage and disruption of industry. About 1 000 deaths across the three countries were attributed to the flooding, and the World Bank estimated total economic losses in Thailand at approxi-mately US$ 45 billion, about 70 per cent of which was in the manufacturing sector.
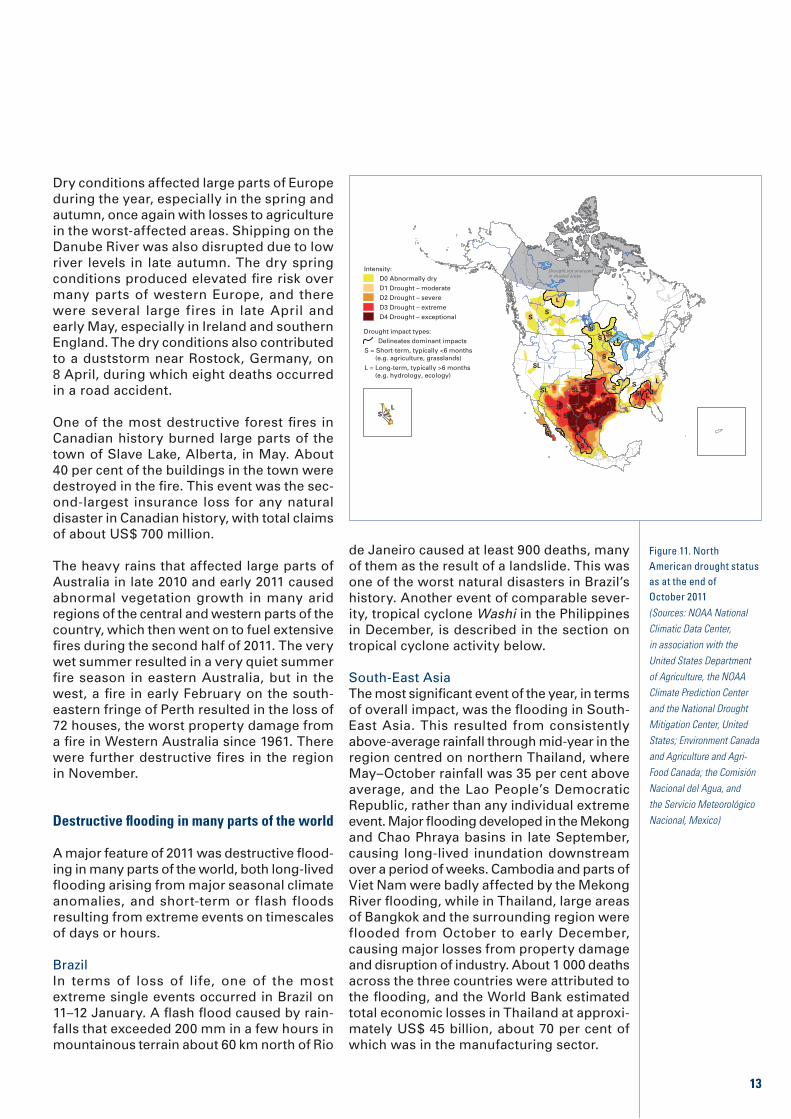
Figure 11. North American drought status as at the end of October 2011(Sources: NOAA National Climatic Data Center, in association with the United States Department of Agriculture, the NOAA Climate Prediction Center and the National Drought Mitigation Center, United States; Environment Canada and Agriculture and Agri-Food Canada; the Comisión Nacional del Agua, and the Servicio Meteorológico Nacional, Mexico)
S
SS
L
L
S
S
L
L
S
L
S
S
L
S
S SL
SL
SL
SL
SL
SLSL
Drought not analyzedin shaded areas
Intensity:
D0 Abnormally dry
D1 Drought – moderate
D2 Drought – severe
D3 Drought – extreme
D4 Drought – exceptional
S = Short-term, typically <6 months (e.g. agriculture, grasslands)
L = Long-term, typically >6 months (e.g. hydrology, ecology)
Delineates dominant impacts
Drought impact types:
14
AustraliaThere was widespread flooding in eastern Australia, especially from late December to early February. The worst-affected areas were south-east Queensland and northern Victoria, which had its wettest summer on record. The city of Brisbane had its worst floods since 1974 with many riverside properties inundated. Total losses arising from the flooding were estimated at US$ 1.3 billion in Victoria and several billion dollars in Queensland.
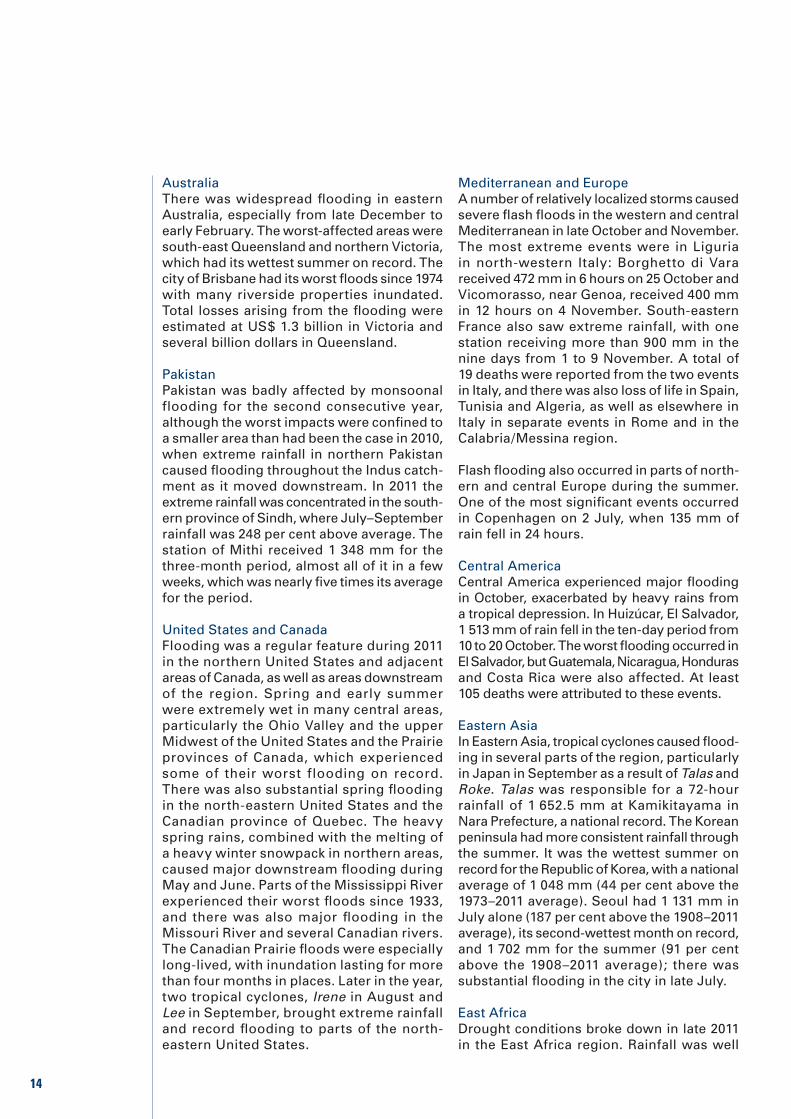
PakistanPakistan was badly affected by monsoonal flooding for the second consecutive year, although the worst impacts were confined to a smaller area than had been the case in 2010, when extreme rainfall in northern Pakistan caused flooding throughout the Indus catch-ment as it moved downstream. In 2011 the extreme rainfall was concentrated in the south-ern province of Sindh, where July–September rainfall was 248 per cent above average. The station of Mithi received 1 348 mm for the three-month period, almost all of it in a few weeks, which was nearly five times its average for the period.
United States and CanadaFlooding was a regular feature during 2011 in the northern United States and adjacent areas of Canada, as well as areas downstream of the region. Spring and early summer were extremely wet in many central areas, particularly the Ohio Valley and the upper Midwest of the United States and the Prairie provinces of Canada, which experienced some of their worst flooding on record. There was also substantial spring flooding in the north-eastern United States and the Canadian province of Quebec. The heavy spring rains, combined with the melting of a heavy winter snowpack in northern areas, caused major downstream flooding during May and June. Parts of the Mississippi River experienced their worst floods since 1933, and there was also major flooding in the Missouri River and several Canadian rivers. The Canadian Prairie floods were especially long-lived, with inundation lasting for more than four months in places. Later in the year, two tropical cyclones, Irene in August and Lee in September, brought extreme rainfall and record flooding to parts of the north-eastern United States.
Mediterranean and EuropeA number of relatively localized storms caused severe flash floods in the western and central Mediterranean in late October and November. The most extreme events were in Liguria in north-western Italy: Borghetto di Vara received 472 mm in 6 hours on 25 October and Vicomorasso, near Genoa, received 400 mm in 12 hours on 4 November. South-eastern France also saw extreme rainfall, with one station receiving more than 900 mm in the nine days from 1 to 9 November. A total of 19 deaths were reported from the two events in Italy, and there was also loss of life in Spain, Tunisia and Algeria, as well as elsewhere in Italy in separate events in Rome and in the Calabria/Messina region.
Flash flooding also occurred in parts of north-ern and central Europe during the summer. One of the most significant events occurred in Copenhagen on 2 July, when 135 mm of rain fell in 24 hours.
Central AmericaCentral America experienced major flooding in October, exacerbated by heavy rains from a tropical depression. In Huizúcar, El Salvador, 1 513 mm of rain fell in the ten-day period from 10 to 20 October. The worst flooding occurred in El Salvador, but Guatemala, Nicaragua, Honduras and Costa Rica were also affected. At least 105 deaths were attributed to these events.
Eastern AsiaIn Eastern Asia, tropical cyclones caused flood-ing in several parts of the region, particularly in Japan in September as a result of Talas and Roke. Talas was responsible for a 72-hour rainfall of 1 652.5 mm at Kamikitayama in Nara Prefecture, a national record. The Korean peninsula had more consistent rainfall through the summer. It was the wettest summer on record for the Republic of Korea, with a national average of 1 048 mm (44 per cent above the 1973–2011 average). Seoul had 1 131 mm in July alone (187 per cent above the 1908–2011 average), its second-wettest month on record, and 1 702 mm for the summer (91 per cent above the 1908–2011 average); there was substantial flooding in the city in late July.
East AfricaDrought conditions broke down in late 2011 in the East Africa region. Rainfall was well
15
above average in many areas from October to December with flooding resulting in some areas. The most damaging flooding occurred in Dar es Salaam, United Republic of Tanzania, where 260 mm of rain fell in three days from 21 to 23 December. More than 40 deaths were attributed to this flooding.
Summary of global tropical cyclone activity in 2011
Global tropical cyclone activity was again below average in 2011 after the exceptionally low activity in 2010. There were 74 tropical cyclones in 2011, including two subtropical systems. This was well below the 1981–2010 mean of 85, although it was higher than the 67 cyclones observed in 2010, which set the record for the lowest number of cyclones since the start of the modern satellite era.
The number of more intense systems was also below average; 38 systems reached hur-ricane intensity in 2011 and 22 reached major hurricane (Saffir–Simpson category 3 and above)3 intensity, compared with 1981–2010 means of 47 and 23, respectively. No cyclones reached Saffir–Simpson category 5 intensity, with the year’s most intense systems – Dora in the North-East Pacific, Ophelia in the North Atlantic, Nanmadol, Songda and Muifa in the North-West Pacific, and Yasi in the Australian region – all peaking at category 4.
For the second year in succession, an active North Atlantic stood in contrast with low global activity, with a total of 19 cyclones (compared with an average of 12), equalling 2010 as the third-most active season on record. However, many of these cyclones were relatively weak and the number of more intense systems (7 hurricanes, 4 major hurricanes) was close to normal. By contrast, the North-East Pacific had a below-average number of cyclones (11, compared with an average of 17), but 10 of the 11 cyclones in that region reached hurricane
3 The lower boundary of category 3 is defined as maximum sustained 1-minute winds of 50 m s–1 or above, 59 m s-1 or above for category 4, and 70 m s–1 or above for category 5. These equate to maximum sustained 10-minute winds (the WMO standard) of approximately 44, 52 and 62 m s–1, respectively.
intensity. The increased North Atlantic and decreased North-East Pacific activity are both characteristic of La Niña years.
Total activity was close to average in the Australian region (12 cyclones, average 11) and the South-West Pacific (7 cyclones, 3 of which also affected the Australian region. compared with an average of 5). The Australian region typically experiences increased activ-ity during La Niña years and the absence of such an increase in 2011 contributed to the low global total.
Activity was well below average in the South-West Indian (5 cyclones, average 15) and North Indian (2 cyclones, average 5) basins. The 2010–2011 seasonal total for the South-West Indian basin (4 cyclones, including one subtropical system) was the second-lowest since records began. The North-West Pacific (21 cyclones, average 26) was also less active than usual, although more active than it had been in 2010.
The year’s most intense landfall was that of Yasi in early February. It was a category 4 system when it made landfall at Mission Beach, between Townsville and Cairns, making it the most intense system at landfall on the east coast of Australia since at least 1918. Only one death was attributed to Yasi, but property damage exceeded US$ 1 billion. However, by far the worst cyclone of the year in terms of humanitarian impact was Washi, which was only of tropical storm intensity (maxi-mum sustained winds 26 m s–1) but caused extreme flooding in northern Mindanao in the Philippines from 16 to 18 December, resulting in over 1 000 deaths and the displacement of almost 300 000 people. Another cyclone to cause significant loss of life was Thane, which caused about 50 deaths on the south-east coast of India on 30 December. A further dam-aging landfall event was category 1 cyclone Irene, which struck the north-eastern United States in late August and caused in excess of US$ 7 billion in damage, mostly from flooding.
Notable extratropical storms and tornadoes
Two major storms, Joachim in mid-December and Dagmar from 25 to 28 December, caused widespread wind damage. The main impacts
16
of Joachim were felt in central Europe, while Dagmar, which also caused damaging storm surges, mostly affected the Nordic countries and the Kaliningrad and St Petersburg regions of the Russian Federation. Both storms brought wind gusts in excess of 150 km/h, with a gust of 233 km/h observed during the passage of Dagmar at the high mountain site of Juvasshøe in Norway.
In the United States, 2011 was one of the most active tornado seasons on record, with numer-ous major outbreaks, particularly in April and May, and about double the long-term average number of tornadoes. The deadliest single tornado in the United States since 1947 caused 157 deaths in Joplin, Missouri, in May. The year ranks with 2004 and 2008 as being the three most active tornado seasons on record4 and, with 553 deaths, equals the second-greatest number of deaths on record. This included six tornadoes confirmed as category 5 on the Enhanced Fujita scale, resulting in the second highest number of category 5 tornadoes, behind the seven recorded in 1974.
4 At the time of writing, the total number of tornadoes ranks third behind 2004 and 2008, but a number of possible tornadoes late in the year are still under investigation and may be added to the 2011 total if confirmed.
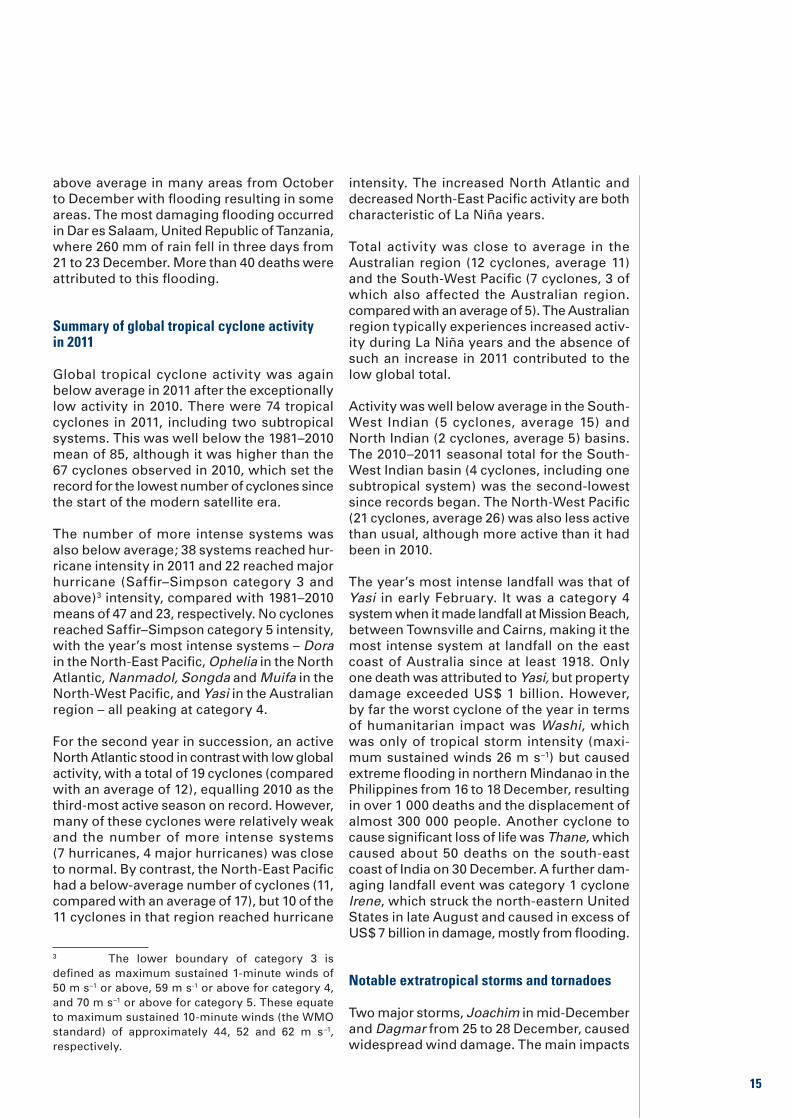
Sea ice
Arctic sea-ice extent was again well below average in 2011. After tracking at record or near-record low levels for the time of year through the first half of 2011, the seasonal minimum extent, reached on 9 September, was 4.33 million km2, 35 per cent below the 1979–2000 average, according to the United States National Snow and Ice Data Center.5 This was the second-lowest seasonal minimum on record, 0.16 million km2 above the record low set in 2007. Unlike the 2007 season, both the North-West and North-East Passages were ice-free for periods during the 2011 summer. Sea-ice volume was even further below aver-age and was estimated at a new record low of 4 200 km3, surpassing the record of 4 580 km3 set in 2010.
Antarctic sea-ice extent anomalies fluctuated during 2011, but averaged over the year as a whole sea-ice extent was close to average. Sea-ice extent was well below average in the early months of the year, largely as a result of the absence of the usual summer ice coverage in the eastern part of the Ross Sea, and briefly reached record low levels for the time of year in February but returned to near average by May. After remaining at near-normal levels until November, sea-ice extent then became well above average in December, due to the slow break-up of ice in the sector between 20°W and 20°E.
Elsewhere, as a result of the cold winter in north-eastern Europe, winter Baltic Sea ice coverage reached 300 000 km2 on 25 February, the largest area since 1987.
Polar ozone depletion in 2011
The peak Antarctic ozone hole in 2011, while larger and more intense than the long-term average, was of typical size for the last decade. Ozone depletion was assisted by generally below-average stratospheric temperatures in the Antarctic region in winter and spring.
5 Other groups using slightly different satellite resolutions and algorithms, such as the University of Bremen in Germany, determined the 2011 minimum to be slightly lower than that of 2007.
Jan Feb Mar Apr May Jun Jul Aug Sep Oct Nov Dec
Ext
ent
(mill
ion
s o
f sq
uar
e ki
lom
etre
s)
16
14
12
10
8
6
4
2
201120102009200820071979–2000 average±1 standard deviations
Month
Figure 12. Northern hemisphere sea-ice extent in 2011, compared with previous years and the 1979–2000 average(Source: National Snow and Ice Data Center, United States)
17
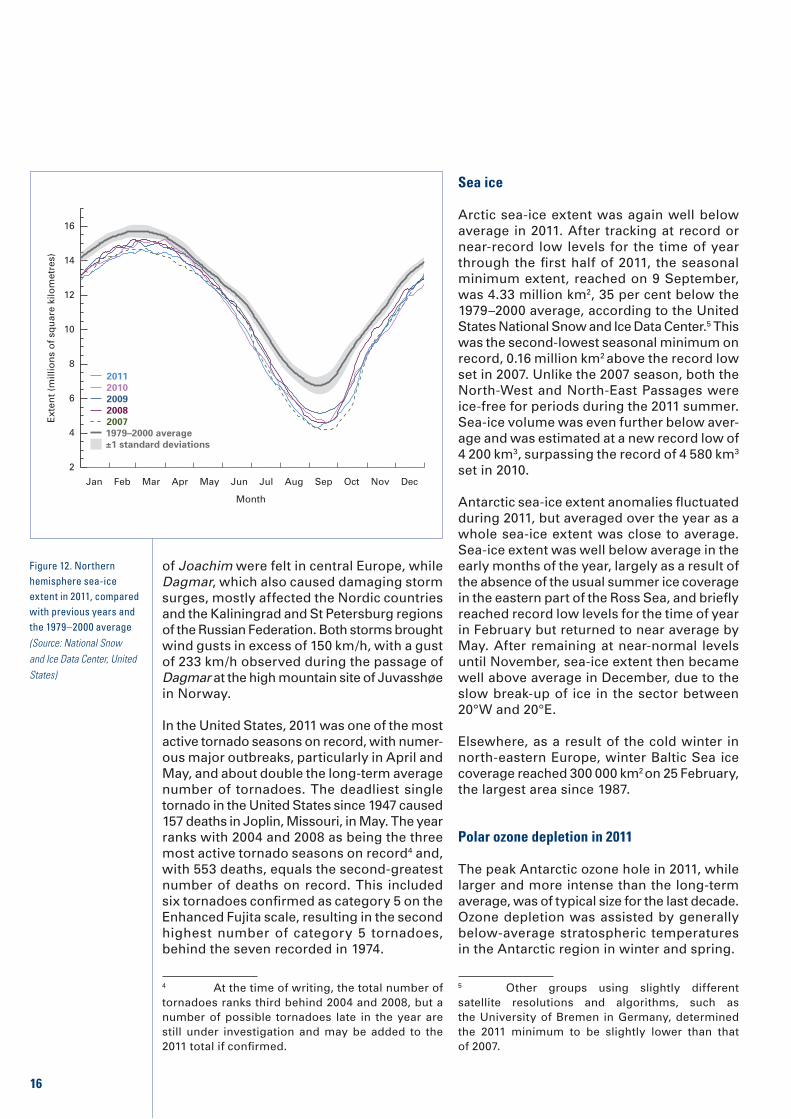
The daily maximum ozone hole for 2011 was 24.4 million km2 on 8 October.6 This is 5.8 million km2 more than the 1979–2000 aver-age but about 6 million km2 less than the record of almost 30 million km2 set in 2000. Averaged over the full period of peak ozone hole extent (7 September–13 October), the ozone hole in 2011 covered an area of 22.5 million km2, close to the post-1990 average.
The minimum daily average ozone during 2011 was reached on 8 October with 99 Dobson Units (DU). This is below the 1979–2000 aver-age of 125.4 DU and was the lowest value since 2006. The record low was observed in 1994 with 73 DU.
6 A figure of 26 million km2 was reported by other instruments; the difference arises from different assumptions made in satellite process-ing algorithms with respect to areas that are still in darkness in the early part of the season.
The most significant Arctic ozone depletion yet observed occurred in 2011, as a result of unusually prolonged low temperatures in the lower stratosphere over the region in the 2010/2011 winter. Total ozone depletion in the 18–20 km layer was about twice the previous highest observed, in 1996 and 2005, and total ozone column loss was in the vicinity of 40 per cent. About 45 per cent of the Arctic vortex had total column ozone below 275 DU at the hole’s peak, with the lowest values in late March around 220–230 DU, representing comparable ozone loss7 to that observed in the Antarctic vortex during 2010, which was a relatively weak Antarctic ozone depletion year.
7 Background ozone levels in the Arctic during spring are about 100 DU higher than those in the Antarctic, so a measurement of 220–230 DU in the Arctic represents a similar ozone loss to one of 120–130 DU in the Antarctic.
Figure 13. Daily evolution of the surface area of the Antarctic ozone hole over the course of the ozone hole season; the blue horizontal lines show the surface area of the various regions for comparison. (Source: World Data Centre for Remote Sensing of the Atmosphere, one of the Global Atmosphere Watch World Data Centres, hosted by the German Aerospace Centre. The data used to produce this graph were derived from the METOP-A/GOME-2 and ENVISAT/SCIAMACHY sensors and are the result of several algorithms.)
0
5
10
15
20
30
25
August September October November December
Ozone hole: area [106 km2]
North America
Antarctica
Europe
Australia
20072008200920102011
Major large-scale drivers of seasonal and interannual variability of the world’s climateThere are several large-scale modes of vari-ability in the world’s climate that influence conditions over large parts of the world on seasonal to interannual timescales.
El Niño–Southern Oscillation
The El Niño–Southern Oscillation (ENSO) is probably the best-known of the major global modes of interannual climate variability.
Under normal conditions, sea surface tem-peratures in the central and eastern equatorial Pacific Ocean are several degrees cooler than those in the west, associated with the effects of cold ocean currents off the west coast of South America. In a warm phase (El Niño), those central and eastern equatorial Pacific Ocean temperatures warm to above-normal levels – by up to 3°C to 4°C in the most extreme events, although 1°C to 2°C is more typical of a standard El Niño event. This results in a reduction of the west-to-east temperature gradient in the equatorial Pacific, and hence a reduction in the air pressure gradient and reduced intensity of the easterly trade winds through the tropical Pacific. In a cold phase (La Niña), the reverse happens, with the equatorial Pacific cold tongue stronger than normal, and enhanced trade winds through the tropics. Both El Niño and La Niña events typically form around mid-year and persist for 9 to 12 months until the early months of the following year.
The El Niño–Southern Oscillation influences climate in many ways over large parts of the world, including some far away from the Pacific. El Niño is associated with a high risk of drier-than-normal conditions in areas such as eastern Australia, the Indonesian region, India, southern Africa, the Caribbean and north-east Brazil. Conversely, El Niño years tend to be wetter than normal on the west coast of South America, northern Argentina and Uruguay, equatorial East Africa, the islands of the central tropical Pacific, and the southern United States. El Niño also influences tem-perature and tropical cyclone occurrence, with a marked tendency for global temperatures to be atypically warm during El Niño years.
In general the effects of La Niña are the reverse of those of El Niño, for example, an increased
risk of heavy rain and flooding in Australia, the Indian subcontinent and southern Africa, and an increased risk of drought in the southern United States. La Niña years are typically relatively cool on the global scale (see Figure 1 on page 2).
Indian Ocean Dipole
The equatorial Indian Ocean is also subject to fluctuations in sea surface temperatures, although on a less regular basis than the Pacific. The Indian Ocean Dipole (IOD) describes a mode of variability that affects the western and eastern parts of the ocean. When IOD is in its positive mode, ocean waters are warmer than average in the western equatorial Indian Ocean (off the east coast of Africa) and cooler than average in the eastern equatorial Indian Ocean, particularly to the south of the Indonesian islands of Java and Sumatra. The reverse is true when IOD is in its negative mode.
Positive IOD events are more likely to occur in El Niño years and negative IOD events in La Niña years, but there is not a one-to-one relationship. Positive IOD events have an association with below-average rainfall in large parts of Australia and western Indonesia, and above-average rainfall in East Africa; conversely, negative IOD years tend to be wet in Australia and dry in East Africa.
Arctic Oscillation/North Atlantic Oscillation
The Arctic Oscillation (AO) and North Atlantic Oscillation (NAO) are two closely related modes of variability in the atmospheric cir-culation at middle and higher latitudes of the northern hemisphere. In the positive mode, the subtropical high-pressure ridge is stronger than normal, as are areas of low pressure at higher latitudes, such as the “Icelandic” and “Aleutian” lows, resulting in enhanced west-erly circulation through the mid-latitudes. In the negative mode, the reverse is true, with a weakened subtropical ridge, weakened higher-latitude low-pressure areas and anomalous easterly flow through the mid-latitudes. As the name implies, NAO describes this mode of variability over the North Atlantic sector only; AO describes the mode over the full northern hemisphere.
18
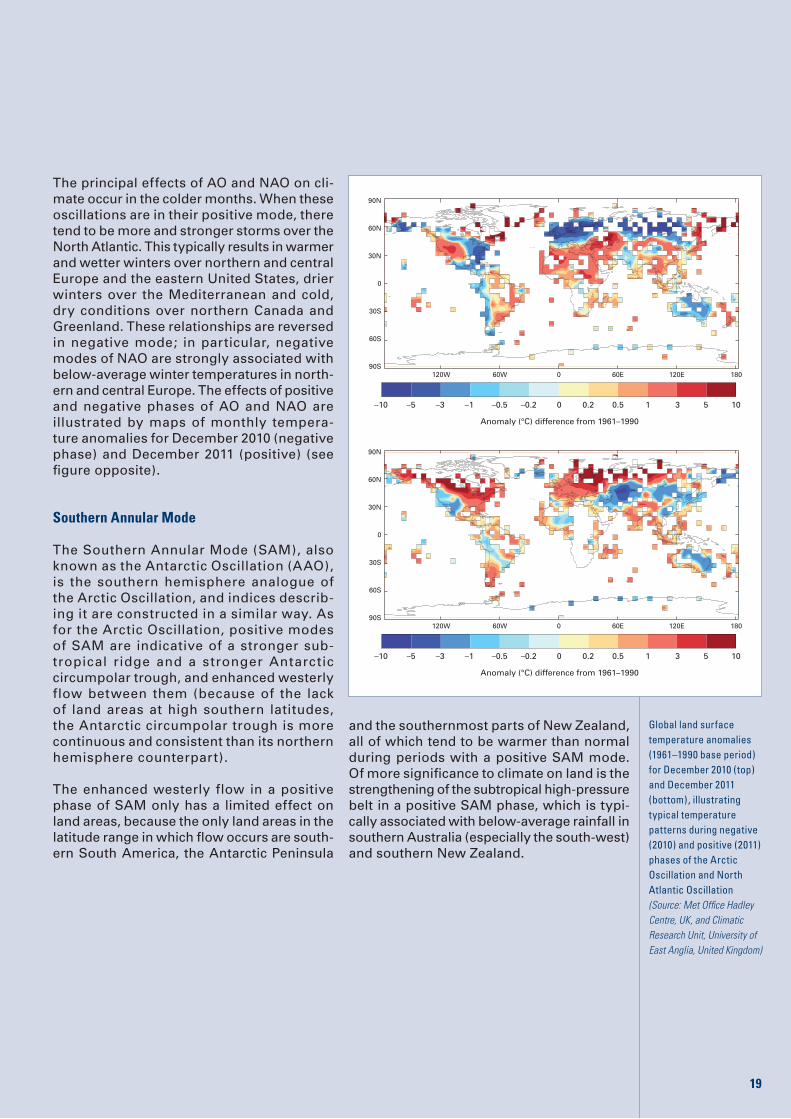
The principal effects of AO and NAO on cli-mate occur in the colder months. When these oscillations are in their positive mode, there tend to be more and stronger storms over the North Atlantic. This typically results in warmer and wetter winters over northern and central Europe and the eastern United States, drier winters over the Mediterranean and cold, dry conditions over northern Canada and Greenland. These relationships are reversed in negative mode; in particular, negative modes of NAO are strongly associated with below-average winter temperatures in north-ern and central Europe. The effects of positive and negative phases of AO and NAO are illustrated by maps of monthly tempera-ture anomalies for December 2010 (negative phase) and December 2011 (positive) (see figure opposite).
Southern Annular Mode
The Southern Annular Mode (SAM), also known as the Antarctic Oscillation (AAO), is the southern hemisphere analogue of the Arctic Oscillation, and indices describ-ing it are constructed in a similar way. As for the Arctic Oscillation, positive modes of SAM are indicative of a stronger sub-tropical ridge and a stronger Antarctic circumpolar trough, and enhanced westerly flow between them (because of the lack of land areas at high southern latitudes, the Antarctic circumpolar trough is more continuous and consistent than its northern hemisphere counterpart).
The enhanced westerly flow in a positive phase of SAM only has a limited effect on land areas, because the only land areas in the latitude range in which flow occurs are south-ern South America, the Antarctic Peninsula
and the southernmost parts of New Zealand, all of which tend to be warmer than normal during periods with a positive SAM mode. Of more significance to climate on land is the strengthening of the subtropical high-pressure belt in a positive SAM phase, which is typi-cally associated with below-average rainfall in southern Australia (especially the south-west) and southern New Zealand.
19
Global land surface temperature anomalies (1961–1990 base period) for December 2010 (top) and December 2011 (bottom), illustrating typical temperature patterns during negative (2010) and positive (2011) phases of the Arctic Oscillation and North Atlantic Oscillation(Source: Met Office Hadley Centre, UK, and Climatic Research Unit, University of East Anglia, United Kingdom)
Anomaly (°C) difference from 1961–1990
–10 –5 –3 –1 –0.5 –0.2 0 0.2 0.5 1 3 5 10
120W 60W 0 60E 120E 180
90N
60N
30N
0
30S
60S
90S
Anomaly (°C) difference from 1961–1990
–10 –5 –3 –1 –0.5 –0.2 0 0.2 0.5 1 3 5 10
120W 60W 0 60E 120E 180
90N
60N
30N
0
30S
60S
90S

The three temperature datasets used in this publication are:
• The HadCRUT3 dataset, developed by the Hadley Centre at the UK Meteorological Office and the Climatic Research Unit (CRU) at the University of East Anglia.
• A dataset produced by the National Climatic Data Center (United States), using land surface temperature data from the Global Historical Climatology Network (GHCN) and version 3b of the Extended Reconstructed Sea Surface Temperature (ERSST) dataset.
• The GISTEMP analysis produced by the Goddard Institute for Space Studies (GISS) at the National Aeronautics and Space Administration (NASA), United States.
In this publication a common base period of 1961–1990 is used for global temperature data.
The individual datasets and further background material on the data can be obtained at the respective institution web pages:
Hadley Centre: hadobs.metoffice.com
National Climatic Data Center: www.ncdc.noaa.gov
Goddard Institute for Space Studies: data.giss.nasa.gov/gistemp/
Other sources of data used in this publication include:
Climate Prediction Center, United States (El Niño/La Niña, Arctic Oscillation, North Atlantic Oscillation): www.cpc.ncep.noaa.gov
National Snow and Ice Data Center, United States (sea ice): www.nsidc.org
National Climate Centre, Australian Bureau of Meteorology (El Niño/La Niña, Indian Ocean Dipole): www.bom.gov.au/climate
Global Precipitation Climatology Centre, Deutscher Wetterdienst, Germany: gpcc.dwd.de
WMO Regional Association VI (Europe) Regional Climate Centre on Climate Monitoring, Deutscher Wetterdienst, Germany: www.dwd.de
Climatic Research Unit, University of East Anglia (temperature, precipitation, circulation indices): www.cru.uea.ac.uk
The subregions used in this publication are those defined in the IPCC Third Assessment Report. Their boundaries can be seen in various figures of the IPCC report at: www.grida.no/climate/ipcc_tar/wg1/384.htm.
Data sources and other background information

For more information, please contact:
World Meteorological Organization
Communications and Public Affairs Office
Tel.: +41 (0) 22 730 83 14 – Fax: +41 (0) 22 730 80 27
E-mail: [email protected]
7 bis, avenue de la Paix – P.O. Box 2300 – CH 1211 Geneva 2 – Switzerland
www.wmo.int P-O
BS_
1230
4