wmo statement on the status of the global climate in 2007 · the status of the global climate in...
TRANSCRIPT
WMO-No. 1031
WMO statement on the status of the
global climate in 2007
This Statement is a summary of information provided by the Met Office Hadley Centre and the Climatic Research Unit, University of East Anglia, United Kingdom, and, in the United States, by the National Climatic Data Centre of the National Oceanic and Atmospheric Administration (NOAA), the National Snow and Ice Data Center, the National Interagency Fire Center and NOAA’s National Weather Service. Other contributors are WMO Member countries: Argentina, Australia, Brazil, Canada, China, Fiji, France, Germany, Iceland, India, Japan, the Netherlands, New Zealand, Sweden and Tunisia. The African Centre of Meteorological Applications for Development (ACMAD, Niamey), the Australian Commonwealth Scientific and Industrial Research Organization (CSIRO), the International Research Centre on El Niño (CIIFEN, Guayaquil), the Global Precipitation Climatology Centre (GPCC, Offenbach), the IGAD Climate Prediction and Applications Centre (ICPAC, Nairobi), the SADC Drought Monitoring Centre (SADC DMC, Gaborone) and the World Climate Research Programme (WCRP) also contributed.
WMO-No. 1031
© World Meteorological Organization, 2008
The right of publication in print, electronic and any other form and in any language is reserved by WMO. Short extracts from WMO publications may be reproduced without authorization provided that the complete source is clearly indicated. Editorial correspondence and requests to publish, reproduce or translate this publication (articles) in part or in whole should be addressed to:
Chairperson, Publications BoardWorld Meteorological Organization (WMO)7 bis, avenue de la Paix Tel.: +41 (0) 22 730 84 03P.O. Box No. 2300 Fax: +41 (0) 22 730 80 40CH-1211 Geneva 2, Switzerland E-mail: [email protected]
ISBN 92-63-11031-1
Cover: Dancing with the clouds. Illustration by Ka-Woon Ng, 12 years old, Hong Kong, China
NOTE
The designations employed in WMO publications and the presentation of material in this publication do not imply the expression of any opinion whatsoever on the part of the Secretariat of WMO concerning the legal status of any country, territory, city or area, or of its authorities, or concerning the delimitation of its frontiers or boundaries.
Opinions expressed in WMO publications are those of the authors and do not necessarily reflect those of WMO. The mention of specific companies or products does not imply that they are endorsed or recommended by WMO in preference to others of a similar nature which are not mentioned or advertised.
Through its predecessor, the International Meteorological Organization (IMO), and since 1950 on its own account, the World Meteorological Organization (WMO) has been very active in the field of climate ever since the First International Meteorological Congress was convened in Vienna in 1873. The IMO Commission for Climatology was established in 1929 and fifty years later, in 1979, WMO organized the First World Climate Conference, in collaboration with such partners as the International Council for Science, the Intergovernmental Oceanographic Commission of the United Nations Educational, Scientific and Cultural Organization, the United Nations Environment Programme (UNEP) and the Food and Agriculture Organization of the United Nations. This historic conference would soon lead to the establishment of WMO’s own World Climate Programme and, in 1980, that of the World Climate Research Programme with the International Council for Science and later the Intergovernmental Oceanographic Commission. Furthermore, the conference would also pave the way for the establishment, in 1988, of the WMO/UNEP co-sponsored Intergovernmental Panel on Climate Change (IPCC), which recently received the 2007 Nobel Peace Prize for its efforts “to build up and dis-seminate greater knowledge about man-made climate change, and to lay the foundations for the measures that are needed to counteract such change”.
The Second World Climate Conference, organized by WMO and its partners in 1990, provided decisive momentum to the interna-tional efforts that resulted in the development of the United Nations Framework Convention on Climate Change in 1992 and the Global Climate Observing System. In the midst of these significant contributions, in 1993 WMO began to issue an annual statement on the status of the global climate, which has by now become an established source of infor-mation eagerly sought after, each year, by the scientific community and the media. The WMO Statement on the Status of the Global Climate in 2007 is the latest in this successful series.
It is relevant to recall that 2007 was a special year in many respects, for it was during 2007 that the IPCC issued the different compo-nents of its Fourth Assessment Report, which then served as a fundamental contribution to the thirteenth Conference of the Parties to the United Nations Framework Convention on Climate Change (COP-13), held in Bali, Indonesia, from 3 to 14 December 2007. In Bali, WMO actively contributed to the session and organized a successful side event, Improved decision-making for climate adaptation: providing a science basis. Furthermore, the International Polar Year 2007–2008, launched in 2007 as a WMO co-sponsored scientific venture, is also making a key contribution to our increasing understanding of the global climate system. In following suite, in May 2007 the Fifteenth World Meteorological Congress decided that in 2009 WMO would organize with partners a World Climate Conference-3, under the overall theme of climate prediction for decision-making.
I would like to stress, once more, the impor-tance of receiving feedback from Members on the relevance and content of these statements. A questionnaire circulated by WMO among recipients of the 2006 Statement revealed important messages that were used proac-tively in preparing the present issue. WMO therefore looks forward to your comments on the WMO Statement on the Status of the Global Climate in 2007, or to your suggestions for further improvement.
(M. Jarraud)Secretary-General
�
Foreword
�
Global temperatures during 2007
The analyses made by leading climate centres rank the year 2007 amongst the ten warmest
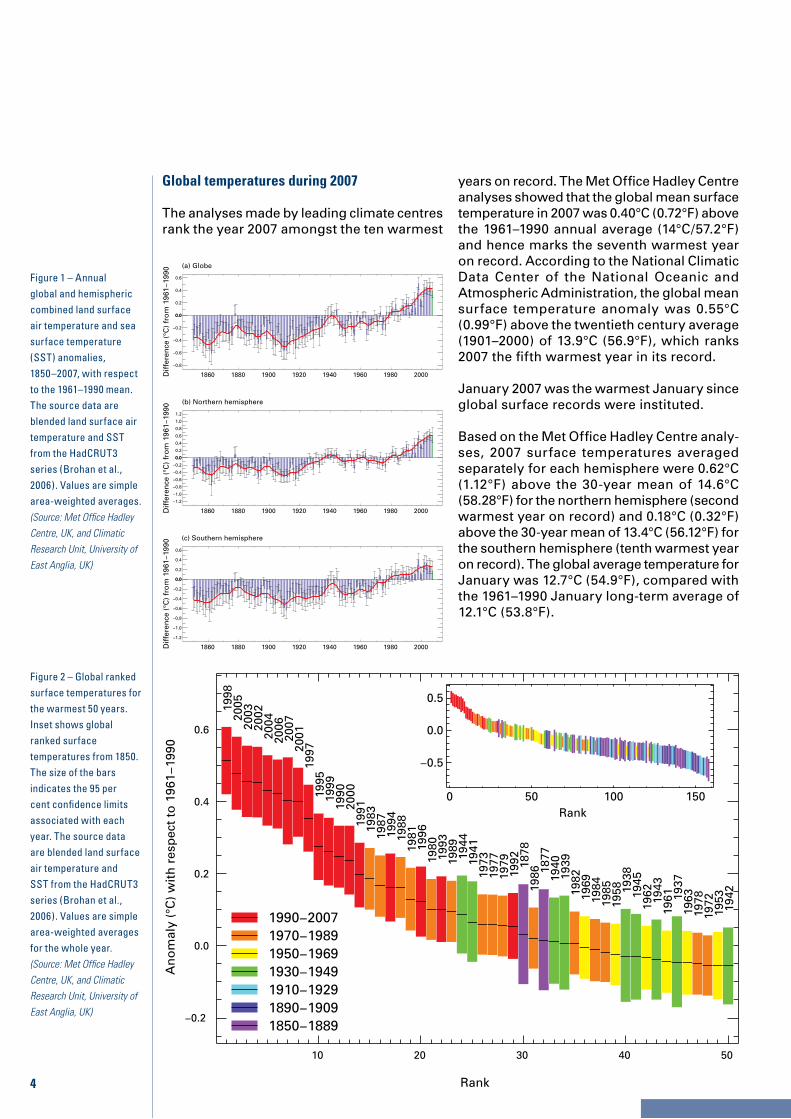
years on record. The Met Office Hadley Centre analyses showed that the global mean surface temperature in 2007 was 0.40°C (0.72°F) above the 1961–1990 annual average (14°C/57.2°F) and hence marks the seventh warmest year on record. According to the National Climatic Data Center of the National Oceanic and Atmospheric Administration, the global mean surface temperature anomaly was 0.55°C (0.99°F) above the twentieth century average (1901–2000) of 13.9°C (56.9°F), which ranks 2007 the fifth warmest year in its record.
January 2007 was the warmest January since global surface records were instituted. Based on the Met Office Hadley Centre analy-ses, 2007 surface temperatures averaged separately for each hemisphere were 0.62°C (1.12°F) above the 30-year mean of 14.6°C (58.28°F) for the northern hemisphere (second warmest year on record) and 0.18°C (0.32°F) above the 30-year mean of 13.4°C (56.12°F) for the southern hemisphere (tenth warmest year on record). The global average temperature for January was 12.7°C (54.9°F), compared with the 1961–1990 January long-term average of 12.1°C (53.8°F).
Figure 1 – Annual global and hemispheric combined land surface air temperature and sea surface temperature (SST) anomalies, 1850–2007, with respect to the 1961–1990 mean. The source data are blended land surface air temperature and SST from the HadCRUT3 series (Brohan et al., 2006). Values are simple area-weighted averages. (Source: Met Office Hadley Centre, UK, and Climatic Research Unit, University of East Anglia, UK)
Figure 2 – Global ranked surface temperatures for the warmest 50 years. Inset shows global ranked surface temperatures from 1850. The size of the bars indicates the 95 per cent confidence limits associated with each year. The source data are blended land surface air temperature and SST from the HadCRUT3 series (Brohan et al., 2006). Values are simple area-weighted averages for the whole year. (Source: Met Office Hadley Centre, UK, and Climatic Research Unit, University of East Anglia, UK)
10 20 30 40 50
Rank
−0.2
0.0
0.2
0.4
0.6
An
om
aly
(°C
) w
ith
res
pec
t to
196
1−19
90
1998
2005
2003
2002
2004
2006
2007
2001
1997
1995
1999
1990
2000
1991
1983
1987
1994
1988
1981
1996
1980
1993
1989
1944
1941
1973
1977
1979
1992 18
7819
86 1877
1940
1939
1982
1969
1984
1985
1958 19
3819
4519
62 1943
1961 19
3719
6319
7819
7219
5319
42
1990−20071970−19891950−19691930−19491910−19291890−19091850−1889
0 50 100 150Rank
−0.5
0.0
0.5
(a) Globe
1860 1880 1900 1920 1940 1960 1980 2000
−0.8
−0.6
−0.4
−0.2
0.0
0.2
0.4
0.6
0.0
(b) Northern hemisphere
1860 1880 1900 1920 1940 1960 1980 2000
−1.2
−1.0
−0.8
−0.6
−0.4
−0.2
0.0
0.2
0.4
0.6
0.8
1.0
1.2
0.0
(c) Southern hemisphere
1860 1880 1900 1920 1940 1960 1980 2000
−1.2
−1.0
−0.8
−0.6
−0.4
−0.2
0.0
0.2
0.4
0.6
0.0
Dif
fere
nce
(°C
) fr
om
196
1−19
90D
iffe
ren
ce (
°C)
fro
m 1
961−
1990
Dif
fere
nce
(°C
) fr
om
196
1−19
90
�
180 120W 60W 0 60E 120E 180
90S
60S
30S
0
30N
60N
90N
++ ++ +++
+
+
++
++
+
+
+
+ +++++
+
+
+
+
+
+
+++
++
+
++
+
+
+
+
+
++++
+
+++
+
+
++
+
+
+
+
+
+
+
+
+
++
++
++
++
+++
+
+
+
+
+
+++
+
+++
+
+++
+
++++
+
+
++++
++
++++
++
+
++++
+
+
+
+
+
+
+
+
+
+
+
++
+
+
+++
+++
+
++
− −− −− − − − −− −−−−−
−−−−−−−−−−
−−
−
− − −−−−−−−
−−
−−−−−−−−
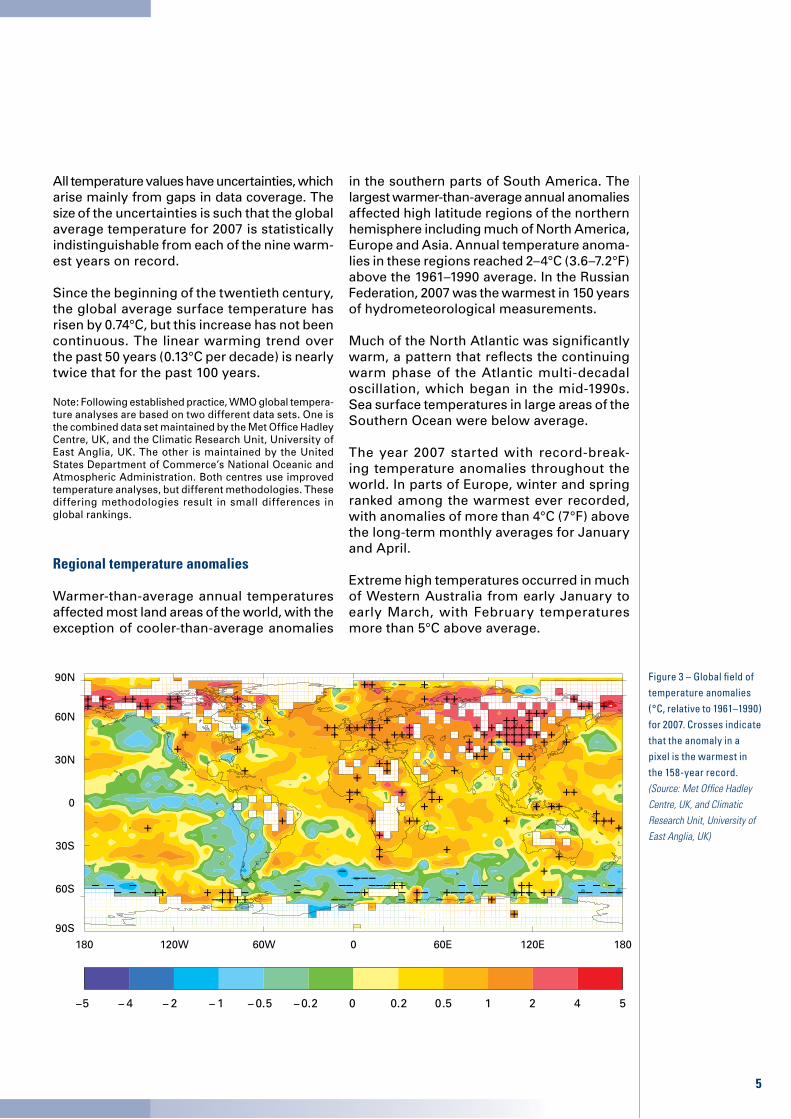
Figure 3 – Global field of temperature anomalies (°C, relative to 1961–1990) for 2007. Crosses indicate that the anomaly in a pixel is the warmest in the 158-year record. (Source: Met Office Hadley Centre, UK, and Climatic Research Unit, University of East Anglia, UK)
All temperature values have uncertainties, which arise mainly from gaps in data coverage. The size of the uncertainties is such that the global average temperature for 2007 is statistically indistinguishable from each of the nine warm-est years on record.
Since the beginning of the twentieth century, the global average surface temperature has risen by 0.74°C, but this increase has not been continuous. The linear warming trend over the past 50 years (0.13°C per decade) is nearly twice that for the past 100 years.
Note: Following established practice, WMO global tempera-ture analyses are based on two different data sets. One is the combined data set maintained by the Met Office Hadley Centre, UK, and the Climatic Research Unit, University of East Anglia, UK. The other is maintained by the United States Department of Commerce’s National Oceanic and Atmospheric Administration. Both centres use improved temperature analyses, but different methodologies. These differing methodologies result in small differences in global rankings.
Regional temperature anomalies
Warmer-than-average annual temperatures affected most land areas of the world, with the exception of cooler-than-average anomalies
in the southern parts of South America. The largest warmer-than-average annual anomalies affected high latitude regions of the northern hemisphere including much of North America, Europe and Asia. Annual temperature anoma-lies in these regions reached 2–4°C (3.6–7.2°F) above the 1961–1990 average. In the Russian Federation, 2007 was the warmest in 150 years of hydrometeorological measurements.
Much of the North Atlantic was significantly warm, a pattern that reflects the continuing warm phase of the Atlantic multi-decadal oscillation, which began in the mid-1990s. Sea surface temperatures in large areas of the Southern Ocean were below average.
The year 2007 started with record-break-ing temperature anomalies throughout the world. In parts of Europe, winter and spring ranked among the warmest ever recorded, with anomalies of more than 4°C (7°F) above the long-term monthly averages for January and April.
Extreme high temperatures occurred in much of Western Australia from early January to early March, with February temperatures more than 5°C above average.
�
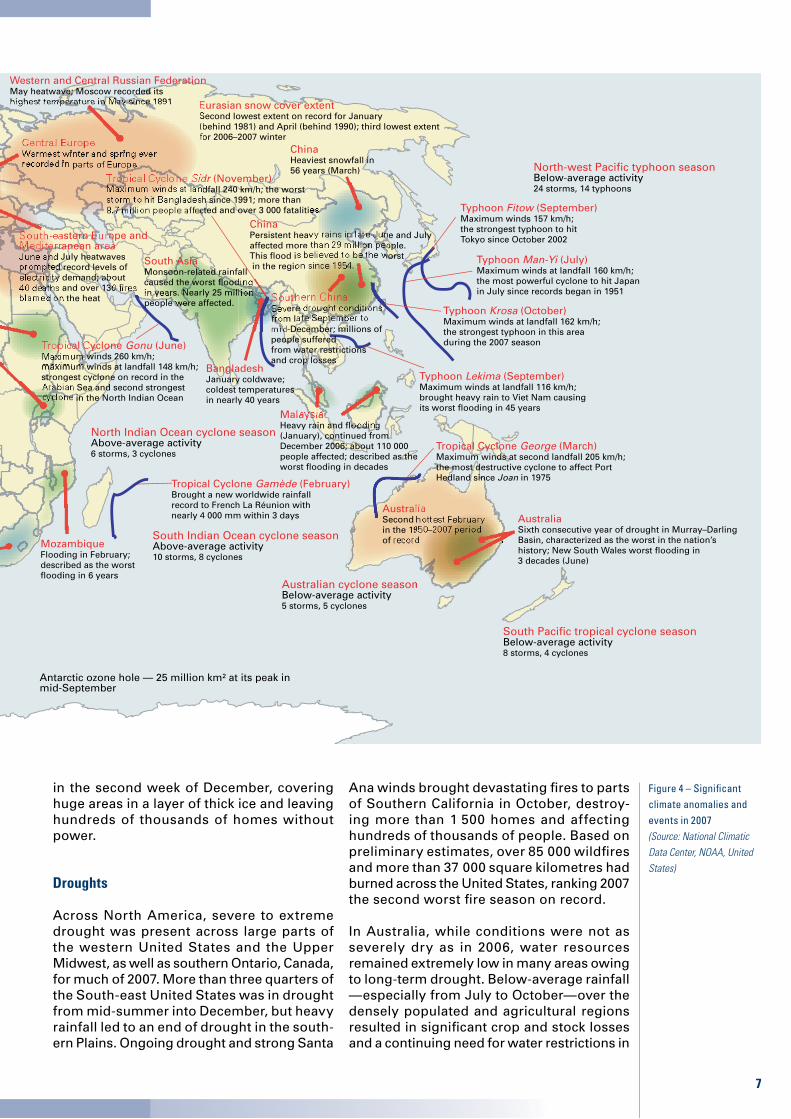
Antarctic ozone hole — 25 million km² at its peak in mid-September
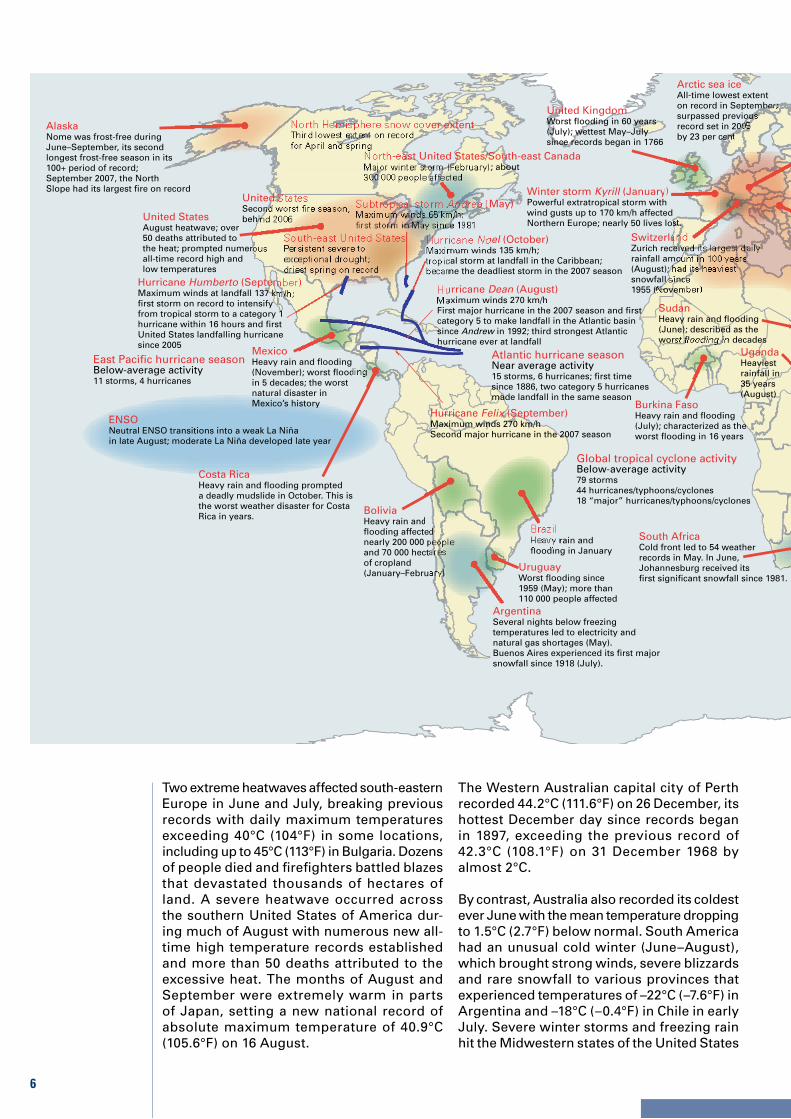
Arctic sea iceAll-time lowest extenton record in September;surpassed previous record set in 2005 by 23 per cent
ENSONeutral ENSO transitions into a weak La Niñain late August; moderate La Niña developed late year
Eurasian snow cover extentSecond lowest extent on record for January(behind 1981) and April (behind 1990); third lowest extentfor 2006–2007 winter
Atlantic hurricane seasonNear average activity15 storms, 6 hurricanes; first timesince 1886, two category 5 hurricanesmade landfall in the same season
Global tropical cyclone activityBelow-average activity79 storms44 hurricanes/typhoons/cyclones18 “major” hurricanes/typhoons/cyclones
East Pacific hurricane seasonBelow-average activity11 storms, 4 hurricanes
South Pacific tropical cyclone seasonBelow-average activity8 storms, 4 cyclones
North-west Pacific typhoon seasonBelow-average activity24 storms, 14 typhoons
Australian cyclone seasonBelow-average activity5 storms, 5 cyclones
North Indian Ocean cyclone seasonAbove-average activity 6 storms, 3 cyclones
South Indian Ocean cyclone seasonAbove-average activity10 storms, 8 cyclones
North Hemisphere snow cover extentThird lowest extent on recordfor April and spring
MozambiqueFlooding in February;described as the worstflooding in 6 years
Tropical Cyclone George (March)Maximum winds at second landfall 205 km/h;the most destructive cyclone to affect Port Hedland since Joan in 1975
ChinaHeaviest snowfall in 56 years (March)
UruguayWorst flooding since 1959 (May); more than110 000 people affected
South AfricaCold front led to 54 weatherrecords in May. In June,Johannesburg received itsfirst significant snowfall since 1981.
AustraliaSixth consecutive year of drought in Murray–DarlingBasin, characterized as the worst in the nation’s history; New South Wales worst flooding in3 decades (June)
Tropical Cyclone Gonu (June)Maximum winds 260 km/h;maximum winds at landfall 148 km/h;strongest cyclone on record in theArabian Sea and second strongest cyclone in the North Indian Ocean
United KingdomWorst flooding in 60 years (July); wettest May–Julysince records began in 1766
Burkina FasoHeavy rain and flooding(July); characterized as theworst flooding in 16 years
Typhoon Man-Yi (July)Maximum winds at landfall 160 km/h;the most powerful cyclone to hit Japan in July since records began in 1951
ArgentinaSeveral nights below freezingtemperatures led to electricity and natural gas shortages (May).Buenos Aires experienced its first majorsnowfall since 1918 (July).
SwitzerlandZurich received its largest dailyrainfall amount in 100 years(August); had its heaviest snowfall since1955 (November)
Hurricane Dean (August)Maximum winds 270 km/hFirst major hurricane in the 2007 season and first category 5 to make landfall in the Atlantic basinsince Andrew in 1992; third strongest Atlantichurricane ever at landfall
UgandaHeaviestrainfall in35 years(August)
SudanHeavy rain and flooding(June); described as theworst flooding in decades
Typhoon Fitow (September)Maximum winds 157 km/h;the strongest typhoon to hit Tokyo since October 2002
Hurricane Humberto (September)Maximum winds at landfall 137 km/h;first storm on record to intensifyfrom tropical storm to a category 1 hurricane within 16 hours and firstUnited States landfalling hurricanesince 2005
Costa RicaHeavy rain and flooding prompteda deadly mudslide in October. This isthe worst weather disaster for Costa Rica in years.
Typhoon Krosa (October)Maximum winds at landfall 162 km/h;the strongest typhoon in this areaduring the 2007 season
MexicoHeavy rain and flooding(November); worst floodingin 5 decades; the worstnatural disaster inMexico’s history
Tropical Cyclone Sidr (November)Maximum winds at landfall 240 km/h; the worststorm to hit Bangladesh since 1991; more than8.7 million people affected and over 3 000 fatalities
BangladeshJanuary coldwave;coldest temperaturesin nearly 40 years
Western and Central Russian FederationMay heatwave; Moscow recorded itshighest temperature in May since 1891
South-east United StatesPersistent severe to exceptional drought;driest spring on record
BrazilHeavy rain and flooding in January
AustraliaSecond hottest Februaryin the 1950–2007 period of record
Subtropical storm Andrea (May)Maximum winds 65 km/h;first storm in May since 1981
Hurricane Noel (October)Maximum winds 135 km/h;tropical storm at landfall in the Caribbean; became the deadliest storm in the 2007 season
United StatesSecond worst fire season,behind 2006
MalaysiaHeavy rain and flooding(January), continued fromDecember 2006; about 110 000people affected; described as the worst flooding in decades
AlaskaNome was frost-free duringJune–September, its secondlongest frost-free season in its100+ period of record;September 2007, the North Slope had its largest fire on record
Southern ChinaSevere drought conditionsfrom late September tomid-December; millions ofpeople sufferedfrom water restrictions and crop losses
Typhoon Lekima (September)Maximum winds at landfall 116 km/h;brought heavy rain to Viet Nam causingits worst flooding in 45 years
South-eastern Europe and Mediterranean areaJune and July heatwavesprompted record levels ofelectricity demand; about40 deaths and over 130 fires blamed on the heat
United StatesAugust heatwave; over50 deaths attributed to the heat; prompted numerousall-time record high andlow temperatures
North-east United States/South-east CanadaMajor winter storm (February); about 300 000 people affected
Hurricane Felix (September)Maximum winds 270 km/hSecond major hurricane in the 2007 season
Winter storm Kyrill (January)Powerful extratropical storm withwind gusts up to 170 km/h affectedNorthern Europe; nearly 50 lives lost.
BoliviaHeavy rain and flooding affected nearly 200 000 peopleand 70 000 hectaresof cropland(January–February)
Tropical Cyclone Gamède (February)Brought a new worldwide rainfallrecord to French La Réunion withnearly 4 000 mm within 3 days
South AsiaMonsoon-related rainfall caused the worst flooding in years. Nearly 25 million people were affected.
Central EuropeWarmest winter and spring ever recorded in parts of Europe
ChinaPersistent heavy rains in late-June and July affected more than 29 million people.This flood is believed to be the worst in the region since 1954.
Two extreme heatwaves affected south-eastern Europe in June and July, breaking previous records with daily maximum temperatures exceeding 40°C (104°F) in some locations, including up to 45°C (113°F) in Bulgaria. Dozens of people died and firefighters battled blazes that devastated thousands of hectares of land. A severe heatwave occurred across the southern United States of America dur-ing much of August with numerous new all-time high temperature records established and more than 50 deaths attributed to the excessive heat. The months of August and September were extremely warm in parts of Japan, setting a new national record of absolute maximum temperature of 40.9°C (105.6°F) on 16 August.
The Western Australian capital city of Perth recorded 44.2°C (111.6°F) on 26 December, its hottest December day since records began in 1897, exceeding the previous record of 42.3°C (108.1°F) on 31 December 1968 by almost 2°C.
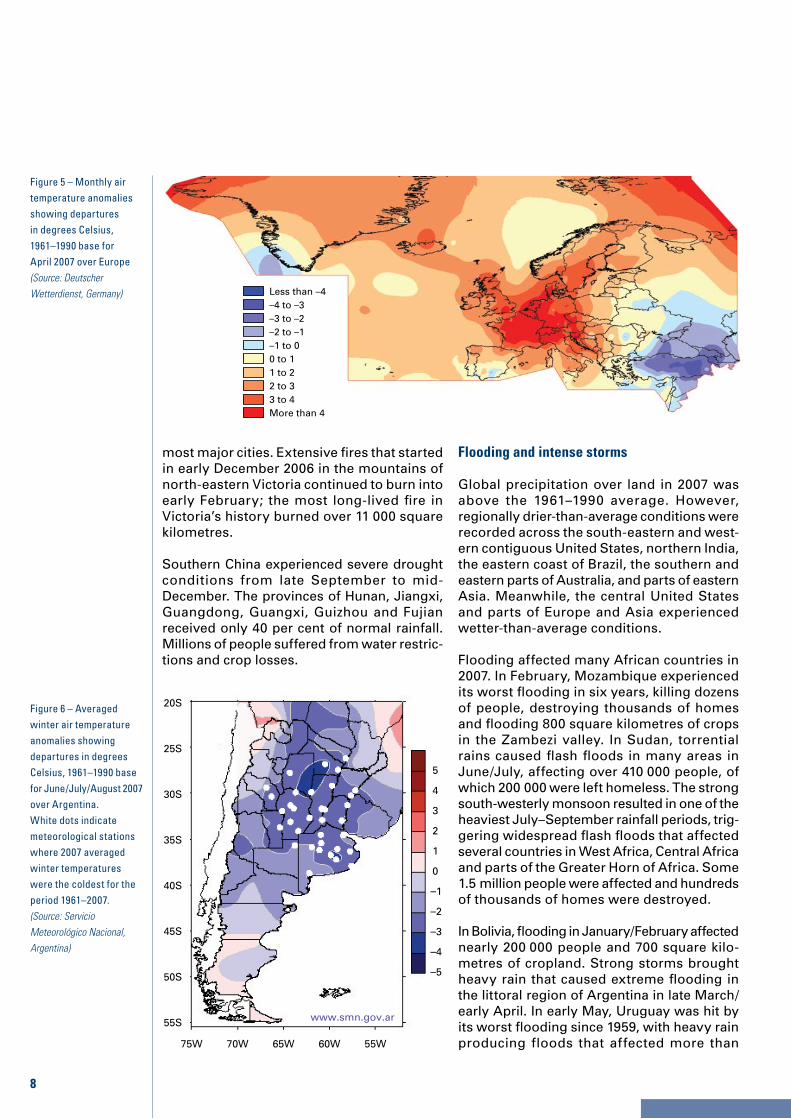
By contrast, Australia also recorded its coldest ever June with the mean temperature dropping to 1.5°C (2.7°F) below normal. South America had an unusual cold winter (June–August), which brought strong winds, severe blizzards and rare snowfall to various provinces that experienced temperatures of –22°C (–7.6°F) in Argentina and –18°C (–0.4°F) in Chile in early July. Severe winter storms and freezing rain hit the Midwestern states of the United States
7
Figure 4 – Significant climate anomalies and events in 2007 (Source: National Climatic Data Center, NOAA, United States)
Antarctic ozone hole — 25 million km² at its peak in mid-September
Arctic sea iceAll-time lowest extenton record in September;surpassed previous record set in 2005 by 23 per cent
ENSONeutral ENSO transitions into a weak La Niñain late August; moderate La Niña developed late year
Eurasian snow cover extentSecond lowest extent on record for January(behind 1981) and April (behind 1990); third lowest extentfor 2006–2007 winter
Atlantic hurricane seasonNear average activity15 storms, 6 hurricanes; first timesince 1886, two category 5 hurricanesmade landfall in the same season
Global tropical cyclone activityBelow-average activity79 storms44 hurricanes/typhoons/cyclones18 “major” hurricanes/typhoons/cyclones
East Pacific hurricane seasonBelow-average activity11 storms, 4 hurricanes
South Pacific tropical cyclone seasonBelow-average activity8 storms, 4 cyclones
North-west Pacific typhoon seasonBelow-average activity24 storms, 14 typhoons
Australian cyclone seasonBelow-average activity5 storms, 5 cyclones
North Indian Ocean cyclone seasonAbove-average activity 6 storms, 3 cyclones
South Indian Ocean cyclone seasonAbove-average activity10 storms, 8 cyclones
North Hemisphere snow cover extentThird lowest extent on recordfor April and spring
MozambiqueFlooding in February;described as the worstflooding in 6 years
Tropical Cyclone George (March)Maximum winds at second landfall 205 km/h;the most destructive cyclone to affect Port Hedland since Joan in 1975
ChinaHeaviest snowfall in 56 years (March)
UruguayWorst flooding since 1959 (May); more than110 000 people affected
South AfricaCold front led to 54 weatherrecords in May. In June,Johannesburg received itsfirst significant snowfall since 1981.
AustraliaSixth consecutive year of drought in Murray–DarlingBasin, characterized as the worst in the nation’s history; New South Wales worst flooding in3 decades (June)
Tropical Cyclone Gonu (June)Maximum winds 260 km/h;maximum winds at landfall 148 km/h;strongest cyclone on record in theArabian Sea and second strongest cyclone in the North Indian Ocean
United KingdomWorst flooding in 60 years (July); wettest May–Julysince records began in 1766
Burkina FasoHeavy rain and flooding(July); characterized as theworst flooding in 16 years
Typhoon Man-Yi (July)Maximum winds at landfall 160 km/h;the most powerful cyclone to hit Japan in July since records began in 1951
ArgentinaSeveral nights below freezingtemperatures led to electricity and natural gas shortages (May).Buenos Aires experienced its first majorsnowfall since 1918 (July).
SwitzerlandZurich received its largest dailyrainfall amount in 100 years(August); had its heaviest snowfall since1955 (November)
Hurricane Dean (August)Maximum winds 270 km/hFirst major hurricane in the 2007 season and first category 5 to make landfall in the Atlantic basinsince Andrew in 1992; third strongest Atlantichurricane ever at landfall
UgandaHeaviestrainfall in35 years(August)
SudanHeavy rain and flooding(June); described as theworst flooding in decades
Typhoon Fitow (September)Maximum winds 157 km/h;the strongest typhoon to hit Tokyo since October 2002
Hurricane Humberto (September)Maximum winds at landfall 137 km/h;first storm on record to intensifyfrom tropical storm to a category 1 hurricane within 16 hours and firstUnited States landfalling hurricanesince 2005
Costa RicaHeavy rain and flooding prompteda deadly mudslide in October. This isthe worst weather disaster for Costa Rica in years.
Typhoon Krosa (October)Maximum winds at landfall 162 km/h;the strongest typhoon in this areaduring the 2007 season
MexicoHeavy rain and flooding(November); worst floodingin 5 decades; the worstnatural disaster inMexico’s history
Tropical Cyclone Sidr (November)Maximum winds at landfall 240 km/h; the worststorm to hit Bangladesh since 1991; more than8.7 million people affected and over 3 000 fatalities
BangladeshJanuary coldwave;coldest temperaturesin nearly 40 years
Western and Central Russian FederationMay heatwave; Moscow recorded itshighest temperature in May since 1891
South-east United StatesPersistent severe to exceptional drought;driest spring on record
BrazilHeavy rain and flooding in January
AustraliaSecond hottest Februaryin the 1950–2007 period of record
Subtropical storm Andrea (May)Maximum winds 65 km/h;first storm in May since 1981
Hurricane Noel (October)Maximum winds 135 km/h;tropical storm at landfall in the Caribbean; became the deadliest storm in the 2007 season
United StatesSecond worst fire season,behind 2006
MalaysiaHeavy rain and flooding(January), continued fromDecember 2006; about 110 000people affected; described as the worst flooding in decades
AlaskaNome was frost-free duringJune–September, its secondlongest frost-free season in its100+ period of record;September 2007, the North Slope had its largest fire on record
Southern ChinaSevere drought conditionsfrom late September tomid-December; millions ofpeople sufferedfrom water restrictions and crop losses
Typhoon Lekima (September)Maximum winds at landfall 116 km/h;brought heavy rain to Viet Nam causingits worst flooding in 45 years
South-eastern Europe and Mediterranean areaJune and July heatwavesprompted record levels ofelectricity demand; about40 deaths and over 130 fires blamed on the heat
United StatesAugust heatwave; over50 deaths attributed to the heat; prompted numerousall-time record high andlow temperatures
North-east United States/South-east CanadaMajor winter storm (February); about 300 000 people affected
Hurricane Felix (September)Maximum winds 270 km/hSecond major hurricane in the 2007 season
Winter storm Kyrill (January)Powerful extratropical storm withwind gusts up to 170 km/h affectedNorthern Europe; nearly 50 lives lost.
BoliviaHeavy rain and flooding affected nearly 200 000 peopleand 70 000 hectaresof cropland(January–February)
Tropical Cyclone Gamède (February)Brought a new worldwide rainfallrecord to French La Réunion withnearly 4 000 mm within 3 days
South AsiaMonsoon-related rainfall caused the worst flooding in years. Nearly 25 million people were affected.
Central EuropeWarmest winter and spring ever recorded in parts of Europe
ChinaPersistent heavy rains in late-June and July affected more than 29 million people.This flood is believed to be the worst in the region since 1954.
in the second week of December, covering huge areas in a layer of thick ice and leaving hundreds of thousands of homes without power.
Droughts
Across North America, severe to extreme drought was present across large parts of the western United States and the Upper Midwest, as well as southern Ontario, Canada, for much of 2007. More than three quarters of the South-east United States was in drought from mid-summer into December, but heavy rainfall led to an end of drought in the south-ern Plains. Ongoing drought and strong Santa
Ana winds brought devastating fires to parts of Southern California in October, destroy-ing more than 1 500 homes and affecting hundreds of thousands of people. Based on preliminary estimates, over 85 000 wildfires and more than 37 000 square kilometres had burned across the United States, ranking 2007 the second worst fire season on record.
In Australia, while conditions were not as severely dry as in 2006, water resources remained extremely low in many areas owing to long-term drought. Below-average rainfall —especially from July to October—over the densely populated and agricultural regions resulted in significant crop and stock losses and a continuing need for water restrictions in
8
most major cities. Extensive fires that started in early December 2006 in the mountains of north-eastern Victoria continued to burn into early February; the most long-lived fire in Victoria’s history burned over 11 000 square kilometres.
Southern China experienced severe drought conditions from late September to mid-December. The provinces of Hunan, Jiangxi, Guangdong, Guangxi, Guizhou and Fujian received only 40 per cent of normal rainfall. Millions of people suffered from water restric-tions and crop losses.
Flooding and intense storms
Global precipitation over land in 2007 was above the 1961–1990 average. However, regionally drier-than-average conditions were recorded across the south-eastern and west-ern contiguous United States, northern India, the eastern coast of Brazil, the southern and eastern parts of Australia, and parts of eastern Asia. Meanwhile, the central United States and parts of Europe and Asia experienced wetter-than-average conditions.
Flooding affected many African countries in 2007. In February, Mozambique experienced its worst flooding in six years, killing dozens of people, destroying thousands of homes and flooding 800 square kilometres of crops in the Zambezi valley. In Sudan, torrential rains caused flash floods in many areas in June/July, affecting over 410 000 people, of which 200 000 were left homeless. The strong south-westerly monsoon resulted in one of the heaviest July–September rainfall periods, trig-gering widespread flash floods that affected several countries in West Africa, Central Africa and parts of the Greater Horn of Africa. Some 1.5 million people were affected and hundreds of thousands of homes were destroyed.
In Bolivia, flooding in January/February affected nearly 200 000 people and 700 square kilo-metres of cropland. Strong storms brought heavy rain that caused extreme flooding in the littoral region of Argentina in late March/early April. In early May, Uruguay was hit by its worst flooding since 1959, with heavy rain producing floods that affected more than
Figure 6 – Averaged winter air temperature anomalies showing departures in degrees Celsius, 1961–1990 base for June/July/August 2007 over Argentina. White dots indicate meteorological stations where 2007 averaged winter temperatures were the coldest for the period 1961–2007. (Source: Servicio Meteorológico Nacional, Argentina)
55S
50S
45S
40S
35S
30S
25S
20S
–3
–1
1
–4
–5
–2
0
4
2
5
3
70W 65W75W 60W 55W
www.smn.gov.ar
Figure 5 – Monthly air temperature anomalies showing departures in degrees Celsius, 1961–1990 base for April 2007 over Europe(Source: Deutscher Wetterdienst, Germany)
–4 to –3–3 to –2–2 to –1–1 to 00 to 11 to 22 to 33 to 4
Less than –4
More than 4

�
110 000 people and severely damaged crops and buildings. Triggered by storms, massive flooding in Mexico in early November destroyed the homes of half a million people and seriously affected the country’s oil industry.
In Indonesia, massive flooding on Java in early February killed dozens of people and covered half of the city of Jakarta by up to 3.7 metres of water. Persistent heavy rains in China rav-aged the Huai He river valley in late June and July, affecting more than 29 million people. This flood is believed to be the worst in the region since 1954. Monsoon-related extreme rainfall events caused the worst flooding in years in parts of South Asia. About 25 million people were affected in the region, especially in India, Pakistan, Bangladesh and Nepal, and thousands lost their lives. However, in India, rainfall during the summer monsoon season (June–September) was, generally, near normal (105 per cent of the long-term average), but with marked differences in the distribution of rainfall in space and time.
Heavy rains in the second half of December resulted in massive flooding in Sri Lanka and Indonesia. In Sri Lanka, more than one quarter of a million people were affected, whilst wide-spread floods triggering devastating landslides
on the island of Java in Indonesia affected tens of thousands with more than 100 casualties. A powerful storm system, Kyrill, affected much of northern Europe on 17 and 18 January with torrential rains and winds gusting up to 170 km/h. There were at least 47 deaths across the region, and disruptions in electric supply that affected tens of thousands of people during the storm.
England and Wales recorded the wettest May–July period since records began in 1766, receiving 415 mm of rain compared with the previous record of 349 mm in 1789. Extensive flooding in the region killed nine people and caused more than US$ 6 billion in damages.
Tropical cyclones
In the North-West Pacific, 24 named tropical storms developed during 2007, below the long-term annual average of 27. Of those, 14 storms were classified as typhoons, equalling the long-term annual average. Tropical cyclones affected millions in South-East Asia, with typhoons Pabuk, Krosa, Lekima and tropical storms such as Peipah among the severest.
Figure 7 – Australian rainfall deciles for the years 2002 to 2007. Deciles are calculated relative to the period 1900–2007, with distribution based on gridded data from the National Climate Centre. For the agriculturally important Murray–Darling Basin (outlined in bold) it was the sixth consecutive year of lower-than-average rainfall totals and the driest such six-year period on record. (Source: Commonwealth of Australia, Australian Bureau of Meteorology, Australia)
Very muchabove average
Above average
Average
Below average
Very muchbelow record
Highest on record
Lowest onrecord
2–3
1
10
4–7
8–9
Rainfall decile ranges
10
During the 2007 Atlantic hurricane season, 15 named storms occurred, compared with the 1981–2000 annual average of 12, with 6 being classified as hurricanes, equalling the average. For the first time since records began in 1886, two Atlantic category 5 hurricanes, Dean and Felix, made landfall in the same season.
In February, due to tropical cyclone Gamède, a new worldwide rainfall record was set in La Réunion with 3 929 mm measured within three days.
In June, cyclone Gonu made landfall in Oman, affecting more than 20 000 people and killing 50, before reaching the Islamic Republic of Iran. Gonu was the strongest tropical cyclone to hit the region since records began in 1945.
On 15 November, tropical cyclone Sidr made landfall in Bangladesh, generating winds of up to 240 km/h and torrential rains. More than 8.7 million people were affected by the category 4 storm, 52 000 were injured and over 3 000 died. Nearly 1.5 million houses were damaged or destroyed.
In Australia, the 2006/2007 tropical season was unusually quiet, with only five tropi-cal cyclones recorded, equalling the lowest number observed since at least 1943–1944.
El Niño/Southern Oscillation conditions
The brief El Niño event of late 2006 quickly dissipated in January 2007, and La Niña con-ditions became well established across the central and eastern Equatorial Pacific in the latter half of 2007.
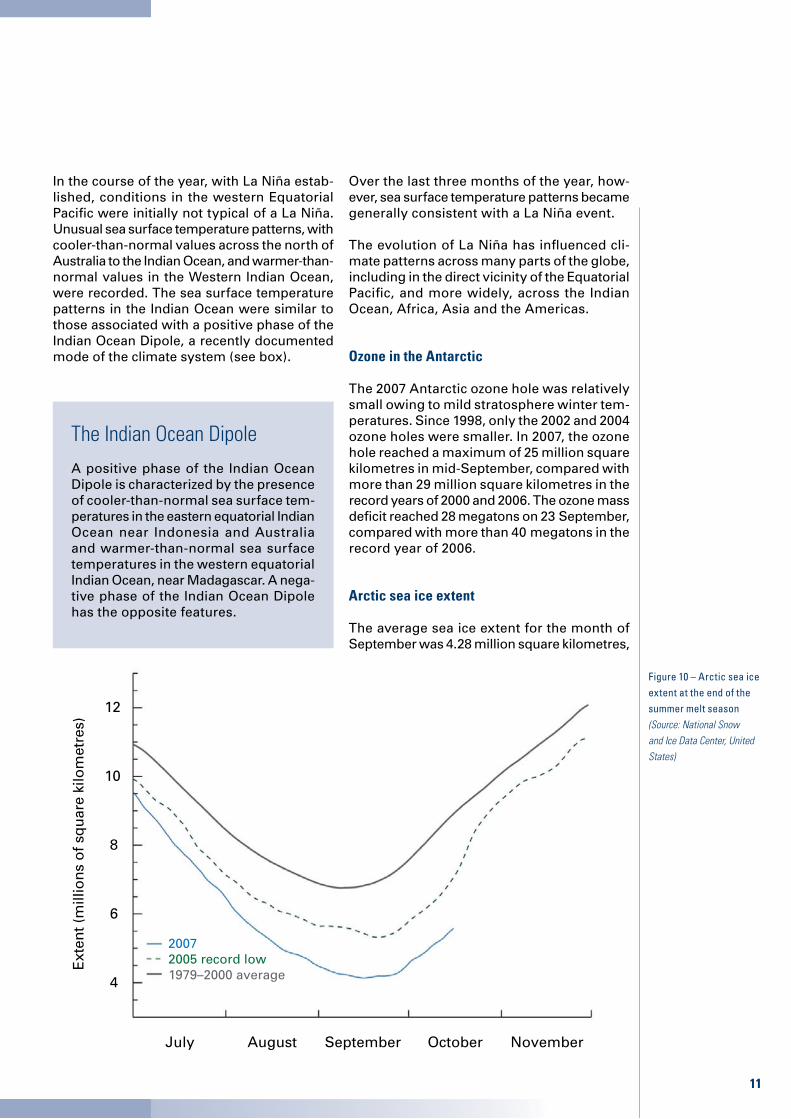
Figure 9 – Monthly precipitation totals in mm for Africa for January 2007(Source: The African Centre of Meteorological Applications for Development, Niamey)
20W 10W 10E 30E 50E0 20E 40E
30S
20S
10S
0
10N
20N
30N
750650550450300200100502510
850
0.1
Rainfall in January 2007
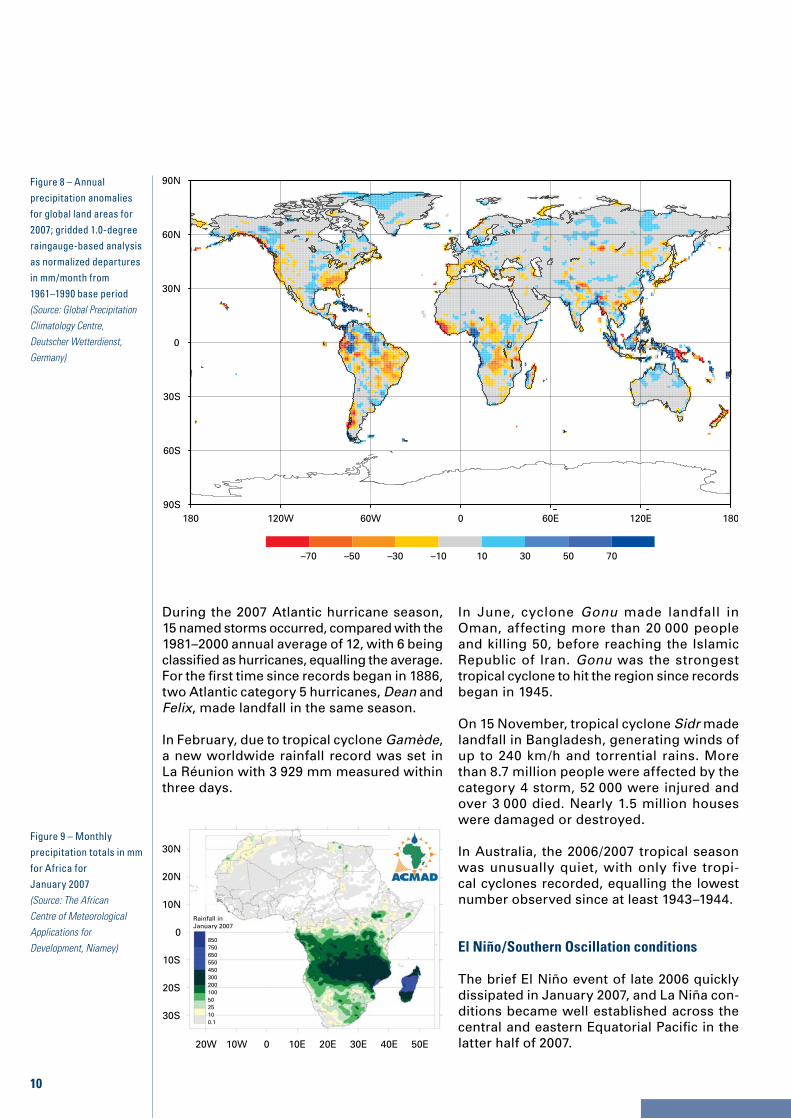
Figure 8 – Annual precipitation anomalies for global land areas for 2007; gridded 1.0-degree raingauge-based analysis as normalized departures in mm/month from 1961–1990 base period (Source: Global Precipitation Climatology Centre, Deutscher Wetterdienst, Germany)
90S
60S
30S
0
30N
60N
90N
120W 60W180 0 60E 120E 180
–50 10–70 50–10–30 30 70
11
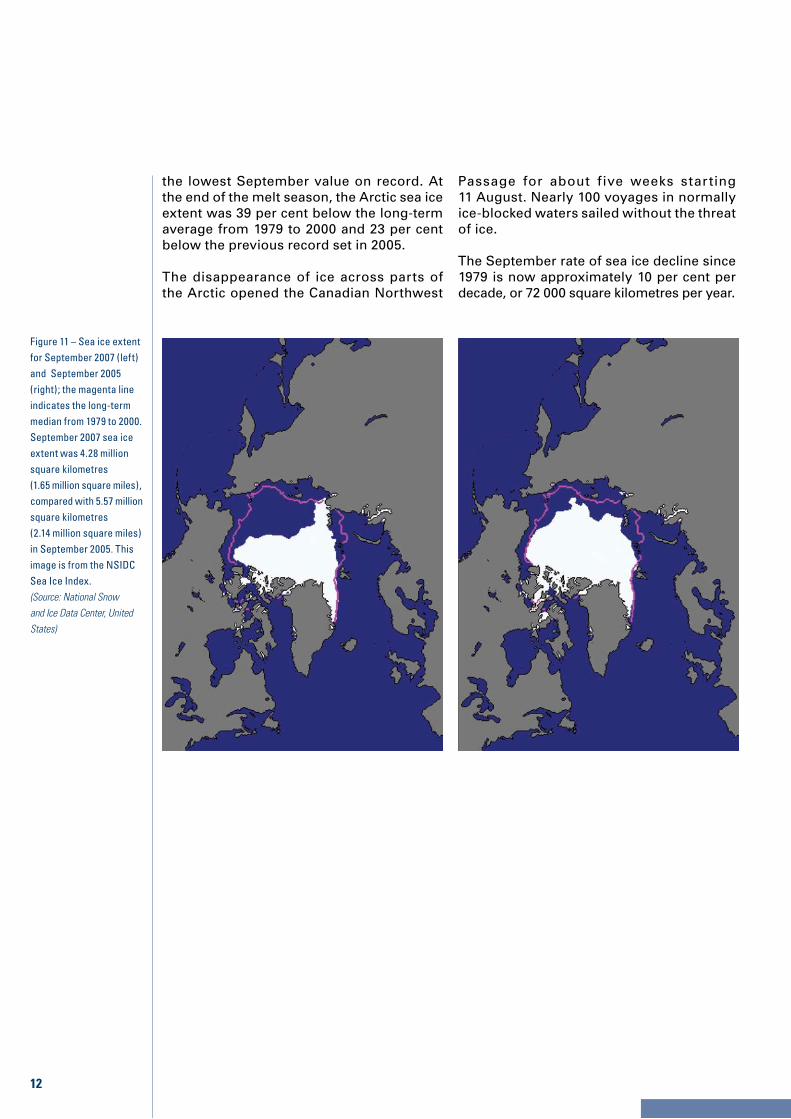
Figure 10 – Arctic sea ice extent at the end of the summer melt season (Source: National Snow and Ice Data Center, United States)
4
6
8
10
12
July August September October November
Ext
ent (
mill
ion
s o
f sq
uar
e ki
lom
etre
s)
2005 record low2007
1979–2000 average
In the course of the year, with La Niña estab-lished, conditions in the western Equatorial Pacific were initially not typical of a La Niña. Unusual sea surface temperature patterns, with cooler-than-normal values across the north of Australia to the Indian Ocean, and warmer-than-normal values in the Western Indian Ocean, were recorded. The sea surface temperature patterns in the Indian Ocean were similar to those associated with a positive phase of the Indian Ocean Dipole, a recently documented mode of the climate system (see box).
Over the last three months of the year, how-ever, sea surface temperature patterns became generally consistent with a La Niña event.
The evolution of La Niña has influenced cli-mate patterns across many parts of the globe, including in the direct vicinity of the Equatorial Pacific, and more widely, across the Indian Ocean, Africa, Asia and the Americas.
Ozone in the Antarctic
The 2007 Antarctic ozone hole was relatively small owing to mild stratosphere winter tem-peratures. Since 1998, only the 2002 and 2004 ozone holes were smaller. In 2007, the ozone hole reached a maximum of 25 million square kilometres in mid-September, compared with more than 29 million square kilometres in the record years of 2000 and 2006. The ozone mass deficit reached 28 megatons on 23 September, compared with more than 40 megatons in the record year of 2006.
Arctic sea ice extent
The average sea ice extent for the month of September was 4.28 million square kilometres,
The Indian Ocean DipoleA positive phase of the Indian Ocean Dipole is characterized by the presence of cooler-than-normal sea surface tem-peratures in the eastern equatorial Indian Ocean near Indonesia and Australia and warmer-than-normal sea surface temperatures in the western equatorial Indian Ocean, near Madagascar. A nega-tive phase of the Indian Ocean Dipole has the opposite features.
12
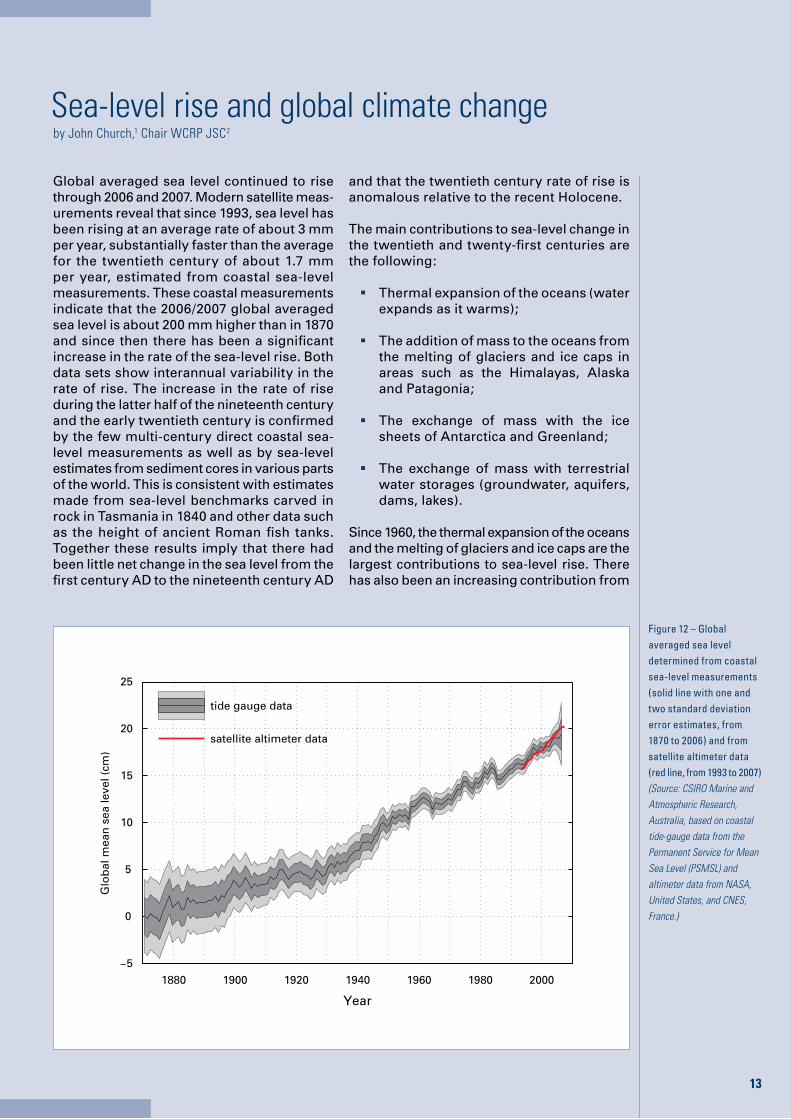
the lowest September value on record. At the end of the melt season, the Arctic sea ice extent was 39 per cent below the long-term average from 1979 to 2000 and 23 per cent below the previous record set in 2005.
The disappearance of ice across parts of the Arctic opened the Canadian Northwest
Passage for about five weeks starting 11 August. Nearly 100 voyages in normally ice-blocked waters sailed without the threat of ice.
The September rate of sea ice decline since 1979 is now approximately 10 per cent per decade, or 72 000 square kilometres per year.
Figure 11 – Sea ice extent for September 2007 (left) and September 2005 (right); the magenta line indicates the long-term median from 1979 to 2000. September 2007 sea ice extent was 4.28 million square kilometres (1.65 million square miles), compared with 5.57 million square kilometres (2.14 million square miles) in September 2005. This image is from the NSIDC Sea Ice Index.(Source: National Snow and Ice Data Center, United States)
Global averaged sea level continued to rise through 2006 and 2007. Modern satellite meas-urements reveal that since 1993, sea level has been rising at an average rate of about 3 mm per year, substantially faster than the average for the twentieth century of about 1.7 mm per year, estimated from coastal sea-level measurements. These coastal measurements indicate that the 2006/2007 global averaged sea level is about 200 mm higher than in 1870 and since then there has been a significant increase in the rate of the sea-level rise. Both data sets show interannual variability in the rate of rise. The increase in the rate of rise during the latter half of the nineteenth century and the early twentieth century is confirmed by the few multi-century direct coastal sea-level measurements as well as by sea-level estimates from sediment cores in various parts of the world. This is consistent with estimates made from sea-level benchmarks carved in rock in Tasmania in 1840 and other data such as the height of ancient Roman fish tanks. Together these results imply that there had been little net change in the sea level from the first century AD to the nineteenth century AD
and that the twentieth century rate of rise is anomalous relative to the recent Holocene.
The main contributions to sea-level change in the twentieth and twenty-first centuries are the following:
ß Thermal expansion of the oceans (water expands as it warms);
ß The addition of mass to the oceans from the melting of glaciers and ice caps in areas such as the Himalayas, Alaska and Patagonia;
ß The exchange of mass with the ice sheets of Antarctica and Greenland;
ß The exchange of mass with terrestrial water storages (groundwater, aquifers, dams, lakes).
Since 1960, the thermal expansion of the oceans and the melting of glaciers and ice caps are the largest contributions to sea-level rise. There has also been an increasing contribution from
Sea-level rise and global climate change by John Church,1 Chair WCRP JSC2
−5
0
5
10
15
20
25
1880 1900 1920 1940 1960 1980 2000
Year
Glo
bal
mea
n s
ea le
vel (
cm)
tide gauge data
satellite altimeter data
Figure 12 – Global averaged sea level determined from coastal sea-level measurements (solid line with one and two standard deviation error estimates, from 1870 to 2006) and from satellite altimeter data (red line, from 1993 to 2007) (Source: CSIRO Marine and Atmospheric Research, Australia, based on coastal tide-gauge data from the Permanent Service for Mean Sea Level (PSMSL) and altimeter data from NASA, United States, and CNES, France.)
1�
1�
surface melt from the Greenland ice sheet over this period. These contributions are directly related to recent climate change.
Over the last decade, however, there are indications of a larger contribution from the movement of outlet glaciers of both the Greenland and West Antarctic ice sheets. If this were a sign of an acceleration in response to global warming, it would be a major con-cern as the ice sheets contain enough water to raise sea level by 7 and 6 m, respectively, and any such dynamic response could raise sea level significantly faster than surface melting alone.
The impacts of sea level rise will be felt through an increase in both mean sea level and the frequency of extreme sea level events, for example storm surges, of a given level. Impacts include increased flooding, both severity
and frequency, of low-lying areas, erosion of beaches, and damage to infrastructure and the environment, including wetlands, inter-tidal zones and mangroves, with significant impacts on biodiversity and ecosystem func-tion. Millions of people in low-lying nations such as Bangladesh, the Mekong and other deltas, and Pacific islands such as Tuvalu, will have to respond to rising sea levels during the twenty-first century and beyond.
Improved sea-level rise projections will con-tribute to more effective coastal planning and management. Adaptation measures include, for example, enhanced building codes, restrictions on where to build and developing infrastructure better able to cope with flooding.
1 CSIRO Marine and Atmospheric Research, Australia2 World Climate Research Programme Joint Scientific
Committee


For more information, please contact:
World Meteorological Organization
Communications and Public Affairs Office
Tel.: +41 (0) 22 730 83 14/15 – Fax: +41 (0) 22 730 80 27
E-mail: [email protected]
7 bis, avenue de la Paix – P.O. Box 2300 – CH 1211 Geneva 2 – Switzerland
www.wmo.int