wmata energy storage demonstration project · demonstration project final report june 2015 ......
TRANSCRIPT

WMATA Energy Storage Demonstration Project
Final Report
JUNE 2015FTA Report No. 0086
Federal Transit Administration
PREPARED BY
Moustapha OuattaraWashington Metropolitan Area Transit Authority (WMATA)
J. Gordon YuGannett Fleming Transit & Rail Systems

COVER PHOTO Courtesy of Edwin Adilson Rodriguez, Federal Transit Administration.
DISCLAIMER This document is disseminated under the sponsorship of the U.S. Department of Transportation in the interest of information exchange. The United States Government assumes no liability for its contents or use thereof. The United States Government does not endorse products or manufacturers. Trade or manufacturers’ names appear herein solely because they are considered essential to the objective of this report.
JUNE 2015FTA Report No. 0086PREPARED BY
Moustapha OuattaraWashington Metropolitan Area Transit Authority (WMATA)
J. Gordon YuGannett Fleming Transit & Rail Systems
SPONSORED BY
Federal Transit AdministrationOffice of Research, Demonstration and InnovationU.S. Department of Transportation1200 New Jersey Avenue, SEWashington, DC 20590
AVAILABLE ONLINE
http://www.fta.dot.gov/research
WMATA Energy Storage Demonstration ProjectFinal Report

FEDERAL TRANSIT ADMINISTRATION ii
Metric Conversion Table
SYMBOL WHEN YOU KNOW MULTIPLY BY TO FIND SYMBOL
LENGTH
in inches 25.4 millimeters mm
ft feet 0.305 meters m
yd yards 0.914 meters m
mi miles 1.61 kilometers km
VOLUME
fl oz fluid ounces 29.57 milliliters mL
gal gallons 3.785 liter L
ft3 cubic feet 0.028 cubic meters m3
yd3 cubic yards 0.765 cubic meters m3
NOTE: volumes greater than 1000 L shall be shown in m3
MASS
oz ounces 28.35 grams g
lb pounds 0.454 kilograms kg
T short tons (2000 lb) 0.907 megagrams (or “metric ton”) Mg (or “t”)
TEMPERATURE (exact degrees)
oF Fahrenheit 5 (F-32)/9or (F-32)/1.8
Celsius oC
REPORT DOCUMENTATION PAGE Form ApprovedOMB No. 0704-0188
Public reporting burden for this collection of information is estimated to average 1 hour per response, including the time for reviewing instruc-tions, searching existing data sources, gathering and maintaining the data needed, and completing and reviewing the collection of information. Send comments regarding this burden estimate or any other aspect of this collection of information, including suggestions for reducing this burden, to Washington Headquarters Services, Directorate for Information Operations and Reports, 1215 Jefferson Davis Highway, Suite 1204, Arlington, VA 22202-4302, and to the Office of Management and Budget, Paperwork Reduction Project (0704-0188), Washington, DC 20503.
1. AGENCY USE ONLY 2. REPORT DATE June 2015
3. REPORT TYPE AND DATES COVERED 2013-2014
4. TITLE AND SUBTITLE WMATA Wayside Energy Storage Demonstration Project
5. FUNDING NUMBERS DC-26-7209
6. AUTHOR(S) Moustapha Ouattara, J. Gordon Yu
7. PERFORMING ORGANIZATION NAME(S) AND ADDRESSE(ES)WMATACENI-Office of Chief Engineer, Infrastructure 4C-01600 5th St. NWWashington, DC 20001
8. PERFORMING ORGANIZATION REPORT NUMBER
FTA Report No. 0086
9. SPONSORING/MONITORING AGENCY NAME(S) AND ADDRESS(ES) U.S. Department of Transportation Federal Transit Administration Office of Civil Rights East Building 1200 New Jersey Avenue, SE Washington, DC 20590
10. SPONSORING/MONITORING AGENCY REPORT NUMBER
FTA Report No. 0086
11. SUPPLEMENTARY NOTES [http://www.fta.dot.gov/research]
12A. DISTRIBUTION/AVAILABILITY STATEMENT Available from: National Technical Information Service (NTIS), Springfield, VA 22161. Phone 703.605.6000, Fax 703.605.6900, email [[email protected]]
12B. DISTRIBUTION CODE
TRI-20
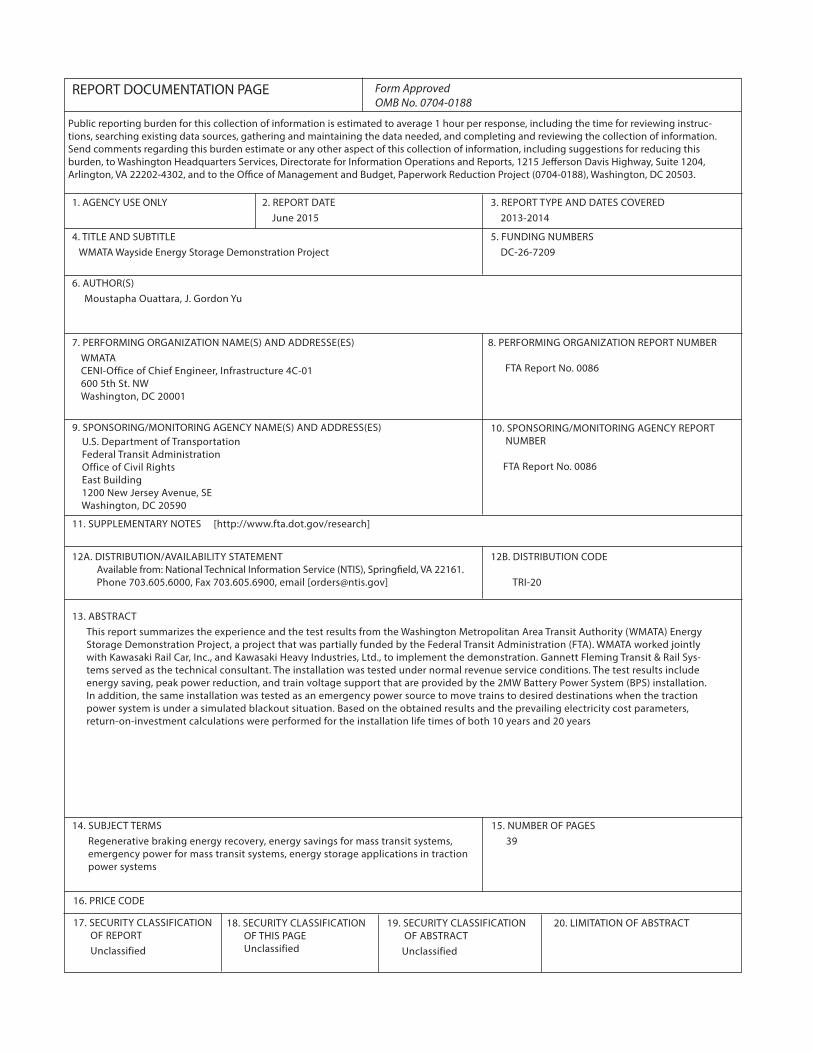
13. ABSTRACTThis report summarizes the experience and the test results from the Washington Metropolitan Area Transit Authority (WMATA) Energy Storage Demonstration Project, a project that was partially funded by the Federal Transit Administration (FTA). WMATA worked jointly with Kawasaki Rail Car, Inc., and Kawasaki Heavy Industries, Ltd., to implement the demonstration. Gannett Fleming Transit & Rail Sys-tems served as the technical consultant. The installation was tested under normal revenue service conditions. The test results include energy saving, peak power reduction, and train voltage support that are provided by the 2MW Battery Power System (BPS) installation. In addition, the same installation was tested as an emergency power source to move trains to desired destinations when the traction power system is under a simulated blackout situation. Based on the obtained results and the prevailing electricity cost parameters, return-on-investment calculations were performed for the installation life times of both 10 years and 20 years
14. SUBJECT TERMSRegenerative braking energy recovery, energy savings for mass transit systems, emergency power for mass transit systems, energy storage applications in traction power systems
15. NUMBER OF PAGES 39
16. PRICE CODE
17. SECURITY CLASSIFICATION OF REPORT Unclassified
18. SECURITY CLASSIFICATION OF THIS PAGE Unclassified
19. SECURITY CLASSIFICATION OF ABSTRACT Unclassified
20. LIMITATION OF ABSTRACT

FEDERAL TRANSIT ADMINISTRATION iv
TABLE OF CONTENTS
1 Executive Summary 4 Section 1: Introduction 6 Section 2: Battery Power System (BPS) Technical Parameters and Installation 6 GIGACELL Battery Technology 8 BPS Parameters 8 BPS System Installation 14 Section 3: Test Results 14 BPS Test Scenarios 14 Energy Savings 14 Peak Power Shaving 15 System Voltage Improvement 17 Using BPS for Emergency Power 18 Summary of Train Test Results 21 Section 4: ROI Calculations 21 Potential Energy Cost Savings 23 Return-on-Investment 26 Other Benefits 28 Appendix A: Summary of Recorded Data 29 Contacts 30 References
FEDERAL TRANSIT ADMINISTRATION v
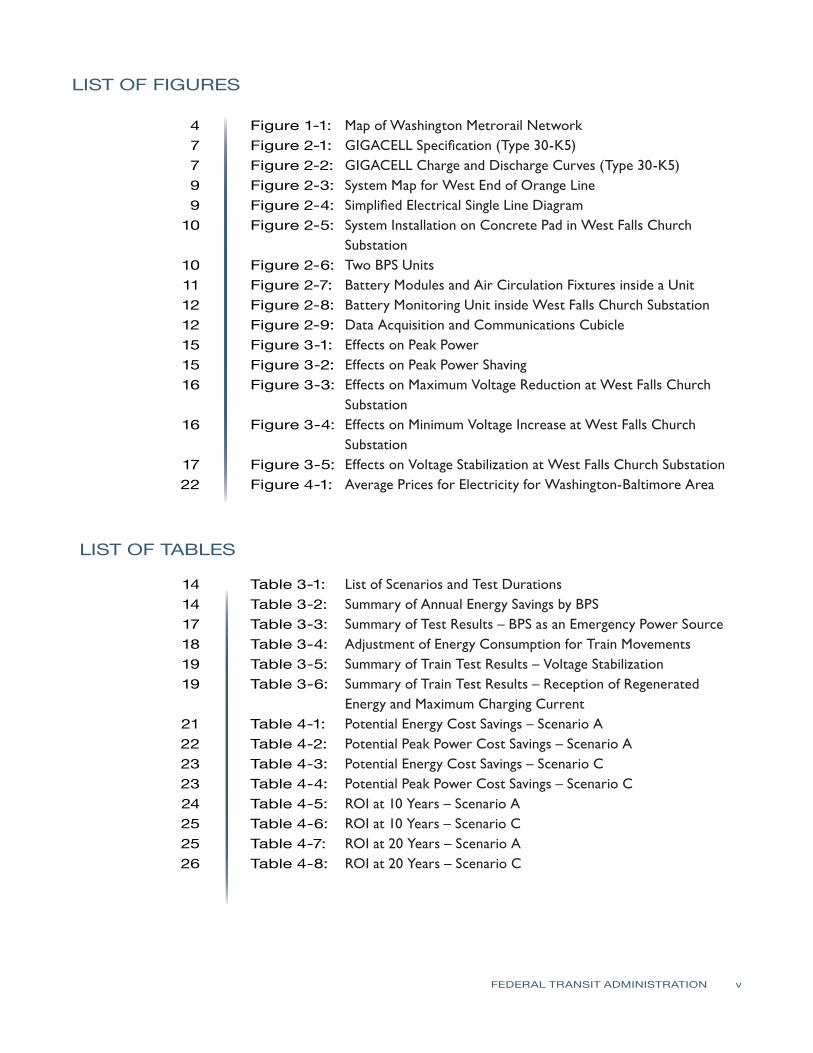
LIST OF FIGURES
4 Figure 1-1: Map of Washington Metrorail Network 7 Figure 2-1: GIGACELL Specification (Type 30-K5) 7 Figure 2-2: GIGACELL Charge and Discharge Curves (Type 30-K5) 9 Figure 2-3: System Map for West End of Orange Line 9 Figure 2-4: Simplified Electrical Single Line Diagram 10 Figure 2-5: System Installation on Concrete Pad in West Falls Church Substation 10 Figure 2-6: Two BPS Units 11 Figure 2-7: Battery Modules and Air Circulation Fixtures inside a Unit 12 Figure 2-8: Battery Monitoring Unit inside West Falls Church Substation 12 Figure 2-9: Data Acquisition and Communications Cubicle 15 Figure 3-1: Effects on Peak Power 15 Figure 3-2: Effects on Peak Power Shaving 16 Figure 3-3: Effects on Maximum Voltage Reduction at West Falls Church Substation 16 Figure 3-4: Effects on Minimum Voltage Increase at West Falls Church Substation 17 Figure 3-5: Effects on Voltage Stabilization at West Falls Church Substation 22 Figure 4-1: Average Prices for Electricity for Washington-Baltimore Area
14 Table 3-1: List of Scenarios and Test Durations 14 Table 3-2: Summary of Annual Energy Savings by BPS 17 Table 3-3: Summary of Test Results – BPS as an Emergency Power Source 18 Table 3-4: Adjustment of Energy Consumption for Train Movements 19 Table 3-5: Summary of Train Test Results – Voltage Stabilization 19 Table 3-6: Summary of Train Test Results – Reception of Regenerated Energy and Maximum Charging Current 21 Table 4-1: Potential Energy Cost Savings – Scenario A 22 Table 4-2: Potential Peak Power Cost Savings – Scenario A 23 Table 4-3: Potential Energy Cost Savings – Scenario C 23 Table 4-4: Potential Peak Power Cost Savings – Scenario C 24 Table 4-5: ROI at 10 Years – Scenario A 25 Table 4-6: ROI at 10 Years – Scenario C 25 Table 4-7: ROI at 20 Years – Scenario A 26 Table 4-8: ROI at 20 Years – Scenario C
LIST OF TABLES

FEDERAL TRANSIT ADMINISTRATION vi
ACKNOWLEDGMENTS
This report was developed for the Federal Transit Administration’s Office of Technology. Special thanks to Roy Chen, Transportation Engineer, for his guidance and support. The demonstration project at WMATA would not have been possible without the support and cooperation of many people. The authors also thank the following:
WMATA Ashton Robinson Oscar Ravarra Wayne Ficklin
Kawasaki Rail Car, Inc. John Calvello Willard Francis Maurice Andriani
Kawasaki Heavy Industries, Ltd. Shoichi Morioka Takahiro Matsumura Koki Ogura
ABSTRACT
This report summarizes the experience and the test results from the Washington Metropolitan Area Transit Authority (WMATA) Energy Storage Demonstration Project, a project that was partially funded by the Federal Transit Administration (FTA). WMATA worked jointly with Kawasaki Rail Car, Inc., and Kawasaki Heavy Industries, Ltd., to implement the demonstration. Gannett Fleming Transit & Rail Systems served as the technical consultant.
The installation was tested under normal revenue service conditions. The test results include energy saving, peak power reduction, and train voltage support that are provided by the 2MW Battery Power System (BPS) installation. In addition, the same installation was tested as an emergency power source to move trains to desired destinations when the traction power system is under a simulated blackout situation. Based on the obtained results and the prevailing electricity cost parameters, return-on-investment calculations were performed for the installation life times of both 10 years and 20 years.

FEDERAL TRANSIT ADMINISTRATION 1
EXECUTIVE SUMMARY
This report presents the results of the WMATA Energy Storage Demonstration Project.
The rail cars in the WMATA Metrorail system use regenerative braking to recover a substantial amount of energy that otherwise would have been wasted. The ratio of the recovered energy over the available energy (defined as the receptivity of the system) depends primarily on the service frequency, among other factors. An energy storage system helps with the additional recovery of the braking energy. It also helps reduce peak power demands from substations and reduce the voltage drops to motoring trains. WMATA decided to install a demonstration unit and collect in-service data to quantify the benefits of such a system and determine the return on investment. Such data are not only useful to WMATA, but also to other rail agencies. FTA partially sponsored this demonstration project so that the experience gained from this demonstration can be shared in the wider industry.
A 2MW Battery Power System (BPS) was installed in West Falls Church Yard on the Orange Line of the WMATA metro network. The system uses the high-capacity Nickel-metal Hydride GIGACELL technology by Kawasaki Heavy Industries, Ltd. The objective of the demonstration was to assess the suitability and effectiveness of the system in a mass rapid transit rail environment.
Electronic data recorders have been used to collect the real-time performance data. This report contains the analysis of the test results.
Three scenarios were tested:
• Scenario A – West Falls Church substation with 6MW rectifiers
• Scenario B – West Falls Church substation with 3MW rectifiers
• Scenario C – West Falls Church substation without any rectifier, acting as a tie-breaker station
In each scenario, the BPS was turned off for one week and then turned on for the next week to assess its effects. The results from the available test data are summarized as follows:
• Energy saving – Equivalent annual energy saving between 7.2% (Scenario A) and 15.4% (Scenario C) was achieved. (Energy saving for Scenario B was not calculated because the data were incomplete due to train operational anomalies during the test.)
• Peak power shaving – Peak power shaving between 121 kW (Scenario A) and 436 kW (Scenario C) was achieved.
• System voltage improvement – Voltage stabilization effect between 42 V (Scenario A) and 139 V (Scenario C) was achieved.

FEDERAL TRANSIT ADMINISTRATION 2
• Emergency power – Powered by the BPS alone, a 6-car train without passengers (AW0 load) started from standstill and moved 2,800 feet at a speed limit of 10 mph. This train movement consumed 4% of the BPS energy capacity. If the train had been loaded at crush load (AW2 load at 175 passengers per car), the same train movement would have consumed 5.24% of the BPS energy capacity. From this test, it was calculated that the fully-charged BPS can support 19 such train movements at AW2 load in succession if the BPS is not used to supply any other load.
The test results demonstrate that the when the BPS is installed at a tie-breaker station, it yields better results than an equivalent installation in a traction power substation for the same battery system configuration.
Return-on-investment (ROI) calculations were performed based on the following parameters:
• Average electricity price of $0.124/kWh for the Washington-Baltimore area [4]
• National average electric energy price increase from 2013 to 2040 of 2.4% per year [3].
• Maintenance cost of BPS assumed to increase by 2% per year.
For a 10-year installation, the following results were obtained:
• For Scenario A, equipment cost (offset by additional benefits and cost for displaced investment) needs to be at or less than $730,000 for the system to achieve a positive financial return.
• For Scenario C, equipment cost (offset by additional benefits and cost for displaced investment) needs to be at or less than $1,870,000 for the system to achieve a positive financial return.
For a 20-year installation, the following results were obtained:
• For Scenario A, equipment cost (offset by additional benefits and cost for displaced investment) needs to be at or less than $410,000 for the system to achieve a positive financial return.
• For Scenario C, equipment cost (offset by additional benefits and cost for displaced investment) needs to be at or less than $2,650,000 for the system to achieve a positive financial return.
Additional benefits that may be realized from a BPS include the following:
• Voltage support for trains so that the traction power system can support the desired train service levels more effectively.
EXECUTIVE SUMMARY

FEDERAL TRANSIT ADMINISTRATION 3
EXECUTIVE SUMMARY
• Emergency power to trains in traction power blackout situations—this is particularly valuable in tunnel environments where the requirements for safety evacuation of passengers are more demanding than in an open-track environment.
• Significant capital cost savings if a BPS can be installed in place of one or more traditional rectifier units.
• Where the site conditions do not permit installations of traditional rectifier units, a BPS may be a viable option.
Quantification of these additional benefits is dependent on the actual situation, and the realization of these benefits may significantly improve the ROI calculation results. This is consistent with the findings from a previously-published study by the Transit Cooperative Research Program [5]: an energy storage installation in a rail transit environment is most practical when it realizes more than one benefit simultaneously rather than focusing the application primarily on solving any one problem alone.

FEDERAL TRANSIT ADMINISTRATION 4
SECTION
1Introduction
The WMATA Metrorail System (Washington Metro) is the second busiest rapid transit system in the United States. The network is made up of 6 lines, including more than 117 route-miles of track and 91 passenger stations. The system map is shown in Figure 1-1.
Table 1-1Comparison of Scope of Volpe Report and
This Report
Figure 1-1Map of Washington Metrorail Network

FEDERAL TRANSIT ADMINISTRATION 5
At present, WMATA operates a mixture of 6-car and 8-car trains on its 6 lines. The Metro’s train fleet consists of 6 types of rail cars, numbered as 1000-series to-6000 series. New 7000-series cars are being tested and will be introduced into service in 2015.
The trains are powered by more than 100 traction-power substations across the network through a 3rd rail 700 V dc distribution system. There are also more than 100 tie-breaker stations. A tie-breaker station normally is located between two adjacent substations and provides an electrical connection of the two parallel third rails associated with the power supply to the inbound and outbound tracks, so that the two tracks can share the loads and thus minimize the voltage drops to the trains.
The traction power system consumes about 500,000 MWh (MegaWatt-hours) per year, at a cost of approximately $48 million. (As a comparison, the average annual electricity consumption for a U.S. residential utility customer is approximately 11 MWh in 2013, according to the U.S. Energy Information Administration [2]. The traction power system energy consumption is equivalent to 45,450 U.S. homes.)
All cars in operation are capable of regenerative braking, which has benefitted WMATA in energy saving and reduction in energy cost. As the amount of energy saving is dependent on the chances that trains demanding power are near trains that are generating power, a significant amount of energy is lost as heat dissipates to the surrounding environment by braking resistors. Therefore, there is a lot of potential to achieve more energy savings through the adoption of new technologies and innovations.
Furthermore, as the volume of passengers has steadily increased on the system over the years, WMATA has formulated strategic plans to meet the rising service demands by migrating to 8-car trains as a uniform standard and operating more frequent services in the future. Consequently, the traction power system needs to be upgraded to support the increased power demands.
Research has shown that wayside energy storage substations can help capture more regenerative braking energy and increase the amount of energy saving. They also can help reduce peak power demands and provide voltage support to trains. Installation of wayside storage substations also may help delay or defer some of the need for capital investment in the upgrade of the traction power system. However, since this technology is relatively new with limited operational history, WMATA decided to evaluate its effectiveness through a demonstration project.
WMATA conducted an extensive initial assessment of different wayside energy storage technologies, including flywheels, electrochemical capacitors, and batteries. Subsequently, WMATA focused on the battery technology. After discussions with several battery vendors, WMATA selected GIGACELL battery for this demonstration project.
SECTION 1: INTRODUCTION

FEDERAL TRANSIT ADMINISTRATION 6
SECTION
2Battery Power System (BPS) Technical Parameters and Installation
GIGACELL Battery TechnologyGIGACELL is a state-of-art high capacity Nickel-metal Hydride (Ni-MH) battery developed by Kawasaki Heavy Industries, Ltd [1]. It has the following features:
• High scalability – Bipolar 3D design increases both the number and capacity of cells
• Rapid charge and discharge – Low internal resistance enables fast charging and discharging capability
• Excellent cycle durability – Designed to withstand frequent cycles of short, rapid charging and discharging requirements
• Simplicity and safety – Low operating temperature, water-based electrolyte eliminates risk of fire
• Environment-friendly – No use of lead, mercury, cadmium, or other toxic materials
• Ease of recycling – Easy to disassemble for recycling since no welding is used
Based on the GIGACELL battery, Kawasaki has developed the BPS technology specifically for rail and transit applications. A number of demonstration and commercial installations have been in operation in the rail and transit environment, including Osaka Municipal Transportation Bureau, Tokyo Monorail, East Japan Railway, and New York City Subway.
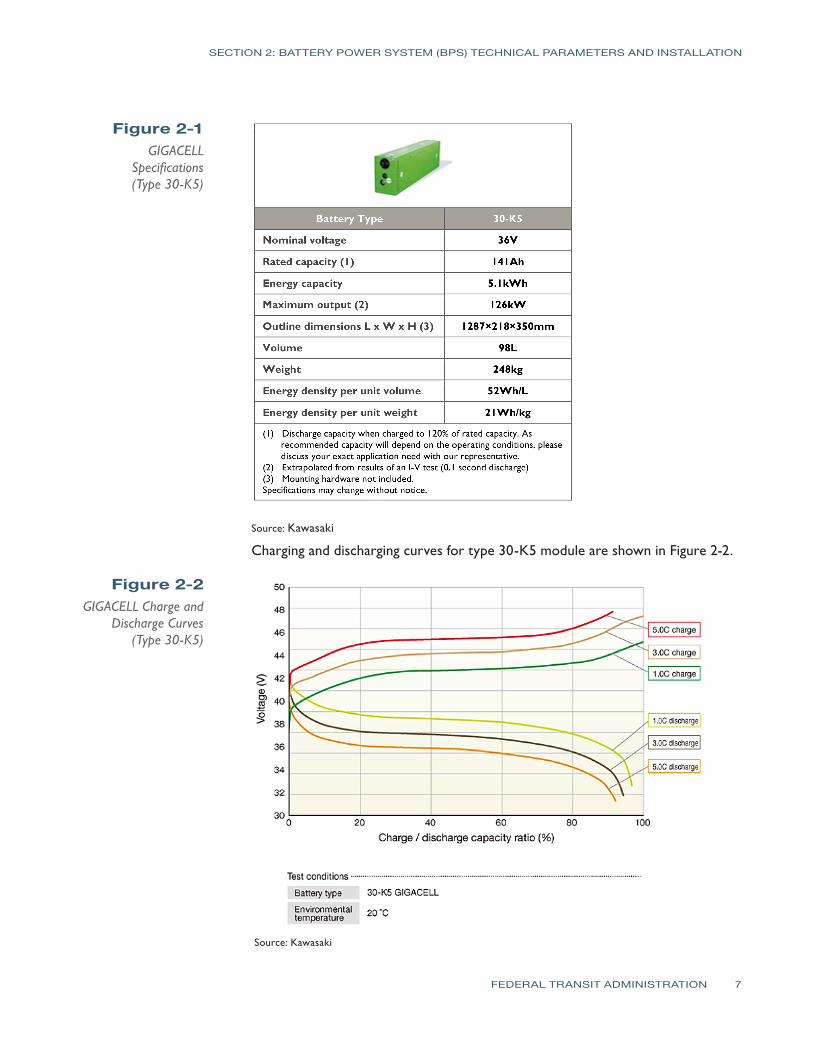
The fundamental element of the battery is a cell. Each individual cell has a nominal voltage of 1.2V. The cells are arranged in series to form a module. For the WMATA BPS installation, the Type 30-K5 module is used. This module has 30 cells connected in series, with a nominal voltage of 36V.
Specifications for the Type 30-K5 module are shown in Figure 2-1.
FEDERAL TRANSIT ADMINISTRATION 7
SECTION 2: BATTERY POWER SYSTEM (BPS) TECHNICAL PARAMETERS AND INSTALLATION
Figure 2-1GIGACELL
Specifications (Type 30-K5)
Source: Kawasaki
Charging and discharging curves for type 30-K5 module are shown in Figure 2-2.
Figure 2-2GIGACELL Charge and
Discharge Curves (Type 30-K5)
Source: Kawasaki
FEDERAL TRANSIT ADMINISTRATION 8
SECTION 2: BATTERY POWER SYSTEM (BPS) TECHNICAL PARAMETERS AND INSTALLATION
The modules can be arranged in series to form a unit to provide higher voltage levels. The units can be arranged in parallel to provide desired current rating and energy capacity.
BPS ParametersFor each module:
• Number of cells in series: 30
• Nominal voltage: 36 V
• Ampere-hour capacity: 141 Ah
• Battery current at 1C charge/discharge rate: 142 * 1 = 141 A
• Battery current at 5C charge/discharge rate: 141 * 5 = 705 A
• Energy capacity: 141 * 36 / 1000=5.076 kWh
For each unit:
• Number of full modules in series: 18 (30 cells in series for each module)
• Number of partial module in series: 1 (19 cells in series for this module)
• Total number of cells in series per unit: 18 * 30 +1 * 19 = 559 cells
• Nominal voltage per unit: 559 * 1.2 V = 670.8 V
• Energy capacity per unit: 5.076 kWh * (18+19/30) = 94.58 kWh
For the full BPS:
• Number of units in parallel: 4
• Power rating for full system (at 5C charge/discharge rate): 670.8 * 705 * 4 / 1000 = 1,892 kW or 2 MW
• Energy capacity of the full system: 94.58 * 4 = 378.33 kWh
BPS System InstallationThe BPS was installed in the West Falls Church substation located towards the west end of the Orange Line, as shown in Figure 2-3.
FEDERAL TRANSIT ADMINISTRATION 9
SECTION 2: BATTERY POWER SYSTEM (BPS) TECHNICAL PARAMETERS AND INSTALLATION
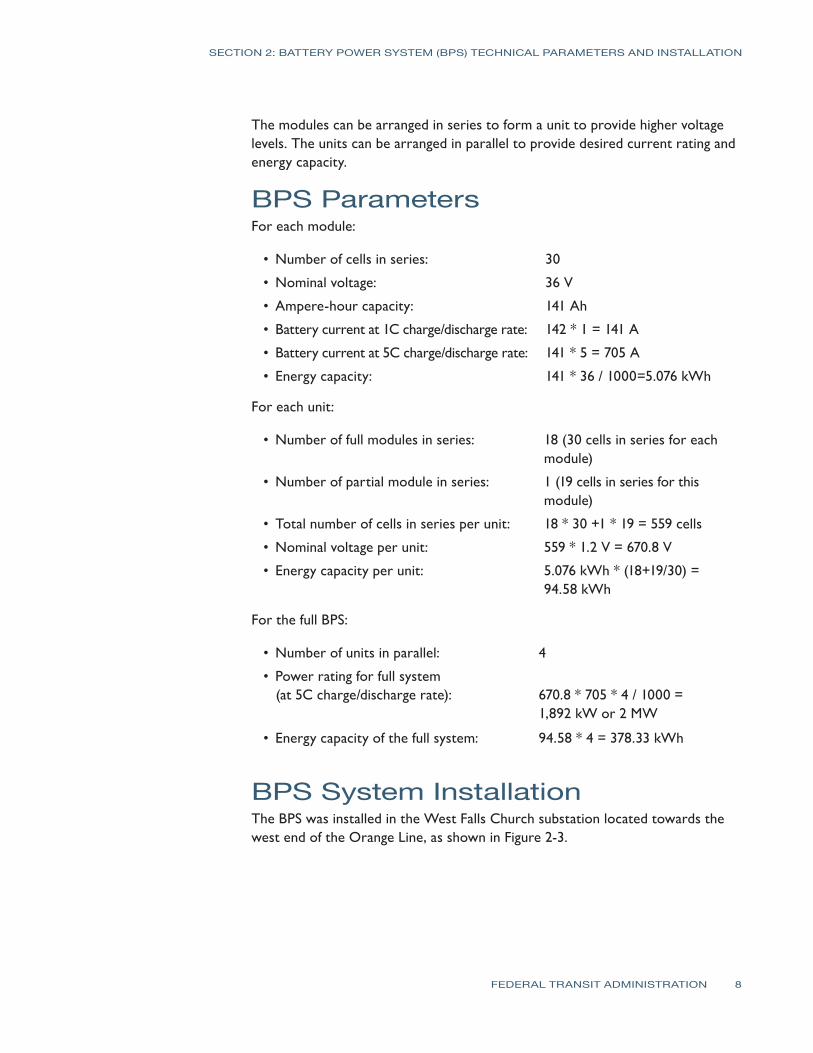
Figure 2-3System Map for West
End of Orange Line
The West Falls Church substation is near the West Falls Church station. It has four rectifier units; two feed the mainline tracks and two feed the yard tracks. The dc bus for the yard tracks is normally isolated from the dc bus for the mainline tracks. The BPS is connected to the dc bus for mainline tracks.
The two substations immediately adjacent to West Falls Church substation are Barbour Road substation (west of West Falls Church substation) and Fisher Street substation (east of West Falls Church substation), as shown in Figure 2-4.
Figure 2-4Simplified Electrical Single Line Diagram
The BPS was installed and put into service in June 2013. A photograph of the BPS installation is shown in Figure 2-5.
FEDERAL TRANSIT ADMINISTRATION 10
SECTION 2: BATTERY POWER SYSTEM (BPS) TECHNICAL PARAMETERS AND INSTALLATION
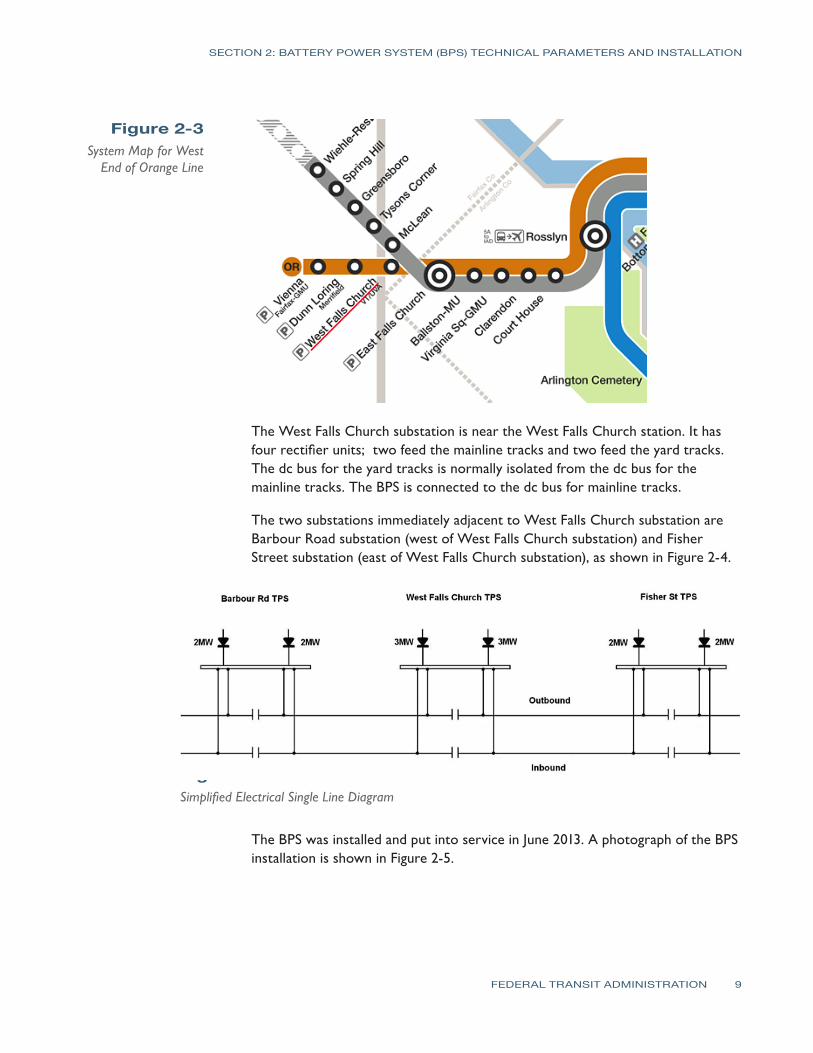
Figure 2-5System Installation on Concrete Pad in West
Falls Church Substation
Photo courtesy of Kawasaki
As shown in Figure 2-5, the BPS units are installed on a concrete pad outside of West Falls Church substation building. The concrete pad has an overall dimension of 24' x 50'. Of the three rows of cubicles shown in the photograph, the two outside rows have four BPS units and the center row has ancillary equipment, including high speed circuit breaker, cable terminations, etc.
A closer view of the two BPS units in the front row is shown in Figure 2-6.
Figure 2-6Two BPS Units
Photo courtesy of Kawasaki

FEDERAL TRANSIT ADMINISTRATION 11
SECTION 2: BATTERY POWER SYSTEM (BPS) TECHNICAL PARAMETERS AND INSTALLATION
An air-conditioning unit is installed on top of the cubicle for each BPS unit. Each air-conditioning unit has a thermal capacity of 56,000 BTU (16.4 kWh).
Inside each BPS unit cubicle, four stacks of battery modules are housed together with air circulation fixtures for temperature control. The cubicle panels are insulated. A partial view of the internal arrangement is shown in Figure 2-7.
Figure 2-7Battery Modules and
Air Circulation Fixtures inside a Unit
As shown in Figure 2-7, each of the four stacks can house up to five battery modules. In this particular installation, a total of 19 modules was installed, 18 of which have 30 cells each. The 19th module has 19 cells, making it a partial module (19/30, or ²/³). All battery modules within one unit are connected in series to yield the desired nominal voltage.
As part of the BPS installation, a battery monitoring system (BMS) also was installed inside the West Falls Church substation and is shown in Figure 2-8. A range of BPS parameters is monitored so that the BPS can be protected against fault conditions. These include battery temperature, pressure, cell voltage, etc.

FEDERAL TRANSIT ADMINISTRATION 12
SECTION 2: BATTERY POWER SYSTEM (BPS) TECHNICAL PARAMETERS AND INSTALLATION
Figure 2-8BMU inside West Falls
Church Substation
Photo courtesy of Kawasaki
A data acquisition and communications unit was installed inside the West Falls Church substation. This was mounted on the wall of the building, as shown in Figure 2-9.
Figure 2-9Data Acquisition and
Communications Cubicle

FEDERAL TRANSIT ADMINISTRATION 13
SECTION 2: BATTERY POWER SYSTEM (BPS) TECHNICAL PARAMETERS AND INSTALLATION
A range of data was recorded, including rectifier currents, dc bus voltage, BPS charge and discharge currents, etc. The recorded data can be accessed remotely and was downloaded regularly for analysis.
Similar data acquisition units were installed in the Barbour Road substation and the Fisher Street substation to record the substation data at those sites.

FEDERAL TRANSIT ADMINISTRATION 14
SECTION
3Test Results
BPS Test ScenariosA number of tests were conducted to evaluate the performance of the BPS. The test scenarios are shown in Table 3-1.
Table 3-1List of Scenarios and
Test Durations
Scenarios TestsRectifier Capacity
kW
BPS Capacity
kWStart Date End Date No. of
Days
AA-1 6,000 0 Monday, 10/21/13 Sunday, 10/27/13 7
A-2 6,000 2,000 Monday, 10/28/13 Sunday, 11/3/13 7
BB-1 3,000 0 Monday, 8/9/13 Sunday, 8/25/13 7
B-2 3,000 2,000 Monday, 8/26/13 Sunday, 9/1/13 7
CC-1 0 0 Monday, 9/9/13 Sunday, 9/15/13 7
C-2 0 2,000 Monday, 9/16/13 Sunday, 9/22/13 7
Note: For Scenario B, weekend data were not useable for energy saving calculation due to special single-track operation for engineering work unrelated to the BPS tests.
• Scenario A – West Falls Church substation with 6MW rectifiers• Scenario B – West Falls Church substation with 3MW rectifiers• Scenario C – West Falls Church substation without any rectifier, acting as a tie-breaker station
A summary of the collected data is listed in Table A-1 in Appendix A. This section summarizes the analysis results.
Energy SavingsFor the three test scenarios, the effects of the BPS on energy saving are shown in Table 3-2.
Table 3-2List of Scenarios and
Test Durations
Test Designation Scenario A Scenario B Scenario C
West Falls Church substation Rectifier Capacity (MW) 6 3 0
Energy Consumption –BPS Off (MWh) 8,897 N/A 8,731
Energy Consumption – BPS On (MWh) 8,255 N/A 7,383
Energy Saving (MWh) 642 N/A 1,347
Energy Saving (%) 7.2% N/A 15.4%
Note 1: Energy consumption figures are after corrections based on daily car counts.Note 2: Scenario B does not have complete data for annual energy consumption and energy saving calculations.
Peak Power ShavingFor the three test scenarios, the aggregated power from the three substations was calculated, and the peak power was derived. Peak power is defined as the maximum of 30-minute averages of power. (Each hour has 2 averages, making

FEDERAL TRANSIT ADMINISTRATION 15
48 averages in one day). The effects on peak power shaving are shown in Figures 3-1 and 3-2.
Figure 3-1Effects on Peak Power
Figure 3-2Effects on Peak Power Shaving
SECTION 3: TEST RESULTS
System Voltage ImprovementWhen there are one or more trains in regenerative braking mode, they feed power towards the traction power system when there are one or more trains nearby that demand power. The voltages at the regenerative trains are pushed higher as a result of the reverse power flow. If the voltage is too high, the regenerated power cannot be absorbed completely by other trains. The regenerative train will detect this excessive level of voltage and divert its excess power output to its onboard resistors. Therefore, the maximum voltage level is an indicator of how receptive the system is to absorbing the regenerated power. The higher the voltage above a certain threshold, the less receptive is the system.
FEDERAL TRANSIT ADMINISTRATION 16
SECTION 3: TEST RESULTS
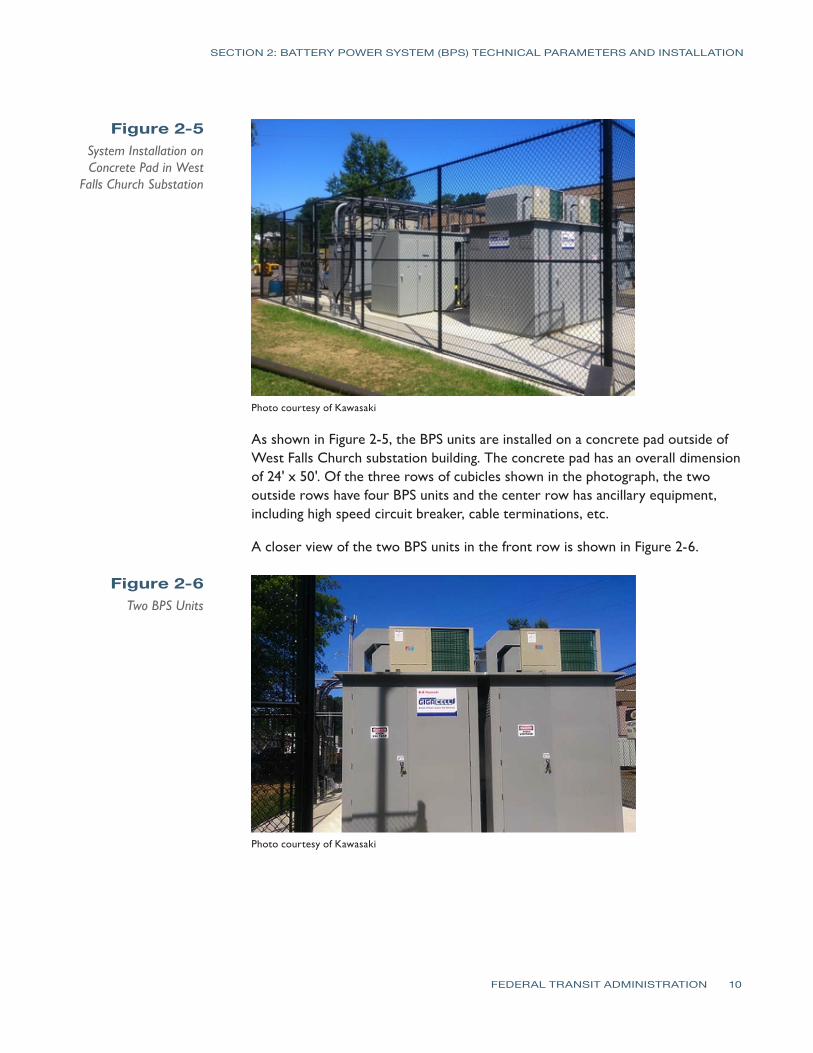
When the BPS is in operation, it helps absorb the excessive power by charging the batteries, thus helping the system receptivity and reducing the maximum voltage. The voltages at West Falls Church substation were recorded and compared, and the effects are shown in Figure 3-3 for the three test scenarios.
Figure 3-3Effects on Maximum Voltage Reduction at
West Falls Church Substation
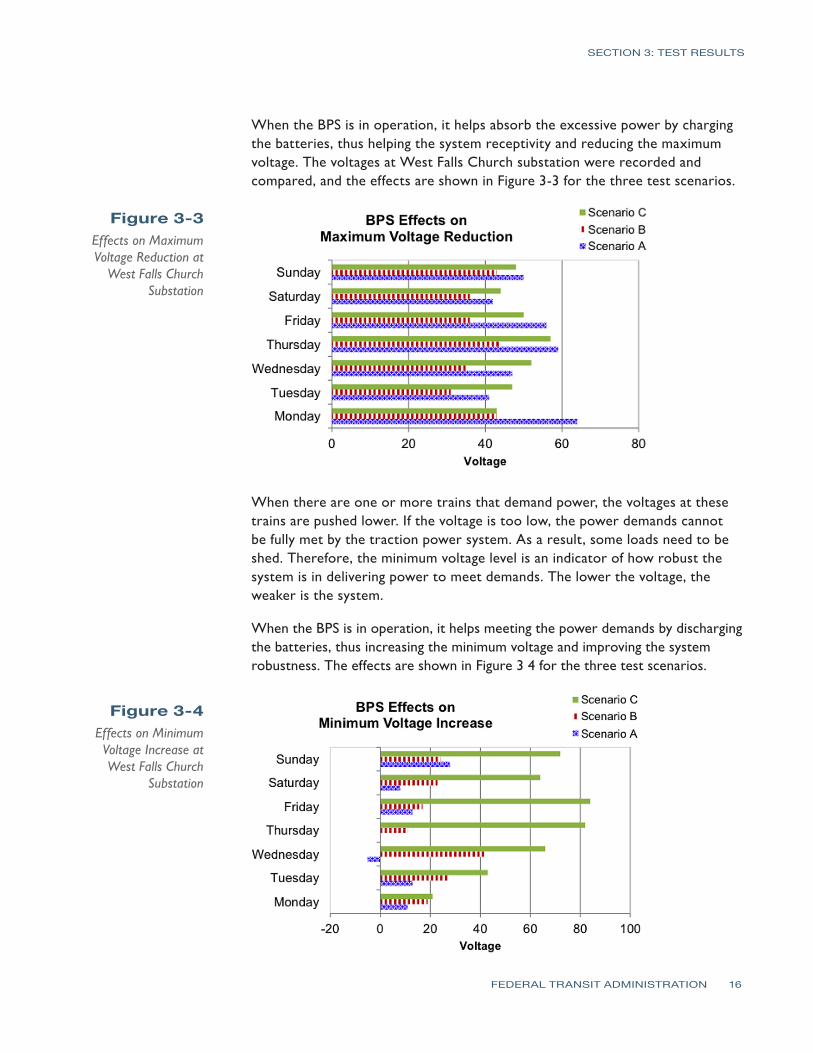
When there are one or more trains that demand power, the voltages at these trains are pushed lower. If the voltage is too low, the power demands cannot be fully met by the traction power system. As a result, some loads need to be shed. Therefore, the minimum voltage level is an indicator of how robust the system is in delivering power to meet demands. The lower the voltage, the weaker is the system.
When the BPS is in operation, it helps meeting the power demands by discharging the batteries, thus increasing the minimum voltage and improving the system robustness. The effects are shown in Figure 3 4 for the three test scenarios.
Figure 3-4Effects on Minimum Voltage Increase at West Falls Church
Substation

FEDERAL TRANSIT ADMINISTRATION 17
SECTION 3: TEST RESULTS
The above figures illustrate that the BPS has the effects of both maximum-voltage reduction and minimum-voltage increase. Combining these two, the overall effect is to stabilize the voltage levels more within a desired range. This overall effect is termed “voltage stabilization effect” in this report. For the three test scenarios, voltage stabilization is shown in Figure 3-5.
Figure 3-5Effects on Voltage
Stabilization at West Falls Church
Substation
Using BPS for Emergency PowerTo demonstrate the interaction between the BPS and trains under controlled conditions, a series of train tests was carried out between 11/5/13 and 11/7/13 in the track section between West Falls Church substation and Vienna Station. These included two tests that used the BPS as the sole source of power for train movements. These two tests and the results are summarized Table 3-3.
Table 3-3Summary of Test
Results – BPS as an Emergency Power
Source
Test # Test Description Consumed BPS SOC (%)
E1Train 1 accelerating to 10 mph and maintaining this speed; traveling a distance of 2,800’; Train 2 outside of feeding section
4.0%
E2Train 2 accelerating to 10 mph and maintaining this speed; traveling a distance of 2,800’; Train 1 remaining stationary and drawing auxiliary power only
6.4%
All trains are of 6-car trains at AW0 load, with mixed car types.
As shown in Table 3-3, Test E1 indicates that to move one 6-car train with empty cars (82,500 lb per car) from standstill by 2,800 feet at a maximum speed of 10 mph, 4% of the BPS full-charge energy is consumed. If the same train is on crush load (AW2 load with 175 passengers in each car), the energy consumption is as shown in Table 3-4.

FEDERAL TRANSIT ADMINISTRATION 18
SECTION 3: TEST RESULTS
Table 3-4Adjustment of Energy Consumption for Train Movements from Empty Train Load (AW0) to Crush Train Load (AW2)
Parameters AW0 Load (0 passengers)
AW2 Load (175 passengers
per car)Ratio AW2/AW0
AW0 load (lb/car) 82,500 82,500
Rotational allowance (% of AW0) 5% 5%
Rotational weight (lb/car) 4,125 4,125
Number of passengers per car 0 175
Passenger weight (lb/person) 154 154
Total passenger weight (lb/car) 0 26,950
Effective total weight (lb/car) 86,625 113,575 131.1%
BPS energy consumption (% of SOC) for moving a 6-car train by 2800’ 4.00% 5.24% Scaling based on
effective weight ratio
Number of trains that can be moved by 2800’ by using BPS at 100% SOC 25.0 19.1
Number of trains that can be moved by 4000’ by using BPS at 100% SOC 17.5 13.3
From this test and the calculations above, it can be seen that a fully-charged BPS can move 19 crush-loaded (AW2) 6-car trains by 2,800 feet in succession until the BPS energy is depleted, assuming that no other train draws power from the BPS at the same time.
If the required distance to move the train is different from 2,800 feet, the number of trains that can be moved can be calculated according to the proportion of 2,800 feet over the required distance. For example, to move the trains by 4,000 feet under the same condition, the number of AW2 loaded 6-car trains that can be moved by 4,000 feet is 13.
As illustrated in Test E2 results, stationary trains that draw auxiliary load from the BPS will impact the state of charge (SOC) of the BPS. The impact on the SOC of the BPS depends on how much power is being drawn and for how long. Consequently, the number of trains that can be moved by the BPS power will vary.
Summary of Train Test ResultsIn addition to the emergency power test described above, other tests were performed to prove the BPS effects on voltage stabilization BPS reception of regenerative power or current. Table 3 5 presents a summary of the voltage stabilization effects of the BPS.

FEDERAL TRANSIT ADMINISTRATION 19
SECTION 3: TEST RESULTS
Table 3-5Summary of Train Test Results – Voltage Stabilization by BPS
Test # Test Details Test Descrip-tions
Observed Parameters
Without BPS With BPS BPS Voltage
Stabilization (V)
V1Day 1 Test 1-1; Day 2 Test 1-2
1 train accelerating at
full powerVoltage drop (V) 60 56 4
V2Day 1 Test 2-1; Day 2 Test 2-2
1 train braking at full-service
brakingVoltage rise (V) 65 37 28
V3Day 1 Test 3-2; Day 2 Test 3-1
1 train accelerating and 1 train braking
Voltage variation (minimum to maximum)
120 82 38
V4 Day 3 Test 1-2; Day 3 Test 2-1
2 trains accelerating at
full power
Voltage variation (minimum to maximum)
218 143 75
V5
Day 3 Test 1A-1; Day 3 Test 2A-2
2 trains braking at full-service braking; WFC
rectifiers offline
Voltage rise (V) 59 28 31
Note: Track section between Barbour Rd substation and Fisher St substation was fed by West Falls Church substation only. Voltages were recorded in West Falls Church substation.
Table 3-6 presents a summary of the captured energy by the BPS from the regenerative train and the maximum charging currents.
Table 3-6Summary of Train Test Results – Reception of Regenerated Energy and Maximum Charging Current
Test # Test Details Test Descriptions Observed Parameters BPS Reception
R1 Day 1 Test 2-1; Day 2 Test 2-2
1 train braking at full service braking captured energy (kWh) 3.94
R2 Day 1 Test 3-2; Day 2 Test 3-1 1 train accelerating and 1 train braking captured energy (kWh) 1.40
R3 Day 3 Test 2A-2 2 trains braking at B5 mode captured energy (kWh) 7.74
R4 Day 3 Test 2B 2 trains braking at B3 mode captured energy (kWh) 8.91
R5 Day 2 Test 4 1 train braking at full-service braking in Dunn Loring Station (11,618’ from WFC)
maximum charging current (A) 820
R6 Day 2 Test 4 1 train braking at full service braking in Vienna Station (24,187’ from WFC)
maximum charging current (A) 304
Note: Track section between Barbour Rd substation and Fisher St substation was fed by West Falls Church substation only for tests R1 to R4. For tests R5 and R6, normal feeding arrangement was used.

FEDERAL TRANSIT ADMINISTRATION 20
SECTION 3: TEST RESULTS
Tests R5 and R6 demonstrate how far the BPS can reach to capture regenerative power in the traction power system. When the braking train was 11,618 feet (2.2 miles) away from the BPS, the BPS absorbed 820 Amps from the train (or 574kW at 700V). When the braking train was 24,187 feet (4.6 miles) away from the BPS, the BPS absorbed 304 Amps from the train (or 213 kW at 700V).

FEDERAL TRANSIT ADMINISTRATION 21
SECTION
4Return-on-Investment (ROI) Calculations
Potential Energy Cost SavingsBased on the annual energy savings listed in Table 3 2, the potential cost savings due to reduced energy consumption and reduced peak power demand were calculated for scenarios A and C.
Scenario AFor Scenario A, the potential cost savings due to reduced energy consumption under a range of electricity prices are listed in Table 4-1.
Table 4-1Potential Energy
Cost Savings – Scenario A
Cost ($/kWh) Year 1 Year 5 Year 10 Year 15 Year 20
$0.070 $44,965 $235,878 $501,454 $800,465 $1,137,122
$0.080 $51,388 $269,575 $573,090 $914,817 $1,299,568
$0.090 $57,812 $303,272 $644,726 $1,029,169 $1,462,014
$0.100 $64,236 $336,969 $716,362 $1,143,521 $1,624,460
$0.110 $70,659 $370,666 $787,999 $1,257,873 $1,786,906
$0.120 $77,083 $404,363 $859,635 $1,372,226 $1,949,351
$0.124 $79,652 $417,842 $888,289 $1,417,966 $2,014,330
$0.130 $83,506 $438,060 $931,271 $1,486,578 $2,111,797
$0.140 $89,930 $471,757 $1,002,907 $1,600,930 $2,274,243
$0.150 $96,353 $505,454 $1,074,544 $1,715,282 $2,436,689
$0.160 $102,777 $539,150 $1,146,180 $1,829,634 $2,599,135Note: Electricity cost escalated 2.4% per year; kWh savings per week = 12,353
Electricity cost varies widely according to geographical area. As of May 2015, the average electricity cost in the Washington, DC area was $0.124/kWh, according to a publication of U.S. Bureau of Labor Statistics [4]. This is shown in Figure 4-10.

FEDERAL TRANSIT ADMINISTRATION 22
SECTION 4: RETURN-ON-INVESTMENT (ROI) CALCULATIONS
Figure 4-1Average Prices for Electricity for Washington-Baltimore Area
Potential cost savings under the price of $0.124/kWh for the Washington/Baltimore are highlighted in bold in Table 4 -1.
The electricity cost increase of 2.4% per yer is the national average that is projected in a publication by the U.S. Energy Information Administration [3]. No projected data were found for regional cost increases.
The potential cost savings due to reduced peak power demand under different demand charges are illustrated in Table 4-2.
Table 4-2Potential Peak Power
Cost Savings – Scenario A
Cost ($/kW) Year 1 Year 5 Year 10 Year 15 Year 20
$5.00 $16,620 $87,186 $185,348 $295,869 $420,305
$10.00 $33,240 $174,371 $370,696 $591,738 $840,609
$15.00 $49,860 $261,557 $556,044 $887,607 $1,260,914
$20.00 $66,480 $348,743 $741,392 $1,183,476 $1,681,218
$25.00 $83,100 $435,928 $926,740 $1,479,345 $2,101,523Note: Electricity cost escalated 2.4% per year; peak power kW reduction = 277.
Peak power demand charges vary widely according to geographical area. As there are no peak power charges in the Washington, DC / Baltimore area, no cost savings from peak power reduction were counted in the ROI calculations in this report.
FEDERAL TRANSIT ADMINISTRATION 23
SECTION 4: RETURN-ON-INVESTMENT (ROI) CALCULATIONS
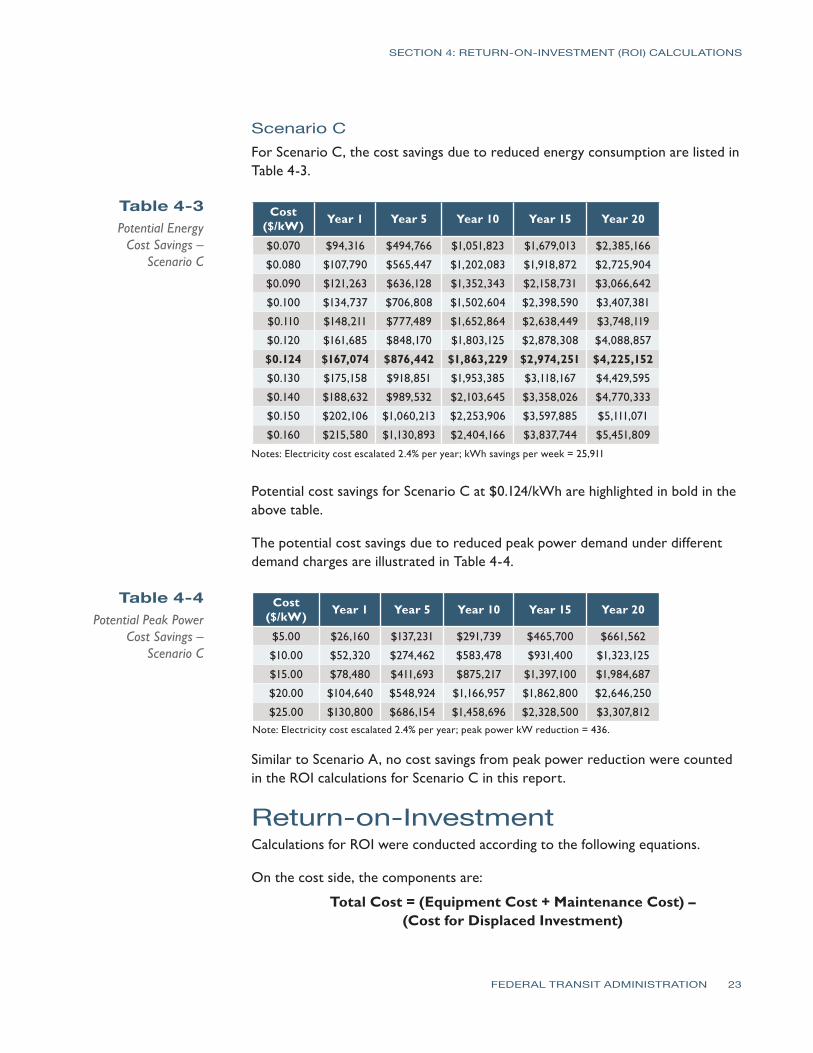
Scenario CFor Scenario C, the cost savings due to reduced energy consumption are listed in Table 4-3.
Table 4-3Potential Energy
Cost Savings – Scenario C
Cost ($/kW) Year 1 Year 5 Year 10 Year 15 Year 20
$0.070 $94,316 $494,766 $1,051,823 $1,679,013 $2,385,166
$0.080 $107,790 $565,447 $1,202,083 $1,918,872 $2,725,904
$0.090 $121,263 $636,128 $1,352,343 $2,158,731 $3,066,642
$0.100 $134,737 $706,808 $1,502,604 $2,398,590 $3,407,381
$0.110 $148,211 $777,489 $1,652,864 $2,638,449 $3,748,119
$0.120 $161,685 $848,170 $1,803,125 $2,878,308 $4,088,857
$0.124 $167,074 $876,442 $1,863,229 $2,974,251 $4,225,152
$0.130 $175,158 $918,851 $1,953,385 $3,118,167 $4,429,595
$0.140 $188,632 $989,532 $2,103,645 $3,358,026 $4,770,333
$0.150 $202,106 $1,060,213 $2,253,906 $3,597,885 $5,111,071
$0.160 $215,580 $1,130,893 $2,404,166 $3,837,744 $5,451,809
Notes: Electricity cost escalated 2.4% per year; kWh savings per week = 25,911
Potential cost savings for Scenario C at $0.124/kWh are highlighted in bold in the above table.
The potential cost savings due to reduced peak power demand under different demand charges are illustrated in Table 4-4.
Table 4-4Potential Peak Power
Cost Savings – Scenario C
Cost ($/kW) Year 1 Year 5 Year 10 Year 15 Year 20
$5.00 $26,160 $137,231 $291,739 $465,700 $661,562
$10.00 $52,320 $274,462 $583,478 $931,400 $1,323,125
$15.00 $78,480 $411,693 $875,217 $1,397,100 $1,984,687
$20.00 $104,640 $548,924 $1,166,957 $1,862,800 $2,646,250
$25.00 $130,800 $686,154 $1,458,696 $2,328,500 $3,307,812Note: Electricity cost escalated 2.4% per year; peak power kW reduction = 436.
Similar to Scenario A, no cost savings from peak power reduction were counted in the ROI calculations for Scenario C in this report.
Return-on-Investment Calculations for ROI were conducted according to the following equations.
On the cost side, the components are:
Total Cost = (Equipment Cost + Maintenance Cost) – (Cost for Displaced Investment)

FEDERAL TRANSIT ADMINISTRATION 24
SECTION 4: RETURN-ON-INVESTMENT (ROI) CALCULATIONS
Where the “Cost for Displaced Investment” represents the cost that may be needed for an alternative installation (such as a traditional rectifier) to achieve the same effects as the BPS installation. This cost is used as an offset item for the total cost that is needed for a BPS installation.
On the saving side, the components are:
Total Saving = (Energy Cost Saving) + (Peak Demand Power Cost Saving)
The ROI is obtained as:
ROI = (Total Saving – Total Cost) / (Total Cost ) × 100%
The equipment cost includes cost of installation. The cost for displaced investment includes equipment cost (including cost of installation) and maintenance cost.
ROI at 10 YearsThe calculations for ROI at 10 years for Scenario A are listed in Table 4-5.
Table 4-5ROI at 10 Years – Scenario A
Equipment Cost $500,000 $625,000 $730,000 $875,000 $1,000,000 $1,500,000 $2,000,000
Maintenance Cost $157,274 $157,274 $157,274 $157,274 $157,274 $157,274 $157,274
Total Cost $657,274 $782,274 $887,274 $1,032,274 $1,157,274 $1,657,274 $2,157,274
Savings
$0 -100% -100% -100% -100% -100% -100% -100%
$250,000 -62% -68% -72% -76% -78% -85% -88%
$500,000 -24% -36% -44% -52% -57% -70% -77%
$888,289 35% 14% 0% -14% -23% -46% -59%
$1,000,000 52% 28% 13% -3% -14% -40% -54%
$1,250,000 90% 60% 41% 21% 8% -25% -42%
$1,500,000 128% 92% 69% 45% 30% -9% -30%Note: Maintenance cost escalated at 2.0% per year.
The 2% cost escalation per year for maintenance is based on the best estimation for the general trend of labor cost inflation. This is because no official project data were available.
This table indicates that for Scenario A to be financially viable at 10 years (the break-event point), the equipment cost (offset by additional benefits and cost for displaced investment that are not yet quantified) needs be at or less than $730,000.

FEDERAL TRANSIT ADMINISTRATION 25
SECTION 4: RETURN-ON-INVESTMENT (ROI) CALCULATIONS
The calculations for ROI at 10 years for Scenario C are listed in Table 4-6.
Table 4-6Return on Investment at 10 Years – Scenario C
This table indicates that, for Scenario C to be financially viable at 10 years (i.e., the break-even point), the equipment cost (offset by additional benefits and cost for displaced investment that are not yet quantified) needs to at or less than $1,870,000.
ROI at 20 YearsThe calculations for ROI at 20 years for Scenario A are listed in Table 4-7.
Equipment Cost $1,000,000 $1,500,000 $1,750,000 $1,870,000 $2,000,000 $2,250,000 $2,750,000
Maintenance Cost $157,274 $157,274 $157,274 $157,274 $157,274 $157,274 $157,274
Total Cost $1,157,274 $1,657,274 $1,907,274 $2,157,274 $2,157,274 $2,407,274 $2,907,274
Savings
$0 -100% -100% -100% -100% -100% -100% -100%
$1,000,000 0% -33% -43% -47% -50% -56% -64%
$1,500,000 50% 0% -14% -20% -25% -33% -45%
$1,750,000 75% 17% 0% -6% -13% -22% -36%
$1,863,229 86% 24% 6% 0% -7% -17% -32%
$2,000,000 100% 33% 14% 7% 0% -11% -27%
$2,500,000 150% 67% 43% 34% 25% 11% -9%
Table 4-7Return on Investment at 20 Years – Scenario A
Equipment Cost $250,000 $410,000 $500,000 $750,000 $1,000,000 $1,500,000 $2,000,000
Maintenance Cost $1,594,403 $1,594,403 $1,594,403 $1,594,403 $1,594,403 $1,594,403 $1,594,403
Total Cost $1,844,403 $2,004,403 $2,094,403 $2,344,403 $2,594,403 $3,094,403 $3,594,403
Savings
$0 -100% -100% -100% -100% -100% -100% -100%
$1,000,000 -46% -50% -52% -57% -61% -68% -72%
$1,500,000 -19% -25% -28% -36% -42% -52% -58%
$2,014,330 9% 0% -4% -14% -22% -35% -44%
$2,250,000 22% 12% 7% -4% -13% -27% -37%
$2,500,000 36% 25% 19% 7% -4% -19% -30%
$2,750,000 49% 37% 31% 17% 6% -11% -23%
Note: Maintenance cost escalated at 2.0% per year; maintenance cost includes battery change at year 10.
This table indicates that for Scenario A to be financially viable at 20 years (the break-event point), the equipment cost (offset by additional benefits and cost for displaced investment that are not yet quantified) needs be at or less than $410,000.

FEDERAL TRANSIT ADMINISTRATION 26
SECTION 4: RETURN-ON-INVESTMENT (ROI) CALCULATIONS
The calculations for ROI at 20 years for Scenario C are listed in Table 4-8
Table 4-8Return on Investment at 20 Years – Scenario C
Equipment Cost $1,000,000 $1,500,000 $2,000,000 $2,500,000 $2,650,000 $2,750,000 $3,000,000
Maintenance Cost $1,594,403 $1,594,403 $1,594,403 $1,594,403 $1,594,403 $1,594,403 $1,594,403
Total Cost $2,594,403 $3,094,403 $3,594,403 $4,094,403 $4,244,403 $4,344,403 $4,594,403
Savings
$0 -100% -100% -100% -100% -100% -100% -100%
$1,000,000 -61% -68% -72% -76% -76% -77% -78%
$2,000,000 -23% -35% -44% -51% -53% -54% -56%
$3,000,000 16% -3% -17% -27% -29% -31% -35%
$4,000,000 54% 29% 11% -2% -6% -8% -13%
$4,225,152 63% 37% 18% 3% 0% -3% -8%
$5,000,000 93% 62% 39% 22% 18% 15% 9%
$6,000,000 131% 94% 67% 47% 41% 38% 31%
$7,000,000 170% 126% 95% 71% 65% 61% 52%Note: Maintenance cost escalated at 2.0% per year; Maintenance cost includes battery change at year 10.
This table indicates that for Scenario C to be financially viable at 20 years (the break-event point), the equipment cost (offset by additional benefits and cost for displaced investment that are not yet quantified) needs be at or less than $2,650,000.
Other BenefitsIn addition to energy cost savings, the BPS also will bring other benefits to the system owner, as follows:
• Voltage support for trains so that the traction power system can effectively support the desired train service levels.
• Emergency power to trains in traction power blackout situations—this is particularly valuable in tunnel environments where the requirements for safety evacuation of passengers are more demanding than open track environment.
• Significant capital cost savings if a BPS can be installed in place of one or more traditional rectifier units.
• Where the site conditions do not permit installations of traditional rectifier units.
Quantification of these additional benefits is dependent on the actual situation. The realization of these benefits may significantly improve the ROI calculation results. This is consistent with the findings from a previously-published study by

FEDERAL TRANSIT ADMINISTRATION 27
SECTION 4: RETURN-ON-INVESTMENT (ROI) CALCULATIONS
the Transit Cooperative Research Program [5]: an energy storage installation in a rail transit environment is most practical when it realizes more than one benefit simultaneously rather than focusing the application primarily on solving any one problem alone.

FEDERAL TRANSIT ADMINISTRATION 28
APPENDIX
ATable A-1Summary of Recorded Data
Summary of Recorded Data
FEDERAL TRANSIT ADMINISTRATION 28
Scenarios
Date
Substation Energy (kWh) BPS Discharge
Energy (kWh)
BPS Charge Energy (kWh)
Number of Cars per Day
Avg Temperature
(Deg. F)Test #WFC TPS
Status
BPS Status
Barbour Rd TPS
WFC TPS
Fisher St TPS
B1 3MW OFF
8/19/2013 8,589 9,726 10,106
n/a
1,962 70
8/20/2013 9,187 9,693 10,504 1,990 79
8/21/2013 8,975 10,279 10,983 1,916 81
8/22/2013 9,368 10,453 11,658 1,976 83
8/23/2013 9,755 10,135 10,809 1,996 73
8/24/2013 6,891 6,834 7,860 1,380 75
8/25/2013 6,242 6,517 7,349 1,230 74
B2 3MW ON
8/26/2013 8,564 9,505 11,153 2,642 2,851 1,958 77
8/27/2013Unscheduled Outage – East
Falls Church Substation Offline2,699 2,881 1,944 84
8/28/2013 9,102 9,822 11,201 2,925 3,083 2,066 79
8/29/2013 8,855 8,933 11,826 2,792 3,013 1,970 81
8/30/2013 8,705 9,115 11,120 2,820 3,005 1,978 80
8/31/2013Unscheduled Work - Single
Tracking2,098 2,235 454 83
9/1/2013Unscheduled Work – Single
Tracking2,135 2,187 458 83
C1 0 OFF
9/9/2013 12,850 0 14,269
n/a
1,982 73
9/10/2013 13,711 0 14,410 2,010 83
9/11/2013 12,695 0 15,139 1,990 85
9/12/2013 12,913 0 14,175 1,956 83
9/13/2013 12,955 0 14,323 2,002 72
9/14/2013 7,811 0 8,064 1,074 65
9/15/2013 7,397 0 7,188 956 66
C2 0 ON
9/16/2013 11,867 0 11,517 4,112 4,337 2,010 70
9/17/2013 11,710 0 11,830 4,227 4,506 2,024 63
9/18/2013 11,933 0 11,066 4,192 4,582 1,994 63
9/19/2013 12,071 0 11,360 4,210 4,580 1,944 67
9/20/2013 11,772 0 11,797 4,178 4,576 2,030 72
9/21/2013 4,645 0 5,336 2,826 3,173 750 72
9/22/2013 5,326 0 5,706 2,971 3,191 918 67
A1 6MW OFF
10/21/2013 6,738 11,526 9,010
n/a
1,908 57
10/22/2013 7,319 12,650 8,919 1,974 60
10/23/2013 7,344 11,090 9,080 1,982 54
10/24/2013 7,671 13,139 9,451 2,048 48
10/25/2013 7,379 11,524 9,982 2,028 48
10/26/2013 3,691 5,636 5,183 1,042 46
10/27/2013 3,339 5,565 4,860 966 53
A2 6MW ON
10/28/2013 6,160 10,053 8,704 2,555 2,685 1,942 55
10/29/2013 6,772 10,640 9,022 2,669 2,787 2,012 55
10/30/2013 6,763 10,720 8,899 2,791 2,925 1,980 59
10/31/2013 6,898 10,812 8,737 2,835 2,965 1,966 62
11/1/2013 6,398 11,616 8,567 2,696 2,840 1,956 67
11/2/2013 4,011 5,983 5,307 2,615 2,730 1,146 62
11/3/2013 4,360 6,340 5,642 2,619 2,746 1,224 52
Note: More data were collected in the summary months of 2014. However, the collected data showed significant inconsistency for the days covered. The inconsistency was caused by train service irregularities due to the introduction of test and service trains that run on the new Silver Line, which pass through the test section. It was, therefore, decided that these data were not usable.
FEDERAL TRANSIT ADMINISTRATION 29
CONTACTS FTAOffice of Technology, Room E43-4401200 New Jersey Ave SEWashington, DC 20590
Roy Chen, Transportation EngineerPhone: (202) 366-0462E-mail: [email protected]
WMATACENI-Office of Chief Engineer, Infrastructure4C-01600 5th St NWWashington, DC 20001
Moustapha Ouattara, Assistant Chief EngineerPhone: (202) 962-1023E-mail: [email protected]
Gannett Fleming Transit & Rail Systems85 Mechanic St, Suite E2-2Lebanon, NH 03766
J. Gordon Yu, Manager of Traction Power AnalysisPhone: (603) 448-4458 E-mail: [email protected]
Kawasaki Rail Car, Inc.29 Wells Ave, Building #4Yonkers, NY 10701
John Calvello, Marketing Sales Manager Phone: (914) 376-4700 ext. 4743E-mail: [email protected]

FEDERAL TRANSIT ADMINISTRATION 30
REFERENCES [1] Information about GIGACELL, available at http://www.khi.co.jp/english/gigacell/intro/index. html.
[2] Energy Information Administration, Information about Average U.S. Home Electricity Consumption, available at http://www.eia.gov/tools/faqs/faq.cfm?id=97&t=3.
[3] U.S. Energy Information Administration, Annual Energy Outlook 2015, Energy Prices, Electricity section (containing projection for price increases from 2013 to 2040 –reference case), available at http://www.eia.gov/forecasts/aeo/section_prices.cfm#elec.
[4] U.S. Bureau of Labor Statistics, Average Energy Cost in Washington/Baltimore Area, available at http://www.bls.gov/regions/mid-atlantic/news-release/averageenergyprices_ washingtondc.htm.
[5] Transit Cooperative Research Program, “Guiding the Selection and Application of Wayside Energy Storage Technologies for Rail Transit and Electric Utilities," TCRP Web-only document 51, November 2010), available at http://onlinepubs.trb.org/ onlinepubs/tcrp/tcrp_webdoc_51.pdf.

FEDERAL TRANSIT ADMINISTRATION 31 FEDERAL TRANSIT ADMINISTRATION 128
U.S. Department of TransportationFederal Transit AdministrationEast Building1200 New Jersey Avenue, SEWashington, DC 20590http://www.fta.dot.gov/research
U.S. Department of TransportationFederal Transit AdministrationEast Building1200 New Jersey Avenue, SEWashington, DC 20590http://www.fta.dot.gov/research