within-seasonyieldpredictionwithdifferent...
TRANSCRIPT
Research ArticleReceived: 27 May 2015 Revised: 3 September 2015 Accepted article published: 18 September 2015 Published online in Wiley Online Library:
(wileyonlinelibrary.com) DOI 10.1002/jsfa.7467
Within-season yield prediction with differentnitrogen inputs under rain-fed condition usingCERES-Wheat model in the northwest of ChinaZhengpeng Li,a,b† Mingdan Song,a,b† Hao Fenga,b,c* and Ying Zhaob,d*
Abstract
BACKGROUND: Yield prediction within season is of great use to improve agricultural risk management and decision making. Theobjectives of this study were to access the yield forecast performance with increasing nitrogen inputs and to determine whenthe acceptable predicted yield can be achieved using the CERES-Wheat model.
RESULTS: the calibrated model simulated wheat yield very well under various water and nitrogen conditions. Long-termsimulation demonstrated that nitrogen input enlarged the annual variability of wheat yield generally. Within-season yieldprediction showed that, regardless of nitrogen inputs, yield forecasts in the later growing season improved the accuracy andreduced the uncertainty of yield prediction. In a low-yielding year (2011–2012) and a high-yielding year (1991–1992), the dateof acceptable predicted yield was achieved 62 and 65 days prior to wheat maturity, respectively. In a normal-yielding year(1983–1984), inadequate precipitation after the jointing stage in most historical years led to the underestimation of wheat yieldand the date of accurate yield prediction was delayed to 235–250 days after simulation (7–22 days prior to maturity) for differentN inputs.
CONCLUSION: Yield prediction was highly influenced by the distribution of meteorological elements during the growing seasonand may show great improvement if future weather can be reliably forecast early.© 2015 Society of Chemical Industry
Keywords: yield forecast; nitrogen; precipitation distribution; forecast accuracy; CERES-Wheat model
INTRODUCTIONYield prediction is of great use to improve agricultural risk man-agement and decision making.1 Reliable yield forecast would assistagricultural producers with preseason and within-season manage-ment decisions, such as the dose and timing of inputs (e.g. irri-gation, pesticide and fertilizer).2 Agricultural marketing agenciescould also use yield prediction to enable more efficient manage-ment of grain production, handling and marketing.
Methods of predicting crop yield range from statisticalapproaches3,4 to crop simulation models.1,5 – 7 The dynamicnature of crop simulation models make them preferable to sta-tistical models. Therefore, the use of crop simulation models forpredicting crop yield as a function of weather has been studiedextensively.8 All These applications incorporate crop-specificmodelling using actual weather conditions up to the forecast dateand project crop yield based on likely future weather conditions.The largest error source in the yield prediction comes from thelack of knowledge of future weather. Using historical weatherand weather from a generator are the two main approaches toestimate future weather conditions. Many researchers1,6,7 usedhistorical weather, considering that it is more realistic than simu-lated data and contains all the interrelationships among climatevariables. For example, Chipanshi et al.1 utilized CERES-Wheatto make within-season yield predictions at three locations inSaskatchewan, Canada, and used historical weather data to pro-vide an estimate of future weather condition. Quiring and Legates7
used CERES-Maize to predict corn yield during the growing seasonin Delaware, USA, in which observed weather data were combinedwith historical weather data to provide 30 realizations of futureweather conditions. In contrast, some simulations were conductedwith generated weather. Bannayan et al.5 used CERES-Wheat anda weather generator to make within-season yield forecasts atfour sites in the UK. Dumont et al.9 compared two methods offorecasting yield within season: one was based on a statistical
∗ Correspondence to: Hao Feng, No. 22 Xinong Road, Northwest A&F Univer-sity, Yangling, Shaanxi Province 712100, China. E-mail: [email protected];or Ying Zhao, Colleage of Natural Resources and Environment, North-west A&F University, Yangling, Shaanxi Province 712100, China. E-mail:[email protected]
† These authors contributed equally to this study and share first authorship.
a Institute of Soil and Water Conservation, State Key Laboratory of Soil Erosionand Dryland Farming on the Loess Plateau, Northwest A&F University, Yangling,Shaanxi 712100, China
b Institute of Water Saving Agriculture in Arid Areas of China, Northwest A&FUniversity, Yangling, Shaanxi 712100, China
c Institute of Soil and Water Conservation, Chinese Academy of Sciences andMinistry of Water Resources, Shaanxi 712100, China
d College of Natural Resources and Environment, Northwest A&F University,Yangling Shaanxi, 712100, China
J Sci Food Agric (2015) www.soci.org © 2015 Society of Chemical Industry
www.soci.org Zhengpeng Li et al.
weather generator, another on averaged historical weather data.The results showed that both methods obtained a similar accuracyof yield prediction. Yield forecast has been performed at differentspatial scales ranging from farm level1,5 to regional level.7,10
CERES (Crop Estimation through Resource and EnvironmentSynthesis)-Wheat11 – 13 is a process-based crop model with soil,weather and field management modules and can simulate wheatgrowth, development and yield and soil water and nitrogendynamics. Under certain soil and weather condition, wheat yieldwas determined largely by irrigation and fertilization.14 TheCERES-Wheat model has been evaluated and applied to opti-mizing water and nitrogen management in many parts of theworld.14 – 17 Arora et al.15 calibrated and validated CERES-Wheatusing a 5-year water and nitrogen field experiment in India, andfound that the performance of the model was reasonable, with anormalized root mean square (nRMSE) of 10–20% and nitrogenhaving a larger effect on yield than on evaporation. Singh et al.14
compared the performance of CERES-Wheat and CropSyst modelson simulating yield and biomass under various water and nitro-gen treatments. The results showed that CERES-Wheat simulatedcrop yield satisfactorily, with an R2 of 0.88, and the biomass wasunderestimated with different nitrogen applications. This modelalso has been validated and applied in northwest of china andshowed that the model was reasonable in assessing and opti-mizing winter wheat yield with respect to irrigation and nitrogenapplications as well as other influential factors.16,17 For a certaincultivar, growth performance is the consequence of climate andmanagement factors. The effect of weather fluctuation on cropgrowth is influenced by different management measures.
Although there have been many studies on CERES-Wheat modelcalibration, evaluation of management practices and yield pre-diction, there are few studies concerning the performance of thismodel’s within-season prediction in different weather years, espe-cially under various cultural practices (e.g. irrigation and nitrogen).The objectives of this study were: (i) to calibrate and evaluate theability of the CERES-Wheat model to simulate phenology, yield andbiomass under different water and nitrogen managements; (ii) toanalyze yield forecast performance with different nitrogen fertil-izer inputs in low, normal and high-yielding years using a com-bination of antecedent weather data up to the forecast date andhistorical weather records for the remainder of the growing sea-son; and (iii) to determine when the acceptable predicted yield canbe achieved.
MATERIAL AND METHODSExperimental designThe field experiment was conducted during the period 2011–2013at the Irrigation Station of Northwest A&F University, in Yangling,Shaanxi Province of China (108∘ 15′ E, 34∘ 15′ N; 500 m abovesea level). The study site is located in a temperate continentalmonsoon climate zone with a mean annual temperature of 13.0 ∘Cand a mean annual precipitation of 600 mm, falling mainly fromJune to September. The soil at the site is a silt loam (Eum-OrthicAnthrosol) derived from loess materials.
The experiment adopted a split-plot design with the irrigationfactor as main plot and the nitrogen factor as subplot withineach main plot. The irrigation levels were no irrigation (I0), singleirrigation at 46 mm at the jointing stage (I1) and twice irrigation at46 mm at the overwintering and jointing stages, respectively (I2).The irrigation method was furrow irrigation. The nitrogen levelsincluded 0, 105, 210 and 310 kg ha−1 nitrogen application in the
whole growth period. All treatments were conducted with threereplicates. Each plot was 3 m wide and 6 m long.
The ratio of the amount of basal N applied at planting to theamount of side-dress N was 7:3 in all treatments. The side-dress Nwas broadcast evenly in each plot at the jointing stage. SufficientP and K fertilizers were applied at planting. The wheat varietyXiaoyan 22 of winter wheat (Triticum aestivum L.) was sown at arate of 350 seeds ha−1 on 19 October 2011 and 14 October 2012,respectively. Disease, weed, and pest infestation were controlledduring the experimental period to avoid other factors except waterand nitrogen influencing the yield. A standard sampling procedurewas used during the growing season. During 2011–2013, thedates of the different Zadoks growth stages,18 i.e. anthesis (Z60)and maturity (Z94), were recorded. At harvest, grain yield andbiomass yield were determined by manually harvesting two 1 m2
areas selected randomly from each plot. All samples of wheatwere dried in an oven at 105 ∘C for 1 h and then at 75 ∘C toconsistent weight. Wheat was harvested on 5 June 2012 and2 June 2013.
Description of CERES-WheatCERES-Wheat, part of the DSSAT (Decision Support System forAgrotechnology Transfer) Version 4.5 crop systems model, wasselected to simulate wheat yield since it is one of the oldest,most advanced and most widely used crop simulation models.19
The CERES-Wheat model simulates wheat growth, water and soilnitrogen dynamics at the field scale.20
The input data required for CERES-Wheat include weather andsoil conditions, plant characteristics and crop management.21 Therequired minimum weather variables for DSSAT are daily solarradiation (MJ m−2), daily maximum and minimum air tempera-ture (∘C) and daily precipitation (mm).22 The daily weather datawas collected from the meteorological station, which is about100 m away from the experiment field. Daily solar radiation wasestimated from the observed sunshine duration by Ångstrom’smethod.23 Soil input data were derived from the China Soil Scien-tific Database (CSSD) (http://www.soil.csdb.cn/page/index.vpage).Soil inputs include drainage and runoff coefficients, first-stageevaporation, soil albedo of soil profile and physicochemicalcharacteristics for each soil layer including the soil texture (per-centage sand, silt and clay), organic content, wilting point, fieldcapacity, and so on. The initial soil water content and NO3
−N andNH4
+N content of each layer were measured on the first day ofmodel simulation. The physical and chemical characteristics ofthe experimental soil are shown in Table 1. The crop managementinput information includes seeding density, date of planting,date and application rate of irrigation and fertilizer. CERES-Wheatdetermines yield using seven genetic coefficients that differ byvariety. Accurate simulation of yield requires the correct geneticcoefficients.
Model calibration and evaluationBefore using a crop model for any application, it is essential to spec-ify cultivar coefficients. Cultivar coefficients should be calibratedunder local weather and soil conditions to achieve the observedphenology, grain yield or biomass under ‘optimal’ growing con-dition in which water, heat and nutrient stresses are as low aspossible.24 In this study, the data from the experiment conductedduring the 2011–2012 growing season were used to calibrate themodel (the grain yield in which season was much higher becauseof the more fertile soil in the first experiment year), and the data
wileyonlinelibrary.com/jsfa © 2015 Society of Chemical Industry J Sci Food Agric (2015)

Yield prediction with different nitrogen inputs CERES-Wheat model in northwest China www.soci.org
Table 1. Physical and chemical properties of experimental soil
Depth (cm) Sand (%) Silt (%) Clay (%) SLLL (v/v) SDUL (v/v) SSAT (v/v)Total nitrogen
(g kg−1)
23 15.9 52.0 32.1 0.15 0.33 0.46 1.235 13.7 54.2 32.1 0.15 0.33 0.46 0.774 12.5 56.5 31.0 0.15 0.36 0.49 0.595 12.3 49.2 38.5 0.16 0.35 0.49 0.5163 11.1 48.8 40.1 0.16 0.38 0.48 0.5196 14.2 47.0 38.8 0.15 0.39 0.49 0.5250 17.9 60.5 21.6 0.16 0.38 0.48 0.3
Soil albedo= 0.13; whole profile drainage rate= 0.60; Runoff curve numbers= 61.SLLL, soil lower limit; SDUL, soil drained upper limit; SSAT, soil saturated upper limit.
from the experiment conducted during the 2012–2013 growingseason were used for model evaluation. The wheat cultivar coeffi-cients (Table 2) were calibrated using the Generalized LikelihoodUncertainty Estimation (GLUE)25 built-in DSSAT model to obtainthe minimum RMSE between simulated and observed phenology,yield and biomass. The detailed estimation procedure refers to thearticle by Jones et al.25
In this study, the performance of the model was evaluated witha number of statistics: RMSE, nRMSE, coefficient of determination(R2) and index of agreement (d).26 A detailed discussion on how tocalculate and utilize these statistics can be found in the article byLegates and McCabe.27
Yield prediction approachFollowing model calibration and evaluation, the CERES-Wheatmodel was employed to perform within-season yield predictionwith different nitrogen inputs under rain-fed conditions. Historicaldaily weather data during years 1980–2012 was used as futuredata for yield prediction in this study. At each forecast date, themean of the simulated yield based on 31 future weather scenarios,which was generated from the combination of actual weatherdata up to the forecast date and historical weather data for theremainder, was considered as the predicted yield. By repeatingthis procedure, the predicted yield changed with more observedweather involved. The predicted yields were validated againstthe simulation with full season observed weather data, referredto as ‘actual yield’ in the following sections. Yield forecasts wereperformed every 20 days before overwintering and after thatevery 5 days in each sample year. The first yield forecast wasconducted from the start of the simulation, i.e. 12 days beforesowing. This process was undertaken for three sample growingseasons, representing low-, normal- and high-yielding growingseasons. Rain-fed yield with five nitrogen input levels (0, 50,100, 150, 200 kg ha−1) were simulated under 32-year (1980–2012)historical weather scenarios. The three sample years were selectedfrom the first, second and third quartiles of ranked simulatedyield with 32-year full season historical weather under rain-fedconditions with sufficient N supply. The impact of five nitrogeninput levels on the yield forecast performance was evaluated ineach sample year.
To eliminate the effect of other factors on the yield forecast, allsimulations were set at a standard sowing date (13 November)under rain-fed conditions with all N applied as basal fertilizer.All simulations started from 1 November with an initial nitrogenamount of 72.6 kg ha−1 in the 0–100 cm soil profile. In addition,initial soil water content was set at field capacity in all soil layers.
RESULTSModel calibration and evaluationThe cultivar coefficients (presented in Table 2) of the wheat varietyXiaoyan 22 were derived from the measured data in 2011–2012using the GLUE tool in the DSSAT model. After 6000 times of modelrun, which is the allowable maximum number by GLUE tool. Themodel consistently overestimated the grain yield of lower nitro-gen treatments. The ecotype parameter GN%MN (minimum grainN, %) from 0 to 2 resulted in a relatively more accurate simula-tion of yield for all nitrogen treatments, especially grain yield inN0 treatment.
In the model, the anthesis date and maturity date are deter-mined by degree day, which is related only to temperature,while water and nitrogen stress have no effect on wheat phenol-ogy, so the simulated anthesis and maturity date are the samein all treatments. This is consistent with observed anthesis andmaturity date in all irrigation and nitrogen treatments. The errorbetween simulated and observed anthesis and maturity date were3 and 2 days in 2011–2012, and 1 and 0 days in 2012–2013,respectively.
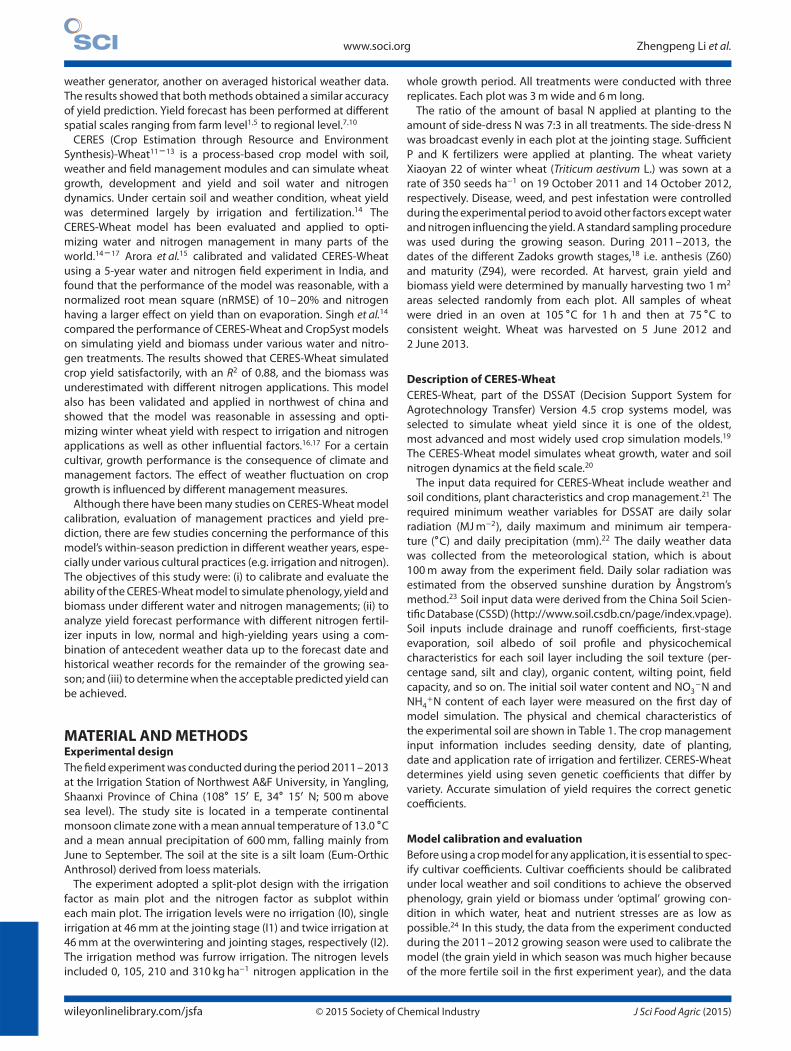
Using the calibrated cultivar coefficients, the simulated grainyields were in good agreement with the observed data andexcellent statistics were achieved for the calibration year (i.e.RMSE= 400 kg ha−1, nRMSE= 5.4%, R2 = 0.91, d = 0.94) (Fig. 1a). In2011–2012, the experimental biomasses obtained were fairly high(ranging from 12 to 18 t ha−1), and the biomass affected by dif-ferent irrigation and nitrogen treatments was close to each other(Fig. 1b). This was mainly due to good initial soil conditions andadequate N rates. The above-ground biomass simulation was goodor excellent, with R2
> 0.5 and nRMSE< 10% according to the cri-teria by Parajuli et al.28 and Jamieson et al.,29 respectively. In addi-tion, a Spearman’s rank correlation coefficient of 0.7 indicated thatthe simulated biomass responded correctly to the treatment differ-ences. Simulated biomass for various irrigation and nitrogen treat-ments was, in general, acceptable when compared with measuredbiomass at maturity based on the statistics used. As there was aclose agreement between the simulated and observed data, thecultivar coefficients of variety Xiaoyan 22 were successfully cali-brated for the study area.
In the evaluation year (2012–2013), the simulated grain yieldswere similar to the observed data, with RMSE, nRMSE, R2 and d val-ues of 606 kg ha−1, 10.9%, 0.91 and 0.95, respectively (Fig. 1c). Theslightly higher simulated yield without nitrogen input resulted inhigher values of RMSE and nRMSE than that in 2011–2012. Thesimulated above-ground biomass at maturity had good agree-ment with regard to observed evaluation data, with RMSE, nRMSE,
J Sci Food Agric (2015) © 2015 Society of Chemical Industry wileyonlinelibrary.com/jsfa

www.soci.org Zhengpeng Li et al.
Table 2. Genetic coefficients used by CERES-Wheat for simulating growth of variety Xiaoyan 22
Coefficient Description of genetic coefficient Value
P1V Days at optimum vernalizing temperature required to complete vernalization 50P1D Percentage reduction in development rate in a photoperiod 10 h shorter than the threshold relative to that at the
threshold80.6
P5 Grain filling (excluding lag) phase duration (∘C.d) 596G1 Kernel number per unit canopy weight at anthesis (#/g) 15G2 Standard kernel size under optimum conditions (mg) 50G3 Standard, non-stressed dry weight (total, including grain) of a single tiller at maturity (g) 2.42PHINT Interval between successive leaf tip appearances (∘C.d) 80GN%MN Minimum grain N (%) 2
R2 and d values of 1575 kg ha−1, 14.4%, 0.71 and 0.88, respectively(Fig. 1d).
To sum up, although biomass was simulated with a relativelylarger error compared with yield by the CERES-Wheat model,which had been reported by some researchers,5,30 the modelreflected grain yield and above-ground biomass accurately invarious water and nitrogen treatments using the calibrated cultivarcoefficients of variety Xiaoyan 22. Therefore, the model couldbe used to predict wheat yield under different precipitation andnitrogen conditions.
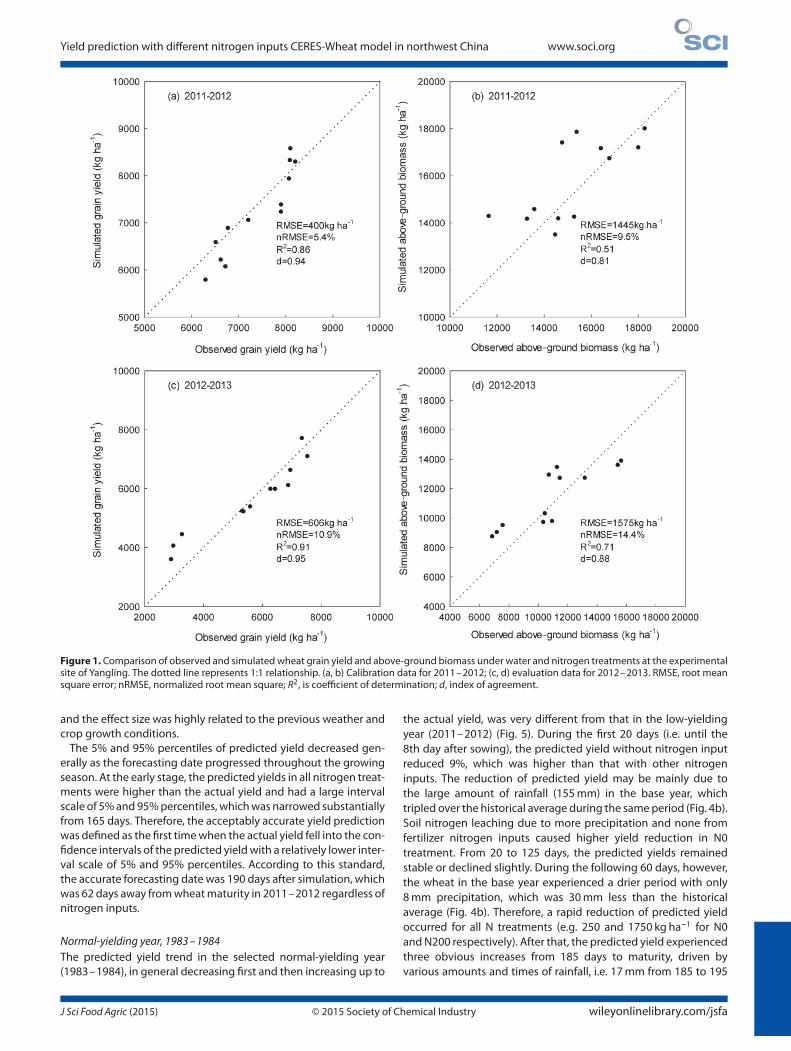
Interannual yield variability under rain-fed conditionBefore yield forecast, the interannual variability and cumulativedistributions of simulated yield with five nitrogen input levels (0,50, 100, 150, 200 kg ha−1) during 1980–2012 are shown in Fig. 2.Generally, the nitrogen input increased the wheat yield signifi-cantly and enlarged the annual variability of wheat yield as well.For example, yields with 0 and 200 kg N ha−1 were 2780± 421(average± SD, same below) and 7312± 1693 kg ha−1, respectively.Yields with 0, 50 and 100 kg N ha−1 were significantly lower thanthe yield with 150 and 200 kg N ha−1 during the 32 growing sea-sons (Fig. 2b). In over half the 32 growing seasons, no further yieldwas gained with a nitrogen input of 200 kg ha−1 compared with150 kg ha−1, indicating that N200 was sufficient for crop growth inmost years.
Three sample years corresponding to the first, second and thirdquartile of ranked yield with 200 kg ha−1 nitrogen input, repre-senting low- (2011–2012), normal- (1983-1984) and high-yielding(1991–1992) years, respectively, were selected as the base yearfor yield prediction. The cumulative probability curve under N0condition was almost parallel to that under N50 condition, show-ing that the yield gap was almost identical in all years. This fur-ther demonstrated that the yield response to weather was simi-lar for N0 and N50. For illustration purposes, only yield predictionunder N0, N100, N150 and N200 conditions are presented in thefollowing section.
Yield forecast performanceAt each forecast date, the mean with 95% confidence intervaland standard deviation of simulated yields based on 31 futureweather scenarios were calculated. 5% and 95% percentiles forsimulated yield distribution were also estimated in order to showthe simulated yield range. The mean of the yield distribution inthe following section was referred to as predicted yield. Thesevalues were plotted against the number of observed weather days.Yield forecasts in the three selected sample years were analyzed asfollows.
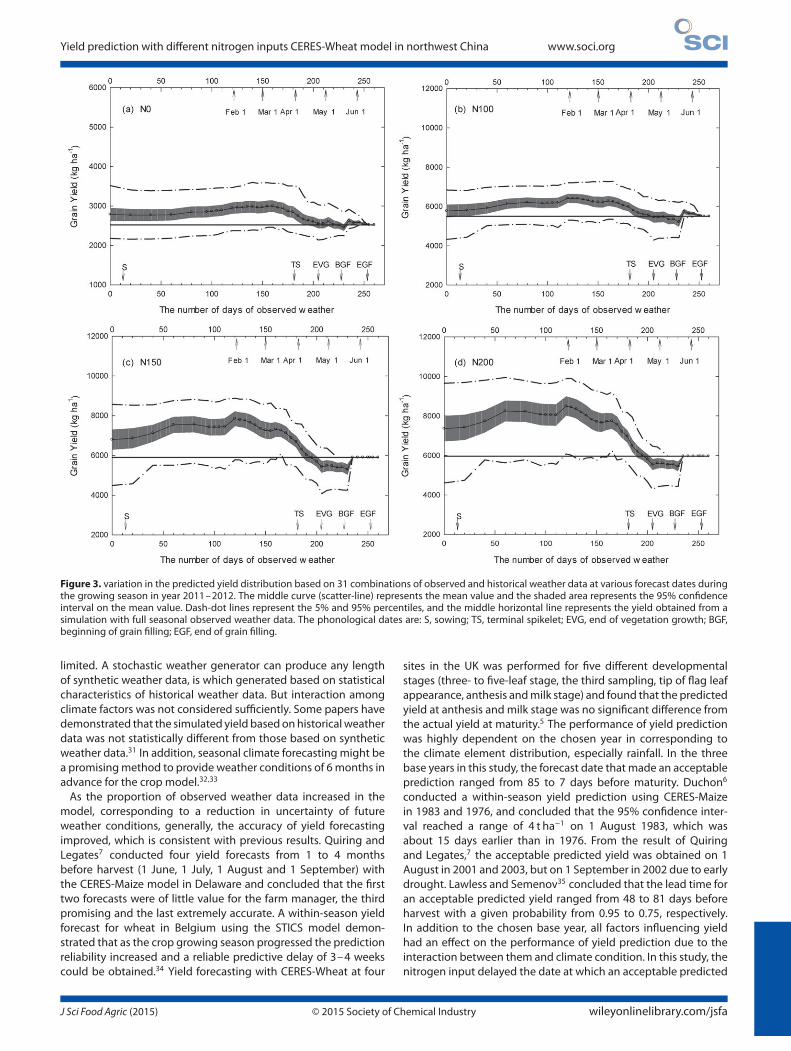
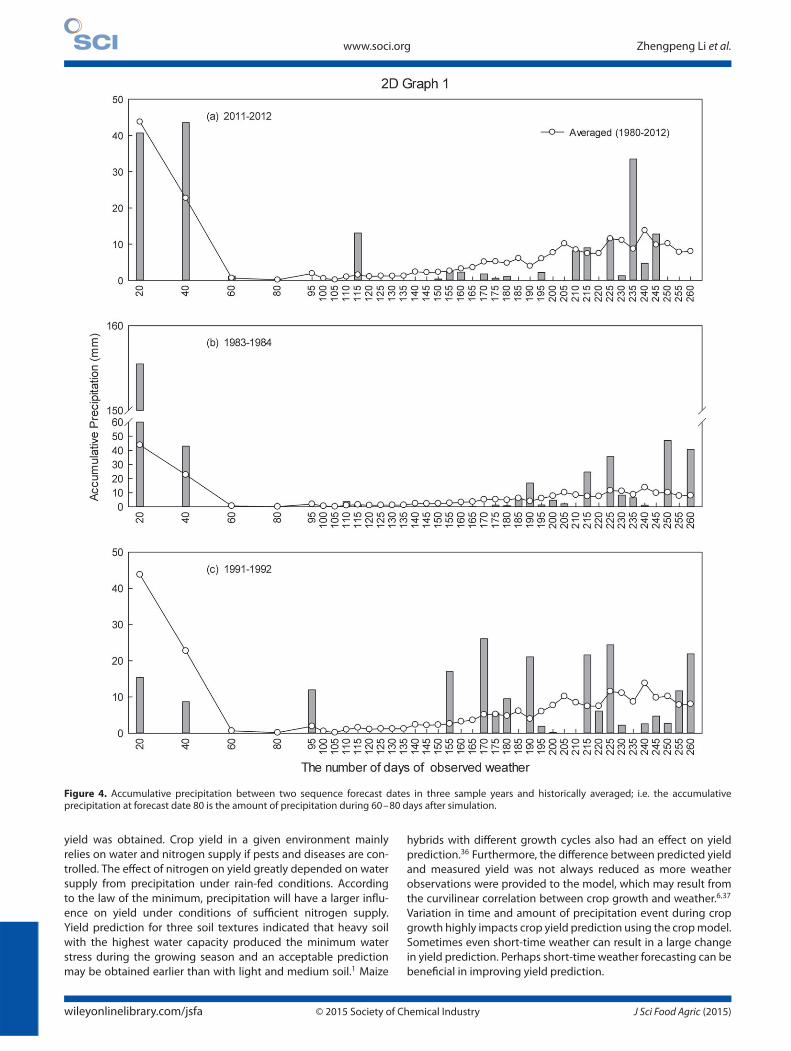
Low-yielding year, 2011-2012The middle curve and shaded area in Fig. 3 shows the variation ofpredicted yield with 95% confidence intervals against more substi-tution of actual weather data. The variation trend of the predictedyield, increasing first and then decreasing until the actual yield ofthe base year, was generally similar under different nitrogen inputconditions. However, the increase of nitrogen application enlargedthe variation amplitude. The uncertainty of weather condition hada limited effect on predicted yield in N0 treatment (predictedyield range 2450–3000 kg ha−1 – rather close to the actual yield of2524 kg ha−1) due to N limitation on wheat growth. For example,as the prediction progressed from 0 to 60 days, the predicted yieldin N0 treatment changed little, although the accumulative precip-itation during this period (85 mm) was 18 mm more than the his-torical average (67 mm) (Fig. 4a). By contrast, the predicted yieldin N200 treatment increased 891 kg ha−1 during the same period.After a 50-day stable phase, from 110 to 120 days, the predictedyield increased slightly mainly due to the 13 mm rainfall occurringonly in the base year among 30 historical years (Fig. 4a). After that,the predicted yield decreased gradually from 120 to 205 days. Thepredicted yield in N200 treatment reduced about 3000 kg ha−1,corresponding to 35 kg ha−1 d−1. The rainfall was merely 11 mm inthe base year, accounting for one-sixth of the historical average.The decline procedure was further subdivided into two stages:120–165 days and 165–205 days, with a slope of 17 and 55 kg ha−1
d−1, respectively. From 165 to 205 days, wheat experienced exactlythe growth stage of the terminal spikelet phase to the end of veg-etative growth, during which it grew and developed vigorously,with a high water requirement, and was very sensitive to droughtstress. At the end of vegetative growth of wheat, the actual yieldwith various N application rates fell into the confidence interval ofthe corresponding predicted yield. After that, the predicted yieldshowed a slight rise and fall due to the uncertainty of weather con-ditions during the reproductive growth stage. From 205 to 230days, corresponding to the period of heading and flowering, thepredicted yields in N150 and N200 treatment remained stable,whereas that in N0 and N100 treatment decreased (Fig. 3). The pre-cipitation from 230 to 235 days caused an increase in predictedyield in all nitrogen treatments. From 235 (i.e. eighth day afterstart of grain-filling) to maturity, the predicted yields in N150 andN200 treatment remained stable without variation, whereas that inN0 and N100 became unchanged until 252 day, when grain-fillingended . Considering the lower precipitation from 235 to 252 days(17 mm, 20 mm less than the historical average) in 2011–2012, thepredicted yield trends indicated that the uncertain weather con-ditions during the late wheat season (e.g. grain-filling stage) hadrelatively less effect on the predicted yield under higher N levels,
wileyonlinelibrary.com/jsfa © 2015 Society of Chemical Industry J Sci Food Agric (2015)
Yield prediction with different nitrogen inputs CERES-Wheat model in northwest China www.soci.org
Figure 1. Comparison of observed and simulated wheat grain yield and above-ground biomass under water and nitrogen treatments at the experimentalsite of Yangling. The dotted line represents 1:1 relationship. (a, b) Calibration data for 2011–2012; (c, d) evaluation data for 2012–2013. RMSE, root meansquare error; nRMSE, normalized root mean square; R2, is coefficient of determination; d, index of agreement.
and the effect size was highly related to the previous weather andcrop growth conditions.
The 5% and 95% percentiles of predicted yield decreased gen-erally as the forecasting date progressed throughout the growingseason. At the early stage, the predicted yields in all nitrogen treat-ments were higher than the actual yield and had a large intervalscale of 5% and 95% percentiles, which was narrowed substantiallyfrom 165 days. Therefore, the acceptably accurate yield predictionwas defined as the first time when the actual yield fell into the con-fidence intervals of the predicted yield with a relatively lower inter-val scale of 5% and 95% percentiles. According to this standard,the accurate forecasting date was 190 days after simulation, whichwas 62 days away from wheat maturity in 2011–2012 regardless ofnitrogen inputs.
Normal-yielding year, 1983–1984The predicted yield trend in the selected normal-yielding year(1983–1984), in general decreasing first and then increasing up to
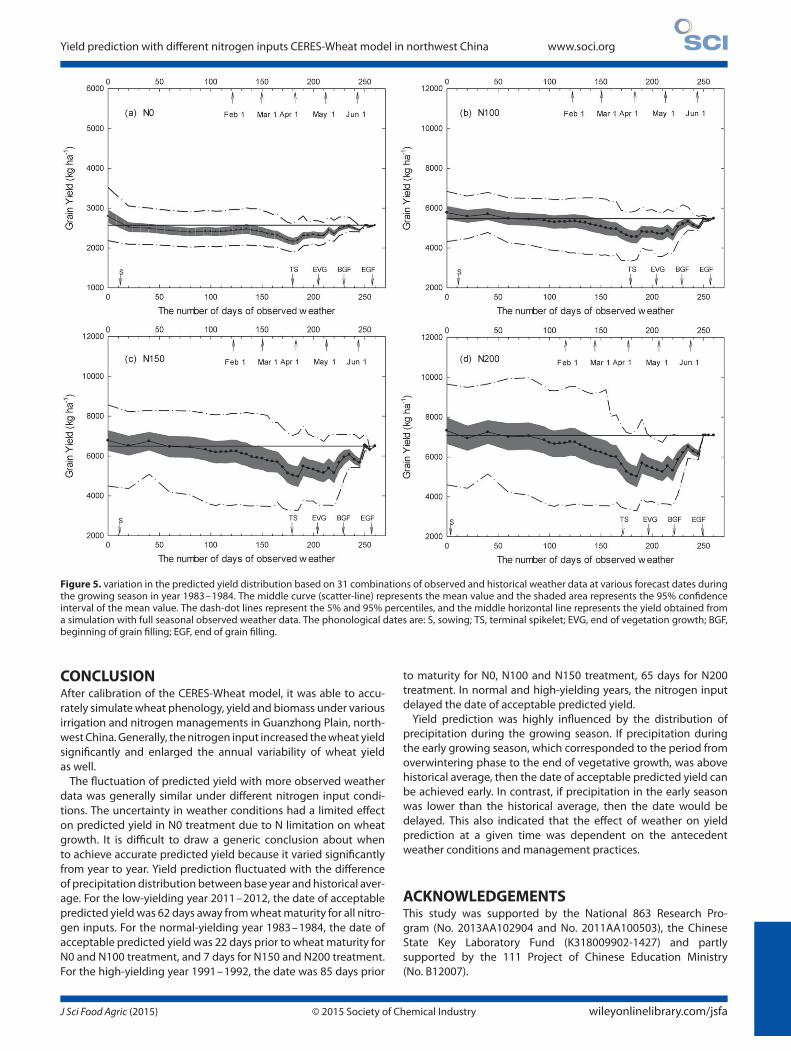
the actual yield, was very different from that in the low-yieldingyear (2011–2012) (Fig. 5). During the first 20 days (i.e. until the8th day after sowing), the predicted yield without nitrogen inputreduced 9%, which was higher than that with other nitrogeninputs. The reduction of predicted yield may be mainly due tothe large amount of rainfall (155 mm) in the base year, whichtripled over the historical average during the same period (Fig. 4b).Soil nitrogen leaching due to more precipitation and none fromfertilizer nitrogen inputs caused higher yield reduction in N0treatment. From 20 to 125 days, the predicted yields remainedstable or declined slightly. During the following 60 days, however,the wheat in the base year experienced a drier period with only8 mm precipitation, which was 30 mm less than the historicalaverage (Fig. 4b). Therefore, a rapid reduction of predicted yieldoccurred for all N treatments (e.g. 250 and 1750 kg ha−1 for N0and N200 respectively). After that, the predicted yield experiencedthree obvious increases from 185 days to maturity, driven byvarious amounts and times of rainfall, i.e. 17 mm from 185 to 195
J Sci Food Agric (2015) © 2015 Society of Chemical Industry wileyonlinelibrary.com/jsfa
www.soci.org Zhengpeng Li et al.
Figure 2. Box plots summarizing the simulated yields during 1980–2012 with different nitrogen inputs. Closed circle represents the 5% and 95%percentiles (a) and cumulative frequency distributions of simulated yield (b) with N0 (closed circle), N50 (open circle), N100 (closed square), N150 (opensquare), N200 (closed diamond).
days, 50 mm from 220 to 235 days and 47 mm from 245 to 250 days,respectively (Fig. 4b).
In contrast to the low-yielding year (2011–2012), the actual yieldwas within the range of confidence intervals of predicted yieldfrom the start of prediction to 135 days. However, the wide scopebetween 5% and 95% percentiles indicated that the predictedyield was high risk and not reliable during this period. From 220days to maturity, the scope between 5% and 95% percentilesnarrowed dramatically to zero. The accurate yield forecasting datewas 235 days (beginning of grain-filling) for N0 and N100, and 250days for N150 and N200, which was 22 and 7 days prior to maturity,respectively.
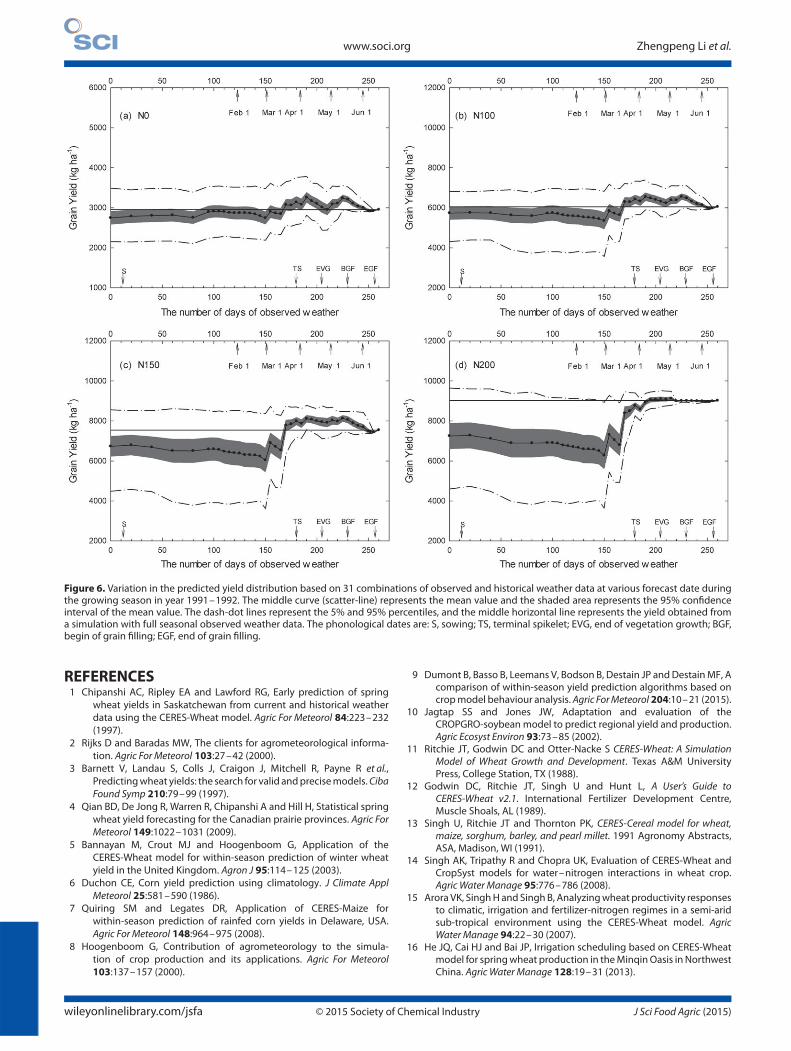
High-yielding year, 1991–1992The same yield prediction procedure was applied to the high-yielding year 1991–1992. The statistics of yield prediction areshown in Fig. 6. Generally, the predicted yield declined slightly inthe first 150 days of simulation and then fluctuated up to the actualyield level. Although 36 mm precipitation in the base year duringthis period was 48 mm less than the historical average (Fig. 4c),it led to a slight reduction in predicted yield, indicating that thewheat was not very sensitive to water stress during the seedlingand overwintering stages. After 150 days, the predicted yieldincreased to a different extent as affected by the precipitation timeand amount. For example, 17 mm precipitation during 150–155days and 26 mm during 165–170 days led to a remarkable yieldincrease of 1000 and 1600 kg ha−1 in N200 treatment, respectively(Fig. 4c). However, more rainfall during the following 20 days(36 mm; 16 mm higher than the historical average) resulted in anegligible yield increase, indicating that much precipitation in theearly stages could reduce the marginal effect of later precipitation.From 190 days to maturity, the predicted yield in N200 treatmentremained steady, whereas those in other N treatments fluctuatedalong with precipitation. This indicated that the effect of weathercondition on yield at a given time is dependent on antecedentweather and management strategy.
The initial predicted yield was nearly the same as that in theformer 2 years but lower than the actual yield in the high-yieldingbase year. The scope between 5% and 95% percentiles began toshrink after 150 days, and especially after 165 days. The amplitudeof variation was positively correlated with N supply. As in the
former 2 years, the actual yield in the base year was included in theconfidence interval of predicted yield with quite a large variation.For N0, N100 and N150 treatments, the accurate yield forecastingdate was 170 days, which was 85 days away from the maturity date,whereas for N200 treatment the accurate prediction date could bemade 65 days in advance.
DISCUSSIONThe accuracy of forecasts for crop grain yield is dependent onthe adequacy of the crop model and the accuracy of futureweather forecasts. The crop model describes the physical andbiochemical process in the agricultural ecosystem through a seriesof mathematical equations. As it is a simplification of the actualworld, some discrepancy between measured and simulated valuescould not be avoided. In our paper, overestimated biomass atmaturity was observed in the CERES-Wheat model, which was alsofound in research by Jamieson et al.30 and Bannayan et al.5 Theyconcluded that the performance of overestimated biomass can beexplained by the overestimated leaf biomass and leaf area index atthe early growing stage. Although there are some problems withbiomass partition in the crop model, the total simulated biomasswas still in the range of allowable error. They demonstrated thatthe accuracy of yield forecast showed no close link with biomassforecast, so the capacity of yield forecast would be not affectedby the overestimated biomass. In addition, some assumptions inthe CERES-Wheat model are also a reason for simulation bias. Forexample, the impacts of pest, disease and some extreme weathercondition (e.g. strong wind, hail, frost) are not considered in themodel. These factors can be negligible at the field scale, but shouldbe considered at the regional scale. Certainly, a crop model isa very useful tool to aid interpretation of some phenomena inthe agricultural ecosystem. The potential benefits offered by cropmodels can only be achieved if they are used appropriately, withan understanding of their capabilities as well as their limitations.
Future weather data from forecast date to crop maturity mustbe provided to the CERES-Wheat model for within-season yieldforecasting. Usually, historical weather data or synthetic weatherdata generated by a stochastic weather generator is considered asthe estimation of future weather data. Historical weather, whichhappened in past, included interactions among meteorologicalelements, but the length of the historical weather record was
wileyonlinelibrary.com/jsfa © 2015 Society of Chemical Industry J Sci Food Agric (2015)
Yield prediction with different nitrogen inputs CERES-Wheat model in northwest China www.soci.org
Figure 3. variation in the predicted yield distribution based on 31 combinations of observed and historical weather data at various forecast dates duringthe growing season in year 2011–2012. The middle curve (scatter-line) represents the mean value and the shaded area represents the 95% confidenceinterval on the mean value. Dash-dot lines represent the 5% and 95% percentiles, and the middle horizontal line represents the yield obtained from asimulation with full seasonal observed weather data. The phonological dates are: S, sowing; TS, terminal spikelet; EVG, end of vegetation growth; BGF,beginning of grain filling; EGF, end of grain filling.
limited. A stochastic weather generator can produce any lengthof synthetic weather data, is which generated based on statisticalcharacteristics of historical weather data. But interaction amongclimate factors was not considered sufficiently. Some papers havedemonstrated that the simulated yield based on historical weatherdata was not statistically different from those based on syntheticweather data.31 In addition, seasonal climate forecasting might bea promising method to provide weather conditions of 6 months inadvance for the crop model.32,33
As the proportion of observed weather data increased in themodel, corresponding to a reduction in uncertainty of futureweather conditions, generally, the accuracy of yield forecastingimproved, which is consistent with previous results. Quiring andLegates7 conducted four yield forecasts from 1 to 4 monthsbefore harvest (1 June, 1 July, 1 August and 1 September) withthe CERES-Maize model in Delaware and concluded that the firsttwo forecasts were of little value for the farm manager, the thirdpromising and the last extremely accurate. A within-season yieldforecast for wheat in Belgium using the STICS model demon-strated that as the crop growing season progressed the predictionreliability increased and a reliable predictive delay of 3–4 weekscould be obtained.34 Yield forecasting with CERES-Wheat at four
sites in the UK was performed for five different developmentalstages (three- to five-leaf stage, the third sampling, tip of flag leafappearance, anthesis and milk stage) and found that the predictedyield at anthesis and milk stage was no significant difference fromthe actual yield at maturity.5 The performance of yield predictionwas highly dependent on the chosen year in corresponding tothe climate element distribution, especially rainfall. In the threebase years in this study, the forecast date that made an acceptableprediction ranged from 85 to 7 days before maturity. Duchon6
conducted a within-season yield prediction using CERES-Maizein 1983 and 1976, and concluded that the 95% confidence inter-val reached a range of 4 t ha−1 on 1 August 1983, which wasabout 15 days earlier than in 1976. From the result of Quiringand Legates,7 the acceptable predicted yield was obtained on 1August in 2001 and 2003, but on 1 September in 2002 due to earlydrought. Lawless and Semenov35 concluded that the lead time foran acceptable predicted yield ranged from 48 to 81 days beforeharvest with a given probability from 0.95 to 0.75, respectively.In addition to the chosen base year, all factors influencing yieldhad an effect on the performance of yield prediction due to theinteraction between them and climate condition. In this study, thenitrogen input delayed the date at which an acceptable predicted
J Sci Food Agric (2015) © 2015 Society of Chemical Industry wileyonlinelibrary.com/jsfa
www.soci.org Zhengpeng Li et al.
Figure 4. Accumulative precipitation between two sequence forecast dates in three sample years and historically averaged; i.e. the accumulativeprecipitation at forecast date 80 is the amount of precipitation during 60–80 days after simulation.
yield was obtained. Crop yield in a given environment mainlyrelies on water and nitrogen supply if pests and diseases are con-trolled. The effect of nitrogen on yield greatly depended on watersupply from precipitation under rain-fed conditions. Accordingto the law of the minimum, precipitation will have a larger influ-ence on yield under conditions of sufficient nitrogen supply.Yield prediction for three soil textures indicated that heavy soilwith the highest water capacity produced the minimum waterstress during the growing season and an acceptable predictionmay be obtained earlier than with light and medium soil.1 Maize
hybrids with different growth cycles also had an effect on yieldprediction.36 Furthermore, the difference between predicted yieldand measured yield was not always reduced as more weatherobservations were provided to the model, which may result fromthe curvilinear correlation between crop growth and weather.6,37
Variation in time and amount of precipitation event during cropgrowth highly impacts crop yield prediction using the crop model.Sometimes even short-time weather can result in a large changein yield prediction. Perhaps short-time weather forecasting can bebeneficial in improving yield prediction.
wileyonlinelibrary.com/jsfa © 2015 Society of Chemical Industry J Sci Food Agric (2015)
Yield prediction with different nitrogen inputs CERES-Wheat model in northwest China www.soci.org
Figure 5. variation in the predicted yield distribution based on 31 combinations of observed and historical weather data at various forecast dates duringthe growing season in year 1983–1984. The middle curve (scatter-line) represents the mean value and the shaded area represents the 95% confidenceinterval of the mean value. The dash-dot lines represent the 5% and 95% percentiles, and the middle horizontal line represents the yield obtained froma simulation with full seasonal observed weather data. The phonological dates are: S, sowing; TS, terminal spikelet; EVG, end of vegetation growth; BGF,beginning of grain filling; EGF, end of grain filling.
CONCLUSIONAfter calibration of the CERES-Wheat model, it was able to accu-rately simulate wheat phenology, yield and biomass under variousirrigation and nitrogen managements in Guanzhong Plain, north-west China. Generally, the nitrogen input increased the wheat yieldsignificantly and enlarged the annual variability of wheat yieldas well.
The fluctuation of predicted yield with more observed weatherdata was generally similar under different nitrogen input condi-tions. The uncertainty in weather conditions had a limited effecton predicted yield in N0 treatment due to N limitation on wheatgrowth. It is difficult to draw a generic conclusion about whento achieve accurate predicted yield because it varied significantlyfrom year to year. Yield prediction fluctuated with the differenceof precipitation distribution between base year and historical aver-age. For the low-yielding year 2011–2012, the date of acceptablepredicted yield was 62 days away from wheat maturity for all nitro-gen inputs. For the normal-yielding year 1983–1984, the date ofacceptable predicted yield was 22 days prior to wheat maturity forN0 and N100 treatment, and 7 days for N150 and N200 treatment.For the high-yielding year 1991–1992, the date was 85 days prior
to maturity for N0, N100 and N150 treatment, 65 days for N200treatment. In normal and high-yielding years, the nitrogen inputdelayed the date of acceptable predicted yield.
Yield prediction was highly influenced by the distribution ofprecipitation during the growing season. If precipitation duringthe early growing season, which corresponded to the period fromoverwintering phase to the end of vegetative growth, was abovehistorical average, then the date of acceptable predicted yield canbe achieved early. In contrast, if precipitation in the early seasonwas lower than the historical average, then the date would bedelayed. This also indicated that the effect of weather on yieldprediction at a given time was dependent on the antecedentweather conditions and management practices.
ACKNOWLEDGEMENTSThis study was supported by the National 863 Research Pro-gram (No. 2013AA102904 and No. 2011AA100503), the ChineseState Key Laboratory Fund (K318009902-1427) and partlysupported by the 111 Project of Chinese Education Ministry(No. B12007).
J Sci Food Agric (2015) © 2015 Society of Chemical Industry wileyonlinelibrary.com/jsfa
www.soci.org Zhengpeng Li et al.
Figure 6. Variation in the predicted yield distribution based on 31 combinations of observed and historical weather data at various forecast date duringthe growing season in year 1991–1992. The middle curve (scatter-line) represents the mean value and the shaded area represents the 95% confidenceinterval of the mean value. The dash-dot lines represent the 5% and 95% percentiles, and the middle horizontal line represents the yield obtained froma simulation with full seasonal observed weather data. The phonological dates are: S, sowing; TS, terminal spikelet; EVG, end of vegetation growth; BGF,begin of grain filling; EGF, end of grain filling.
REFERENCES1 Chipanshi AC, Ripley EA and Lawford RG, Early prediction of spring
wheat yields in Saskatchewan from current and historical weatherdata using the CERES-Wheat model. Agric For Meteorol 84:223–232(1997).
2 Rijks D and Baradas MW, The clients for agrometeorological informa-tion. Agric For Meteorol 103:27–42 (2000).
3 Barnett V, Landau S, Colls J, Craigon J, Mitchell R, Payne R et al.,Predicting wheat yields: the search for valid and precise models. CibaFound Symp 210:79–99 (1997).
4 Qian BD, De Jong R, Warren R, Chipanshi A and Hill H, Statistical springwheat yield forecasting for the Canadian prairie provinces. Agric ForMeteorol 149:1022–1031 (2009).
5 Bannayan M, Crout MJ and Hoogenboom G, Application of theCERES-Wheat model for within-season prediction of winter wheatyield in the United Kingdom. Agron J 95:114–125 (2003).
6 Duchon CE, Corn yield prediction using climatology. J Climate ApplMeteorol 25:581–590 (1986).
7 Quiring SM and Legates DR, Application of CERES-Maize forwithin-season prediction of rainfed corn yields in Delaware, USA.Agric For Meteorol 148:964–975 (2008).
8 Hoogenboom G, Contribution of agrometeorology to the simula-tion of crop production and its applications. Agric For Meteorol103:137–157 (2000).
9 Dumont B, Basso B, Leemans V, Bodson B, Destain JP and Destain MF, Acomparison of within-season yield prediction algorithms based oncrop model behaviour analysis. Agric For Meteorol 204:10–21 (2015).
10 Jagtap SS and Jones JW, Adaptation and evaluation of theCROPGRO-soybean model to predict regional yield and production.Agric Ecosyst Environ 93:73–85 (2002).
11 Ritchie JT, Godwin DC and Otter-Nacke S CERES-Wheat: A SimulationModel of Wheat Growth and Development. Texas A&M UniversityPress, College Station, TX (1988).
12 Godwin DC, Ritchie JT, Singh U and Hunt L, A User’s Guide toCERES-Wheat v2.1. International Fertilizer Development Centre,Muscle Shoals, AL (1989).
13 Singh U, Ritchie JT and Thornton PK, CERES-Cereal model for wheat,maize, sorghum, barley, and pearl millet. 1991 Agronomy Abstracts,ASA, Madison, WI (1991).
14 Singh AK, Tripathy R and Chopra UK, Evaluation of CERES-Wheat andCropSyst models for water–nitrogen interactions in wheat crop.Agric Water Manage 95:776–786 (2008).
15 Arora VK, Singh H and Singh B, Analyzing wheat productivity responsesto climatic, irrigation and fertilizer-nitrogen regimes in a semi-aridsub-tropical environment using the CERES-Wheat model. AgricWater Manage 94:22–30 (2007).
16 He JQ, Cai HJ and Bai JP, Irrigation scheduling based on CERES-Wheatmodel for spring wheat production in the Minqin Oasis in NorthwestChina. Agric Water Manage 128:19–31 (2013).
wileyonlinelibrary.com/jsfa © 2015 Society of Chemical Industry J Sci Food Agric (2015)

Yield prediction with different nitrogen inputs CERES-Wheat model in northwest China www.soci.org
17 Ji J, Cai H, He J and Wang H, Performance evaluation of CERES-Wheatmodel in Guanzhong Plain of Northwest China. Agric Water Manage144:1–10 (2014).
18 Zadoks JC, Chang TT and Konzak CF, A decimal code for the growthstages of cereals. Weed Res 14:415–421 (1974).
19 Hoogenboom G, Jones JW, Wilkens PW, Porter CH, Boote KJ, Hunt LAet al., Decision Support System for Agrotechnology Transfer (DSSAT)Version 4.5.0.0 [CD-ROM]. University of Hawaii, Honolulu, HI (2012).
20 Ritchie J, Soil water balance and plant water stress, in UnderstandingOptions for Agricultural Production, ed. by Tsuji GY, Hoogenboom Gand Thornton PK. Kluwer, Dordrecht, pp. 41–54 (1998).
21 Hunt L, White J and Hoogenboom G, Agronomic data: advances indocumentation and protocols for exchange and use. Agric Syst70:477–492 (2001).
22 Hunt L and Boote K, Data for model operation, calibration, and evalua-tion, in Understanding Options for Agricultural Production, ed. by TsujiGY, Hoogenboom G and Thornton PK. Kluwer, Dordrecht, pp. 9–39(1998).
23 Ampratwum DB and Dorvlo AS, Estimation of solar radiation from thenumber of sunshine hours. Appl Energy 63:161–167 (1999).
24 Jones JW, Hoogenboom G, Porter CH, Boote KJ, Batchelor WD, Hunt LAet al., The DSSAT cropping system model. Eur J Agron 18:235–265(2003).
25 Jones JW, He JQ, Boote KJ, Wilkens P, Porter CH and Hu Z, EstimatingDSSAT cropping system cultivar-specific parameters using Bayesiantechniques, in Methods of Introducing System Models into AgriculturalResearch, ed. by Ahuja LR and Ma LW. American Society of Agron-omy, Madison, WI, pp. 365–394 (2011).
26 Willmott CJ, On the validation of models. Phys Geogr 2: 184–194 (1981).27 Legates DR and McCabe GJ, Evaluating the use of ‘goodness-of-fit’
measures in hydrologic and hydroclimatic model validation. WaterResour Res 35:233–241 (1999).
28 Parajuli PB, Assessing sensitivity of hydrologic responses to climatechange from forested watershed in Mississippi. Hydrol Process24:3785–3797 (2010).
29 Jamieson PD, Porter JR and Wilson DR, A test of the computer simula-tion model ARCWHEAT on wheat crops grown in new zealand. FieldCrop Res 27:337–350 (1991).
30 Jamieson PD, Porter JR, Goudriaan J, Ritchie JT, van Keulen H and StolW, A comparison of the models AFRCWHEAT2, CERES-wheat, Sirius,SUCROS2 and SWHEAT with measurements from wheat grownunder drought. Field Crop Res 55:23–44 (1998).
31 Qian BD, De Jong R, Yang JY, Wang H and Gameda S, Comparingsimulated crop yields with observed and synthetic weather data.Agric For Meteorol 151:1781–1791 (2011).
32 Marletto V, Ventura F, Fontana G and Tomei F, Wheat growth simulationand yield prediction with seasonal forecasts and a numerical model.Agric For Meteorol 147:71–79 (2007).
33 Semenov MA and Doblas-Reyes FJ, Utility of dynamical seasonal fore-casts in predicting crop yield. Climate Res 34:71–81 (2007).
34 Dumont B, Leemans V, Ferrandis S, Bodson B, Destain JP and DestainMF, Assessing the potential of an algorithm based on mean climaticdata to predict wheat yield. Precis Agric 15:255–72 (2014).
35 Lawless C and Semenov MA, Assessing lead-time for predictingwheat growth using a crop simulation model. Agric For Meteorol135:302–313 (2005).
36 Soler CMT, Sentelhas PU and Hoogenboom G, Application of theCSM-CERES-maize model for planting date evaluation and yieldforecasting for maize grown off-season in a subtropical environ-ment. Eur J Agron 27:165–177 (2007).
37 Semenov MA and Porter JR, Climatic variability and the modeling ofcrop yields. Agric For Meteorol 73:265–283 (1995).
J Sci Food Agric (2015) © 2015 Society of Chemical Industry wileyonlinelibrary.com/jsfa