wisconsin dot cfire · as the 2008 wisconsin truck size and weight study makes clear, it is...
TRANSCRIPT

WISCONSIN DOTWisconsin Department of Transportation Research & Library Unit
CFIRENational Center for Freight & Infrastructure Research & EducationWisconsin Transportation CenterUniversity of Wisconsin, Madison
Containerization Policy: Considering Increased Load Weight for
Certain Circumstances of Freight in WisconsinMartin Schilling, Jason Bittner, Teresa Adams
University of Wisconsin, Madison
WisDOT 0092-08-26, CFIRE 01-05
September 2009

CONTAINERIZATION POLICY:
CONSIDERING INCREASED
LOAD WEIGHT FOR CERTAIN
CIRCUMSTANCES OF FREIGHT
IN WISCONSIN
CFIRE Project 01-05
WisDOT Project # 0092-08-26
June 2009
National Center for Freight & Infrastructure Research & Education
College of Engineering
Department of Civil and Environmental Engineering
University of Wisconsin, Madison
Authors:
Schilling, Martin S.; Bittner, Jason J.; Adams, Teresa M. University of Wisconsin, Madison WI
Principal Investigator: Teresa Adams;
Professor, Department of Civil and Environmental Engineering, University of Wisconsin, Madison
June 2009
DISCLAIMER
This research was funded by the Wisconsin Department of Transportation and the National Center for
Freight and Infrastructure Research and Education. The contents of this report reflect the views of the
authors, who are responsible for the facts and the accuracy of the information presented herein. This
document is disseminated under the sponsorship of the Wisconsin Department of Transportation,
University Transportation Centers Program, in the interest of information exchange. The U.S.
Government assumes no liability for the contents or use thereof. The contents do not necessarily reflect
the official views of the National Center for Freight and Infrastructure Research and Education, the
University of Wisconsin, the Wisconsin Department of Transportation, or the USDOT’s Research and
Innovative Technology Administration at the time of publication.
The United States Government assumes no liability for its contents or use thereof. This report does not
constitute a standard, specification, or regulation.
The United States Government does not endorse products or manufacturers. Trade and manufacturers
names appear in this report only because they are considered essential to the object of the document.

EXHIBIT B
Technical Report Documentation Page 1. Report No.
CFIRE 01-05 / WisDOT 0092-08-26
2. Government Accession No.
3. Recipient’s Catalog No.
CFDA 20.701 4. Title and Subtitle
Containerization Policy: Considering Increased Load Weight for Certain Circumstances of Freight in
Wisconsin
5. Report Date June, 2009 6. Performing Organization Code
7. Martin S. Schilling, Jason J. Bittner, Teresa A. Adams
8. Performing Organization Report No.
CFIRE 01-05 9. Performing Organization Name and Address
Center for Freight and Infrastructure Research and Education
University of Wisconsin-Madison
1415 Engineering Drive, Madison, WI 53706
10. Work Unit No. (TRAIS)
11. Contract or Grant No.
0092-08-26 12. Sponsoring Organization Name and Address
Wisconsin Department of Transportation
Research and Library Section
Hill Farms State Transportation Building, Rm 104
4802 Sheboygan Avenue
Madison, WI 53707
13. Type of Report and Period Covered
11/16/2007 - 7/15/2009 14. Sponsoring Agency Code
15. Supplementary Notes
Project completed for the Center for Freight and Infrastructure Research and Education with support from the Wisconsin Department of
Transportation. 16. Abstract
Many businesses in Wisconsin export their goods throughout the world. An efficient way of doing business internationally is
through containerized shipments. This research discovered that Wisconsin’s weight laws for transporting international containers
(ICs) are stricter than in several bordering states. Through interviews with major shippers and stakeholders, and analysis of rail
related waybill information, this report details some of the economic impacts of stricter weight limits for international container
traffic in Wisconsin. After conducting research on current trends in international container shipping, this report analyzed container
weight regulations in several states throughout the US, including Minnesota and Illinois. Through interviews with impacted
businesses and stakeholders, the research team learned that transportation costs increase significantly for Wisconsin businesses as
a result of the state’s existing weight laws.
17. Key Words
International containers, truck weight, weight limit,
truck impacts
18. Distribution Statement
No restrictions.
19. Security Classification (of this report)
Unclassified
20. Security Classification (of this page)
Unclassified
21. No. Of Pages
50
22. Price
-0-
Form DOT F 1700.7 (8-72) Reproduction of form and completed page is authorized.

i
Executive Summary
Introduction
This report presents the findings of research conducted by the National Center for Freight and
Infrastructure Research and Education (CFIRE) for the Wisconsin Department of Transportation
(WisDOT), through WisDOT’s Policy Research Program. The purpose of this research is to understand
the cost impacts of Wisconsin’s current international container (IC) weight regulations. The specific
focus of this project is on IC traffic moving to and from Wisconsin, with international origins or
destinations. As international trade continues to expand and remain a vital part of Wisconsin’s
economy, it is important to understand the economic implications of weight regulations on impacted
businesses and industries.
As the 2008 Wisconsin Truck Size and Weight Study makes clear, it is important to be mindful of the
delicate balance between safety, infrastructure and economic impacts that are a result of potential
changes in IC weight regulations. It is not the intent of this study to provide a comprehensive
framework for determining the validity of potential truck size and weight changes. This study seeks to
highlight one segment of the discussion - the economic impact of IC weight limitations. In order to make
a fully informed decision concerning potential changes to Wisconsin truck size and weight regulations, it
would be appropriate to take a more comprehensive look at all the impact areas (including safety,
infrastructure damage, and others) before making such policy modifications.
Overall, the study seeks to answer the following questions:
1. How do IC truck weight regulations differ in Wisconsin, Illinois, and Minnesota?
2. What are the cost impacts of Wisconsin IC weight limits on several large shippers that
operate out of Wisconsin?
3. What are examples of commodities that are impacted by IC weight limits in Wisconsin?
Background
For Wisconsin, this study is an initial look at the impact of IC weight limitations. In 2007-08, the
Mississippi Valley Freight Coalition initiated projects looking at testimony to the National Surface
Transportation Commission. This testimony included discussions on institutional arrangements and a
need for multi-state harmonization with respect to freight movements. One area where Wisconsin is
particularly susceptible to the influence of neighboring states is in the area of truck size and weight
limitations.
In 2008, Wisconsin completed the Wisconsin Truck Size and Weight Study, in which the National Center
for Freight and Infrastructure Research and Education (CFIRE) played a large role through leading
analysis of the economic impacts. That study presented a comprehensive look at the impact of all truck
size and weight laws throughout the State, with analyses on pavements, safety, and other
infrastructure/environmental factors. Some of the information in Appendix A of this report is taken
ii
from the larger Truck Size and Weight report in order to supplement this report. This specific study is
smaller in scope.
IC traffic is of importance to Wisconsin, as many Wisconsin-made products are bound for international
destinations. This includes several heavy-hauling industries. Naturally, a restriction on weight limits
presents businesses with additional costs. These costs become even more significant when products are
shipped overseas due to higher overall transportation costs and lower profit margins for businesses. It is
well known that Chicago acts as the Midwest hub for international traffic and for freight traffic in
general. Therefore, a look at regulation differences between Wisconsin and neighboring states and their
impact on IC businesses and their behavior is important for the private and public sectors.
Process
The research team took several steps to achieve our objectives. A literature review was completed to
understand truck size and weight issues and the specific circumstances related to containerized
movements. This information can be found in Appendix A of the report and was delivered as a technical
memorandum during the course of the work plan. The research team analyzed existing weight
regulations in bordering states to understand how the weight regulations on ICs compare throughout
the region. Interviews with Departments of Transportation in several bordering states were conducted
in order to understand the reasoning behind existing international container weight regulations, and to
understand the finer details about the state policies. Finally, several interviews were conducted with
impacted businesses and organizations in order to understand their perspective concerning truck weight
regulations, and the impact of these regulations on their business. WisDOT has purchased 2007 IHS
Global Insight freight data which will provide additional information for Wisconsin policy analysts. While
the data was not available for this report, the research team will provide analysis of this data after this
release. The IHS Global Insight data will allow analysts to understand the routes that international
container shippers use for moving goods in, out, and through the State.
Findings and Conclusions
This study revealed several interesting findings. First, the research team determined that there are
significant differences in the weight restrictions on international container traffic when comparing
Wisconsin and bordering States. This information is critical to understanding business decision-making
behavior concerning business location and travel behavior.
Next, it is evident that some heavy-hauling carriers are using Wisconsin roads in order to carry bulk
shipments into Illinois, where products are then consolidated and loaded into containers. Wisconsin’s IC
weight laws make container loading in Wisconsin infeasible for some businesses, particularly for those
selling agricultural products and grains. The inability of Wisconsin businesses to containerize their goods
in Wisconsin adds to shipping and logistics costs.
Next, some major carriers are moving goods on state roads as opposed to the Interstates, even for long-
distance traffic. The reason for this is that businesses want to take advantage of higher weight limits

iii
(with permits) on these roads. This may be a concern, and a potentially undesirable effect of the
discrepancy between federal and state weight regulations. Safety is a potential concern of having trucks
on relatively narrow and winding state roads, as opposed to wider, straighter and more efficient
Interstate highways.
Based on the interviews, it appears that Wisconsin is missing out on potential economic benefits
because of its relatively stringent regulations on international containers. Theoretically, a change in
regulations on international containers could result in more international cargo being shipped directly
out of Wisconsin container yards, as opposed to going to other states first and being repackaged.
Recommendations for Further Action
This study reveals some key issues that need to be analyzed further. First, it would be helpful to have an
understanding of where exactly origins and destinations for containerized ICs in Wisconsin are. The
research team was not able to obtain the necessary data to analyze IC traffic in Wisconsin. However, an
analysis of the routes and the commodities that are being shipped internationally from and to Wisconsin
counties would be helpful in further assessing the benefits of a change in regulation to IC weight laws.
WisDOT has purchased data that will enable this analysis to be completed after publication of this
report.
Further, it would be beneficial to the entire Midwest region to analyze the impacts of inconsistent IC
weight regulations in the region. An understanding of how variations in state IC weight regulations
impact the efficient and economical flow of goods across state borders to ports is of importance to the
region as a whole. With coalitions such as the Mississippi Valley Freight Coalition supporting regional
cooperation to improve freight, information on how ICs currently travel through the region would be
beneficial. One interviewee mentioned that firms are interested in seeing cross-border cooperation and
harmonization of truck weight regulations.
It is also suggested that further analysis be undertaken to understand the impacts of the difference
between federal and state highway weight limitations. Longer IC trips to central distribution hubs such
as Chicago would be most suitable for highway travel. The movement of heavy loads on state highways,
which is a current reality for some carriers, has cost impacts for businesses and the state.
Finally, the research team recognizes that heavier loads per axle may increase pavement damage. To
date, no definitive study has conclusively correlated permit costs with actual pavement impacts. Many
studies, however, do point to a need for better alignment of permit fees for all heavy hauling industries
with Wisconsin’s transportation agency operating and maintenance costs.

iv
Table of Contents
Executive Summary i
CONTAINERIZATION POLICY: CONSIDERING INCREASED LOAD WEIGHT FOR
CERTAIN CIRCUMSTANCES OF FREIGHT IN WISCONSIN..................................................... 1
1 Introduction .......................................................................................................................................... 1
1.1 Problem Statement and Background .......................................................................................... 1
1.2 Objectives .................................................................................................................................... 2
1.3 Scope of Project ........................................................................................................................... 2
1.4 Literature Review ........................................................................................................................ 3
2 International Freight Movement and Context ...................................................................................... 4
2.1 International Container Freight Trends ....................................................................................... 4
2.2 International Container Ports and Movement in the US ............................................................ 6
2.3 International Container Shipping Costs ....................................................................................... 7
2.4 Container Information ............................................................................................................... 10
2.5 Transloading and Crossdocking ................................................................................................. 12
3 International Freight Movement – Wisconsin .................................................................................... 13
3.1 Wisconsin Major International Trading Partners ...................................................................... 13
3.2 Wisconsin’s International Trade Infrastructure ........................................................................ 15
3.2.1 Wisconsin Seaports ............................................................................................................... 15
3.2.2 Wisconsin Freight Railroad Infrastructure & Goods Movement........................................... 18
4 International Container Weight Limits – Wisconsin and Bordering States ....................................... 20
4.1 Wisconsin Limits and Regulations ............................................................................................. 21
4.2 Minnesota Limits and Regulations ............................................................................................ 21
4.3 Illinois Limits and Regulations ................................................................................................... 21
4.4 Iowa Limits and Regulations ...................................................................................................... 22
4.5 Michigan Limits and Regulations ............................................................................................... 22
4.6 Other Limits and Regulations of Interest .................................................................................. 22
4.6.1 Kansas .................................................................................................................................... 23
4.6.2 California ............................................................................................................................... 23
4.6.3 New York ............................................................................................................................... 24
4.7 Overweight IC Regulation Summary .......................................................................................... 24
5 IC Weight Regulation Impacts on Wisconsin Business ....................................................................... 26

v
5.1 Interviews with Impacted Stakeholders .................................................................................... 26
5.1.1 Southern Wisconsin Grain Shipper ....................................................................................... 26
5.1.2 Chicago Intermodal Trucking Firm ........................................................................................ 27
5.1.3 Wisconsin Agri-Service Association (WASA) Representative ................................................ 27
5.1.4 Interview Summary ............................................................................................................... 28
5.2 Impacted Commodities ............................................................................................................. 29
5.3 Cost-Benefit on Selected Commodities ..................................................................................... 29
6 Conclusion ........................................................................................................................................... 30
7 Recommendations .............................................................................................................................. 30
Appendix A – Literature Review of Truck Size &Weight related to International Containers / Technical
Memorandum Summary ............................................................................................................................. 32
Appendix B – Shipping Container Sizes ....................................................................................................... 48
Trade in Goods (Imports, Exports and Trade Balance) with China. U.S. Census Bureau., undated.
http://www.census.gov/foreign-trade/balance/c5700.html#2009 ........................................................... 50
vi
Table of Figures
Figure 1. Loading trucks at the Port of Milwaukee ....................................................................................... 1
Figure 2. Percent Change in Tons of World Sea Trade ................................................................................. 4
Figure 3. Percent Change in Real Value of Merchandise Trade .................................................................... 5
Figure 4. Port Activity Indicators ................................................................................................................... 5
Figure 5. Percentage Change in Volume of Container Trade (TEUs) ............................................................ 6
Figure 6. APL Average Revenue per Forty-foot Equivalent Unit (FEU) (Monthly, 2005-2009) ..................... 8
Figure 7. Container Shipping Cost - Hong Kong to Los Angeles, per TEU ..................................................... 9
Figure 8. US Freight Railroad Rates 1981-2007, Inflation Adjusted .............................................................. 9
Figure 9. National Truck Shipment Rates (incl fuel surcharge), 2007-2008 $/Mile .................................... 10
Figure 10. Crossdocking Process ................................................................................................................. 12
Figure 11. Wisconsin Seaports - Imports from International Markets (by Value and kg) .......................... 16
Figure 12. Wisconsin Seaports - Exports to International Markets (by Value and kg) ............................... 17
Figure 13. Wisconsin Railroad Facilities, 2008 ............................................................................................ 18
Figure 14. Comparison of Stability and Control Measures for Scenario Vehicles Relative to Five-Axle
Tractor Semitrailer, from Wisconsin Truck Size and Weight Study, 2008 .................................................. 37
Figure 15. Highway Infrastructure Elements Affected by Weight .............................................................. 41
Figure 16. Shipper and Carrier Considerations Regarding TS&W Policy, from Wisconsin’s Truck Size and
Weight Study, 2008 ..................................................................................................................................... 44
List of Tables
Table 1. Top 15 North American Container Ports, Twenty-foot Equivalent Units (TEUs), 2007 .................. 7
Table 2. Container Dimensions ................................................................................................................... 11
Table 3. Wisconsin Top 15 Export Countries, 2008 and 1996 (Nominal $ Values) ..................................... 13
Table 4. Wisconsin Top 15 Export Product Categories, 1996 and 2008 (Nominal $ Values) ...................... 14
Table 5. Top 15 Wisconsin Exports by Weight, Rail 2006 ........................................................................... 19
Table 6. Top 15 Wisconsin Imports by Weight, Rail 2006........................................................................... 20
Table 7. TS&W Limits Specified in Law ....................................................................................................... 34
Table 8. Summary of Permitting Practices for Maximum Commercial Vehicle Weights in Wisconsin and
Neighboring States ...................................................................................................................................... 35
Table 9. Impact of LCV Use on Winnipeg-Fargo Corridor, 2020, North American Commission for
Environmental Cooperation39 ..................................................................................................................... 43
Table 10. Ton-Mile Costs for Different Truck Configurations (2005 Dollars) ............................................. 46
Table 11. Container Specifications of Top 6 Shipping Companies, compiled from company websites ..... 48

1
1 Introduction
1.1 Problem Statement and Background
Truck weight regulations have been widely debated in Wisconsin, as they have been throughout the
country. Generally, the issue comes down to balancing safety/infrastructure concerns with economic
concerns. Safety advocates argue that increased truck weights will endanger motorists, especially much
smaller automobiles sharing roadways with heavy trucks. Many commerce and business
representatives in Wisconsin contend that further regulation and continued restriction on truck weights
will weaken Wisconsin’s economy, as the costs for moving goods increases as a result of these
restrictions.
One important segment of freight traffic in an increasingly global economy is international freight traffic.
Many of Wisconsin’s products are exported internationally, while Wisconsin residents consume
products from all corners of the world. Thus, moving trucks quickly and efficiently to/from ports is
essential to keeping Wisconsin’s economy strong and the standard of living high. In this study, we
primarily look at the movement of international freight in Wisconsin and discuss business impacts of
current regulations on international container weight limits in the State. It is the intention of this report
to clarify some of the economic implications of Wisconsin’s international container (IC) limits, while
holding other impact areas, such as safety, environment and infrastructure damage constant.
Figure 1. Loading trucks at the Port of Milwaukee
Further, in this report we will analyze the regulations that other states have imposed to control the
weight of ICs, as well as tell the story of several businesses that have stressed the impacts of current
regulations on international container weights in Wisconsin.

2
1.2 Objectives
The primary objective of this report is to better understand the impacts on businesses of international
container truck weight regulations in Wisconsin. Through interviews, an understanding of existing
container regulations in Minnesota, Wisconsin, Illinois, and an understanding of impacted commodities,
the report seeks to highlight the impact that Wisconsin’s regulations have on costs for businesses that
ship their products internationally in containers.
The study focuses on the transport of intermodal containers that are moving in international commerce.
The current container vehicle load limit in Wisconsin is 80,000lbs including tractors and chassis. This
study identified issues associated with increasing load maximums for international containers. Issues
included consistency across borders with neighboring states, compatibility with allowable road load on
bridges and impact on road infrastructure, road traffic impact, road safety concerns, permit fees, types
of commodities affected, etc.
This study also highlighted key factors in determining the container vehicle load limit. Additionally, in
order to uncover the picture of implications to shippers’ cost and carriers’ operations, this project
included interviews exploring select commodities of local and regional interest.
It is important to note that the initial scope of this project included detailed quantitative analysis of the
commodities most likely to benefit from changes in containerized loading policy. The data set to
accomplish this was to be available to the study team in July 2008, however, limitations on the state
procurement process prohibited the acquisition of the data necessary. The project team and oversight
committee adopted a qualitative approach including the interviews, literature analysis, associated
research and analysis of waybill data presented herein.
1.3 Scope of Project
This project focuses on Wisconsin, and the impact on businesses of container weight regulations here.
The intent is to provide background information on international container traffic, to present existing
regulations in three states, and to provide feedback from interviews of several businesses impacted by
international container weight regulations. It is outside of the study’s scope to provide detailed
information on State economic benefits or dis-benefits as a result of current weight regulations. It is
also outside of the scope of this paper to provide average impacts on businesses. The goal is to provide
necessary background information on the topic followed by anecdotal information gathered through
interviews with impacted business representatives. Other impact areas, such as environmental, safety,
and pavement damage are not discussed here. For a comprehensive analysis of the truck weight issue in
Wisconsin, see the Wisconsin Truck Size and Weight Study, submitted to the Wisconsin legislature in
2008, and completed in early 2009.

3
1.4 Literature Review
A complete literature review detailing the primary issues associated with containerized movements of
freight and truck size and weight generally is included in Appendix A of this report. This literature
review included analysis of the truck size and weight regulations in the surrounding states and focused
on those that directly impact the movement of goods in containers.
4
2 International Freight Movement and Context
2.1 International Container Freight Trends
When analyzing international trade in the past 30 years or so, unprecedented economic globalization
has led to a marked increase of international trade. It is estimated that in 2005, approximately 1.7
billion tons of goods moved into and out of the United States.1 Between 1980 and 2004, the value of
international trade has quadrupled in real dollars. However, the recent economic downturn, which
began in 2008, has had a tremendous impact on world trade, which obviously has had serious
repercussions for freight traffic and the freight industry.
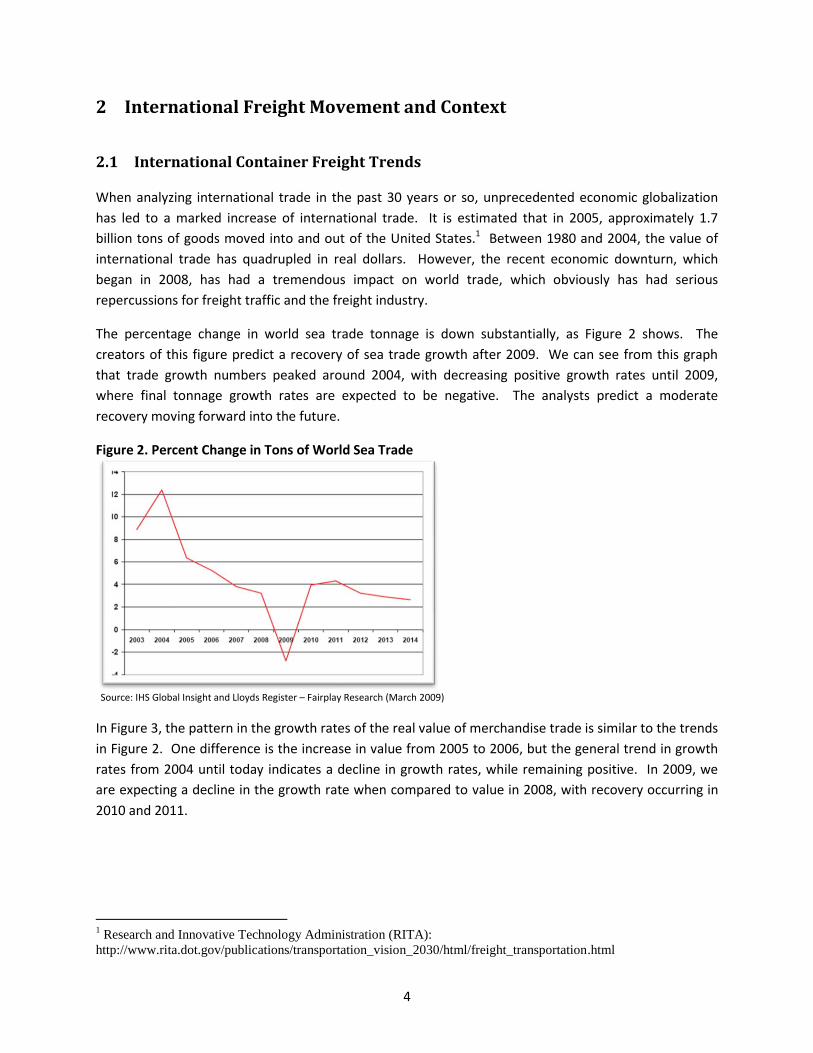
The percentage change in world sea trade tonnage is down substantially, as Figure 2 shows. The
creators of this figure predict a recovery of sea trade growth after 2009. We can see from this graph
that trade growth numbers peaked around 2004, with decreasing positive growth rates until 2009,
where final tonnage growth rates are expected to be negative. The analysts predict a moderate
recovery moving forward into the future.
Figure 2. Percent Change in Tons of World Sea Trade
Source: IHS Global Insight and Lloyds Register – Fairplay Research (March 2009)
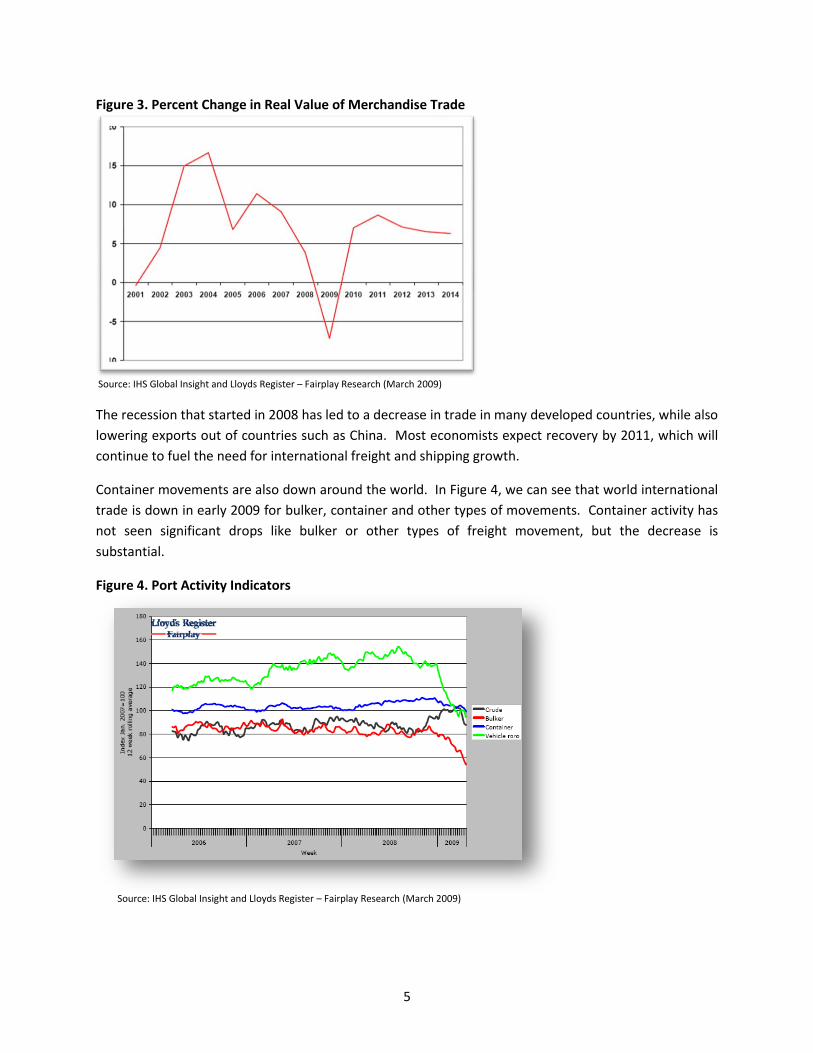
In Figure 3, the pattern in the growth rates of the real value of merchandise trade is similar to the trends
in Figure 2. One difference is the increase in value from 2005 to 2006, but the general trend in growth
rates from 2004 until today indicates a decline in growth rates, while remaining positive. In 2009, we
are expecting a decline in the growth rate when compared to value in 2008, with recovery occurring in
2010 and 2011.
1 Research and Innovative Technology Administration (RITA):
http://www.rita.dot.gov/publications/transportation_vision_2030/html/freight_transportation.html
5
Figure 3. Percent Change in Real Value of Merchandise Trade
Source: IHS Global Insight and Lloyds Register – Fairplay Research (March 2009)
The recession that started in 2008 has led to a decrease in trade in many developed countries, while also
lowering exports out of countries such as China. Most economists expect recovery by 2011, which will
continue to fuel the need for international freight and shipping growth.
Container movements are also down around the world. In Figure 4, we can see that world international
trade is down in early 2009 for bulker, container and other types of movements. Container activity has
not seen significant drops like bulker or other types of freight movement, but the decrease is
substantial.
Figure 4. Port Activity Indicators
Source: IHS Global Insight and Lloyds Register – Fairplay Research (March 2009)
6
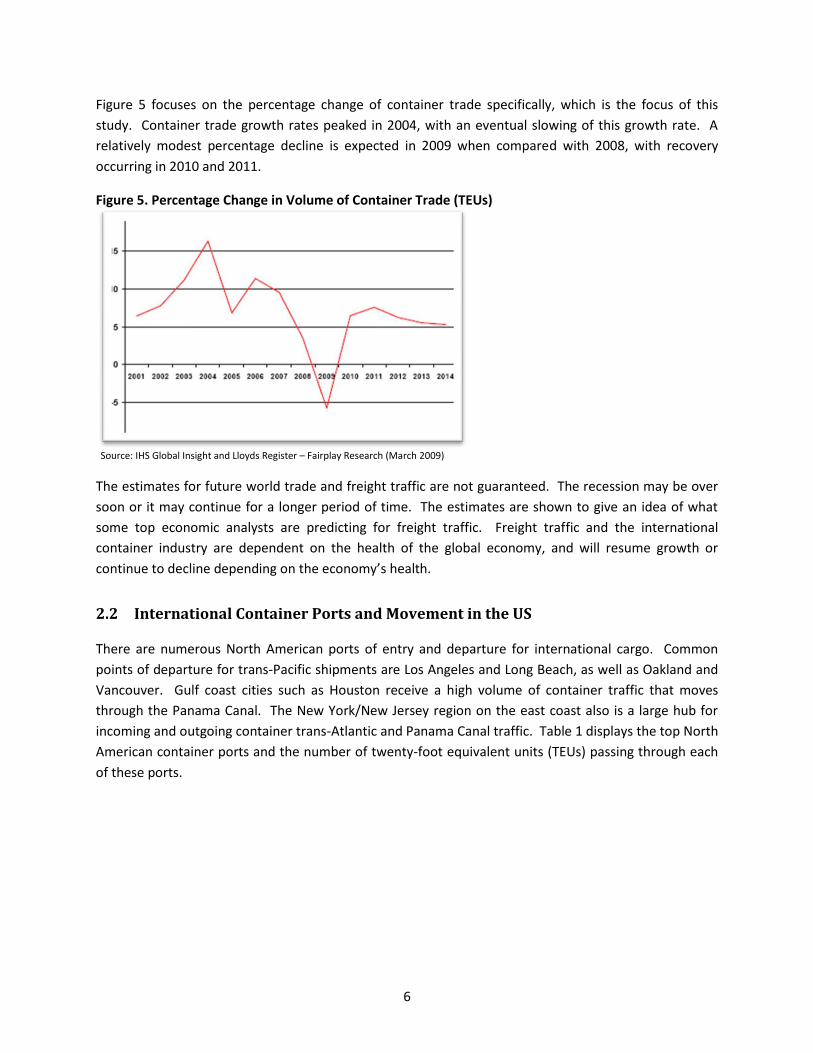
Figure 5 focuses on the percentage change of container trade specifically, which is the focus of this
study. Container trade growth rates peaked in 2004, with an eventual slowing of this growth rate. A
relatively modest percentage decline is expected in 2009 when compared with 2008, with recovery
occurring in 2010 and 2011.
Figure 5. Percentage Change in Volume of Container Trade (TEUs)
Source: IHS Global Insight and Lloyds Register – Fairplay Research (March 2009)
The estimates for future world trade and freight traffic are not guaranteed. The recession may be over
soon or it may continue for a longer period of time. The estimates are shown to give an idea of what
some top economic analysts are predicting for freight traffic. Freight traffic and the international
container industry are dependent on the health of the global economy, and will resume growth or
continue to decline depending on the economy’s health.
2.2 International Container Ports and Movement in the US
There are numerous North American ports of entry and departure for international cargo. Common
points of departure for trans-Pacific shipments are Los Angeles and Long Beach, as well as Oakland and
Vancouver. Gulf coast cities such as Houston receive a high volume of container traffic that moves
through the Panama Canal. The New York/New Jersey region on the east coast also is a large hub for
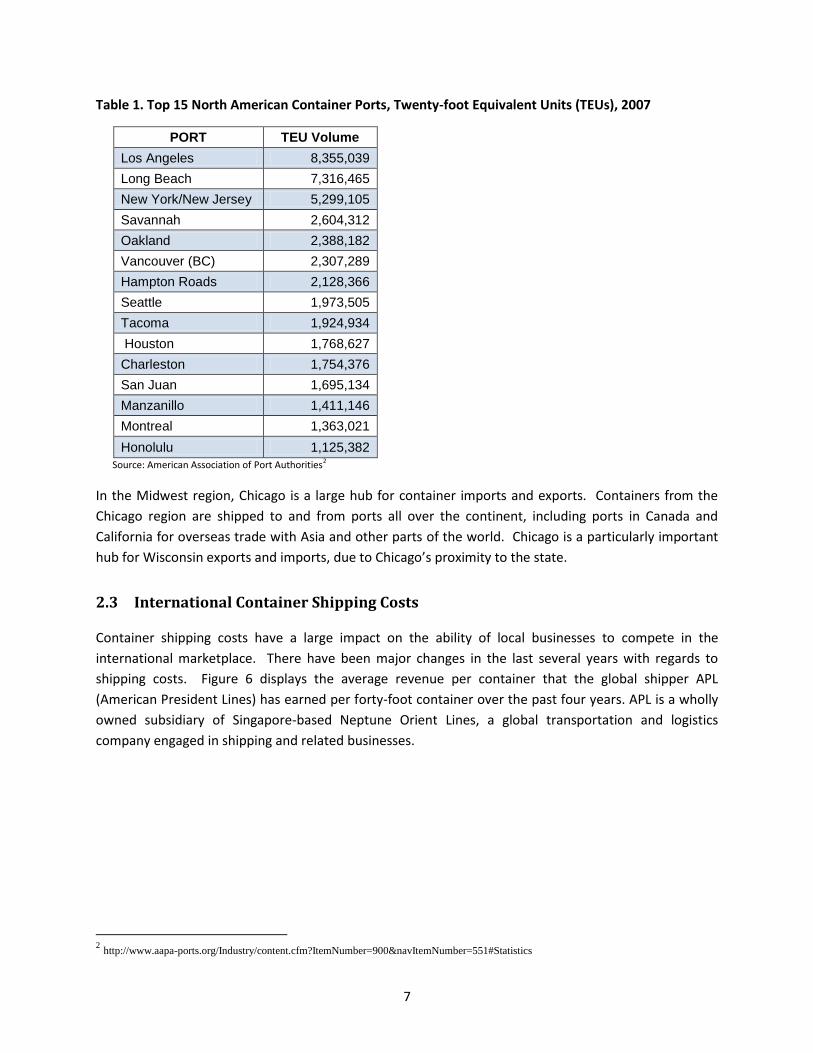
incoming and outgoing container trans-Atlantic and Panama Canal traffic. Table 1 displays the top North
American container ports and the number of twenty-foot equivalent units (TEUs) passing through each
of these ports.
7
Table 1. Top 15 North American Container Ports, Twenty-foot Equivalent Units (TEUs), 2007
PORT TEU Volume
Los Angeles 8,355,039
Long Beach 7,316,465
New York/New Jersey 5,299,105
Savannah 2,604,312
Oakland 2,388,182
Vancouver (BC) 2,307,289
Hampton Roads 2,128,366
Seattle 1,973,505
Tacoma 1,924,934
Houston 1,768,627
Charleston 1,754,376
San Juan 1,695,134
Manzanillo 1,411,146
Montreal 1,363,021
Honolulu 1,125,382
Source: American Association of Port Authorities2
In the Midwest region, Chicago is a large hub for container imports and exports. Containers from the
Chicago region are shipped to and from ports all over the continent, including ports in Canada and
California for overseas trade with Asia and other parts of the world. Chicago is a particularly important
hub for Wisconsin exports and imports, due to Chicago’s proximity to the state.
2.3 International Container Shipping Costs
Container shipping costs have a large impact on the ability of local businesses to compete in the
international marketplace. There have been major changes in the last several years with regards to
shipping costs. Figure 6 displays the average revenue per container that the global shipper APL
(American President Lines) has earned per forty-foot container over the past four years. APL is a wholly
owned subsidiary of Singapore-based Neptune Orient Lines, a global transportation and logistics
company engaged in shipping and related businesses.
2 http://www.aapa-ports.org/Industry/content.cfm?ItemNumber=900&navItemNumber=551#Statistics

8
Figure 6. APL Average Revenue per Forty-foot Equivalent Unit (FEU) (Monthly, 2005-2009)
Source: NOL/APL3
The data in Figure 6 comes from a large shipper (APL) with a comprehensive global network, thus giving
us a decent indication of average shipping costs per forty-foot equivalent unit (FEU) and revenues in the
industry. It is evident from Figure 6 that shipping prices in early 2007 were relatively low, when
compared to the surge in prices experienced from then until fall 2008. Since then, prices have dropped
substantially. From Mar. 2008 to Mar. 2009, shipping revenue per container dropped nearly 20% for
APL as a result of the global economic recession experienced during this time period.
When looking at a specific route, such as Hong Kong to Los Angeles, we see a similar pattern in costs.
Figure 7 highlights the recent decline in shipping costs (not adjusted for inflation) of a container from
Hong Kong to Los Angeles. As the global recession has spread, we can see that container traffic between
China and the US has become less expensive.
3 www.nol.com.sg
Jan
2005 Jan
2006
Jan
2007
Jan
2008 Jan
2009

9
Figure 7. Container Shipping Cost - Hong Kong to Los Angeles, per TEU
Source: Drewry Shipping Consultants4
While overseas shipping costs have declined sharply in recent times, the cost of shipping goods
domestically on U.S. railroads has also decreased substantially in the past 30 years. Figure 8 highlights
the dramatic decrease in cost of shipping per mile on railroad in the U.S. following the Staggers Rail Act
of 1980.
Figure 8. US Freight Railroad Rates 1981-2007, Inflation Adjusted
Source: Association of American Railroads, Rail Time Indicators (www.aar.org)
More recent figures for railroad costs were not available, but the graph above gives a general idea of
railroad costs through 2007. Aside from the general decrease in prices, a small bump in the revenue per
ton-mile is evident from 2004 until 2007.5
4Values found in the “By the Numbers” section in the Journal of Commerce.
5 Rail Time Indicators, American Association of Railroads, May 2009.
$0
$500
$1,000
$1,500
$2,000
$2,500
May 2007
Dec 2007
May 2008
Dec 2008
April 2009
Container Shipping Cost ($), Hong Kong to Los Angeles, in TEU's
Shipping Cost ($)

10
Next, the cost of truck shipments per mile for dry van, refrigerated, and flat bed movements have all
decreased to levels below 2007 values. Figure 9 shows a distinct drop in shipping rate since summer
2008, when signs of the economic downturn became apparent. As of November 2008, flat bed rates
averaged around $2 per mile.
Figure 9. National Truck Shipment Rates (incl fuel surcharge), 2007-2008 $/Mile
Source: www.truckloadrate.com6
Generally, economists predict an economic recovery by 2011, which should stabilize declining shipping
costs. However, it is uncertain exactly when global economic stabilization will occur, or when the
decline in shipping costs will be reversed.
2.4 Container Information
Container traffic has revolutionized the shipping industry since its beginnings in the 1950’s.
Containerization standardized much of the shipping industry, which drastically reduced the cost of
shipping goods throughout the world.
Containers come in different sizes, as highlighted in Table 2 and Appendix B. The 20 and 40 foot
containers are the most common containers used. Appendix B shows the weight of the containers used
by some of the largest shipping companies in the world. It becomes evident that neither size nor the
weight of the containers is uniform across these major companies. However, the size and maximum
weights do have more similarities than differences.
Containers deliver a quality of product that is equal to or better than standard bulk delivery. However,
container inspection fees are four times higher than bulk.7 Nonetheless, Global Insight predicts an
increase in world container traffic from 96 million TEU’s in 2007 to 243 million TEU’s in 2024, or a 186%
increase.
6 http://www.truckloadrate.com/truckload_rate_history_charts.htm?chart=TA
7 Global Soybean & Grain Transport 2008: Opportunities and Challenges in Containerized Shipping – PowerPoint
Presentations from this conference published on CD Rom, 2008.

11
In the past 3 years, much of the grain container loading operations have shifted to the Midwest because
of the proximity to the grain supply and the proximity to the rail yards that handle containerized cargo.
Chicago has become a hub for much of this traffic. The total number of Chicago-area facilities that
exported grain by container was eight in 2002, and has risen to 130 in 2008.8
Table 2. Container Dimensions
Category Exterior
Dimensions Interior
Dimensions Door Opening Cube Capacity Weights
20’ Dry Freight Container
Length 19’ 10 ½”
6.06 m 19’ 3 7/8”
5.90 m
1,173 ft3 33.2 m3
Tare 5,160 lbs 2,340 kg
Width 8’ 0”
2.44 m 7’ 8 ¼” 2.35 m
7’ 8 ¼” 2.34 m
Maximum Payload
47,740 lbs 21,660 kg
Height 8’ 6”
2.59 m 7’ 9 7/8” 2.39 m
7’ 5 ¼” 2.28 m
ISO Maximum Gross
52,900 lbs 24,000 kg
40’ Dry Freight Container
Length 40’ 0”
12.19 m 39’ 5 ¼” 12.02 m
2,391 ft3 67.7 m3
Tare 8,730 lbs 3,960 kg
Width 8’ 0”
2.44 m 7’ 8 ¼” 2.35 m
7’ 8 ¼” 2.34 m
Maximum Payload
58,470 lbs 26,520 kg
Height 8’ 6”
2.59 m 7’ 9 7/8” 2.39 m
7’ 5 ¼” 2.28 m
ISO Maximum Gross
67,200 lbs 30,480 kg
40’ High Cube
Length 40’ 0”
12.19 m 39’ 5 ¼” 12.02 m
2,692 ft3 76.2 m3
Tare 9,150 lbs 4,150 kg
Width 8’ 0”
2.44 m 7’ 8 ¼” 2.35 m
7’ 8 ¼” 2.34 m
Maximum Payload
58,050 lbs 26,330 kg
Height 9’ 6”
2.89 m 8’ 10 3/8”
2.69 m 8’ 5 5/8” 2.58 m
ISO Maximum Gross
67,200 lbs 30,480 kg
45’ High Cube
Length 45’ 0”
13.72 m 44’ 1 ½” 13.58 m
3,026 ft3 85.7 m3
Tare 9,061 lbs 4,110 kg
Width 8’ 0”
2.43 m 7’ 8 ¼” 2.35 m
7’ 8” 2.34 m
Maximum Payload
62,588 lbs 28,390 kg
Height 9’ 6”
2.89 m 8’ 10” 2.69 m
7’ 5 ¾” 2.58 m
ISO Maximum Gross
71,650 lbs 32,500 kg
48’ Domestic Dry Freight Container
Length 48’ 0”
14.63 m 47’ 3 7/8” 14.42 m
3,469.1 ft3 98.01 m3
Tare 9,700 lbs 4,399 kg
Width 8’ 6”
2.59 m 7’ 2 ½” 2.20 m
8’ 2 ¼” 2.49 m
Maximum Payload
57,200 lbs 26,077 kg
Height 9’ 6”
2.89 m 8’ 11” 2.71 m
8’ 11” 2.71 m
ISO Maximum Gross
67,200 lbs 30,480 kg
53’ Domestic Dry Freight Container
Length 53’ 0”
16.15 m 52’ 6”
16.03 m
3,830 ft3 108.5 m3
Tare 10,280 lbs 4,665 kg
Width 8’ 6”
2.59 m 8’ 2 ½” 2.50 m
8’ 4” 2.54 m
Maximum Payload
56,920 lbs 25,815 kg
Height 9’ 6”
2.89 m 8’ 10 ½’ 2.70 m
8’ 10 ½” 2.70 m
ISO Maximum Gross
67,200 lbs 30,480 kg
European Wide Body
Length 40’
12.19 m 39’ 8 ½” 12.10 m
2,641 ft3
74.8 m3
Tare 7,385 lbs 3,350 kg
Width 8’ 1 ½” 2.50 m
8’ 0 ½” 2.45 m
7’ 11 ¼” 2.42m
Maximum Payload
59,810 lbs 27,130 kg
Height 8’ 11” 2.74 m
8’ 3” 2.51m
7’ 11 ¼” 2.42 m
ISO Maximum Gross
67,195 lbs 30,480 kg
Source: APL
8 Ibis

12
2.5 Transloading and Crossdocking
An area of interest for this project is the cost involved in transloading and crossdocking goods. Basically,
these processes are performed at intermodal stations in order to optimize the shipment for the business
and to meet weight restrictions. For example, an overweight container might be shipped to a port city
from abroad, where the state regulations for truck weight are more restrictive than at the origin. As a
result, the shipment needs to be broken down so that the truck leaving the port meets state or federal
truck weight regulations. From interviews, we learned that transloading containers is a cost-intensive
process, due to the time commitment involved. One Wisconsin shipper indicated that upon export of
products in containers, a sealed container will usually not be opened after closing in the U.S. to avoid
the costs involved with reopening a container.
One method that is used by several large businesses, including Wal-Mart, is the process of crossdocking.
It consists of unloading materials from an incoming container, trailer, or rail car and loading these
materials into outbound trailers or rail cars, with little or no storage in between. This could be done by
sorting materials for shipment to different destinations or combining them for shipments to the same
destination. Figure 10 gives a high-level overview of this process.
Figure 10. Crossdocking Process9
This crossdocking model is ideal for large corporations with complex logistics supply chains, as it allows
them to reap the benefits of Just-In-Time warehousing. Businesses selling perishable products benefit
from this model as opposed to the warehouse storage model, as faster transport means a longer shelf
life for the product.
Much simpler renditions of the above model occur at many ports, where goods are moved from one
truck to another in order to meet local weight limits.
9 Doyle, Chris; Cross Docking Series; Cisco Eagle; 2007; http://www.cisco-
eagle.com/blog/index.php/2007/12/05/brief-1-cross-docking-is-it-right-for-me/

13
3 International Freight Movement – Wisconsin
As we can see from many of the graphs in Section 2, the recent economic downturn has had an impact
on the national economy and on shipping costs domestically and overseas. The Wisconsin economy has
also suffered as a result of the recent recession, as consumer confidence has continued to dip
worldwide, thus reducing demand for state products. While this section will not go into the details of
the impacts of the recent recession, it will focus on highlighting major international trading partners, the
location of freight infrastructure in the state, and rail commodity flow data. WisDOT has purchased
international trade data from IHS Global Insight, which will allow the research team to understand
international container commodity flows in the state. However, this data was not available at the time
of publishing and will be analyzed at a later date.
3.1 Wisconsin Major International Trading Partners
Wisconsin conducts international trade with a large number of countries, and exports many of its goods
throughout the world. Table 3 highlights the top fifteen major export locations for Wisconsin Goods in
1996 and in 2008.
Table 3. Wisconsin Top 15 Export Countries, 2008 and 1996 (Nominal $ Values)
Country 2008 Country 1996
Canada $6,497,734,843 Canada $3,127,610,098
Mexico $1,761,699,777 Japan $669,979,514
China $1,231,217,872 United Kingdom $549,239,636
Germany $790,364,653 Germany $470,630,235
Japan $724,430,311 Mexico $360,969,270
United Kingdom $683,135,175 France $322,432,489
Australia $583,454,343 Unidentified $259,211,423
Saudi Arabia $556,285,248 Saudi Arabia $256,231,560
France $517,860,363 Netherlands $254,539,946
Brazil $420,055,200 Australia $242,578,971
Belgium $414,084,434 Korean Republic $197,510,167
Netherlands $365,876,440 Hong Kong $184,031,253
Korean Republic $344,051,444 Belgium $171,917,506
Chile $307,704,907 Taiwan $157,015,888
Italy $307,343,468 Italy $145,081,553 Source: Wisconsin Department of Commerce
We see several interesting trends upon analysis of the above table. First, and most significantly, we see
the exponential increase in trade between Wisconsin and China. In 1996, China was not on the list of
14
the top 15 export partners. In 2008, China was the third largest importer of Wisconsin goods, behind
NAFTA partners Canada and Mexico. Much of the containerized traffic is overseas traffic, with China
being a major user of containers. Next, trade with Mexico has also increased substantially in the past 12
years. Canada overwhelmingly is the largest importer of Wisconsin’s products, receiving nearly 6 times
as many goods (in $) than second place Mexico receives. This has to do with Wisconsin proximity to
Canada and the close trade relationship that the United States and Canada share.
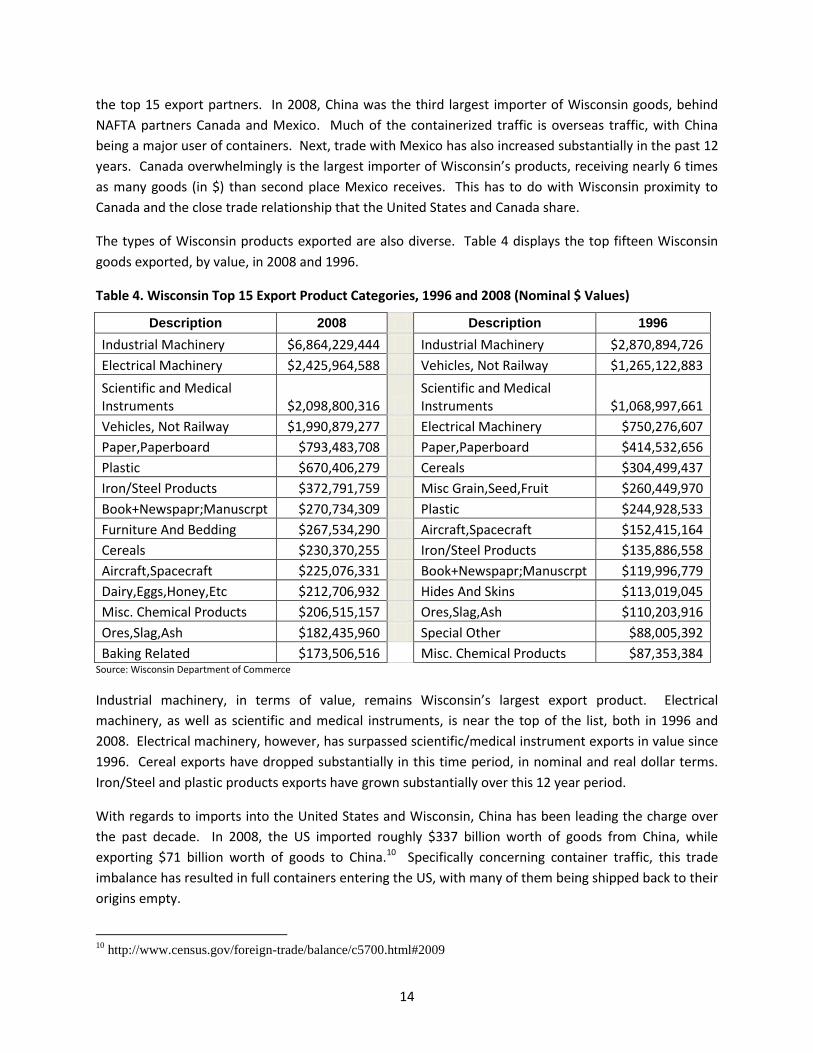
The types of Wisconsin products exported are also diverse. Table 4 displays the top fifteen Wisconsin
goods exported, by value, in 2008 and 1996.
Table 4. Wisconsin Top 15 Export Product Categories, 1996 and 2008 (Nominal $ Values)
Description 2008 Description 1996
Industrial Machinery $6,864,229,444 Industrial Machinery $2,870,894,726
Electrical Machinery $2,425,964,588 Vehicles, Not Railway $1,265,122,883
Scientific and Medical Instruments $2,098,800,316
Scientific and Medical Instruments $1,068,997,661
Vehicles, Not Railway $1,990,879,277 Electrical Machinery $750,276,607
Paper,Paperboard $793,483,708 Paper,Paperboard $414,532,656
Plastic $670,406,279 Cereals $304,499,437
Iron/Steel Products $372,791,759 Misc Grain,Seed,Fruit $260,449,970
Book+Newspapr;Manuscrpt $270,734,309 Plastic $244,928,533
Furniture And Bedding $267,534,290 Aircraft,Spacecraft $152,415,164
Cereals $230,370,255 Iron/Steel Products $135,886,558
Aircraft,Spacecraft $225,076,331 Book+Newspapr;Manuscrpt $119,996,779
Dairy,Eggs,Honey,Etc $212,706,932 Hides And Skins $113,019,045
Misc. Chemical Products $206,515,157 Ores,Slag,Ash $110,203,916
Ores,Slag,Ash $182,435,960 Special Other $88,005,392
Baking Related $173,506,516 Misc. Chemical Products $87,353,384 Source: Wisconsin Department of Commerce
Industrial machinery, in terms of value, remains Wisconsin’s largest export product. Electrical
machinery, as well as scientific and medical instruments, is near the top of the list, both in 1996 and
2008. Electrical machinery, however, has surpassed scientific/medical instrument exports in value since
1996. Cereal exports have dropped substantially in this time period, in nominal and real dollar terms.
Iron/Steel and plastic products exports have grown substantially over this 12 year period.
With regards to imports into the United States and Wisconsin, China has been leading the charge over
the past decade. In 2008, the US imported roughly $337 billion worth of goods from China, while
exporting $71 billion worth of goods to China.10 Specifically concerning container traffic, this trade
imbalance has resulted in full containers entering the US, with many of them being shipped back to their
origins empty.
10
http://www.census.gov/foreign-trade/balance/c5700.html#2009
15
3.2 Wisconsin’s International Trade Infrastructure
In order to maintain the global competitiveness of Wisconsin products and to continue improving
Wisconsin’s high standard of living, a reliable, efficient, and well-planned transportation infrastructure is
necessary to facilitate international trade. The intent of this section is to highlight major trade transfer
points, railways, seaports and intermodal stations, all of which work together with the highway system
to import and export goods effectively in Wisconsin.
3.2.1 Wisconsin Seaports
One of Wisconsin’s assets is its advantageous location on Lakes Michigan and Superior. These lakes
connect to the St. Lawrence Seaway, which connects Wisconsin with the Atlantic Ocean and the rest of
the world. As a result, several major seaports exist on Lake Michigan and Lake Superior to support
international trade. Figures 11 and 12 highlight international imports and exports, respectively, at these
seaports.
While many of Wisconsin’s international exports leave the state via other modes than sea, such as by
rail or truck, and then by sea from large coastal ports, it is important to highlight Wisconsin’s port traffic.
Other significant ports exist in Wisconsin than the ones shown in the figures below, but the ports noted
handle the most significant amounts of international freight. The Port of Milwaukee is the largest
importer of goods in Wisconsin, both in terms of value and weight (Figure 11). The ports of Green Bay
and Marinette are also significant importers into Wisconsin. Green Bay imports higher value goods; the
value of goods imported to Green Bay nearly equal those imported to Milwaukee, with around 1/3 of
the tonnage. For exports, Milwaukee and Racine are the most prominent ports for international trade in
the state. After initial discussions and research, it appears that the number of international
containerized movements is relatively small. This topic will be analyzed in further detail once the USITM
data is available to the research team.
When comparing Wisconsin imports with exports, it is hard to overlook the gap in the amount imported
versus exported through Wisconsin’s seaports. For example, Milwaukee imports nearly 1.1 million tons
of goods, while exporting around 55 thousand tons, about 1/20th the amount imported. Smaller ports,
such as Racine, Manitowoc, and Ashland, also export more than they import. When looking at all the
Wisconsin ports, a major gap exists between exports and imports, which are indicative of the national
trade imbalance.

[16]
Figure 11. Wisconsin Seaports - Imports from International Markets (by Value and kg)
Source: STAT-USA and Foreign Trade Division, U.S. Census Bureau11
11
www.worldportsource.com

[17]
Figure 12. Wisconsin Seaports - Exports to International Markets (by Value and kg)
Source: STAT-USA and Foreign Trade Division, U.S. Census Bureau12
12
www.worldportsource.com

[18]
3.2.2 Wisconsin Freight Railroad Infrastructure & Goods Movement
3.2.2.1 Freight Rail Infrastructure
While the seaports shown above are an important mechanism for importing and exporting goods to and
from Wisconsin, another important component of the transportation infrastructure is the rail network
and transfer hubs. Rail freight movements connect the Midwest with large coastal ports, primarily in
Canada, Seattle, and California. Chicago also is a rail freight hub for traffic moving to the east coast.
Several of these rail lines that move goods from the Midwest to the west coast move through
Wisconsin. Figure 13 highlights the rail lines, intermodal stations, and transload facilities in Wisconsin.
Figure 13. Wisconsin Railroad Facilities, 2008
Source: Wisconsin DOT
[19]
The figure above shows that Canadian National and Canadian Pacific own major portions of the trans-
Wisconsin rail right-of-ways, as does Union Pacific and Wisconsin Southern. Transload facilities are
located along CN, CP, and Wisconsin Southern rail lines. Transload facilities allow for transfer of one
mode to another, i.e. truck to rail, rail to truck, truck to sea, etc. Since much of Wisconsin’s
international freight leaves the state by rail, intermodal and transload facilities are the critical
connecting points between the short-haul truck and rail modes. For example, soybeans could be
produced 80 miles from a transload facility. The final destination for the soybeans is China. The trip
could start by truck at the production site, then is trucked to a CN transload facility in Wisconsin, where
it is then sent by rail to Vancouver. From there, the container is placed on a ship to China for final
distribution. Currently, some shippers go through Illinois before containerizing the product, for reasons
discussed in later sections of this report.
A detailed map of Wisconsin’s roads and their relationship to the system is not added in this report.
However, the roads are the backbone to Wisconsin’s strong economy and ability to export. These roads
connect decentralized businesses with rail lines and seaports, and are responsible for enabling transport
of much international freight by truck to seaports around the country.
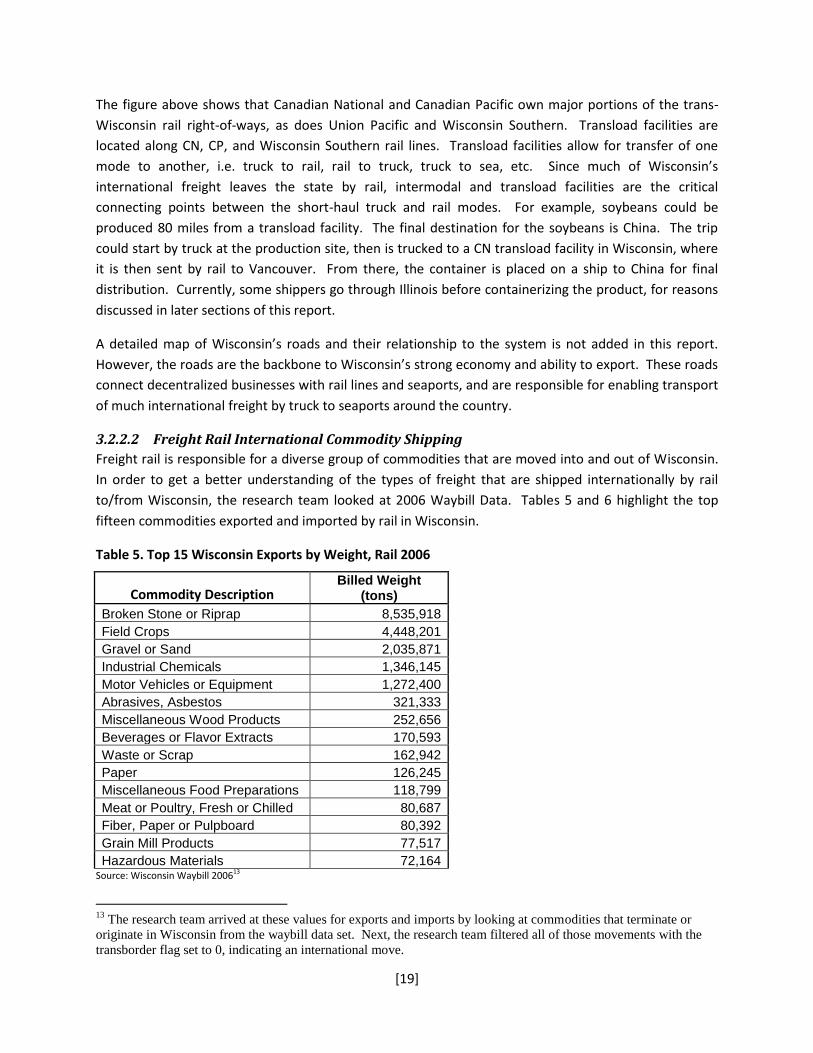
3.2.2.2 Freight Rail International Commodity Shipping
Freight rail is responsible for a diverse group of commodities that are moved into and out of Wisconsin.
In order to get a better understanding of the types of freight that are shipped internationally by rail
to/from Wisconsin, the research team looked at 2006 Waybill Data. Tables 5 and 6 highlight the top
fifteen commodities exported and imported by rail in Wisconsin.
Table 5. Top 15 Wisconsin Exports by Weight, Rail 2006
Commodity Description Billed Weight
(tons)
Broken Stone or Riprap 8,535,918
Field Crops 4,448,201
Gravel or Sand 2,035,871
Industrial Chemicals 1,346,145
Motor Vehicles or Equipment 1,272,400
Abrasives, Asbestos 321,333
Miscellaneous Wood Products 252,656
Beverages or Flavor Extracts 170,593
Waste or Scrap 162,942
Paper 126,245
Miscellaneous Food Preparations 118,799
Meat or Poultry, Fresh or Chilled 80,687
Fiber, Paper or Pulpboard 80,392
Grain Mill Products 77,517
Hazardous Materials 72,164 Source: Wisconsin Waybill 200613
13
The research team arrived at these values for exports and imports by looking at commodities that terminate or
originate in Wisconsin from the waybill data set. Next, the research team filtered all of those movements with the
transborder flag set to 0, indicating an international move.

[20]
Table 6. Top 15 Wisconsin Imports by Weight, Rail 2006
Commodity Description Billed Weight
(tons)
Bituminous Coal14
144,788,523
Miscellaneous Coal or Petroleum Products 2,388,703
Iron Ores 2,137,060
Industrial Chemicals 1,970,727
Field Crops 1,187,721
Pulp or Pulp Mill Products 1,016,227
Motor Vehicles or Equipment 765,386
Abrasives, Asbestos 588,793
Sawmill or Planning Mill Products 483,759
Miscellaneous Wood Products 413,503
Paper 391,983
Primary Forest Materials 352,890
Plastic Matter or Synth Fibres 277,538
Fiber, Paper or Pulpboard 257,686
Waste or Scrap 230,955 Source: Wisconsin Waybill 2006
From this data, it becomes evident that coal, iron ores, petroleum products and chemicals and field
crops top the list of imports by rail while broken stone, field crops, gravel/sand, and chemicals top the
list for exports by rail. A more detailed comparison with truck imports and exports by commodity into
the state will be possible upon receipt of the USITM data.
4 International Container Weight Limits – Wisconsin and Bordering
States
The information provided in the sections above give context to the international freight situation in
Wisconsin. The intent of this section is to spell out the truck weight regulations that impact the cost of
doing business in Wisconsin. Wisconsin’s regulation of container weight movements, as well the
regulations of key border states, impact the economies and the costs of doing business in each state.
This section will focus specifically on regulations concerning international movements in containers. For
further details on general truck size and weight regulations and related discussions, see Appendix A.
One item to note before looking at state specific policy is the federal government’s ‘nondivisible load’
policy. The Federal Highway Administration (FHWA) has indicated that a state may treat a sealed
containerized load moving in international commerce as a nondivisible load. The definition of what shall
14
There are other measures of coal imports which suggest that this estimate is too high. According to some sources
(including http://bioenergy.checkbiotech.org/news/first_wisconsin_bioenergy_crop_pilot_project_announced), the
amount of coal imported by Wisconsin is closer to 26,000,000 tons per year. Either way, it is key to note that coal is
a primary import by rail to Wisconsin.

[21]
be deemed as nondivisible is determined by each state. Illinois and Minnesota have decided to allow
heavier international containerized loads to travel their roads, while Wisconsin does not allow heavier
loads.
4.1 Wisconsin Limits and Regulations
Wisconsin does not have any special weight exemptions for the movement of containerized or
international goods. While Wisconsin does have a long list of exemptions for specific products being
carried in bulk, containerized shipments cannot be heavier than 80,000 pounds maximum, including the
weight of the tractor without an overweight permit. For example, currently Wisconsin will issue permits
for carrying an ethanol byproduct, dried distillers grains (DDGS), at more than 80,000 pounds. This
product moves domestically and internationally, and is carried in containers.
4.2 Minnesota Limits and Regulations
Minnesota recently changed their regulations to allow trucks moving internationally to carry heavier
weights, if they are carrying agricultural products. Minnesota law stipulates that:
Effective August 1, 2008, this new permit allows transport of sealed intermodal containers containing Ag products that are in international movement up to 90,000 lbs GVW (99,000 lbs GVW during winter weight increase season) on six axles. This $300.00 permit allows travel on Interstate highways.
This wording explicitly refers to the movement of international goods in sealed containers. Upon
interviews with Minnesota DOT representatives, this change was made in the interest of the economy,
as businesses such as Cargill and ADM would see substantial cost savings from less restrictive weight
limit regulations of containerized truck movements. Emerging industries, such as soybean production,
would also benefit if restrictions were eased for this product. Minnesota has used the FHWA latitude on
defining divisible loads as the basis for this decision.
4.3 Illinois Limits and Regulations
The state of Illinois has also taken advantage of the fact that FHWA allows states to interpret sealed
international containers as nondivisible loads. In Illinois, all requests for overweight moves are
considered for overweight permits. However, excess weights have been grouped into ‘practical
maximum weights (routine)” and “superload weights.” Practical maximum weights are those weights in
excess of the general weight limit of 80,000 pounds but less than Superload weights, which can be up to
120,000 pounds. Practical maximum weights are shown here:
a) 6-axle tractor semi trailer combination 120,000 pounds gross; 48,000 pounds on drive tandem; 60,000 pounds on semi trailer 3-axle tandem.
b) 5-axle tractor semi trailer combination 100,000 pounds gross; maximum of 48,000 pounds on either tandem.
[22]
c) 4-or-more-axle vehicle (axle spacing 23 feet or more): 76,000 pounds gross; maximum of 34,000 pounds on one Tandem and 44,000 pounds on the other.
d) 3-or-more-axle vehicle (axle spacing 18 feet or more): maximum 68,000 pounds gross; 20,000 pounds on one axle and 48,000 pounds on the tandem.
e) 2-axle vehicle: maximum 48,000 pounds, neither axle exceeds 25,000 pounds.
Thus, under practical maximum weight limits, the maximum weight for a 5-axle containerized shipment
is 100,000 lbs, while the maximum weigh for a 6-axle containerized shipment is 120,000 lbs. If the
weight exceeds these maximum weight limits, an overweight permit may still be allowed, dependant on
the route in question and whether the infrastructure will support that shipment. No applications for the
‘superload’ type have been received through mid-March of 2009. For any overweight sealed
international containers, permits are required. Such permits will be issued if the sealed container has
accompanying paperwork (such as the bill of lading) indicating that it is an international shipment.
4.4 Iowa Limits and Regulations
Like most other states, Iowa roadways are categorized into two specific groups. One group consists of
Interstate highways; the second group consists of all other highways or non-Interstate highways. All
vehicles are subject to being weighed to determine compliance with applicable weight laws and no
specific language is directed at international containers.
Iowa law provides for maximum weight limits which may be carried on any tire, single axle, group of
consecutive axles, and gross weight for any vehicle or combination of vehicles. Iowa does allow five-axle
livestock transportation trucks with a spread axle trailer to a gross weight of 86,000 pounds under
limiting size conditions.
4.5 Michigan Limits and Regulations
Michigan’s truck weight law is designed to control axle loads instead of gross vehicle weight. Michigan
limits the weight allowed on individual axles, depending upon the spacing between them, with a
maximum of eleven axles. The calculated maximum allowable gross vehicle weight on the heaviest
“Michigan-weight-law truck” is 164,000 pounds, which can only be achieved with the use of eleven
properly spaced axles. Most of these axles carry only 13,000 pounds each.
No specific policy is in place for international containers, however, the higher weight and axle
configurations allow containers to be fully loaded for many commodities and transported on Michigan’s
non-Interstate system.
4.6 Other Limits and Regulations of Interest
There are a number of states that allow trucks carrying sealed ocean containers to travel at higher
weight limits. This section includes a brief look at Kansas, California, and New York.
[23]
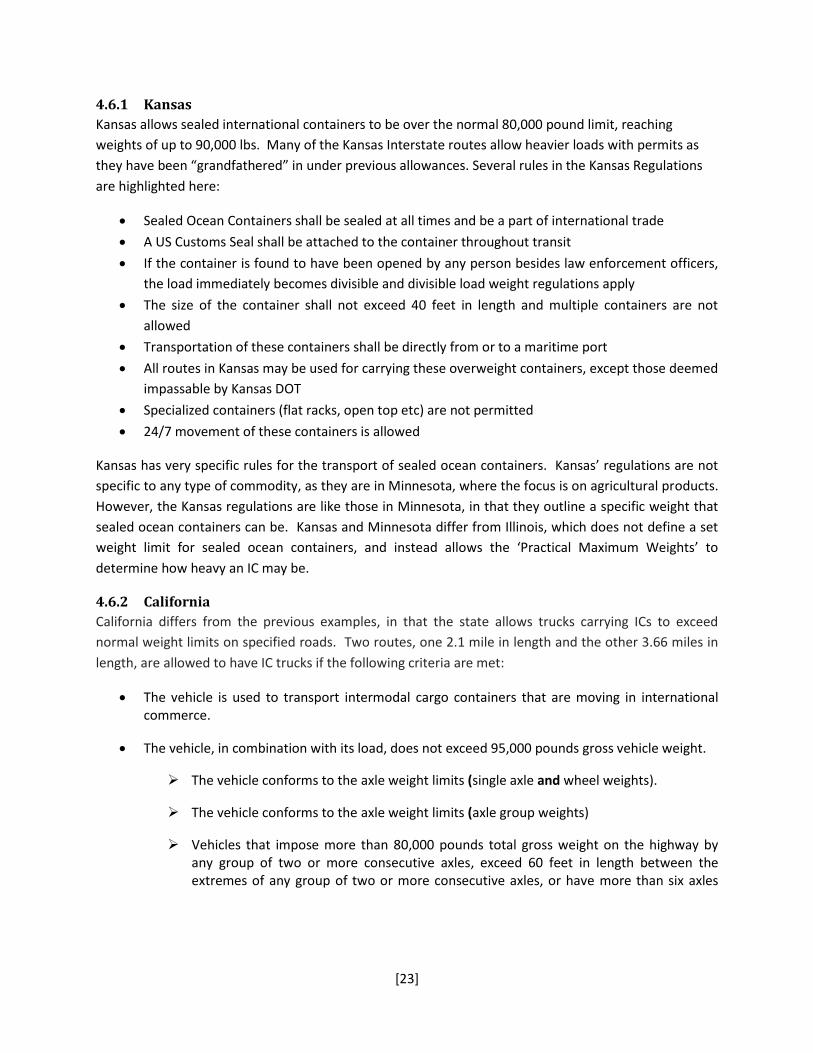
4.6.1 Kansas
Kansas allows sealed international containers to be over the normal 80,000 pound limit, reaching
weights of up to 90,000 lbs. Many of the Kansas Interstate routes allow heavier loads with permits as
they have been “grandfathered” in under previous allowances. Several rules in the Kansas Regulations
are highlighted here:
Sealed Ocean Containers shall be sealed at all times and be a part of international trade
A US Customs Seal shall be attached to the container throughout transit
If the container is found to have been opened by any person besides law enforcement officers,
the load immediately becomes divisible and divisible load weight regulations apply
The size of the container shall not exceed 40 feet in length and multiple containers are not
allowed
Transportation of these containers shall be directly from or to a maritime port
All routes in Kansas may be used for carrying these overweight containers, except those deemed
impassable by Kansas DOT
Specialized containers (flat racks, open top etc) are not permitted
24/7 movement of these containers is allowed
Kansas has very specific rules for the transport of sealed ocean containers. Kansas’ regulations are not
specific to any type of commodity, as they are in Minnesota, where the focus is on agricultural products.
However, the Kansas regulations are like those in Minnesota, in that they outline a specific weight that
sealed ocean containers can be. Kansas and Minnesota differ from Illinois, which does not define a set
weight limit for sealed ocean containers, and instead allows the ‘Practical Maximum Weights’ to
determine how heavy an IC may be.
4.6.2 California
California differs from the previous examples, in that the state allows trucks carrying ICs to exceed
normal weight limits on specified roads. Two routes, one 2.1 mile in length and the other 3.66 miles in
length, are allowed to have IC trucks if the following criteria are met:
The vehicle is used to transport intermodal cargo containers that are moving in international commerce.
The vehicle, in combination with its load, does not exceed 95,000 pounds gross vehicle weight.
The vehicle conforms to the axle weight limits (single axle and wheel weights).
The vehicle conforms to the axle weight limits (axle group weights)
Vehicles that impose more than 80,000 pounds total gross weight on the highway by any group of two or more consecutive axles, exceed 60 feet in length between the extremes of any group of two or more consecutive axles, or have more than six axles
[24]
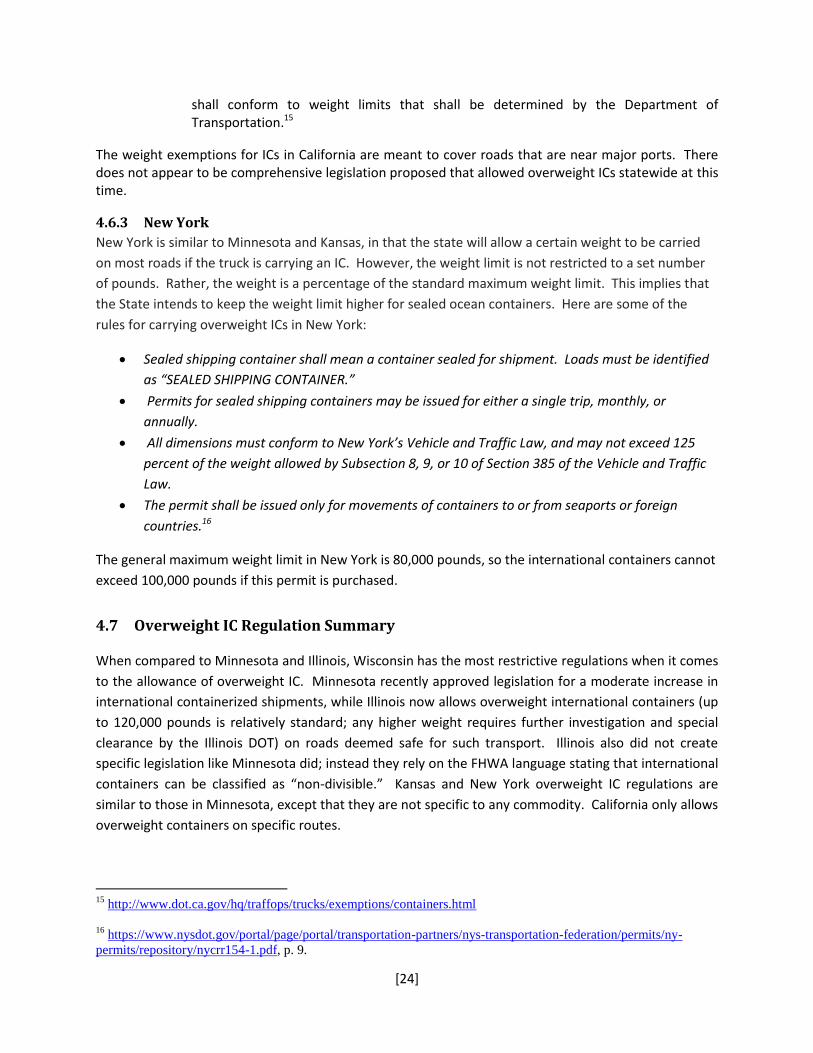
shall conform to weight limits that shall be determined by the Department of Transportation.15
The weight exemptions for ICs in California are meant to cover roads that are near major ports. There does not appear to be comprehensive legislation proposed that allowed overweight ICs statewide at this time.
4.6.3 New York
New York is similar to Minnesota and Kansas, in that the state will allow a certain weight to be carried
on most roads if the truck is carrying an IC. However, the weight limit is not restricted to a set number
of pounds. Rather, the weight is a percentage of the standard maximum weight limit. This implies that
the State intends to keep the weight limit higher for sealed ocean containers. Here are some of the
rules for carrying overweight ICs in New York:
Sealed shipping container shall mean a container sealed for shipment. Loads must be identified
as “SEALED SHIPPING CONTAINER.”
Permits for sealed shipping containers may be issued for either a single trip, monthly, or
annually.
All dimensions must conform to New York’s Vehicle and Traffic Law, and may not exceed 125
percent of the weight allowed by Subsection 8, 9, or 10 of Section 385 of the Vehicle and Traffic
Law.
The permit shall be issued only for movements of containers to or from seaports or foreign
countries.16
The general maximum weight limit in New York is 80,000 pounds, so the international containers cannot
exceed 100,000 pounds if this permit is purchased.
4.7 Overweight IC Regulation Summary
When compared to Minnesota and Illinois, Wisconsin has the most restrictive regulations when it comes
to the allowance of overweight IC. Minnesota recently approved legislation for a moderate increase in
international containerized shipments, while Illinois now allows overweight international containers (up
to 120,000 pounds is relatively standard; any higher weight requires further investigation and special
clearance by the Illinois DOT) on roads deemed safe for such transport. Illinois also did not create
specific legislation like Minnesota did; instead they rely on the FHWA language stating that international
containers can be classified as “non-divisible.” Kansas and New York overweight IC regulations are
similar to those in Minnesota, except that they are not specific to any commodity. California only allows
overweight containers on specific routes.
15
http://www.dot.ca.gov/hq/traffops/trucks/exemptions/containers.html
16
https://www.nysdot.gov/portal/page/portal/transportation-partners/nys-transportation-federation/permits/ny-
permits/repository/nycrr154-1.pdf, p. 9.

[25]
Many states, however, do not specifically address international containers in their truck size and weight
policies.
Wisconsin’s lack of overweight allowance for trucks carrying IC may have some cost implications for
Wisconsin businesses. This is discussed in further detail in the next section.
[26]
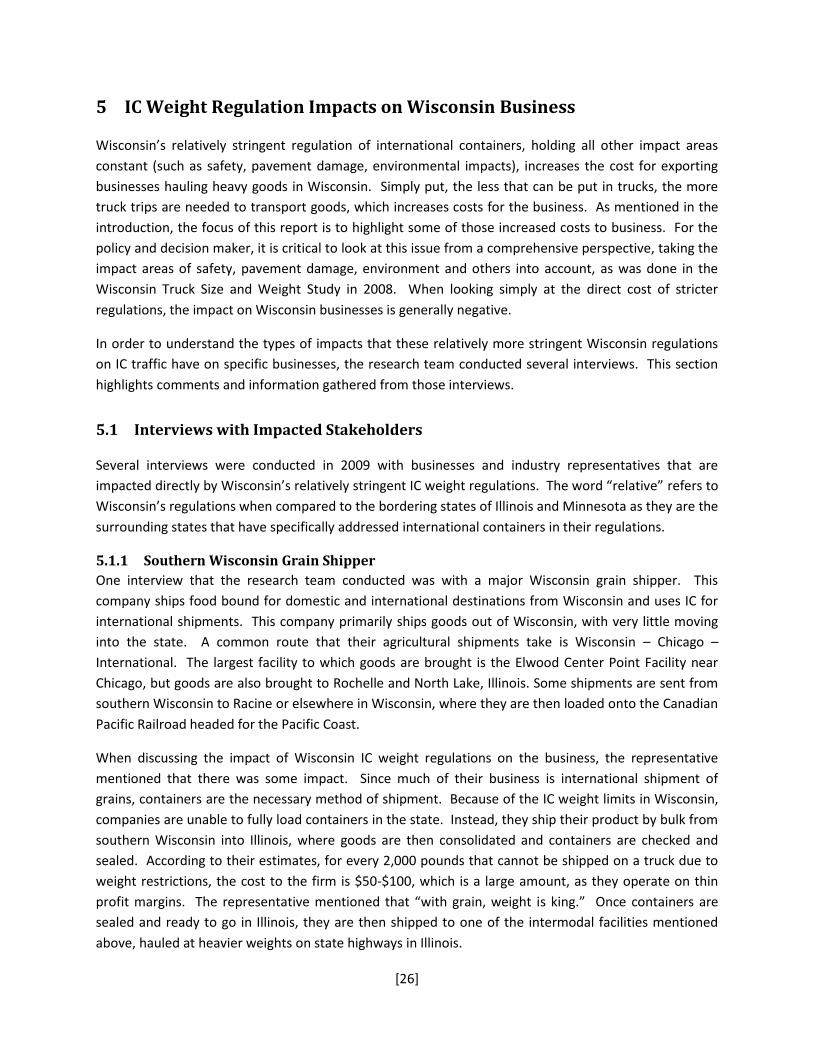
5 IC Weight Regulation Impacts on Wisconsin Business
Wisconsin’s relatively stringent regulation of international containers, holding all other impact areas
constant (such as safety, pavement damage, environmental impacts), increases the cost for exporting
businesses hauling heavy goods in Wisconsin. Simply put, the less that can be put in trucks, the more
truck trips are needed to transport goods, which increases costs for the business. As mentioned in the
introduction, the focus of this report is to highlight some of those increased costs to business. For the
policy and decision maker, it is critical to look at this issue from a comprehensive perspective, taking the
impact areas of safety, pavement damage, environment and others into account, as was done in the
Wisconsin Truck Size and Weight Study in 2008. When looking simply at the direct cost of stricter
regulations, the impact on Wisconsin businesses is generally negative.
In order to understand the types of impacts that these relatively more stringent Wisconsin regulations
on IC traffic have on specific businesses, the research team conducted several interviews. This section
highlights comments and information gathered from those interviews.
5.1 Interviews with Impacted Stakeholders
Several interviews were conducted in 2009 with businesses and industry representatives that are
impacted directly by Wisconsin’s relatively stringent IC weight regulations. The word “relative” refers to
Wisconsin’s regulations when compared to the bordering states of Illinois and Minnesota as they are the
surrounding states that have specifically addressed international containers in their regulations.
5.1.1 Southern Wisconsin Grain Shipper
One interview that the research team conducted was with a major Wisconsin grain shipper. This
company ships food bound for domestic and international destinations from Wisconsin and uses IC for
international shipments. This company primarily ships goods out of Wisconsin, with very little moving
into the state. A common route that their agricultural shipments take is Wisconsin – Chicago –
International. The largest facility to which goods are brought is the Elwood Center Point Facility near
Chicago, but goods are also brought to Rochelle and North Lake, Illinois. Some shipments are sent from
southern Wisconsin to Racine or elsewhere in Wisconsin, where they are then loaded onto the Canadian
Pacific Railroad headed for the Pacific Coast.
When discussing the impact of Wisconsin IC weight regulations on the business, the representative
mentioned that there was some impact. Since much of their business is international shipment of
grains, containers are the necessary method of shipment. Because of the IC weight limits in Wisconsin,
companies are unable to fully load containers in the state. Instead, they ship their product by bulk from
southern Wisconsin into Illinois, where goods are then consolidated and containers are checked and
sealed. According to their estimates, for every 2,000 pounds that cannot be shipped on a truck due to
weight restrictions, the cost to the firm is $50-$100, which is a large amount, as they operate on thin
profit margins. The representative mentioned that “with grain, weight is king.” Once containers are
sealed and ready to go in Illinois, they are then shipped to one of the intermodal facilities mentioned
above, hauled at heavier weights on state highways in Illinois.
[27]
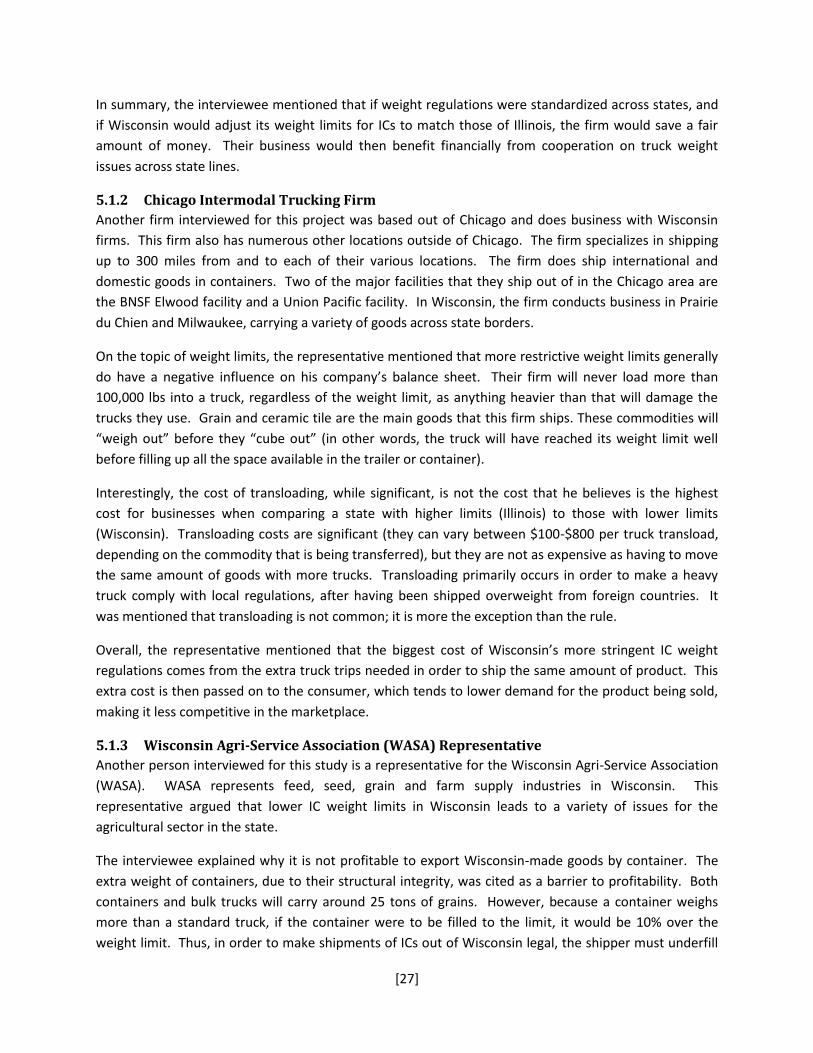
In summary, the interviewee mentioned that if weight regulations were standardized across states, and
if Wisconsin would adjust its weight limits for ICs to match those of Illinois, the firm would save a fair
amount of money. Their business would then benefit financially from cooperation on truck weight
issues across state lines.
5.1.2 Chicago Intermodal Trucking Firm
Another firm interviewed for this project was based out of Chicago and does business with Wisconsin
firms. This firm also has numerous other locations outside of Chicago. The firm specializes in shipping
up to 300 miles from and to each of their various locations. The firm does ship international and
domestic goods in containers. Two of the major facilities that they ship out of in the Chicago area are
the BNSF Elwood facility and a Union Pacific facility. In Wisconsin, the firm conducts business in Prairie
du Chien and Milwaukee, carrying a variety of goods across state borders.
On the topic of weight limits, the representative mentioned that more restrictive weight limits generally
do have a negative influence on his company’s balance sheet. Their firm will never load more than
100,000 lbs into a truck, regardless of the weight limit, as anything heavier than that will damage the
trucks they use. Grain and ceramic tile are the main goods that this firm ships. These commodities will
“weigh out” before they “cube out” (in other words, the truck will have reached its weight limit well
before filling up all the space available in the trailer or container).
Interestingly, the cost of transloading, while significant, is not the cost that he believes is the highest
cost for businesses when comparing a state with higher limits (Illinois) to those with lower limits
(Wisconsin). Transloading costs are significant (they can vary between $100-$800 per truck transload,
depending on the commodity that is being transferred), but they are not as expensive as having to move
the same amount of goods with more trucks. Transloading primarily occurs in order to make a heavy
truck comply with local regulations, after having been shipped overweight from foreign countries. It
was mentioned that transloading is not common; it is more the exception than the rule.
Overall, the representative mentioned that the biggest cost of Wisconsin’s more stringent IC weight
regulations comes from the extra truck trips needed in order to ship the same amount of product. This
extra cost is then passed on to the consumer, which tends to lower demand for the product being sold,
making it less competitive in the marketplace.
5.1.3 Wisconsin Agri-Service Association (WASA) Representative
Another person interviewed for this study is a representative for the Wisconsin Agri-Service Association
(WASA). WASA represents feed, seed, grain and farm supply industries in Wisconsin. This
representative argued that lower IC weight limits in Wisconsin leads to a variety of issues for the
agricultural sector in the state.
The interviewee explained why it is not profitable to export Wisconsin-made goods by container. The
extra weight of containers, due to their structural integrity, was cited as a barrier to profitability. Both
containers and bulk trucks will carry around 25 tons of grains. However, because a container weighs
more than a standard truck, if the container were to be filled to the limit, it would be 10% over the
weight limit. Thus, in order to make shipments of ICs out of Wisconsin legal, the shipper must underfill

[28]
the truck. This underfilling makes container shipping too costly for many businesses, and results in
scenarios like the one discussed in the “Wisconsin Grain Shipper” interview above.
The interviewee also discussed the costs associated with transloading. The US Department of
Agriculture (USDA) requires ICs to be sealed and inspected. The process of unsealing containers is very
time consuming and costly, which is why it is not efficient to transload export containers. One would
imagine that businesses may place their products in containers in Wisconsin, fill them up only a certain
amount, and then consolidate loads in Illinois. Instead, bulk trucks are cheaper to transport, and goods
are not containerized until they reach states such as Illinois and Minnesota.
The interviewee mentioned that the fact that the Wisconsin goods are containerized outside of
Wisconsin is a problem for Wisconsin’s economy and Wisconsin’s ability to generate railyard
development. Since much containerization of shipments happens in Illinois (due to their more liberal
weight limits), Illinois is listed as the “origin” state for the shipment, and not Wisconsin. He contends
that origin bill of lading statistics are used by the railroad companies to determine where to place
investments in new railyards. As a result of this, there may be more demand in Wisconsin for a railyard
than the bill of lading information shows. The current bill of lading numbers pad the origin container
statistics for Wisconsin’s border states, leaving Wisconsin underrepresented in this count. He likened
this to a chicken and egg type of scenario: the railroad companies want to see the origin bill of lading
numbers before adding container yards in the state. If the bills of lading are not listing Wisconsin
originations, the rail yards will not be added to the system. The interviewee believes that the restrictive
IC regulations are a reason why Wisconsin currently has underutilized railyards in Milwaukee and
Arcadia. With a weight exemption for sealed containers carrying products such as grain and feed, he
believes that Wisconsin would see a strong increase in shipments out of its railyards.
Overall, the representative’s primary suggestion is to add an exemption for divisible loads (grain, feed
products) in sealed containers bound for international trade. He believes that if permits were allowed
for overweight IC, there would be an immediate positive change for Wisconsin’s economy. Wisconsin
grain and feed products would be exported en masse, and railyards to support Wisconsin businesses
would become more active and employ more people in the state. Further, he believes that there is a
market in Asia and elsewhere for Wisconsin’s expertise in livestock nutrition. By allowing Wisconsin-
made feed to be transported at lower cost by traveling directly out of Wisconsin (as opposed to going
through Illinois), this industry may have a more positive influence on Wisconsin’s economy.
5.1.4 Interview Summary
The information gathered from these interviews is important to take into consideration, especially
during difficult economic times. It is fairly obvious, from a business perspective, that business and
shippers benefit from more flexible regulation. By making container traffic more attractive in Wisconsin,
it may promote and boost international container traffic, which could be a plus for the Wisconsin
economy. However, many other factors should be taken into consideration when making a decision on
increasing truck size and weight limits for any type of traffic. Safety, pavement damage, and
environmental damage are critical factors, which the Wisconsin Truck Size and Weight Study analyzed in
[29]
detail. The purpose of these interviews is to provide an understanding of the economic cost to
businesses as a result of Wisconsin’s stricter regulations on IC weight limits.
5.2 Impacted Commodities
From the interviews summarized in Section 5.1, it becomes obvious that one of the most impacted
sectors of the economy in Wisconsin is the agricultural sector, including animal feed, grain, corn, and
similar types of goods. There is an interest in moving these goods internationally, which make them
especially pertinent to this discussion. The Chicago shipper mentioned that some of the most common
goods that make truck too heavy before filling them up are ceramic tile and grain. Other goods that
tend to be hauled overweight are those that receive exemptions from Wisconsin. These include raw
forest products, dairy products, livestock, septage trucks, potatoes, scrap, coal, and iron. There are other
dense commodities, including finished paper products, beverages, and sands which have not received
any type of exemption from Wisconsin for weight traffic.
5.3 Cost-Benefit on Selected Commodities
The planned scope of this research endeavor included analysis of the benefit and costs of expanding use
of containerized shipping for Wisconsin commodities. Early in the project, it became apparent that the
Wisconsin data was not going to be available to the research team. The project committee approved an
analysis of the issues related to the subject generally rather than specific data based analysis of loads
and commodity types. The data will be available in the summer of 2009 and the project team has
committed to providing this assessment as a future appendix and update to this report.

[30]
6 Conclusion
The topic of over load weight truck loads continues to be a highly debatable topic, as policy in either
direction will have both positive and negative impacts. If truck weights for ICs are regulated too tightly,
businesses will find less regulated states in which to conduct their operations. If not enough regulation
of heavy trucks exists, issues such as safety, environmental damage, and road damage (especially with
higher equivalent single axle loads) become more apparent. It is important to find a balance between
economic health and these other factors to make sure that the Wisconsin economy will continue to
prosper. Finding middle ground is necessary to accomplish this.
This paper does not endorse or denounce the idea of increasing truck size and weight limits for ICs
moving in Wisconsin. The goals of this paper are to highlight the current situation of IC traffic in
Wisconsin, provide insights on what other States have done on this topic, and to explain how some
businesses and stakeholders are impacted by Wisconsin’s more stringent IC weight laws. Economic
regulatory policies , such as regulations on IC weight that have an impact, need to be closely reviewed to
ensure that regulations make sense economically, and they make sense for other important social
aspects.
7 Recommendations
This study reveals some key issues that need to be analyzed further.
First, it would be helpful to have an understanding of where exactly origins and destinations for
containerized ICs in Wisconsin are. The research team was not able to obtain the necessary data to
analyze IC traffic in Wisconsin. However, an analysis of the routes and the commodities that are being
shipped internationally from and to Wisconsin counties would be helpful in further assessing the
benefits of a change in regulation to IC weight laws. WisDOT has purchased data that will enable this
analysis to be completed after publication of this report.
Further, it would be beneficial to the entire Midwest region to analyze the impacts of inconsistent IC
weight regulations in the region. An understanding of how variations in state IC weight regulations
impact the efficient and economical flow of goods across state borders to ports is of importance to the
region as a whole. With coalitions such as the Mississippi Valley Freight Coalition supporting regional
cooperation to improve freight, information on how ICs currently travel through the region would be
beneficial. One interviewee mentioned that firms are interested in seeing cross-border cooperation and
harmonization of truck weight regulations.
It is also suggested that further analysis be undertaken to understand the impacts of the difference
between federal and state highway weight limitations. Longer IC trips to central distribution hubs such
as Chicago would be most suitable for highway travel. The movement of heavy loads on state highways,
which is a current reality for some carriers, has cost impacts for businesses and the state.

[31]
Finally, the research team recognizes that heavier loads per axle may increase pavement damage. To
date, no definitive study has conclusively correlated permit costs with actual pavement impacts. Many
studies, however, do point to a need for better alignment of permit fees for all heavy hauling industries
with Wisconsin’s transportation agency operating and maintenance costs.

[32]
Appendix A – Literature Review of Truck Size &Weight related to
International Containers / Technical Memorandum Summary
Introduction
The issue of truck weight limits is a contentious one that has been debated at all levels of government.
Those in favor of liberalized weight limit policies tend to believe that increases in weight laws will result
in economic advantages and potential safety advantages as a result of decreased truck volume. Those in
opposition to increased container weights commonly argue that heavier trucks will result in increased
safety hazards to passenger vehicles and that heavy trucks will further damage the deteriorating
infrastructure in the U.S. Because of this dichotomy of stakeholder interests, the truck weight debate
has remained contentious.
Historical Context and Federal Truck Weight Regulations
History has played an important role in determining today’s attitudes and regulations concerning truck
weight limits. The following information is taken from relevant historic information found in the US
DOT’s Comprehensive Truck Size and Weight Study.17
The Federal Government did not begin regulating Truck Size & Weight (TS&W) limits until 1956 when
maximum vehicle weight and width limits were imposed on vehicles operating on the new Interstate
Highway System. States historically had regulated the weights and dimensions of vehicles operating on
State highways, but Congress believed that the large Federal investment in the Interstate System
required more direct Federal controls on the weights of vehicles using the Interstate System. The
federal TS&W limits were first enacted in the Federal-Aid Highway Act of 1956. The Act established the
following limits:
Single-axle weight limit of 18,000 lb;
Tandem-axle weight limit of 32,000 lb;
Gross Vehicle Weight (GVW) of 73,280 lb; and
Maximum width limit of 96 inches.
Alternate Military Loading of Tandem axles spaced at 4' weighing 24,000 lbs each.
States having greater weight or width limits in place on July 1, 1956 when Federal limits went into effect
were allowed to retain those limits under a grandfather clause.
US Congress increased allowable gross weight and axle weight limits in 1975, in part to provide
additional cargo carrying capacity for motor carriers faced with large fuel cost increases at the time. In
the Surface Transportation Assistance Act (STAA) of 1982 (P.L. 97-424), Congress required States to
adopt the Federal weight limits on Interstate Highways. Federal limits were changed to the following:
17
U.S. Department of Transportation (2000), Comprehensive Truck Size and Weight Study, Vol. 1.

[33]
Single-axle weight limit of 20,000 lb;
Tandem-axle weight limit of 34,000 lb; and
Gross Vehicle Weight (GVW) of 80,000 lb except where lower gross vehicle weight is dictated by the bridge formula.
No vehicle or combination of vehicles shall be moved or operated on any Interstate highway when the gross weight on two or more consecutive axles exceeds the limitations prescribed by the following formula, referred to as the Bridge Gross Weight Formula:
3612
1500 N
N
LNW
Where W is the maximum weight in pounds that can be carried on a group of two or more axles
to the nearest 500 pounds, L is the spacing in feet between the outer axles of any two or more
consecutive axles, and N is the number of axles being considered.
Federal law states that two or more consecutive axles may not exceed the weight computed by the
Bridge Formula even though single axles, tandem axles, and gross vehicle weights are within legal limits.
The most recent significant legislative action related to Federal TS&W limits was the freeze on Longer
Combination Vehicles (LCV) operations imposed in the Intermodal Surface Transportation Efficiency Act
of 1991 (ISTEA) (P.L. 102-240). The Transportation Equity Act for the 21st Century (TEA-21) (P.L. 105-85)
did not lift that freeze. Several studies in the 1980s by the Department of Transportation and the
Transportation Research Board (TRB) had examined TS&W options involving LCVs. As noted above, such
vehicles have operated in many western States and on some eastern turnpikes for a number of years,
but the possibility that Federal TS&W limits might be changed to allow those vehicles to operate more
widely was, and continues to be, widely debated. The “LCV freeze” enacted in the ISTEA prohibited
States from allowing any expansion of LCV operations either in terms of routes upon which they may
operate or the vehicle weights or dimensions that may be allowed.18
Comparing Federal and State Truck Weight Regulations
State and federal government agencies have differing roles in the enforcement of truck size and weight
policy. Table 7 highlights some of the differences in state and federal regulations. Federal legislation,
with regards to truck weight, focuses on load limits by axle type, the bridge formula, and the GVW cap.
Several states have more stringent regulations, including regulations on tires and load distribution
between axles.
18
U.S. Department of Transportation (2000), Comprehensive Truck Size and Weight Study, Vol. 1, Executive
Summary, p. E-S 2.

[34]
Table 7. TS&W Limits Specified in Law19
Federal truck weight limits are the law on the majority of the federal interstate system. States tend to
have differing regulations on State and County highways. States generally tend to control truck weight
on roads that are not a part of the National Network (NN). Commonly, states allow heavier weights for
specific goods on these roads through permits or exemptions. For example, Wisconsin allows heavier
trucks at the Wisconsin-Michigan border with a permit, which exceeds the 80,000 lbs weight limit that
are allowed on federal highways.
Existing Vehicle Load Limit Regulations
From a review of state statutes and various reports, it became evident that there are relatively major
differences in truck weight regulations across Midwestern States. Table 8 outlines truck weight limits in
several Midwestern States, including Wisconsin. This table provides a highly generalized account of
truck weight limits across these States. There is much more complexity surrounding the topic of truck
weight, which will not be covered here. For more extensive detail concerning the specifics of weight
limits in each of these States, see the Wisconsin Truck Size and Weight Study 2008 (available at:
http://www.topslab.wisc.edu/workgroups/tsws/deliverables/FR1_WisDOT_TSWStudy_R1.pdf).
19
U.S. Department of Transportation (2000), Comprehensive Truck Size and Weight Study, Vol. 2, Chapter 1, p. I-
15.
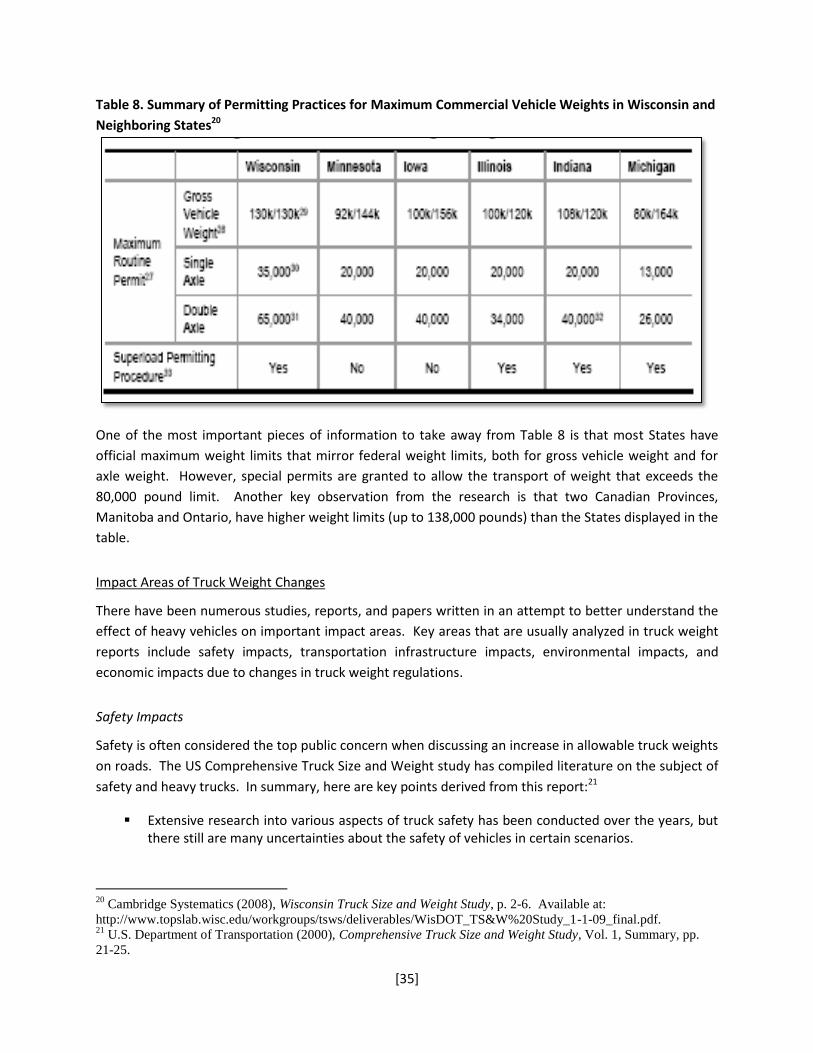
[35]
Table 8. Summary of Permitting Practices for Maximum Commercial Vehicle Weights in Wisconsin and
Neighboring States20
One of the most important pieces of information to take away from Table 8 is that most States have
official maximum weight limits that mirror federal weight limits, both for gross vehicle weight and for
axle weight. However, special permits are granted to allow the transport of weight that exceeds the
80,000 pound limit. Another key observation from the research is that two Canadian Provinces,
Manitoba and Ontario, have higher weight limits (up to 138,000 pounds) than the States displayed in the
table.
Impact Areas of Truck Weight Changes
There have been numerous studies, reports, and papers written in an attempt to better understand the
effect of heavy vehicles on important impact areas. Key areas that are usually analyzed in truck weight
reports include safety impacts, transportation infrastructure impacts, environmental impacts, and
economic impacts due to changes in truck weight regulations.
Safety Impacts
Safety is often considered the top public concern when discussing an increase in allowable truck weights
on roads. The US Comprehensive Truck Size and Weight study has compiled literature on the subject of
safety and heavy trucks. In summary, here are key points derived from this report:21
Extensive research into various aspects of truck safety has been conducted over the years, but there still are many uncertainties about the safety of vehicles in certain scenarios.
20
Cambridge Systematics (2008), Wisconsin Truck Size and Weight Study, p. 2-6. Available at:
http://www.topslab.wisc.edu/workgroups/tsws/deliverables/WisDOT_TS&W%20Study_1-1-09_final.pdf. 21
U.S. Department of Transportation (2000), Comprehensive Truck Size and Weight Study, Vol. 1, Summary, pp.
21-25.

[36]
While public perceptions (of heavy trucks) may have little factual basis, they ultimately are important factors affecting decisions concerning whether to allow heavy vehicles. Most automobile drivers favor the status quo of TS&W limits, and believe that if any changes were made to policy concerning this issue, TS&W limits should become more restrictive.
Differences in vehicle stability and control are perhaps the most important safety-related
factors directly related to differences in vehicle weights and dimensions. Virtually all vehicles are susceptible to rolling over, but heavy trucks are especially susceptible. The principal attributes that affect a vehicle’s rollover tendencies are the height of the center of gravity (cg) of the cargo, and the vehicle’s track width, suspension, and tire properties. Figure 14 illustrates the stability and control that scenario vehicles have in comparison to a standard five-axle tractor semi trailer.

[37]
Figure 14. Comparison of Stability and Control Measures for Scenario Vehicles Relative to Five-Axle
Tractor Semitrailer, from Wisconsin Truck Size and Weight Study, 200822
22
Wisconsin Truck Size and Weight Study (2008) , p. 2-6. Wisconsin Department of Transportation. Available at:
http://www.topslab.wisc.edu/workgroups/tsws/deliverables/WisDOT_TS&W%20Study_1-1-09_final.pdf

[38]
It is evident from Figure 14 that most of the scenario vehicles (those differing from the standard 5-axle
configuration) have worse static roll stability, which is the trucks propensity to roll over during a steady
[39]
state turn, than the five-axle truck. The Rearward Amplification and Load Transfer Ratio numbers
indicate the likelihood of vehicle rollover during evasive maneuvers. Here, most vehicles perform worse
than the standard five-axle truck. The STAA doubles are trucks that perform well in relation to the five-
axle truck, as do the 6 axle semitrailers at 90,000 and 97,000 pounds.
Tendency to Rollover
The tendency of trucks to roll over has a major impact on road safety. It was determined that
approximately 60% of all heavy truck driver fatalities are associated with rollover accidents.23 This
would suggest that the carriers are very concerned with this topic to protect the safety of their drivers.
The U.S. Comprehensive Truck Size and Weight Study looked at rollover, and came up with the following
conclusions which were included earlier in this report:
Virtually all vehicles are susceptible to rolling over, but heavy trucks are especially susceptible.
The principal attributes that affect a vehicle’s rollover tendencies are the height of the center of
gravity (cg) of the cargo, and the vehicle’s track width, suspension, and tire properties.
Generally, it is possible to conclude from this study that heavier weights do not necessarily result in a
higher rollover propensity. The number of axles, in combination with vehicle weight, impacts overall
rollover tendency.
Finally, one requirement from Canada intends to reduce the possibility of rollover for doubles. For
certain doubles, they require the addition of a fifth wheel, which is connected directly to the second
trailer and is located on the back of the first trailer.24
Braking Capability
Studies have indicated that brake system performance plays a contributing role in approximately one-
third of all medium-to-heavy truck crashes.25 It is important to note that adding more weight to a
vehicle without adding axles and brakes degrades stopping performance.26
Several studies, including the Minnesota Truck Size and Weight Study looked at trucks which weighed
more and had more axles than the standard 80,000 lb, 5 axle trucks. All of the scenario vehicle studies
were determined to have better braking capacity than the standard 80,000 lb truck.27 This again
reiterates the importance of an adequate axle to weight ratio to ensure the overall safety of trucks.
According to focus groups conducted for the US DOT Comprehensive Truck Size and Weight Study,
23
Evans, Jeffrey. Evaluation of Heavy Truck Rollover Accidents, Renfroe Engineering, Inc., Paper Number 05-0140,
p. 3. http://www-nrd.nhtsa.dot.gov/pdf/nrd-01/esv/esv19/Other/Print%2015.pdf
24
Cambridge Systematics (2005), Minnesota Truck Size and Weight Project, p. 18. 25
Improved Brake Systems for Commercial Vehicles, U.S. DOT (HS 807 706), April 1991. 26
U.S. Department of Transportation (2000), Comprehensive Truck Size and Weight Study, Vol. 2, Chapter 5, p. V-
20. 27
Cambridge Systematics (2005), Minnesota Truck Size and Weight Project, p. 18.
[40]
“Auto drivers reported that they constantly worry about their safety when they are on the
highway… They also consistently cited large commercial trucks among their top three or four
highway safety concerns.”28
In 2006, there were a total of 4,995 US fatalities as a result of heavy truck crashes, 4,190 of which were
people not in trucks, including people in cars, pedestrians, and bicyclists.29
Thus, increasing the weight of trucks is contentious with the public. This negative attitude towards truck
weights comes despite arguments made by agencies and consultants that increasing truck weight might
actually improve road safety, because of a decrease in trucks as a result of the ability to transport more
goods with fewer trucks.30 Public agencies, such as the Minnesota DOT, faced considerable criticism
when attempting to increase the truck weight limit from 80,000 to 97,000 lbs, mainly as a result of
safety concerns. The American Automobile Association (AAA) has also voiced its opposition to an
increase in truck weight as long as “trucks’ involvement in crashes and the consequences for motorists’
safety is clear.”31 As an example, Senator Frank Lautenberg, D-NJ, said:
“(allowing higher truck weight limits) is a safety issue. Most of the nation's major road
infrastructure is built to handle 80,000 pounds. You can't have a 97,000-pound truck on a bridge
built to handle 80,000 pounds.”32
Other studies argue that “severity of truck accidents is not sensitive to truck configuration, and given
that a truck accident occurs, the probability of fatalities or injuries are not sensitive to changes in truck
weight.”33 Thus, the argument here is that truck weight in and of itself is not responsible for increased
fatalities or injuries. There are, however, studies that argue that increasing truck weights without
making proper adjustments, such as adding additional brakes and additional axles, will result in more
accidents.
Transportation Infrastructure Impacts
An increase in truck weight limits does have an impact on the nation’s major transportation
infrastructure, including pavements, bridges, and roadway geometric features. In Figure 15, the
highway infrastructure elements impacted by TS&W limits are displayed. “E” represents a significant
effect, while “e” represents some effect. When looking at pavement and bridges, gross vehicle weight
(GVW) only has an impact on long-span bridges, while individual axle weight has a significant impact on
pavements and short-span bridges. GVW does, however, have a significant impact on roadway
features. 28
U.S. Department of Transportation (2000), Comprehensive Truck Size and Weight Study, Vol. 2, Chapter 5, p. V-
15. 29
Fatality Analysis Reporting System (FARS), FARS Encyclopedia: Trends – Large Truck Related 2006,
http://www-fars.nhtsa.dot.gov/Trends/TrendsLargeTruckRel.aspx. 30
Cambridge Systematics (2005), Minnesota Truck Size and Weight Project, p. ES-3. 31
Axles to Grind: Driving Questions About the Limits to Place on Trucks Traveling Our Roads, Washington
Journey (published by AAA), Vol. 70, No. 6. http://www.usroads.com/journals/rmej/0002/rm000202.htm#top 32
http://www.ifcba.org/modules/news/article.php?storyid=914 33 Transportation Research Board, Truck Weight Limits: Issues and Options, Special Report 225, National Research
Council, 1990.
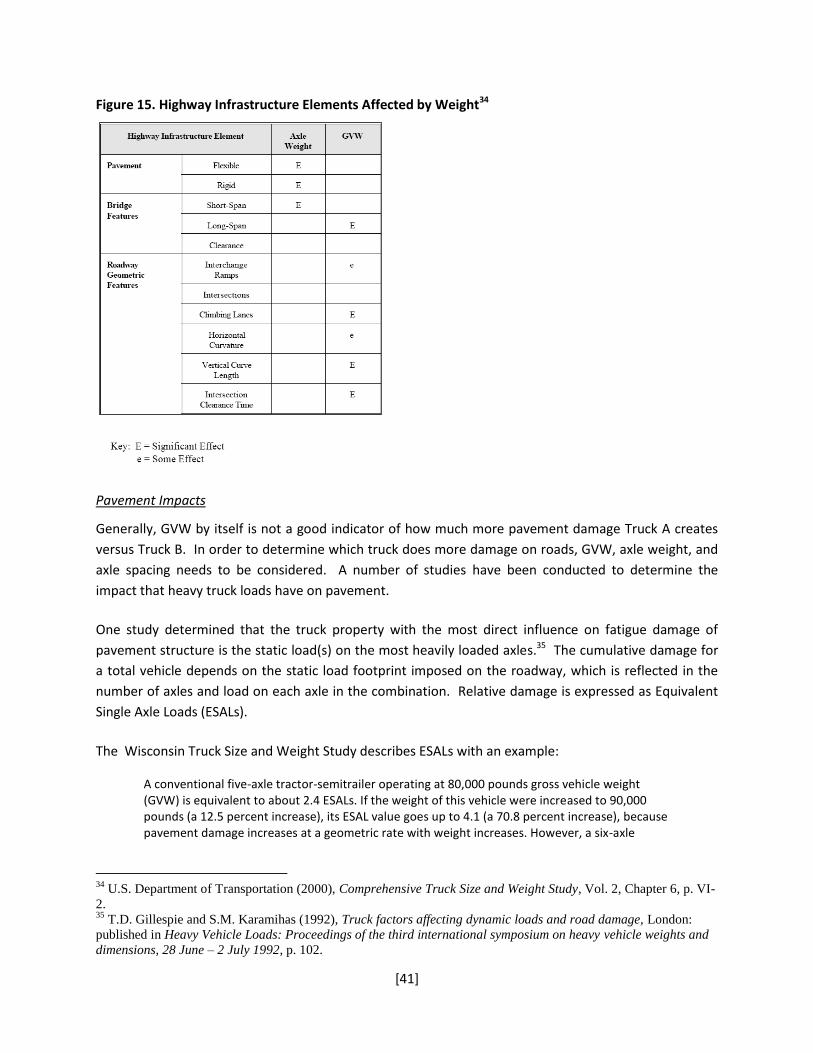
[41]
Figure 15. Highway Infrastructure Elements Affected by Weight34
Pavement Impacts
Generally, GVW by itself is not a good indicator of how much more pavement damage Truck A creates
versus Truck B. In order to determine which truck does more damage on roads, GVW, axle weight, and
axle spacing needs to be considered. A number of studies have been conducted to determine the
impact that heavy truck loads have on pavement.
One study determined that the truck property with the most direct influence on fatigue damage of
pavement structure is the static load(s) on the most heavily loaded axles.35 The cumulative damage for
a total vehicle depends on the static load footprint imposed on the roadway, which is reflected in the
number of axles and load on each axle in the combination. Relative damage is expressed as Equivalent
Single Axle Loads (ESALs).
The Wisconsin Truck Size and Weight Study describes ESALs with an example:
A conventional five-axle tractor-semitrailer operating at 80,000 pounds gross vehicle weight (GVW) is equivalent to about 2.4 ESALs. If the weight of this vehicle were increased to 90,000 pounds (a 12.5 percent increase), its ESAL value goes up to 4.1 (a 70.8 percent increase), because pavement damage increases at a geometric rate with weight increases. However, a six-axle
34
U.S. Department of Transportation (2000), Comprehensive Truck Size and Weight Study, Vol. 2, Chapter 6, p. VI-
2. 35
T.D. Gillespie and S.M. Karamihas (1992), Truck factors affecting dynamic loads and road damage, London:
published in Heavy Vehicle Loads: Proceedings of the third international symposium on heavy vehicle weights and
dimensions, 28 June – 2 July 1992, p. 102.
[42]
tractor-semitrailer at 90,000 pounds has an ESAL value of only 2.0, because its weight is distributed over six axles instead of five.
Another factor that can exacerbate or minimize road damage from heavy trucks is the size of the tires.
Use of the largest practical tire size helps minimize fatigue damage of flexible pavements. Also, single
tires are far more damaging to pavement than dual tires.
Finally, the type of suspension is a critical factor in minimizing damage from heavy weights. Air-spring
suspensions are optimal for roads, while typical leaf suspensions and walking-beam tandem suspensions
cause more damage to roads.36
Based on the literature, an increase in GVW does not necessarily damage pavement as long as the axle
count is increased proportionately and weight is distributed evenly. Dual tires and air-spring suspension
also help in minimizing the damage from heavy trucks.
Bridge Impacts
Understanding the impact of truck weight policy on bridges is necessary to make decisions that protect
safety and commerce on the interstate system. This is a particularly important impact area for the
public following recent bridge failures, such as the I-35W bridge collapse in Minnesota.
Currently, the Federal Bridge Formula controls vehicle weights to protect the Nation’s bridges. The
bridge formula is intended to assure that stresses placed on HS-20 bridges (common higher-class
highway bridge) do not exceed design stresses by more than five percent, and stresses on HS-15 bridges
(common lower-class highway bridge) do not exceed the design stresses by more than 30 percent.
Scenarios used in the Comprehensive Truck Size and Weight Study assume that if a proposed scenario
exceeds these criteria, the bridges involved would require replacement. Another option would be to
strengthen the bridge. If that’s the case, some of the bridges with lower volumes of heavy trucks may
not need to be replaced at all.37
The Wisconsin Truck Size and Weight Study also addressed the impact of heavier truck configurations on bridges. The following paragraph is taken from this report to highlight considerations to make when analyzing the impact of heavier trucks on bridges:
As a general rule, most bridges constructed after the late 1970s, when the American Association of State Highway and Transportation Officials (AASHTO) Load Factor Design (LFD) standards were implemented, can support the candidate TSW trucks. More recent standards, including the new (2007) AASHTO Load and Resistance Factor Design (LRFD) Bridge Design Specification should also allow passage of heavier vehicle loads. However, significant numbers of older bridges and other structures not designed for this new vehicle loading are impacted most and present a major challenge to carry the heavier vehicle loads.
38
36
T.D. Gillespie and S.M. Karamihas (1992), Truck factors affecting dynamic loads and road damage, London:
published in Heavy Vehicle Loads: Proceedings of the third international symposium on heavy vehicle weights and
dimensions, 28 June – 2 July 1992, p. 102. 37
U.S. Department of Transportation (2000), Comprehensive Truck Size and Weight Study, Vol. 1, Summary, p. 20. 38
Cambridge Systematics (2008), Wisconsin Truck Size and Weight Study, p. ES-5.
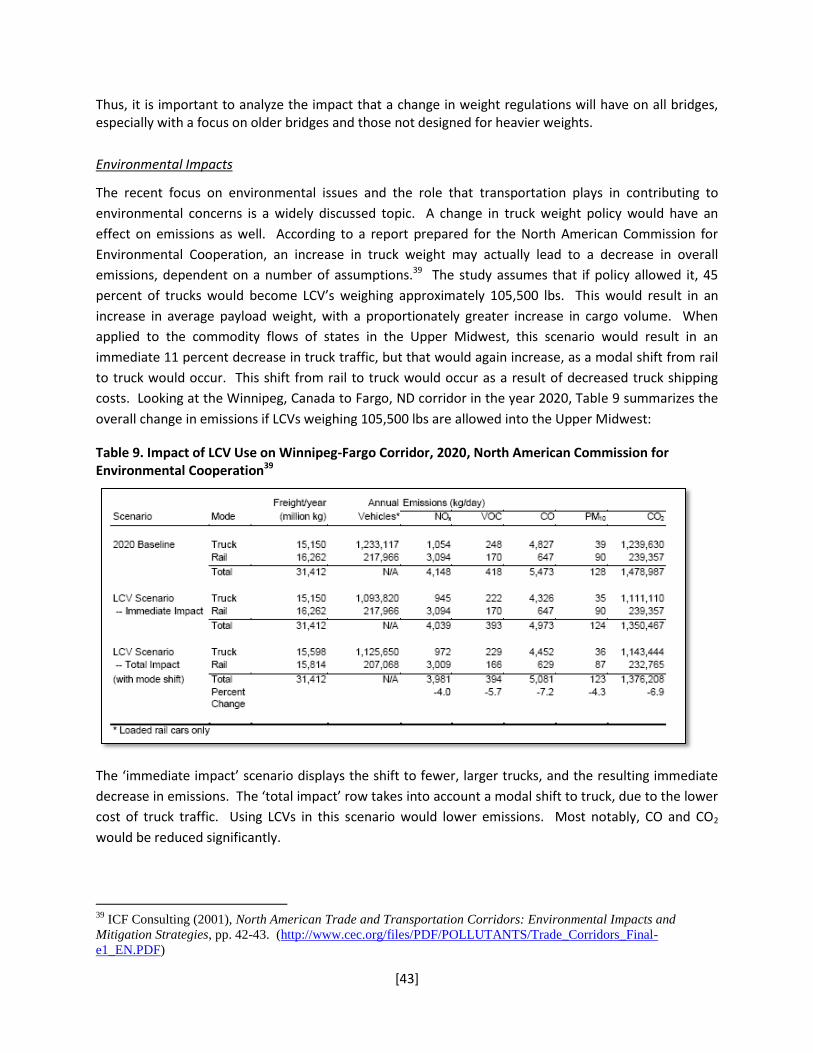
[43]
Thus, it is important to analyze the impact that a change in weight regulations will have on all bridges, especially with a focus on older bridges and those not designed for heavier weights.
Environmental Impacts
The recent focus on environmental issues and the role that transportation plays in contributing to
environmental concerns is a widely discussed topic. A change in truck weight policy would have an
effect on emissions as well. According to a report prepared for the North American Commission for
Environmental Cooperation, an increase in truck weight may actually lead to a decrease in overall
emissions, dependent on a number of assumptions.39 The study assumes that if policy allowed it, 45
percent of trucks would become LCV’s weighing approximately 105,500 lbs. This would result in an
increase in average payload weight, with a proportionately greater increase in cargo volume. When
applied to the commodity flows of states in the Upper Midwest, this scenario would result in an
immediate 11 percent decrease in truck traffic, but that would again increase, as a modal shift from rail
to truck would occur. This shift from rail to truck would occur as a result of decreased truck shipping
costs. Looking at the Winnipeg, Canada to Fargo, ND corridor in the year 2020, Table 9 summarizes the
overall change in emissions if LCVs weighing 105,500 lbs are allowed into the Upper Midwest:
Table 9. Impact of LCV Use on Winnipeg-Fargo Corridor, 2020, North American Commission for Environmental Cooperation39
The ‘immediate impact’ scenario displays the shift to fewer, larger trucks, and the resulting immediate
decrease in emissions. The ‘total impact’ row takes into account a modal shift to truck, due to the lower
cost of truck traffic. Using LCVs in this scenario would lower emissions. Most notably, CO and CO2
would be reduced significantly.
39
ICF Consulting (2001), North American Trade and Transportation Corridors: Environmental Impacts and
Mitigation Strategies, pp. 42-43. (http://www.cec.org/files/PDF/POLLUTANTS/Trade_Corridors_Final-
e1_EN.PDF)

[44]
Other factors that must be taken into account when looking at this assessment is the potential for
increase in total freight volumes due to induced demand, resulting from the lower prices passed on to
consumers. Actual emission rates per mile for increased truck weights are not well understood, so if the
emissions rates are higher than the additional 3% calculated into the formula for the table above, the
emissions benefits may be lower or eliminated altogether.
For the purpose of this study, the information above is only a guideline for attempting to understand
potential environmental implications. The most important information that determines the accuracy of
this analysis is the actual increase in emissions from heavier trucks, as opposed to the 3% increase
estimated by the study. Using other configurations of heavier trucks may result in higher emissions.
Economic Impacts
Based on logic and interviews for this study, there are negative cost implications for business when truck
weights are more restrictive. If a truck is able to carry less and a certain amount of goods need to be
moved, it will require more trucks to move these goods. Extra truck trips result in more costs for
business, which will usually be passed to the consumer. Thus, it is fairly obvious that any regulation on
truck weight will have negative implications for business. However, it is critical to do a balanced analysis
which takes into account all factors, including economic, when making changes to truck weight
regulations.
Impact of Truck Weight Policy on Shippers and Carriers
When attempting to determine the impacts that increased truck weight limits will have on a region, it
will be important to know how shippers and carriers will react to a change. Figure 16 displays some of
the key shipper and carrier considerations regarding TS&W Policy:
Figure 16. Shipper and Carrier Considerations Regarding TS&W Policy, from Wisconsin’s Truck Size and Weight Study, 2008
[45]
Generally speaking, the important topics affected by TS&W policy for these groups are safety,
productivity, and total costs.
Shipper Impacts
Ensuring the economic viability and productivity of shippers is an important component of truck weight
policy. Aside from the standard statewide truck weight regulations, states also grant truck weight
exemptions, particularly for industries important to that region. For example, Minnesota grants
exemptions through permit that allow trucks to carry heavier weights for industries such as agriculture,
forestry, and paper production.40 Wisconsin grants exemptions for forest products, dairy products,
septage and other industries.41
The following basic concept is common knowledge in the freight industry: “If TS&W regulations become
more restrictive, then the payload-per-truck decreases and the transportation cost per-ton-mile
increases. On the other hand, if TS&W regulations become more permissive, the payload-per-truck will
increase and the transportation cost per-ton-mile decreases.”42 Overall, shippers strive to minimize
transportation and inventory costs for obvious economic reasons.
Shippers are usually in favor of increased weight limits. For example, in Wisconsin, a letter from the
Wisconsin Professional Loggers Association (WPLA) highlighted the needs of the legislature to take
action in order to prevent some of its members from going out of business.43 Wisconsin has created
exemptions for several industries including forestry. However, after legislation was passed to allow
exemptions in the lumber industry, the industry became concerned that penalties were too lenient,
which gives those haulers breaking the law an advantage over law-abiding truckers.44 Therefore, it is
important that proper enforcement be implemented in order to create fair economic competition.
Carrier Impacts
Carriers are similarly impacted by truck size and weight policy changes. First, a change in truck weight
can have implications on the safety of the drivers of carriers. Safety is impacted since a change in
weight policy may encourage carriers to purchase vehicles that have an improved crash rate than
existing vehicles.45 Thus, it is important to recommend vehicles or a vehicle weight that will encourage
the purchase of safer vehicles.
However, some studies conclude that an increase in truck weight will not result in widespread carrier
purchase of bigger, cleaner, and higher horsepower vehicles. Rather than upgrade the truck fleet, the
40
Cambridge Systematics (2005), Minnesota Truck Size and Weight Project, p. 3. 41
http://www.legis.state.wi.us/lc/committees/study/2006/HWY/files/dot_presentation.pdf 42
U.S. Department of Transportation (2000), Comprehensive Truck Size and Weight Study, Vol. 3, Chapter 12, p.
XII-1. 43
http://www.legis.state.wi.us/lc/committees/study/2006/HWY/files/wpla_ltr.pdf 44
http://www.legis.state.wi.us/lc/committees/study/2006/HWY/files/Letter_to_DA_re_2005_AB_678.pdf 45
Cambridge Systematics (2005), Minnesota Truck Size and Weight Project, p. 15.
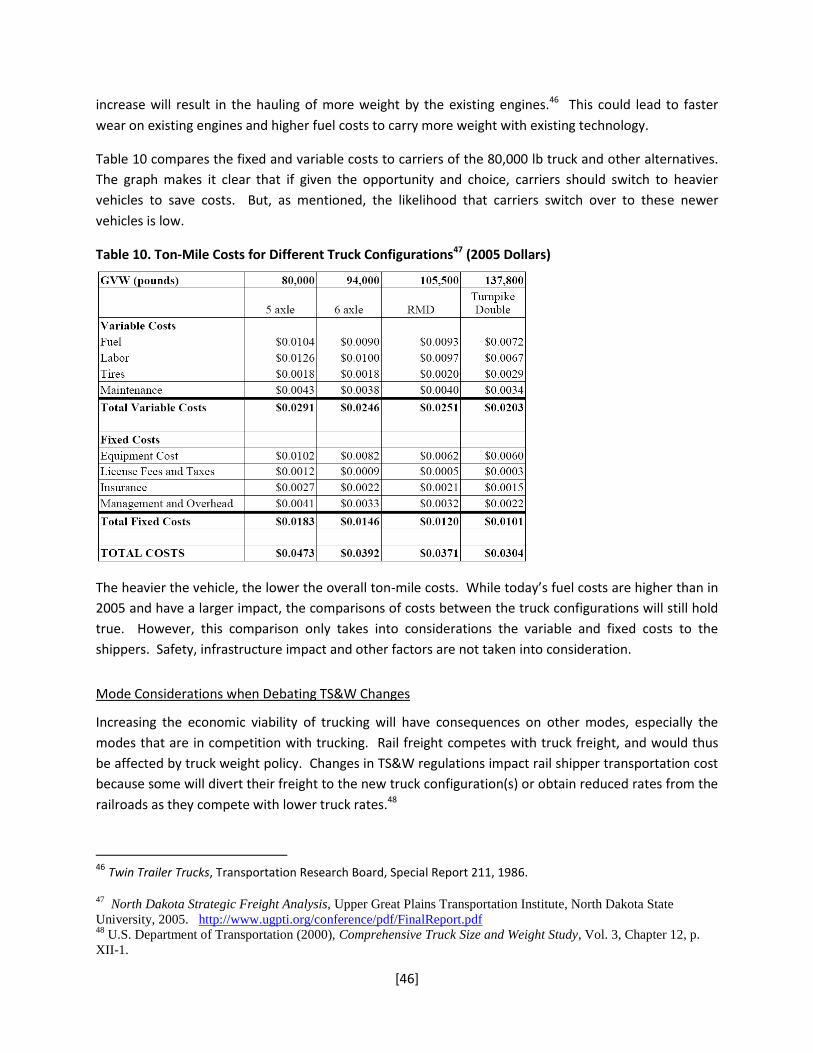
[46]
increase will result in the hauling of more weight by the existing engines.46 This could lead to faster
wear on existing engines and higher fuel costs to carry more weight with existing technology.
Table 10 compares the fixed and variable costs to carriers of the 80,000 lb truck and other alternatives.
The graph makes it clear that if given the opportunity and choice, carriers should switch to heavier
vehicles to save costs. But, as mentioned, the likelihood that carriers switch over to these newer
vehicles is low.
Table 10. Ton-Mile Costs for Different Truck Configurations47 (2005 Dollars)
The heavier the vehicle, the lower the overall ton-mile costs. While today’s fuel costs are higher than in
2005 and have a larger impact, the comparisons of costs between the truck configurations will still hold
true. However, this comparison only takes into considerations the variable and fixed costs to the
shippers. Safety, infrastructure impact and other factors are not taken into consideration.
Mode Considerations when Debating TS&W Changes
Increasing the economic viability of trucking will have consequences on other modes, especially the
modes that are in competition with trucking. Rail freight competes with truck freight, and would thus
be affected by truck weight policy. Changes in TS&W regulations impact rail shipper transportation cost
because some will divert their freight to the new truck configuration(s) or obtain reduced rates from the
railroads as they compete with lower truck rates.48
46 Twin Trailer Trucks, Transportation Research Board, Special Report 211, 1986.
47 North Dakota Strategic Freight Analysis, Upper Great Plains Transportation Institute, North Dakota State
University, 2005. http://www.ugpti.org/conference/pdf/FinalReport.pdf 48
U.S. Department of Transportation (2000), Comprehensive Truck Size and Weight Study, Vol. 3, Chapter 12, p.
XII-1.

[47]
However, modal shift is not a simple or inexpensive process. Neither is changing carriers, which could
often involve a shift in mode. One reason for this is that more shippers and carriers are developing
integrated shipment-tracking systems to monitor product inventory. Once these information systems
are installed and linked between shippers and carriers, changing carriers or modes would require an
additional investment to develop new information sources and integrate them into shippers’ logistics
systems.49
There are a number of theories on how increases in truck weight limits would affect rail. US DOT’s
Comprehensive TS&W study noted the following:50
Several organizations affiliated with the railroad industry said that increased TS&W limits would lower truck operating costs and thus lead to a diversion of freight from rail to trucks. This would result in more losses of rail shipments and increased rates for captive shippers.
Several motor carrier associations claimed that freight diversion would not occur, as rail has been extremely competitive.
Other industry organizations claim that the federal government should not be concerned about
the diversion of freight from rail to truck – let the market take its course.
These observations give a general idea as to how carriers and rail groups think about TS&W policy.
There is an obvious conflict of interest here which each state will need to address if considering TS&W
changes.
49
U.S. Department of Transportation (2000), Comprehensive Truck Size and Weight Study, Vol. 2, Chapter 4, p. V-
18. 50
U.S. Department of Transportation (2000), Comprehensive Truck Size and Weight Study, Vol. 2, Chapter 4, p. V-
33.

[48]
Appendix B – Shipping Container Sizes
Company Country Type
External dimensions Door openings Internal dimensions Weight Volume
Length Width Height Width Height Length Width Height Maximum
Gross Tare
Maximum Payload
Capacity
AP Moller-Maersk Denmark
20 standard
20' 8' 8'6" 7’ 8
1/16” 7’ 5 1/2”
19’ 4 1/16”
7’ 8 1/2” 7’ 9 7/8” 67.2 5.03 62.17 1.179
40 standard
40' 8' 8'6" 7’ 8
1/16” 7’ 5 1/2”
39’ 5 13/16”
7’ 8 1/2” 7’ 10 3/16”
71.65 8.157 63.493 2.39
40 high 40' 8' 9'6" 7’ 8
1/16” 8’ 5 7/16”
39’ 5 13/16”
7’ 8 1/2” 8’ 10 3/16”
71.65 8.55 63.1 2.7
Evergreen Taiwan
20 standard
20' 8' 8' 7' 8 1/8"
7' 5 3/4" 19' 4
13/16" 7' 8
19/32" 7'-9
57/64" 67.2 5.29 61.91
40 standard
40' 8' 8' 7' 8 1/8"
7' 5 3/4" 39' 5
45/64" 7' 8
19/32" 7' 9
57/64" 67.2 8.82 58.38
40 high 40' 8' 9' 7' 8 1/8"
8' 5 49/64"
39' 5 45/64"
7' 8 19/32"
8' 9 15/16"
67.2 9.26 57.94
Hapag-Lloyd Germany
20 standard
20' 8' 8'6" 7' 8 1/8" 7' 6 1/4" 19' 4 1/4" 7' 8 1/2"
7' 10 1/4"
71.65 5.22 66.43 1.172
40 standard
40' 8' 8'6" 7' 8 1/8" 7' 6 1/4" 39' 5 5/8" 7' 8 5/8"
7' 10 1/4"
71.65 8.774 62.875 2.39
40 high 40' 8' 9'6" 7' 8 1/8" 8' 6 1/4" 39' 5 5/8" 7' 8 1/2"
8' 10 1/4"
71.65 8.84 62.81 2.694
China Shipping People's
Republic of China
20 standard
20' 8' 8'6" 7' 8 1/8"
7' 5 49/64"
19' 4 13/64"
7' 8 19/32"
7' 10 7/32"
67.2 4.81 62.39 1.17
40 standard
40' 8' 8'6" 7' 8 1/8"
7' 5 49/64"
39' 5 45/64"
7' 8 19/32"
7' 10 7/32"
67.2 8.05 59.15 2.39
40 high 40' 8' 9'6" 7' 8 1/8" 8' 6 1/4" 39' 5 5/8" 7' 8 1/2"
8' 10 1/4"
71.65 8.84 62.81 2.694
APL Singapore
20 standard
19'10 1/2"
8'0" 8'6" 7'8" 7'6" 19'4" 7'9" 7'10"
67.2 4.89 62.08 1.17
40 standard 40'
8' 8'6" 7'8" 7'6" 39'6" 7'9" 7'10"
71.65 8.245 63.4 2.391
40 high 40' 8' 9'6" 7'8" 8'6" 39'6" 7'9" 8'10" 71.65 8.71 62.94 2.694
Table 11. Container Specifications of Top 6 Shipping Companies, compiled from company websites
[49]
Appendix C- Works Cited
APL Average Revenue per Forty-foot Equivalent Unit (FEU) (Monthly, 2005-2009). www.nol.com.sg
Axles to Grind: Driving Questions About the Limits to Place on Trucks Traveling Our Roads, Washington Journey
(published by AAA), Vol. 70, No. 6. http://www.usroads.com/journals/rmej/0002/rm000202.htm#top
Container Shipping Cost - Hong Kong to Los Angeles, per TEU. Journal of Commerce.
Container Weight Exemption. California Department of Transportation, Dec. 11, 2007, accessed July 28, 2009.
http://www.dot.ca.gov/hq/traffops/trucks/exemptions/containers.html
Doyle, Chris; Cross Docking Series; Cisco Eagle; 2007; http://www.cisco-eagle.com/blog/index.php/2007/12/05/brief-1-
cross-docking-is-it-right-for-me/
Evans, Jeffrey. Evaluation of Heavy Truck Rollover Accidents, Renfroe Engineering, Inc., Paper Number 05-0140, p. 3.
http://www-nrd.nhtsa.dot.gov/pdf/nrd-01/esv/esv19/Other/Print%2015.pdf
Fatality Analysis Reporting System (FARS), FARS Encyclopedia: Trends – Large Truck Related 2006, http://www-
fars.nhtsa.dot.gov/Trends/TrendsLargeTruckRel.aspx.
Gillespie, T.D. and S.M. Karamihas (1992), Truck factors affecting dynamic loads and road damage, London: published
in Heavy Vehicle Loads: Proceedings of the third international symposium on heavy vehicle weights and
dimensions, 28 June – 2 July 1992, p. 102.
Global Soybean & Grain Transport 2008: Opportunities and Challenges in Containerized Shipping – PowerPoint
Presentations from this conference published on CD Rom, 2008.
Hennigan, William, Mark D. O’Connell, Daniel Fedderly and Matt Jensen. Log Truck Weight Violations. Memo to State
of Wisconsin Circuit Court Judges and District Attorneys, June 2006.
http://www.legis.state.wi.us/lc/committees/study/2006/HWY/files/Letter_to_DA_re_2005_AB_678.pdf
Highway Weight Limits. Wisconsin Department of Transportation; Presentation to Special Committee on Weight Limits,
Sep. 22, 2006. http://www.legis.state.wi.us/lc/committees/study/2006/HWY/files/dot_presentation.pdf
ICF Consulting (2001), North American Trade and Transportation Corridors: Environmental Impacts and Mitigation
Strategies, pp. 42-43. (http://www.cec.org/files/PDF/POLLUTANTS/Trade_Corridors_Final-e1_EN.PDF)
IHS Global Insight and Lloyds Register – Fairplay Research (March 2009). www.globalinsight.com.
Improved Brake Systems for Commercial Vehicles, U.S. DOT (HS 807 706), April 1991.
International Federation of Custom Brokers Associations. Undated, accessed July 28, 2009.
http://www.ifcba.org/modules/news/article.php?storyid=914
Minnesota Truck Size and Weight Project. Prepared by Cambridge Systematics (2005), p. 18. Available at:
http://www.dot.state.mn.us/information/truckstudy/FR2_mndot_trucksizeweight_complete.pdf
National Total Rate History. truckloadrate.com.
http://www.truckloadrate.com/truckload_rate_history_charts.htm?chart=TA
North Dakota Strategic Freight Analysis, Upper Great Plains Transportation Institute, North Dakota State University,
2005. http://www.ugpti.org/conference/pdf/FinalReport.pdf

[50]
Nondivisible Load Permits. Prepared by Cambridge Systematics, pg. 9.
https://www.nysdot.gov/portal/page/portal/transportation-partners/nys-transportation-federation/permits/ny-
permits/repository/nycrr154-1.pdf
Port Industry Statistics. American Association of Port Authorities. http://www.aapa-
ports.org/Industry/content.cfm?ItemNumber=900&navItemNumber=551#Statistics. Undated, accessed July 28,
2009.
Rail Time Indicators, American Association of Railroads, May 19, 2009.
http://www.aar.org/NewsAndEvents/~/media/AAR/RailTimeIndicators/RailTimeIndicatorsMay2009.ashx
Research and Innovative Technology Administration (RITA):
http://www.rita.dot.gov/publications/transportation_vision_2030/html/freight_transportation.html
Trade in Goods (Imports, Exports and Trade Balance) with China. U.S. Census Bureau., undated.
http://www.census.gov/foreign-trade/balance/c5700.html#2009
Transportation Research Board, Truck Weight Limits: Issues and Options, Special Report 225, National Research
Council, 1990.
Twin Trailer Trucks, Transportation Research Board, Special Report 211, 1986.
U.S. Department of Transportation (2000), Comprehensive Truck Size and Weight Study, Vol. 1, Executive Summary, p.
E-S 2; summary, pp. 20-25
U.S. Department of Transportation (2000), Comprehensive Truck Size and Weight Study, Vol. 2, Chapter 1, p. I-15;
Chapter 5, p. V-20; Chapter 6, p. VI-2; Chapter 4, p. V-33.
U.S. Department of Transportation (2000), Comprehensive Truck Size and Weight Study, Vol. 3, Chapter 12, p. XII-1.
Wisconsin Professional Loggers Association. Letter to County Highway Commissioner, Aug. 10, 2000.
http://www.legis.state.wi.us/lc/committees/study/2006/HWY/files/wpla_ltr.pdf
Wisconsin Truck Size and Weight Study. Prepared by Cambridge Systematics (2008) for Wisconsin Department of
Transportation p. 2-6. Available at:
http://www.topslab.wisc.edu/workgroups/tsws/deliverables/WisDOT_TS&W%20Study_1-1-09_final.pdf.
World Port Source. http://www.worldportsource.com/ports/USA_WI.php
Wisconsin Department of TransportationResearch & Library Unit
4802 Sheboygan Avenue, Room 104P.O. Box 7915
Madison, WI 53707
CFIRENational Center for Freight & Infrastructure Research & Education
Wisconsin Transportation Center2205 Engineering Hall1415 Engineering Drive
Madison, WI 53706