wip local refinements and implementationmde.maryland.gov/programs/water/tmdl/tmdl... · wip local...
TRANSCRIPT

1
WIP Local Refinements and Implementation
Maryland WIP Webinar Maryland WIP Webinar May 23, 2012May 23, 2012
2
Webinar Overview
• Refining the WIP by July 2, 2012– MAST Scenarios– Narrative Strategies– Milestones
• March WIP Technical Presentations
• Future Steps– WIP Implementation– Long-Range Planning

3
Refining the WIP by Refining the WIP by July 2, 2012July 2, 2012

4
MAST Scenarios
• Updates are at Local Discretion• You may Update 2017 or 2025 or Both• 2025 Strategy should achieve Final Target for TN
– It’s Not Possible to Meet Target for both TN and TP– If it Doesn’t the State will Supplement the Strategy– If Sector Targets are not met Individually, Narrative
Strategy Needs to Explain• 2017 Strategy Target Now 60% (was 70%)• Submit to State the same way as in November
2011• Please Do Not make changes after submittal date!
– Save under a different name before changing anything
5
Narrative Strategies
• Updates are at Local Discretion• Opportunity to Account For:
– Extension from 2020 to 2025 (Planning Horizon)– 60% 2017 Target (rather than 70%)– Insights from Public Review Process– Outcomes of the 2012 General Assembly
• Reductions• Resources & Funding Plans• Tracking, Reporting & Verification• See Guidance Under “What’s New” WIP II
Webpage
6
Local 2013 Milestones
• Updates are at Local Discretion• Considerable Flexibility in Local 2013 Milestones • Local 2015 Milestones More Rigorous• BMP Implementation Milestones:
– July 1, 2011 – June 30, 2013– Consider Pace to Reach Long-Term Targets– Acceleration in 2015 Milestones
• Programmatic Milestones:– January 1, 2012 – December 31, 2013– Consistent with Narrative Strategy– Consider New State Legislation

7
March 30 WIPMarch 30 WIP Technical PresentationTechnical Presentation
8
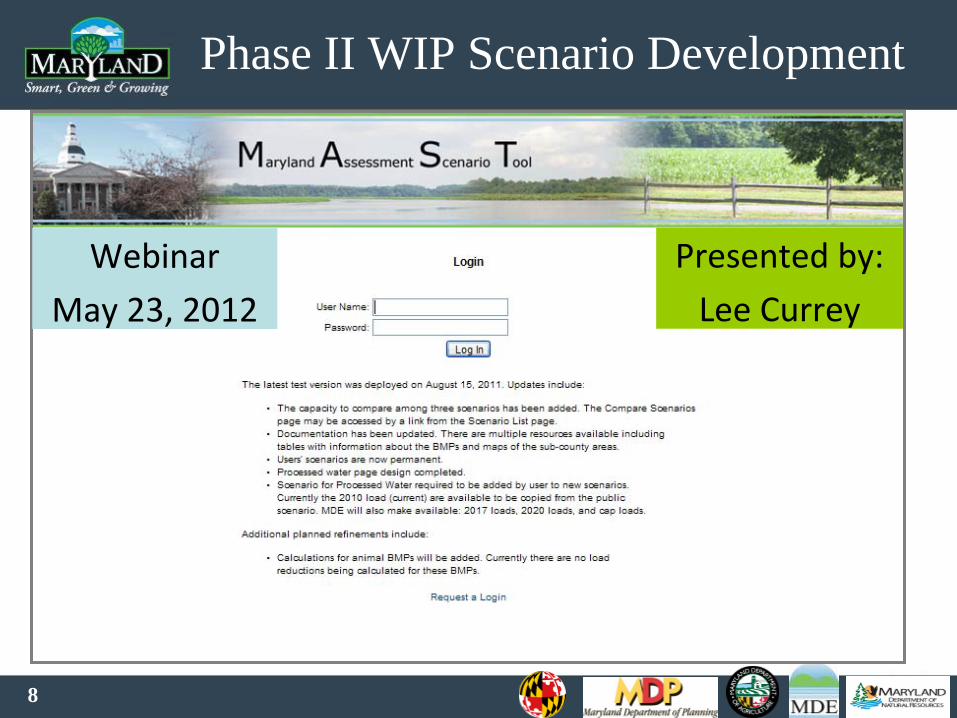
Phase II WIP Scenario Development
Maryland WIP Webinar Maryland WIP Webinar May 23, 2012May 23, 2012
Webinar
May 23, 2012
Presented by:
Lee Currey

9
Overview
• Dataflow• Sectors
– Agriculture– WWTP– Developed land– Septic System
• Next Steps
10
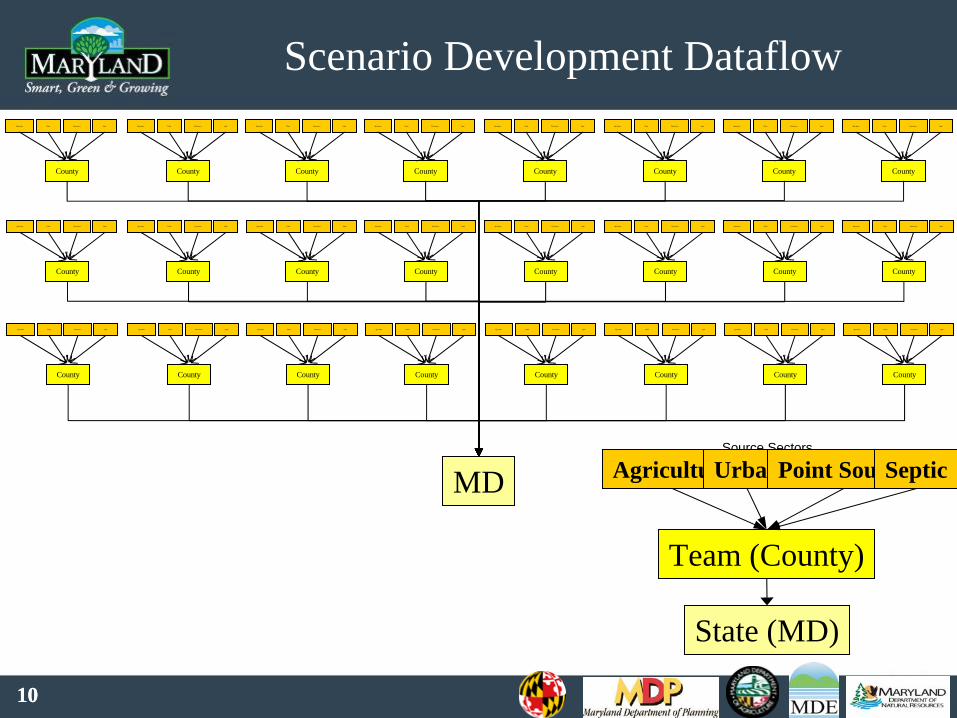
Scenario Development DataflowAgriculture Urban Point Source Septi c
County
MD
Agriculture Urban Point Source Septi c
County
Agriculture Urban Point Source Septi c
County
Agri cul t ure Urban Point Source Septi c
County
Agriculture Urban Point Source Septi c
County
Agri cul t ure Urban Point Source Septi c
County
Agri cul t ure Urban Point Source Septi c
County
Agriculture Urban Point Source Septi c
County
Agriculture Urban Point Source Septi c
County
Agriculture Urban Point Source Septi c
County
Agriculture Urban Point Source Septi c
County
Agri cul t ure Urban Point Source Septi c
County
Agri cul t ure Urban Point Source Septi c
County
Agri cul t ure Urban Point Source Septi c
County
Agriculture Urban Point Source Septi c
County
Agri cul t ure Urban Point Source Septi c
County
Agriculture Urban Point Source Septi c
County
Agriculture Urban Point Source Septi c
County
Agriculture Urban Point Source Septi c
County
Agriculture Urban Point Source Septi c
County
Agriculture Urban Point Source Septi c
County
Agri cul t ure Urban Point Source Septi c
County
Agri cul t ure Urban Point Source Septi c
County
Agriculture Urban Point Source Septi c
County
10
Source Sectors
AgricultureUrbanPoint SourceSeptic
Team (County)
State (MD)

11
Maryland Total Nitrogen Loads1985 - 2025
0
5
10
15
20
25
30
35
1985 1990 1995 2000 2005 2010 2015 2020 2025
Fiscal Year
Mill
ion
Poun
ds Agriculture
Wastewater
Stormwater
Forest
Non-Tidal AtmosphericSeptic
Phase I & II WIP
Statewide Summary
12
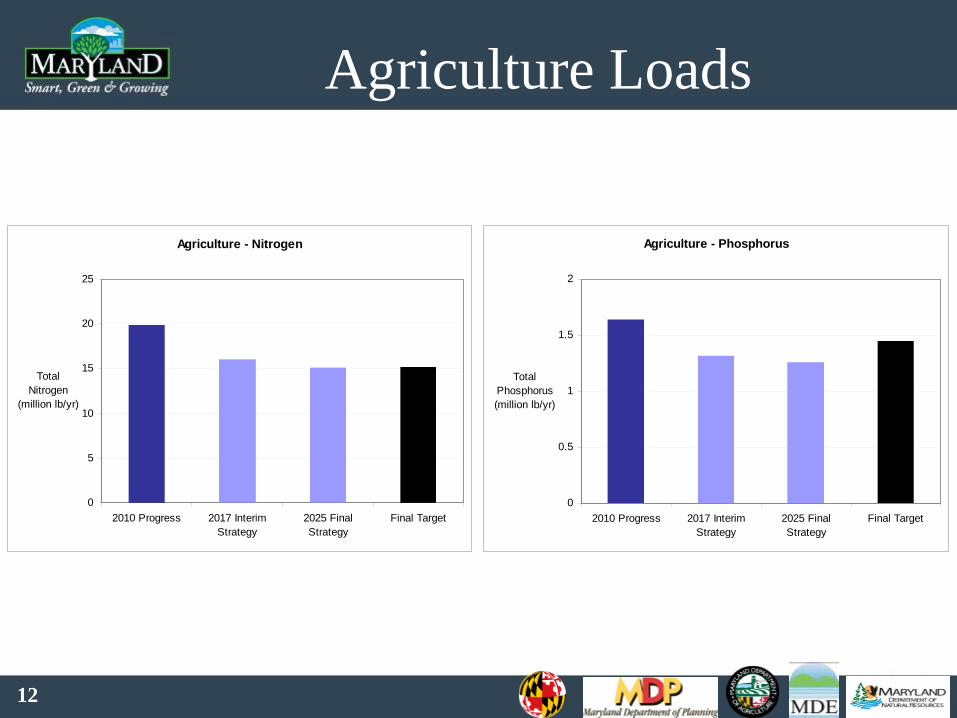
Agriculture Loads
Agriculture - Nitrogen
0
5
10
15
20
25
2010 Progress 2017 InterimStrategy
2025 FinalStrategy
Final Target
TotalNitrogen
(million lb/yr)
Agriculture - Phosphorus
0
0.5
1
1.5
2
2010 Progress 2017 InterimStrategy
2025 FinalStrategy
Final Target
TotalPhosphorus(million lb/yr)

13
Wastewater Loads
Wastewater - Nitrogen
0
5
10
15
20
2010 Progress 2017 InterimStrategy
2025 FinalStrategy
Final Target
TotalNitrogen
(million lb/yr)
Wastewater - Phosphorus
0
0.2
0.4
0.6
0.8
2010 Progress 2017 InterimStrategy
2025 FinalStrategy
Final Target
TotalPhosphorus(million lb/yr)
14
2017 & 2025 Wastewater Scenario
• 2025 Scenario– Major Municipal - ENR Cap Strategy – Major Industrial - Tributary Strategy Cap– Minor Municipal - Tributary Strategy Cap– Minor Industrial – Percent reduction
• 2017 Scenario – Growth Projections

15
Developed Lands - Phosphorus
0
0.2
0.4
0.6
0.8
2010 Progress 2017 WIP Team 2017 InterimStrategy
2025 WIP Team 2025 FinalStrategy
Final Target
TotalPhosphorus(million lb/yr)
Stormwater - Phosphorus
16
Nitrogen vs. Phosphorus • The current approach is designed to increase BMPs
implementation levels to meet the regulated urban and non- regulated urban targets within the sector and at the county scale
• Because bmp efficiencies are different for N and P, the “level of effort” required may differ for each pollutant within a county
• The scenario development approach applies the level of effort to meet the more stringent of N and P

17
Developed Lands - Nitrogen
0
2
4
6
8
10
2010 Progress 2017 WIP Team 2017 InterimStrategy
2025 WIP Team 2025 FinalStrategy
Final Target
TotalNitrogen
(million lb/yr)
Stormwater - Nitrogen

18
2017 Developed Land Scenario
• Scenario development rules– If a county/sector did not provide a scenario
• Meet MS4 retrofit goals• Urban nutrient management and forest buffers on non-
regulated
– If a county/sector provided a scenario then it was not modified
• Assumes commitment to meet the 2025 target• State must meet 60% of statewide goal by 2017

19
2025 Developed Land Scenario
• Goal– Add BMPs to meet countywide urban target, for both N
and P
• BMPs applied based on E3 (consistent with allocation process)– Forest Buffers– Filtering Practices– Impervious Surface Reduction– Urban Nutrient Management– Erosion & Sediment Control
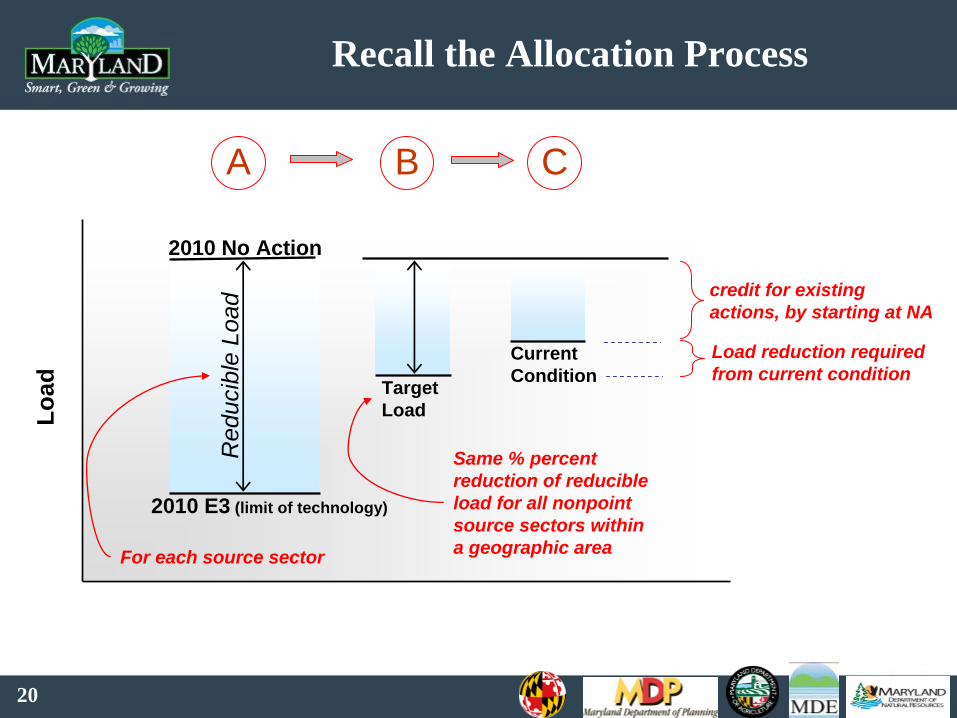
20
Recall the Allocation ProcessLo
ad
2010 No Action
credit for existing actions, by starting at NA
Target Load
Current Condition
2010 E3 (limit of technology)
Red
ucib
le L
oad
Same % percent reduction of reducible load for all nonpoint source sectors within a geographic area
A B C
Load reduction required from current condition
For each source sector
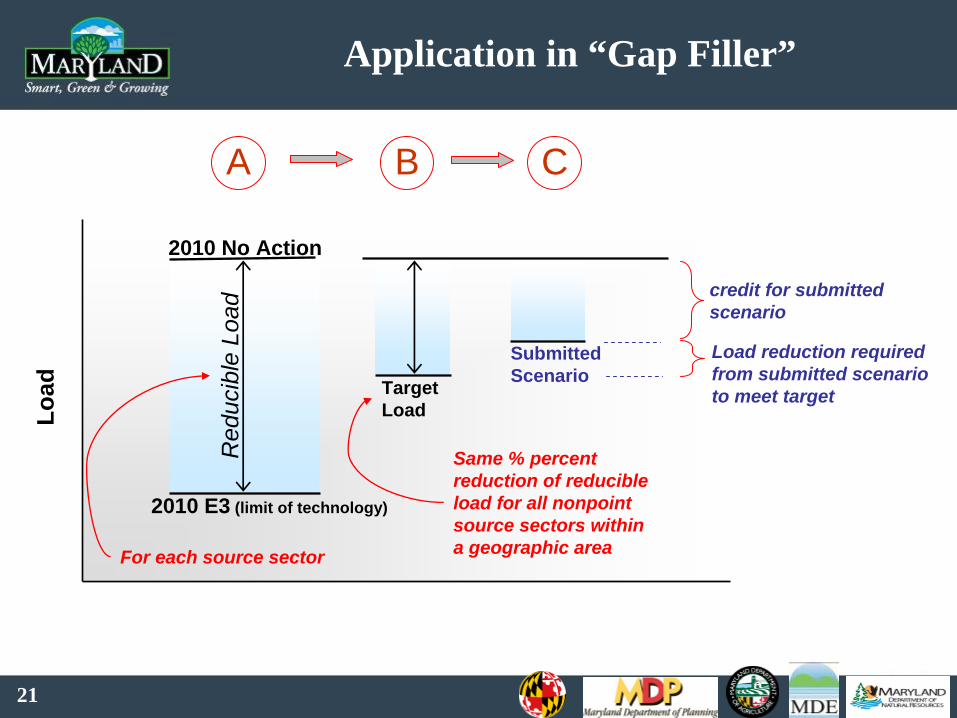
21
Application in “Gap Filler”Lo
ad
2010 No Action
credit for submittedscenario
Target Load
SubmittedScenario
2010 E3 (limit of technology)
Red
ucib
le L
oad
Same % percent reduction of reducible load for all nonpoint source sectors within a geographic area
A B C
Load reduction required from submitted scenarioto meet target
For each source sector

22
Septic - Nitrogen
0
1
2
3
4
2010 Progress 2017 WIP Team 2017 InterimStrategy
2025 WIP Team 2025 FinalStrategy
Final Target
TotalNitrogen
(million lb/yr)
Septic System Strategy

23
Septic Strategy 2017
• If a county provided a 2017 septic strategy the scenario was used
• If a county did not submit a 2017 septic strategy then denitrification was applied to 60% of the critical area. This is based upon the assumption used in the Phase I WIP

24
Septic Strategy 2025
2010 Progress or
County Scenario
Meets CountyTarget Load
Add denitrificationCritical Area
Until meets or 100%
Meets CountyTarget Load
Add denitrificationOutside critical area< 1000’ of stream
No
Meets County Target Load
Add denitrificationOutside critical area> 1000’ of stream
100% implementation
100% implementation
Meets CountyTarget Load
Notes:• Three step approach uses the
various delivery zones and maximizes effectiveness

25
Modeling, Moving Forward• What are we hearing from teams?
– Landuse– Accounting– Understanding regional differences
• What are we doing?– Listening and– Working with the partnership to address these concerns
• Midpoint reevaluation– 2017– December 2015 - Fully calibrated and operational Watershed Model
and Bay Model ready for analysis of Phase III WIPs.

26
March 30 WIPMarch 30 WIP Technical PresentationTechnical Presentation
ContinuedContinued

27
Copying the WIP Strategies
• MAST Scenarios - “2025 Statewide WIP Scenario and 2017 Statewide WIP Scenario”
• In the MAST navigation menu select “Add Scenario”.

28
Copying (continued)
• Add New Scenario screen [screenshot on next slide]:– Enter a name and description for your new scenario.– Select 2010 as the landuse year.– Select a geographic scale and area (“State” to copy the entire Maryland
WIP scenario, or “County” to capture a particular county).– Select the Wastewater strategy (“2017 Loads” for the 2017 WIP
scenario; “Cap Load” for the 2025 WIP scenario)– Select option for “All BMPs, including Maryland specific”– Under “Please select the scenarios you would like to copy BMPs
from:” choose from the drop-down the scenario to be copied (2025 Statewide WIP Scenario and 2017
– Statewide WIP Scenario). Select this scenario for all BMP choices.

29
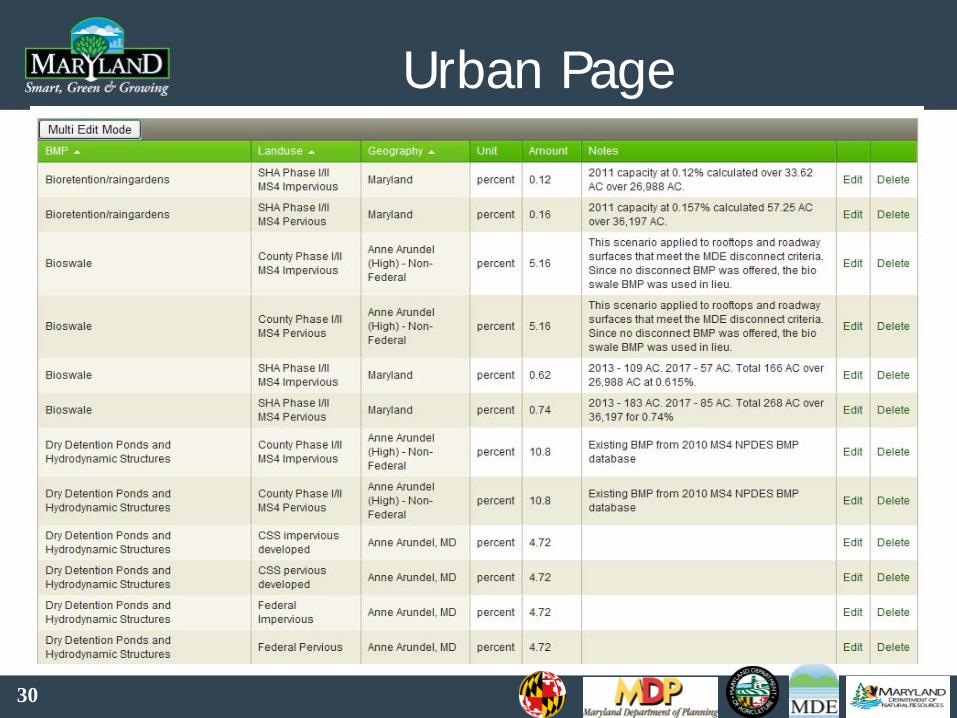
30
Urban Page

31
Summary Loads Page

32
Download Files

33
BMP Text Files
34
Future StepsFuture Steps

35
Continued Local Engagement• See Section 4 of Phase II WIP: “Future Steps”• Quarterly Contact (EPA/State and State/Local)
– Webinars– Face-to-Face Meetings– Annual Regional Meetings
• Promote continual implementation progress– Monitor Progress & Challenges on Local Milestones
• Programmatic Capacity Building key for 2013 Evaluation– Assistance: Help Maintain Progress
• Answer Questions, Provide Guidance• Joint Problem Solving
– Creative paths to success, Near-term & Long-term• Watershed Assistance Collaborative (Technical & Funding)

36
Continued Local Engagement
• Tracking, Reporting and Verification– Accounting is Critical to Demonstrating Progress– Local & State Processes are being Refined– EPA Initiative on Verification– Near-Term: Focus on 2013 Milestones
• State Initiatives:– Offsetting Growth in Loads– Evaluate Max Feasible Implementation (E3) &
Implications for Pace of Implementation– Rural Residential Reforestation– Urban Nutrient Management

37
Continued Local Engagement
• Offsetting Growth in Loads– Fully implementable growth offset program by
the end of 2013 – Offset Stormwater and Septic Loads– Draft Offset Policy Review Process:
• Draft Policy is Undergoing State Interagency Review• Present to BayStat on May 29• Present to the WIP Workgroup of the Maryland
Sustainable Growth Commission (Date TBD)• Extensive outreach with stakeholders
38
Continued Local Engagement
• Model & Data Refinements– Addressed in Previous Presentation
• 2015 Milestones– Begin development in beginning of 2013– Due to EPA at end of 2013