winstar 20 tablecont - matrix astrology software€¦ · · 2008-11-20importing chart files from...
TRANSCRIPT


Copyright NoticeCopyright NoticeCopyright 2002 Matrix Software, Inc.
Win*Star software and all supporting documentation and programs areproprietary, copyrighted material with all rights reserved. Thismanual and the software are protected by United States and Interna-tional copyright laws and agreements. Software or supporting materi-als and documentation may not be copied, in whole or part, withoutthe written consent of Matrix Software, Inc..
This software is licensed for use by the registered owner only. It maynot be installed on a network.
Program Design: Stephen ErlewineMichael Erlewine
Programming: Stephen Erlewine
iii

TTTTTechnical Supportechnical Supportechnical Supportechnical Supportechnical Support
Matrix provides free lifetime technical assistance to all registered owners of oursoftware. Technical Support may be reached at: 231-527-2602 Monday-Friday, 8to 5 (EST) or by Email at: [email protected].
You can also email questions to:[email protected]
Our Technical Support Staff is well trained in the use of our softwareand is ready to assist you with any questions or problems you mayhave. If you cannot find your answer in this manual, in the detailedPDF manual you received, or in the online Help, please call us.
When calling for technical assistance please be in front of yourcomputer with the program running. It is helpful, but not essential toprovide us with the following information regarding your computersystem:
• Type of Computer: Gateway PentiumIII etc.• Version of Windows you are running (3.1, 98, NT, 2000, ME etc.)• Hard Disk Drive Size• RAM (Memory size)• Video Card• Printer type (manufacturer and model)
If you receive an error message while installing or using the software, besure to do a screen capture or carefully write it down so you can refer toit when calling. This will help to quickly identify the source of yourproblem or conflict and resolve it.
Thank you for purchasing Win*Star. You now own, and will soon beusing with confidence, the best astrological software available.
Sincerely,
Matrix Tech Support Team
Matrix Software, Inc.126 S. Michigan Ave.Big Rapids, MI 49307(231) 527-2602
iv

Table of Contents
Introduction 1Installation ............................................................................................................................................. 1
Win*Star Overview ................................................................................................................................... 2Main screen descriptions .............................................................................................................................. 2Configuring Win*Star ................................................................................................................................ 5
Win*Star Options menus ........................................................................................................................... 5Calculation Options ......................................................................................................................... 6Data Input Options ......................................................................................................................... 6Chart Form Options ........................................................................................................................ 6Color Options ................................................................................................................................. 7Aspects Options .............................................................................................................................. 7User Logo Edition ............................................................................................................................ 7
Win*Star “How Do I’s?” ........................................................................................................................... 8Basic Tasks
Creating a Natal Chart ............................................................................................................. 9Viewing and Pringing a Chart ................................................................................................... 12Delete Individual Charts .......................................................................................................... 13Delete “Dependent” Charts ...................................................................................................... 14Changing Aspect Sets .............................................................................................................. 14Choosing the planets and points in the displayed chart ................................................................. 15Importing Chart files from other Astrology programs ................................................................. 17Using the Atlas ....................................................................................................................... 18Viewing 2,3, or 4 charts in one wheel ........................................................................................ 19Assigning default forms to Technique menu buttons ................................................................... 20
Setting DefaultsChange the default wheel for new charts .................................................................................... 21Changing the default house system ........................................................................................... 21Changing aspect sets ................................................................................................................ 22Select Chart Form Menu (described) ......................................................................................... 23Chart Form Options menu (described) ...................................................................................... 24Assigning Default forms to Technique menu buttons .................................................................. 25Working with Charts in the Chart Database ............................................................................... 2 6
Astrological Techniques ............................................................................................................................... 30Secondary charts .............................................................................................................................. 30Transit charts ................................................................................................................................... 30Progressed, directed and Lunation charts ............................................................................................ 31Return charts .................................................................................................................................. 31Prediction techniques: Transit, progressed, & other Searches ................................................................ 33Synastry Techniques ......................................................................................................................... 40
Creating Composite or Relationship charts ................................................................................. 41Mundane Maps ....................................................................................................................... 42Local Space charts ................................................................................................................... 43
Extra ToolbarRectification module ........................................................................................................................ 45Using the Astro*Clock feature .......................................................................................................... 46
v

Using the DayScan feature .......................................................................................................................... 46Using the TimeScan feature ......................................................................................................................... 47Time Tables Ephemeris Generator ................................................................................................................ 48
Printing an Aspectarian .................................................................................................................... 52Win*Search
Win*Search “How Do I’s?”How do I make a database to use with Win*Search? .................................................................. 55How do I create a graph for specific planet combinations? ........................................................... 56How do I return to the full database? ........................................................................................ 56How do I view chart data ........................................................................................................ 56How do I search for a single folder to a database ......................................................................... 57How do I search for 2 or more different factors in a chart? .......................................................... 57How do I search for aspects in natal charts? ............................................................................... 58How do I search for planets in specific degrees? .......................................................................... 58How do I export chart data from a database? ............................................................................. 58
Win*Star Menus ............................................................................................................................. 60Win*Star Graphic Ephemeris ........................................................................................................... 67Win*Star’s “Publisher’s Assistant” .................................................................................................... 72
Appendix A - Atlas InformationUSA State Abbreviations ............................................................................................................................ 74World Atlas Abbreviations .......................................................................................................................... 75Index ............................................................................................................................................. 81
Register your program!Matrix Software does require that you register your Win*Star program. This is done by mailing (or faxing) a signed copy of the“User Registration” form or the postcard you received with your order. This form will include your Win*Star Serial# and thelicensing agreement. A signed copy of this form is required in order to receive free Technical Assistance. Be sure to fill out thisform, sign it, and send it to the Matrix address found at the top of the form.
To locate & print this form: Help pull-down / “About Matrix Win*Star” / Registration FormMail your registration form to: Matrix Software, Inc.
126 S. Michigan Ave. Big Rapids, MI 49307
Fax your registration form to: 231-527-2613
vi

1
What is Win*Star Plus?
Win*Star is the most complete and sophisticated astrological calcula-tion and chart plotting software available. This is the ultimate collec-tion of charting, calculation and research tools for serious astrologers.
Win*Star has been conceived to fulfill the needs and expectations ofastrologers, regardless of your personal technique preferences orastrological philosophy.
For example, a siderealist astrologer can easily use a custom ayanamsawith Win*Star . Similarly, an Asteroid fan; a predictive astrologerusing solar arc or degree-year directions, can use their favorite tech-niques in his daily work to simplify his usual chores.
However, as astrologically diverse and capable as the program is,Win*Star provides the user with an extremely user-friendly andflexible interface – whether a student or experienced astrologer youcan easily configure Win*Star to your personal taste and automate itto perform most tasks for you.
The purpose of this Quick*Start Manual is to guide you through theprocess of installing, configuring, and finally using this sophisticatedsoftware package. The instructions in this manual will permit you toperform tasks with confidence in the results you produce.
This Quick*Start Manual is abbreviated to make mastering theprograms basics easy. Additional on-screen help is also available bypressing the F1 key. For practical purposes (most people are completelyintimidated by a huge 400 page manual) and to help preserve ourenvironment, we have converted the more detailed Win*Star Manualto a digital document that you can access on-screen, or if you preferprint. The digital manual is a standard PDF document which canbe opened using the free Adobe Acrobat Reader. This format makes iseasy to navigate through the on-screen document to find what youneed - fast.
Your Win*Star Manual is a “working document.” It is designed tobecome your personal guide to the many components of this program.Scribble in it, make your own notes and comments.
Installing Win*Star
Installing Win*Star is a breeze. In fact it nearly installs itself. Simplyput the CD in the drive, wait a few moments. The program will auto-matically begin the installation process. The installer will put theappropriate files where they should be in your system. The default drivewill be your C Drive. If you have multiple drives you have the option toinstall on an alternative drive. Call Technical Support if you need assis-tance.
At the conclusion of the installation you will be asked if you would likean icon on your desktop. This will allow you instant access to theprogram by simply clicking on this icon.
Enjoy your new Win*Star software.
2
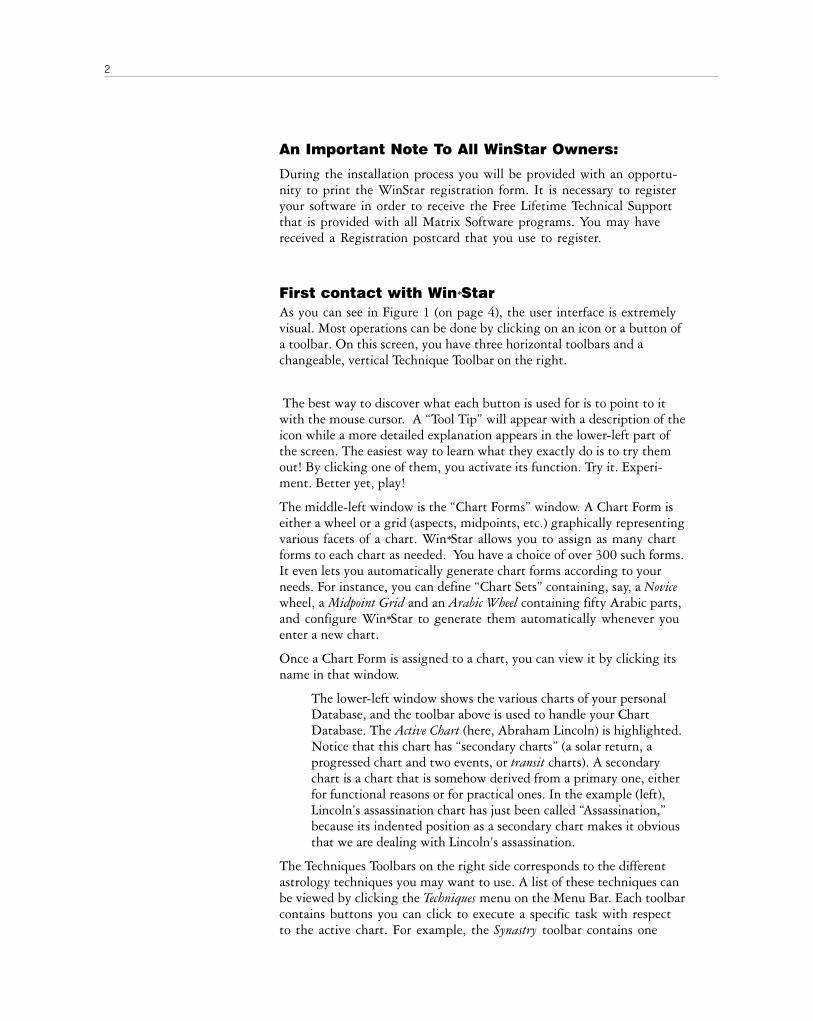
An Important Note To All WinStar Owners:
During the installation process you will be provided with an opportu-nity to print the WinStar registration form. It is necessary to registeryour software in order to receive the Free Lifetime Technical Supportthat is provided with all Matrix Software programs. You may havereceived a Registration postcard that you use to register.
First contact with Win*StarAs you can see in Figure 1 (on page 4), the user interface is extremelyvisual. Most operations can be done by clicking on an icon or a button ofa toolbar. On this screen, you have three horizontal toolbars and achangeable, vertical Technique Toolbar on the right.
The best way to discover what each button is used for is to point to itwith the mouse cursor. A “Tool Tip” will appear with a description of theicon while a more detailed explanation appears in the lower-left part ofthe screen. The easiest way to learn what they exactly do is to try themout! By clicking one of them, you activate its function. Try it. Experi-ment. Better yet, play!
The middle-left window is the “Chart Forms” window. A Chart Form iseither a wheel or a grid (aspects, midpoints, etc.) graphically representingvarious facets of a chart. Win*Star allows you to assign as many chartforms to each chart as needed. You have a choice of over 300 such forms.It even lets you automatically generate chart forms according to yourneeds. For instance, you can define “Chart Sets” containing, say, a Novicewheel, a Midpoint Grid and an Arabic Wheel containing fifty Arabic parts,and configure Win*Star to generate them automatically whenever youenter a new chart.
Once a Chart Form is assigned to a chart, you can view it by clicking itsname in that window.
The lower-left window shows the various charts of your personalDatabase, and the toolbar above is used to handle your ChartDatabase. The Active Chart (here, Abraham Lincoln) is highlighted.Notice that this chart has “secondary charts” (a solar return, aprogressed chart and two events, or transit charts). A secondarychart is a chart that is somehow derived from a primary one, eitherfor functional reasons or for practical ones. In the example (left),Lincoln’s assassination chart has just been called “Assassination,”because its indented position as a secondary chart makes it obviousthat we are dealing with Lincoln’s assassination.
The Techniques Toolbars on the right side corresponds to the differentastrology techniques you may want to use. A list of these techniques canbe viewed by clicking the Techniques menu on the Menu Bar. Each toolbarcontains buttons you can click to execute a specific task with respectto the active chart. For example, the Synastry toolbar contains one

3
button to create a synastry grid, and others to calculate compositecharts using various methods.
The Home toolbar (shown left) is a slight exception: Its last fivebuttons are used to show specific toolbars. You can also go fromone toolbar to the next (or previous one) by clicking on the right(or left) arrow at the top of each toolbar, clicking on an option ofthe Techniques menu, or pressing the corresponding function key.See the Techniques menu pull-down for a listing of the functionkeys assigned to each Techniques Toolbar.

4
Figure #1
Key:1. Shortcut Buttons - Key program features can be accessed via
these icon buttons. (These options can also be accessed from themain pull-down menus at the top of the screen.)
2. Chart Forms - Individual wheel styles can be attached to anycalculated chart. They appear listed here. Each can be selected,displaying in the main display area.
3. New Charts - Chart entry begins here. The “New Chart” buttonopens the data input screen for all chart creation. Here, too, areadditional shortcut buttons to “chart handling” features, such assearching for specific charts, accessing the chart database(containing all saved charts), and deleting charts.
4. Main Menu, “Options” is used to configure Win*Star, settinguser preferences such as default chart locations, aspect orbs, glyphcolors, zodiac , etc.
5. Display Zone - This is the main wheel display area. For thecurrently selected wheel or grid.
Hold your cursor over anybutton. A pop-up box willopen explaining its function.

5
6. Techniques Bar - Toolbars here correspond to an astrologicaltechnique, providing shortcut buttons to program features withinthat area. Individual buttons can be “programmed” with your userpreferences.
7. Chart List Display Window - The “Active Chart” (currentlydisplayed) is highlighted. Here we also see a list of Secondary Charts:Solar Return, Progressed Chart and 2 event (Transit) charts. The “-”sign indicates you can hide these secondary charts. A “+” signshows the presence of hidden secondary charts you can show bydouble-clicking on it.
8. Tool Tips - When you point to a button (without clicking), atiny yellow window opens and displays a tool tip that summarizesthe button’s function. A more detailed explanation also appearsin the Status Bar (described next).
9. Status Bar - Accompanying the Tool tip feature, the status barprovides a brief description of the currently highlighted menufeature.
Configuring Win*Star“Configuring” Win*Star means to define your own default parameters forthe various jobs you will want it to do in your daily work as a workingastrologer. After this configuration is completed, you can still change anyparameter you want for a specific job, but you don’t have to do it everytime! You can thus save yourself a lot of time by defining a good person-alized configuration.
You will normally start by defining your General Options, as describedin this section. Then, when you request any specific additional job, you’llalready have defined its default parameters; the selections you make willremain the new default until you change them. [Previously createdcharts retain their original configuration; changes made in the Optionsmenu (as described in the upcoming section) do not work “retroac-tively.”]
General Options Settings – Basic Principles
You can define your own General Options settings by opening the OptionsMenu (Options Pull-down / Win*Star Options). This displays the ten-tabbed Win*Star Options menu. Each tab reveals an option categorythat lets you set default values for your most commonly used parameters.In some cases, suggested default values will be appropriate, but you canchange them!

6
The following is a list of options you can personalize in yourprogram, along with a short explanation each.
Updating various Win*Star Options
1. Default Calculation Options: Most preset defaults are adequateunless you use a different house system, or if you use a siderealzodiac. And the check boxes should remain unchecked, unless you usea True Node position, or you want your Part of Fortune to becalculated “the ancient way,” i.e. differently whether the Sun isabove or below the horizon.
2. Data Input Options: Here you can choose how you enter datesand times. Pay special attention to the Assume Century options. Ifyou accept the default value (1900), Win*Star will assume thatwhen you enter only the two last digits of the year, it will be 19xxyou’re considering. You can change this default to 2000 (typing 01will mean 2001) or None (typing 01 will mean 0001). Outside yourassumed century range, you just need to specify all four digits tomake sure you have the right year.
3. Chart Forms: This option is particularly important; it is used toshow how your charts will be viewed and printed. This is andespecially important aspect of the configuration task since it definesthe Chart Forms that will be used every time you request a specificjob. A complete section is devoted to this subject (later in thismanual), but here is a short summary of the elements you canspecify:
• The actual Chart Form is the basic wheel model you want to use.The idea is to click on a chart form name so you can view it inminiature on screen, together with a few lines of descriptive text.You have a variety of models to choose from: equal or unequalhouse wheels, Aries wheels, European style wheels, 90° or otherdials, and many different types of grids (aspects, midpoints, etc.).You also have multiple wheels (usually, when the form name startswith “Two” or “Three”, it means small wheels on one page,whereas when it starts with “Double”, “Tri” or “Quad”, it meanscharts on concentric circles). You finally have specialized types ofwheels or grids, for instance, Arabic has 50 built-in Arabic parts,Horary, Aspect Ring (has aspects to planets and points plotted), andmany more!

7
• Planets or points to be included into the form: you can choose toinclude the Moon’s South Node, Part of Fortune, Lilith (the trueDark Moon), Asteroids, Uranian Planets, etc. depending upon yourneeds.
• The Aspect Set you use for drawing aspect lines in wheels or forAspect Grids; if you want only major aspects, choose Ptolemy; toinclude minor aspects choose Standard; and if you want to use rareaspects (such as Quintiles), choose Custom or Complete. Of course, youcan adjust these aspect sets to your needs, or even create a new setwith your own choice of aspects and orbs, as explained later…
• Planets or points to which you want or don’t want aspects drawn:for instance, you may choose not to draw aspects to the Moon’snode or to asteroids, even if their positions are drawn.
4. Colors: You can change the colors associated to signs, planets,aspects etc. The idea is to choose (in the Color Scheme Window)the Association you want to establish (Planet, Sign, Aspect,…), andthen drag and drop a color from one of the colored squares in thelower right side of the window onto the element you want to colordifferently. Note that you can also drag and drop a color the otherway from an astrological element to a square to save it for futureuse. You can also double-click on a color to open the Color windowand select or create a color. Win*Star offers you plenty ofopportunities to customize your charts (colors, background design,etc.).
5. Aspects and Orbs: This option is quite long to define, since itinvolves setting a number of parameters.Start with the aspect set closest to your needs for a specific job,such as:- Standard (major & minor aspects) for natal charts- Ptolemy (major aspects only) for transits and progressions- Square (conjunction, opposition & squares) for (progressed)Moon phases- Hard (Square Set + Semi- and Sesqui-Squares)- Custom - (Major, Minor & most common rare aspects)- Complete (all of them, even the rarest)
You can add or delete aspects to any set you choose or createyour own set and save it under any name.
For each set (preset or user-defined) you can define your ownorbs. Note that you can define different orbs for different sets(e.g. wider orbs for Standard than for Complete)
6. Edit User Logo: Here you can include your own Logo on allcharts and search reports
7. Misc. You can elect to display the tool tips (and some buttoncaptions) in French, Spanish, German or English. You must exitthen restart Win*Star for these changes to take effect.

8
Win*Star How-To’s...
This list will give you quick access to the handy “How To” directionsfor specific tasks in Win*Star:
Basic Astrology Tasks
Creating a Natal Chart p. 9
Viewing or Printing a Chart p. 12
Delete individual charts p. 13
Delete dependent charts p. 14
Changing Aspect Sets p. 14
Choosing planets to include in the wheel p. 15
Importing chart files from other astrology programs p. 17
Using the Atlas p. 18
View or print 2, 3, or 4 charts in one wheel p. 19
Assigning default forms to Techniques menu buttons p. 20
Setting Defaults
Changing the default wheel for new chart input p. 21
Changing the default house system p. 21
Changing aspect sets p. 21
The Select Chart Form Menu (described) p. 23
Chart Form Options Menu (described) p. 23
Creating Chart Sets (using the Options Menu) p. 25
Working with charts in the Chart Database p. 26

9
How to Create a chart
New charts are created in the Enter Chart Data screen. There areseveral ways to open this dialog. You can:
- click the New Chart button- with your keyboard, type: Ctrl + N
- use the File menu, Add New Chart option- click the New button of the Home Techniques toolbar
Once this dialog box (see Figure 3 below) is open, you just enter thebirth information into the appropriate fields and click OKOKOKOKOK to have yournew chart calculated and displayed (according to your configurationparameters).
Let’s have a look into the Data Entry area. We’ll study it field by field.
Figure 3 - The Enter Chart Data Window
Note: Common Windows navigation skills are used when entering data. The Tab key moves the“focus” from field to field; a left-mouse click on any field does the same. For menu buttons,keyboard Alt-Key combinations (where “Key” is the key depicted by the underscored letter of thebutton name, such as Alt-H for the Here button) serve the same purpose as clicking them.
Use these buttons toadd or delete chartsfrom your list.
10
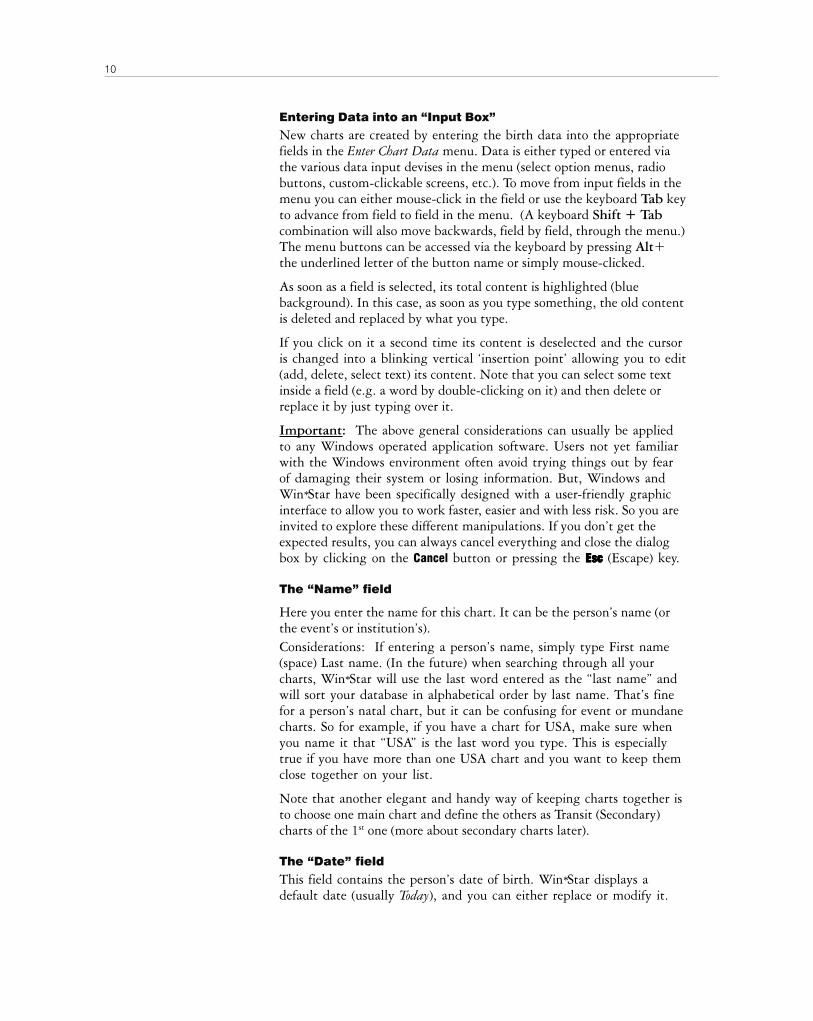
Entering Data into an “Input Box”
New charts are created by entering the birth data into the appropriatefields in the Enter Chart Data menu. Data is either typed or entered viathe various data input devises in the menu (select option menus, radiobuttons, custom-clickable screens, etc.). To move from input fields in themenu you can either mouse-click in the field or use the keyboard Tab keyto advance from field to field in the menu. (A keyboard Shift + Tabcombination will also move backwards, field by field, through the menu.)The menu buttons can be accessed via the keyboard by pressing Alt+the underlined letter of the button name or simply mouse-clicked.
As soon as a field is selected, its total content is highlighted (bluebackground). In this case, as soon as you type something, the old contentis deleted and replaced by what you type.
If you click on it a second time its content is deselected and the cursoris changed into a blinking vertical ‘insertion point’ allowing you to edit(add, delete, select text) its content. Note that you can select some textinside a field (e.g. a word by double-clicking on it) and then delete orreplace it by just typing over it.
Important: The above general considerations can usually be appliedto any Windows operated application software. Users not yet familiarwith the Windows environment often avoid trying things out by fearof damaging their system or losing information. But, Windows andWin*Star have been specifically designed with a user-friendly graphicinterface to allow you to work faster, easier and with less risk. So you areinvited to explore these different manipulations. If you don’t get theexpected results, you can always cancel everything and close the dialogbox by clicking on the Cancel button or pressing the EscEscEscEscEsc (Escape) key.
The “Name” field
Here you enter the name for this chart. It can be the person’s name (orthe event’s or institution’s).Considerations: If entering a person’s name, simply type First name(space) Last name. (In the future) when searching through all yourcharts, Win*Star will use the last word entered as the “last name” andwill sort your database in alphabetical order by last name. That’s finefor a person’s natal chart, but it can be confusing for event or mundanecharts. So for example, if you have a chart for USA, make sure whenyou name it that “USA” is the last word you type. This is especiallytrue if you have more than one USA chart and you want to keep themclose together on your list.
Note that another elegant and handy way of keeping charts together isto choose one main chart and define the others as Transit (Secondary)charts of the 1st one (more about secondary charts later).
The “Date” field
This field contains the person’s date of birth. Win*Star displays adefault date (usually Today), and you can either replace or modify it.

11
To replace the date, just type in Month, Day and Year (with spaces oranother separation character); you can enter the month using numbers orletters; you can type the last two digits of the year if your Win*Star isconfigured for that.
You can also use the perpetual calendar by clicking on the smalltriangle on the right.
The “Time” field
This contains the person’s birth time. Times are displayed in standard(AM/PM) format, but you can configure Win*Star to enter times in 24-hour format.
Here also, you can use a dialog box to speed up time input: you canstart by choosing the closest of Midnight (00), 6 o’clock (06), Noon(12) or 6 PM (18), and then adjust it using the spinners; click OK whenyou are done.
The “Place” field
This contains the person’s birth place (city and state, province orcountry). The default is the “Current Place” that was entered atconfiguration.
The easiest method to input all location data is to use the Atlas. To dothat, just type the name of the city (or its first few letters), a comma andthen the abbreviation of the state (USA), province (Canada) or country itbelongs to (see Appendix A), both separated by a comma. Keep in mindthat the abbreviation of a state in the U.S. is two letters long, whereasyou need three or more for a country or Canadian province.
IMPORTANT: Once you have typed in the birth place, you mustclick the Atlas button. A window opens displaying a list of cities.Double-click on the correct one and click OK. The correct longitude,latitude and time are then entered automatically by the program.
If you don’t use the Atlas (or if the place is not found), you canmanually enter the correct longitude, latitude and time in the appro-priate fields.
Buttons descriptions: “Enter Chart Data” screen
AtlasAtlasAtlasAtlasAtlas: Search a city in the electronic atlas
HereHereHereHereHere: Uses the “Current Place” (city & time zone) defined at configuration.
NowNowNowNowNow: Get the current time (date & time) from your computer’s clock

12
GetGetGetGetGet: Shows the database grid (allowing you to select an existing chart)
ImportImportImportImportImport: Get birth data saved by another astrology program (such as Blue*Star)
MoreMoreMoreMoreMore: Enter data for another chart (to enter several charts in a row)
OKOKOKOKOK: Calculate and view the chart you just entered
CancelCancelCancelCancelCancel: Close the window without calculating any new chart.
“Calc Options” and Database tabs
The right-hand pane contains the Calc Opts window (CalculationOptions, as defined during configuration). It can be replaced by aDatabase window if you click the appropriate tab.
Here you can specify Calculation Options other than those you choseduring configuration, but for this chart only. These are “advancedoptions” and we suggest they only be used if you are familiar with theirfunctions and (their) effect upon the calculated chart.
The Database Tab opens a window in which you can specify some ChartDatabase options: assigning this new chart to a specific Folder, definingAttributes, Notes, and other fields.
How to view or print a chart
Once you have entered a new chart and clicked on OK, the chart isinstantly calculated and displayed in the selected form (depending onyour configuration and what kind of “view” is now active). Win*Starlets you view your charts in many ways, depending on your needs.
Three basic tools are available for you to view your charts; you canactivate them by clicking on the appropriate button of the top horizontaltoolbar:
• Chart View: You can create and view one or more Chart Forms:wheel (eventually multiple) or grid. (Details are found in the nextsection.)
• Data View: You can choose views from a list of tables or graphicrepresentations of some chart data: positions, elements, crosses,aspects, patterns, planetary strengths, etc. (see details below).
• Chart Viewer: Contains a set of tools for analyzing and scanningthe details of a chart: detailed positions, patterns, basic interpre-tation schemes, Sabian symbols, etc. To use it, you first need toview the chart as a wheel, then to the current chart. You justclick on one of them to view the chart with that form.
On top of that window is a toolbar with three buttons allowing you toadd or delete a chart form or to add a multiple wheel (or synastry grid)

13
Besides these three tools, you can also click on the ShowShowShowShowShow button toenlarge the view to its maximum size on the screen; double-clicking orright-clicking on the chart will reduce it to its previous size.
You can also click and drag the view back and forth to see the partsthat may be hidden on smaller monitors.
You can print the current view you selected (in color, if you have acolor printer).
When you click on Data View, the middle-left window becomes the“Data Views” window and displays a list of all the Data Views that areavailable (unlike Chart View, you don’t have to add the ones you want,they are all there!). These views let you display some chart data innumeric or graphic form, thus allowing an analysis of the chart. You justhave to scroll through the list (using the vertical scrollbar) and click onthe view you want to display.
Here is a list of some of the more interesting data you can display:· Chart Positions: exact planetary positions (longitude, latitude,
declination, etc…)· Elemental Balances: number of planets in elements, crosses, sectors,
etc…· Lunar Phase Etc: Moon’s phase (and other data on Sun and Moon)· Many aspect and mid-point grids· Chart Patterns: geometrical patterns (Grand Trine, T-square, Yod,
etc.)· Ptolemaic Dignities: rulers by sign, exaltation, triplicity, term, face,
mutual receptions, combust planets, and other dignities ordebilities according to Ptolemy
· Lilly Strengths: planet strengths according to William Lilly’scriteria (essential and accidental dignities and debilities)
· Fixed Stars: fixed stars conjunct to planets (the printout givesother aspects too!)
Delete individual charts
1. Highlight the active chart you wish to delete.2. Click the Delete Chart button.
3. Click Yes when asked to confirm this deletion.

14
Delete dependent charts
1. If the dependent chart is not showing, click the + mark at theleft side of the root chart.
2. Highlight the Dependent Chart you wish to delete.
3. Click the Delete button
4. Confirm the deletion when prompted.
Changing aspect sets
Win*Star contains eight aspect sets, which can be used in calculatingany chart form. The set used is determined in the Chart Form Optionsmenu. This menu can be accessed three ways:
1. (From) the Chart Forms tab of the Win*Star Options menu(Options pull-down/Win*Star Options/Chart Forms tab). Thismethod sets the main default settings for new charts.
2. (From) the Add Form above the Chart Forms list (to set options ona chart-by-chart basis.)
3. (From) the wheel-producing icon buttons in the Techniquemenus. (Each wheel-producing button accesses the Select ChartForm menu)
Changing the Aspect set used as the Main DefaultChanging the Aspect set used as the Main DefaultChanging the Aspect set used as the Main DefaultChanging the Aspect set used as the Main DefaultChanging the Aspect set used as the Main Default
1. Access the Chart Forms tab of the Win*Star Options menu(Options pull-down/Win*Star Options/Chart Forms tab). Thismenu controls options for all chart forms.
2. You will find the New button (from the Home Technique menu) isselected and the form showing on the right is the form attached tothis button. The shipped default form is the “Unequal Wheel” (a“fixed” wheel).
3. Click the Form Options… button to open the Chart Form Optionsmenu. Locate the Aspect Set list (top-right) and click the DownArrow to highlight an aspect set.
4. Click OK. This will be the default aspect set used when calculatingcharts (unless overridden on a chart-by-chart basis).
Changing the Aspect set on a chart-by-chart basis
Specific chart forms can be attached to any active chart by using theAdd Form button above the Chart Forms list. These forms can be setup to use any of the eight aspect sets:

15
1. Highlight any chart. Click the Add Form button to open the SelectChart Form menu.
2. (From the Select Chart Form menu) select a chart form toattach to this chart and click this button (top-right) to openthe Chart Form Options menu.
3. Locate the aspect list (right-center) and click the Down-Arrow tohighlight an aspect set and click OK, closing the Chart FormOptions menu.
4. Click OK to close the Select Chart Forms menu. This aspect setwill now be used to calculate this chart form using the selectedchart, overriding the main default aspect set. If you access thisform again, it will return to the default aspect set.
Changing the Aspect set used by Technique icon buttons
Any wheel-generating button can be set up to calculate using yourchoice of chart form. That chart form can then be set to use a specificaspect set. As an example, to change the aspect set used by the formattached to the “360° Whl” button of the Wheels menu:
1. First, access the Wheels Techniques menu (press F9).
2. Press the Ctrl button while clicking the 360° Whl icon button. TheSelect Chart Form menu will display showing the wheel formcurrently attached to the “360 Whl” button.
3. Click this button (top-right) and the Chart Form Options
menu will display. Settings made in this menu will effect only thechart form (the “360° Whl” in this case) showing in the Select ChartForm menu. Select any aspect set from the aspect set list (lower leftcorner) and click OK.
4. Click OK from Select Chart Form menu. The selected aspect set willnow be used when the “360° Whl” chart form is calculated, and itwill remain the default aspect set for that button until thisprocedure is used to choose a new aspect set.
Choosing the planets & points to include in the displayed chart
The planets and points displayed in a chart are determined either bythe Technique button used to create the chart (each Technique iconbutton accesses its own Chart Form Options menu and settings aremade for that chart when accessed by that button) or they are deter-mined chart by chart when using the Add Form button.
New charts created in the Enter Chart Data menu (by clicking the NewChart button) display the planets and points settings of the formattached to the New Chart button.
Specific chart forms can be “attached” to the Technique menu buttons sothat when you click that button, the chosen form(s) will display using theselected chart.

16
Setting the default planets & points
1. Access the Chart Forms tab of the Win*Star Options menu(Options pull-down/Win*Star Options/Chart Forms tab). Thismenu controls options for all chart forms.
You will find the New button (from the Home Technique menu) isselected and the form showing on the right is the form attached to thisbutton. This form contains the default settings for new charts created inthe Enter Chart Data menu. The shipped default form is the UnequalWheel (a “fixed” wheel).
2. Click the Form Options… and the Chart Form Options menu willdisplay.
3. This menu has two boxes (among other items) called “PlanetsIncluded” and “Planets Aspected.” Listed within these boxes are theplanets & points that can be calculated in the chart. Choose thepoints you wish set as the defaults by clicking on the individualabbreviations for the planets and points – click one and it will turnred, meaning it will be included. Click it again to deselect.
4. A shortcut method of planet/point selection is offered as well: theSelect Planets menu. This can be accessed by clicking the tall verticalbutton in each of the Planets Included and Aspected Planets sections.The Select Planets menu offers several preset selection buttons thateliminate the need to individually click items. For example, clickingthe Asteroids button will select all the asteroids, etc
5. Click OK from both the Select Planets and Chart Form Optionsmenus when you have completed making choices. These planetsand points will be the ones calculated in future charts (unlessspecific forms are set using other planet/point selections).
Important: Although there are many ways to access this Chart FormOptions menu – such as when selecting custom settings for individualbuttons and forms – the settings selected here are the main defaults.
Setting up the Chart Forms
Planet & Point selections can be made for individual forms, either whenthe forms are attached to individual charts or to the forms that areattached to Technique menu icon buttons. Forms attached to individualcharts can be considered a one-time “on the fly” event. Technique menuicons will repeat their attached form chart after chart.
Setting up chart forms to individual charts
1. Highlight an active chart to which you want to attach a specificform using a custom set of planets and points. Click the Add Formbutton located in the Chart Forms area of the main screen. The SelectChart Form menu will pop up.

17
2. Select the chart form desired for this chart and click the “SelectChart Options” button (the third-from-left button at the top-rightof the menu) to open the Chart Form Options menu. Go ahead andpick the planets and points desired for this chart. Close both theChart Form Options menu and the Select Chart Form menus (byclicking OK). This chart form will calculate for the highlightedchart, using the new planet/point selections.
Setting up chart forms attached to icon buttons
All the wheel-producing icon buttons in the Technique menus (thebuttons aligned vertically on the right side of the Win*Star screen) canbe custom-set to generate any chart form or forms from the highlightedactive chart. These forms can be customized to include any combinationof planets & points. These buttons are all the buttons in the ChartTransformations, Progressed Charts, Returns, Synastry, Bi/Tri/QuadWheels, andWheels menus and the “New” and “Auto” buttons from the Home menu.
Here’s how:
1. Press the Ctrl button on the keyboard while you left-click a wheel-producing Technique menu icon.
2. The Select Chart Form menu will pop up. Pick the form(s) youwant generated by this Technique icon button. Customize eachform by clicking the “Select Chart Options” button, and aversion of the Chart Form Options menu specific to this formwill display where you can select the planets and points.
3. Click OK to close both menus. Now, with an active charthighlighted, when that icon button is clicked the chosen form willdisplay using the selected planets and points.
Importing chart files from other astrology programs
Chart files are imported via the Import Chart menu which can be accessed from threelocations, the File pull-down, the Enter Chart Data screen, and the Chart Database.The Import Chart menu has a pull-down selector that will access chart files savedfrom QuickCharts, Blue*Star, Compact Data, PRIMA, Nova, CCRS ’92, Kepler v2.5 programs, and Solar Fire.
From the File pull-down:
Access the Import Charts dialog by clicking the File pull-down, Import Charts. Anychart files on your computer can be accessed from here. The scrollable list at topcenter selects the chart file type and the New File button selects which file of that typeto display in the Chart Database. Here is how the two buttons work together:

18
1. (From the Import Charts dialog) Click the Down-Arrow to select thetype of file you wish to import. The file path displays above thechart list. The charts in the selected file will display in the listwindow. To choose another chart file, click the New File button,which displays your path\file directory and shows any other files ofthat type on your system. Highlight a different file and click Ok todisplay that file in the Import Chart dialog. All charts in the filewill appear listed.
2. Any (or all) of these charts can be returned to the Current Chartslist of the main screen (or to the Chart Database, or to both) –simply by highlighting the chart and clicking Ok.
3. Select one of these charts. To select a chart, move your cursor tothe far-left of the chart name until the cursor turns into a checkmark. Now, if you click on the chart name the entire line willturn blue, signifying that chart is selected for importing.
If you wish to select all of the charts, click the Select All button. If youwant the imported charts to have chart wheels calculated, fill thecheckbox beside “Add Chart Wheel”. (This, however, will increase thecalculation time required to import the charts.) Click Ok to return thechart(s) to the active chart list on the main screen.
From the Enter Chart Data menu:
1. If you are in the Enter Chart Data menu, click the Import buttonwhich will also access the Import Charts dialog. The procedure forretrieving chart files is identical to the explanation just given,except the imported chart will now be brought into the Enter ChartData menu where it can be edited, if necessary.
2. Click Ok from the Enter Chart Data menu and the imported chartwill be added to the active charts list on the main screen.
From the Chart Database:
1. Go into the Chart Database, click the chart database button and access the Import Chart dialog from the Chart Database Filepull-down’s Import Charts From selection. This will also pop up theImport Charts dialog. Follow the steps described above for thatdialog.
Using the Atlas
The Atlas button (accessed from the Enter Chart Data screen) providesinstant access to any installed and selected atlas.

19
HowHowHowHowHow to use: (for U.S.A. cities)
1. Click the Atlas button. Click the Get State (USA) button.
2. Type in the two-letter state abbreviation in the Find: box.
3. The proper state is then highlighted. Click Ok to close the menuand return to the Enter Chart Data screen with the proper atlasinformation.
If the birth occurred in a hospital and you know the hospital’s name,click the Show Data button, then click the Hospitals button andselect the correct hospital. Close both menus by clicking Ok.
How to use: (for International cities)
1. Click the Get Country button..
2. In the Find input box type the country name or the 3-lettercountry abbreviation, or use the alphabetical scroll to select thedesired country.
3. Click Ok to close the menu and return to the Enter Chart Datascreen with the proper atlas information.
Viewing Charts
View (or print) 2, 3, or 4 charts in one wheel
BiWheels, TriWheels, and QuadWheels are created in the Bi/TriWheel menu. First,select the individual charts that will appear in the Bi- Tri- or QuadWheel.
1. Click the multiple-chart button (see graphic, left). Four spaces forcharts will appear.
2. At the left of the charts’ spaces, there are the numbers 1-4. Ifcreating a tri-wheel, click the #3, which opens three chart namespaces. Now use your mouse to drag and drop the desired chartsinto the three spaces. The innermost chart (in the tri-wheel) usesthe chart in the “Chart 1” position; the second ring of the wheeluses the chart in the “Chart 2” position, etc.
3. Press the F7 button to reveal the BiWheel Techniques menu (atmenu-right) and click either the “BiWheel,” “TriWheel,” or“Quadwhl” buttons, depending upon which type of multiple-chartwheel you wish to calculate.
4. The wheel will calculate and display on the View screen and willappear in the Chart Forms list. It is connected to the active chartplaced in the “Chart 1” position.

20
Assigning default forms to Technique menu buttons
Remember: All of the technique icon buttons can be set to use any chartform(s) that you want. They will attach to that icon button and willcalculate each time it is clicked.
1. Press the Ctrl key when clicking the icon button and the SelectChart Form menu will appear where you can choose the desiredformat. A diagramed description of the Select Chart Form menu isprovided at the start of the Technique menu section, on page 23.
2. Choose between Screen, Printer, or Fixed wheels. Each has itsown list which is selected with one of these buttons:
Screen - best for multiple-wheel viewing (several wheels on screenat once) because they use scalable fonts, which stay the clearest whenwheels are resized.
Printer - has wheels with fonts designed for printing. They will lookfine on screen and will print better than Screen or Fixed wheels.
Fixed - wheels with a large font that provides the very clearest full-screen wheels without scalable fonts (not for resizing).
3. Highlight a wheel style in the scrollable list. A “thumbnail”representation of that wheel will appear on the left side of the menuwith a brief description beneath it, to aid in wheel selection.
4. Click the Ok button (at the bottom-right of the Select Chart Formmenu) to return to the main screen. The selected chart form willnow be attached to the icon button previously “Ctrl + Clicked”. Itwill calculate and display in the Chart Forms list whenever that iconbutton is clicked, using any selected active chart.
To select several new wheels:
1. Access the Select Chart Form menu as described above. At the top-right of the menu, click the Edit Chart Sets button.
2. This opens the Edit Chart Form Sets menu. The existing Chart Setswill appear listed in the top-right “Chart Sets” box. Highlight aChart Set name (or create a new Chart Set by clicking the Newbutton and naming the Set). The forms in the highlighted set willappear listed in the bottom-right of the menu. Use the Add andDelete buttons in this menu to add or delete chart forms from thisset. Note that charts in a set must be of the same type (screen,printer, or fixed).
3. Repeat this procedure to include any other chart forms.. (Any ofthese forms can be individually customized by clicking theOptions... button and making selections in the Chart FormOptions menu – selections that apply only to that chart form.)When ready, click the Save button and save the set of forms witha .set extension.
4. Click Ok and these chart forms will now be attached to the iconbutton previously Shift+Click ed, ready to be implementedwhenever you click that icon button.
21
Setting defaults (basic tasks, cont.)
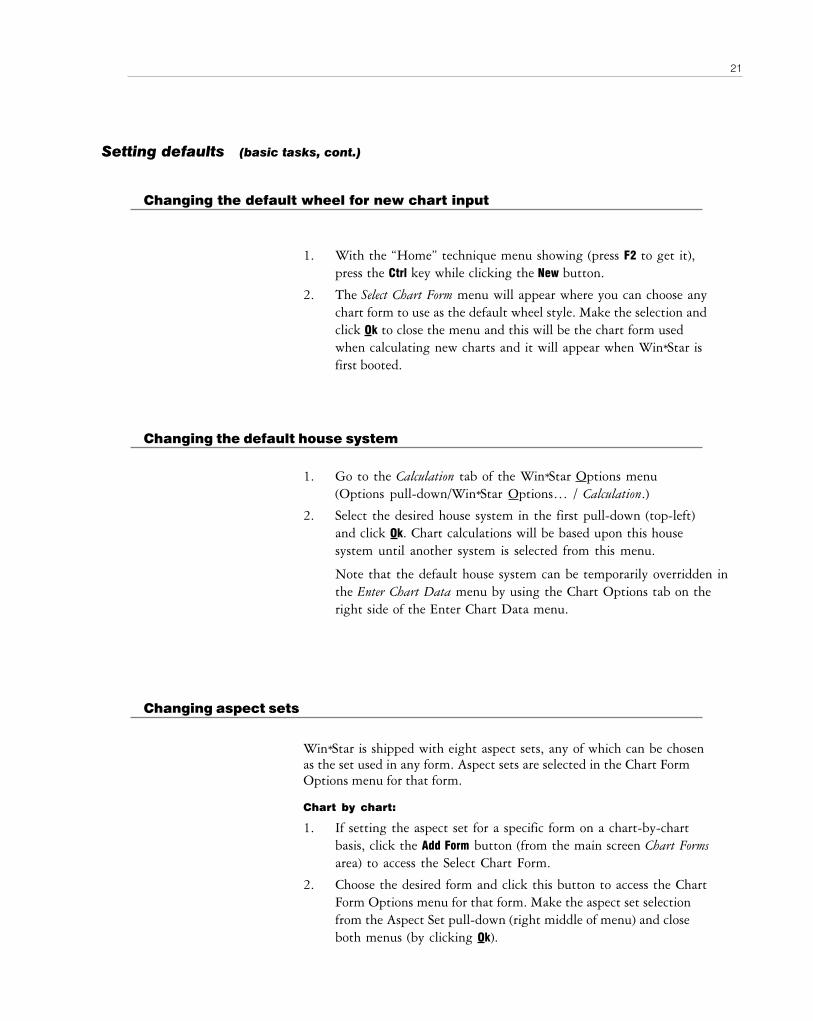
Changing the default wheel for new chart input
1. With the “Home” technique menu showing (press F2 to get it),press the Ctrl key while clicking the New button.
2. The Select Chart Form menu will appear where you can choose anychart form to use as the default wheel style. Make the selection andclick Ok to close the menu and this will be the chart form usedwhen calculating new charts and it will appear when Win*Star isfirst booted.
Changing the default house system
1. Go to the Calculation tab of the Win*Star Options menu(Options pull-down/Win*Star Options… / Calculation.)
2. Select the desired house system in the first pull-down (top-left)and click Ok. Chart calculations will be based upon this housesystem until another system is selected from this menu.
Note that the default house system can be temporarily overridden inthe Enter Chart Data menu by using the Chart Options tab on theright side of the Enter Chart Data menu.
Changing aspect sets
Win*Star is shipped with eight aspect sets, any of which can be chosenas the set used in any form. Aspect sets are selected in the Chart FormOptions menu for that form.
Chart by chart:
1. If setting the aspect set for a specific form on a chart-by-chartbasis, click the Add Form button (from the main screen Chart Formsarea) to access the Select Chart Form.
2. Choose the desired form and click this button to access the ChartForm Options menu for that form. Make the aspect set selectionfrom the Aspect Set pull-down (right middle of menu) and closeboth menus (by clicking Ok).

22
Technique Icon button defaults
1. If setting the aspect set for a form-generating button, press theCtrl key while clicking the Technique button to access the SelectChart Form.
2. Choose the desired form and click this button to access the ChartForm Options menu for that form. Make the aspect set selectionfrom the Aspect Set pull-down (right middle of menu) and closeboth menus (by clicking Ok).
3. That aspect set will now be used in the form displayed from theTechnique icon button.

23
Selecting appropriate Chart Form optionsSelecting appropriate Chart Form optionsSelecting appropriate Chart Form optionsSelecting appropriate Chart Form optionsSelecting appropriate Chart Form options::::: Click this
button (from the top-right area of this form) to open the Select ChartForm screen (Figure 6, following page) where you can determine(among others) the following options:
- Planets and points to be included in the wheel or grid
- The aspect set you want to use. You can also request that no aspectsbe drawn, or that aspects be filtered to enhance legibility.
- The planets and points you want aspects to be drawn to.
List of forms in the selected folder. Select one byclicking on its name. The selected form will beadded only when you click OK

24
This Chart Form Options dialog box (Figure 6 above) allows you toselect planets, points and aspects. Here are a few helpful remarks:
• You will select planets and points in both Planets in wheel andAspected Planets windows, unless you decide not to draw anyaspects at all.
• If both selection are the same (or very close), you can use thevertical arrows to copy your selection from one window to theother (an then make minor changes if necessary).
• Filtering aspects means that if, for example, your chart hasseveral conjunct planets in trine to another one, only one aspectline will be drawn. A drop-down window on the right allows youto select from: Draw Aspects (filtered), No Aspects Drawn andDraw Unfiltered.
• The tall buttons can be clicked to pop up a dialog box that showsthe detailed planets’ and points’ names and glyphs, and allowsfaster group selections and deselecting.
That’s It! After making all selections in both the Chart Form Optionsand the Select Chart Form menus, close all menus by clicking OK.Now the selected chart will have attached to it and will be able todisplay using the chosen form.
Figure 6 - the Chart Form Options screen
25
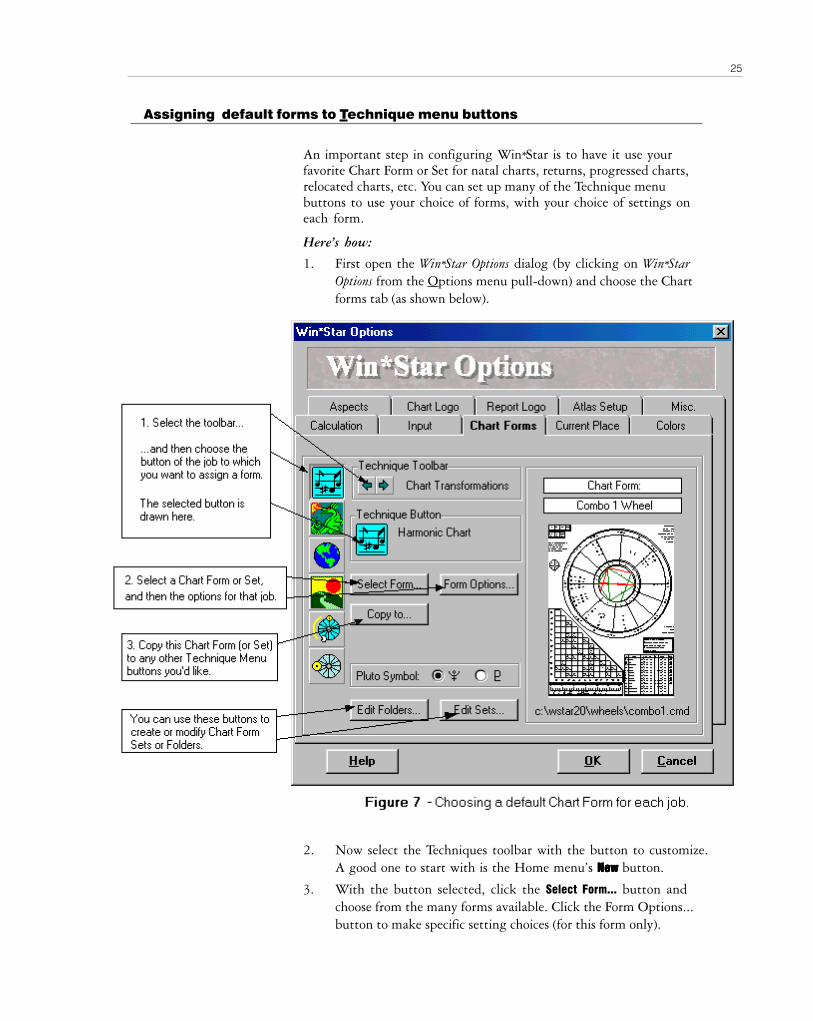
Assigning default forms to Technique menu buttons
An important step in configuring Win*Star is to have it use yourfavorite Chart Form or Set for natal charts, returns, progressed charts,relocated charts, etc. You can set up many of the Technique menubuttons to use your choice of forms, with your choice of settings oneach form.
Here’s how:
1. First open the Win*Star Options dialog (by clicking on Win*StarOptions from the Options menu pull-down) and choose the Chartforms tab (as shown below).
2. Now select the Techniques toolbar with the button to customize.A good one to start with is the Home menu’s New New New New New button.
3. With the button selected, click the Select Form... button andchoose from the many forms available. Click the Form Options...button to make specific setting choices (for this form only).

26
4. Now click OK to complete the setup. Now that selected formwill be used each time that button is clicked.
5. Note: You can go through the rest of the Technique menus andset up any of the form-creating buttons in the same way. There iseven a shortcut method to reproduce the same chart selection toother Technique menu buttons (without again going to the SelectChart Form and Chart Form Options menus). When you click onthe Copy toCopy toCopy toCopy toCopy to button, a new dialog box shows all the job buttons,and the one you just configured is checked. You then just have tocheck all the other job buttons that use the same form and clickOKOKOKOKOK.
6. Chart Sets can also be very handy if you often use several chartforms for the same chart; e.g. a basic wheel, a midpoint (andaspect) grid, and an Arabic wheel (for Arabic parts). You can createa set containing your selected Forms, and assign it to your mostfrequently used job buttons, or assign only the basic Chart Form tothese buttons and assign the set to the Add CharAdd CharAdd CharAdd CharAdd Chart Ft Ft Ft Ft Form Setorm Setorm Setorm Setorm Setbutton (labeled “Auto” on the Home toolbar).
7. A Chart Folder can be handy if you want to group your favoriteChart Forms in a custom folder for a faster retrieval.
Working with charts and data in the Chart Database
Once a chart is calculated, Win*Star saves it automatically to yourChart Database. Because charts are saved this way, at any time you canshut down your computer without having to worry about losing yourprecious chart data. Next time you run Win*Star all your charts willbe available for you to view, print or work with.
Using the Chart Database
A database is a disk file (sometimes more than one) that can contain ahuge quantity of data (if needed), structured in a logical way so that itbecomes easy to add, delete, find, sort or filter data. Of course, we aretalking about chart data, but database are used for many other purposes!
A database is made of one or several tables (sometimes linked together sothat it seems that there is only one). A table looks like a grid, with rowsand columns. Each row is called a “record” and contains (in our case) allthe data related to one chart: name, chart data, planetary positions, andother data, such as attributes, keywords, user comments, etc. Eachcolumn is called a “field,” and contains a kind of data you find in allrecords, such as the name, date or Moon position.
It is important to understand that even if all these data bits and piecesare not visible to you as a user, they are there, silently sitting in somefield of some record. It is the so-called Database Management Systemresponsibility to search for and display the data you request.
27
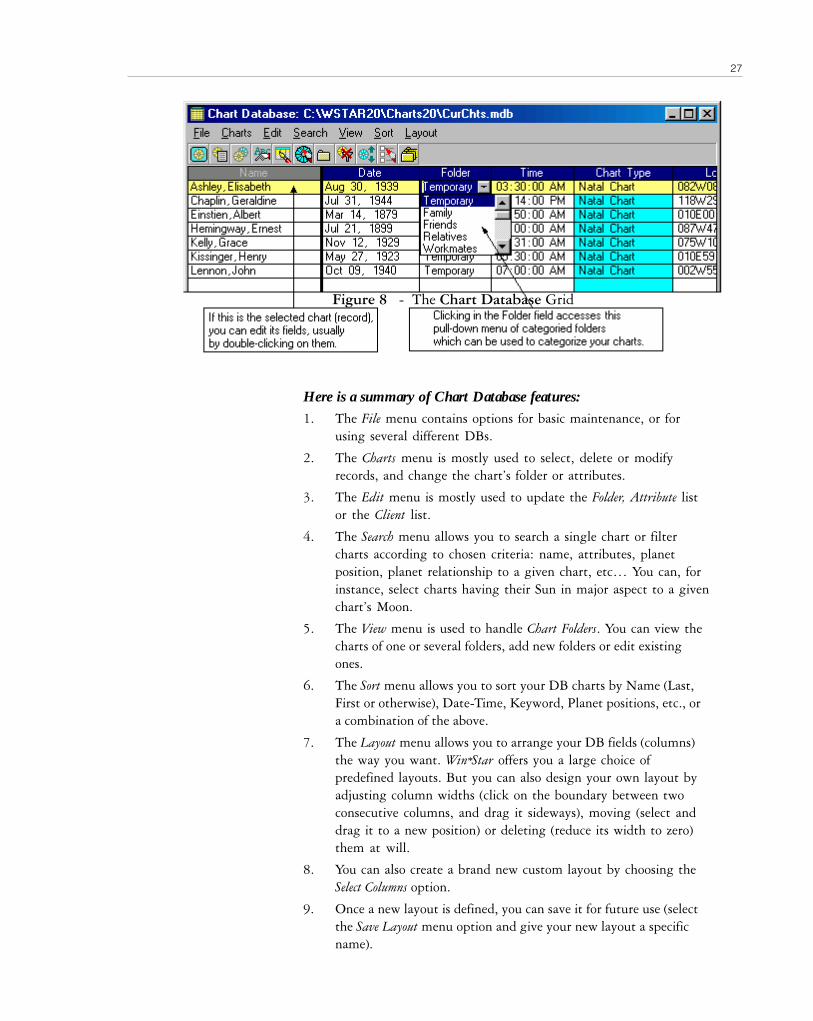
Here is a summary of Chart Database features:
1. The File menu contains options for basic maintenance, or forusing several different DBs.
2. The Charts menu is mostly used to select, delete or modifyrecords, and change the chart’s folder or attributes.
3. The Edit menu is mostly used to update the Folder, Attribute listor the Client list.
4. The Search menu allows you to search a single chart or filtercharts according to chosen criteria: name, attributes, planetposition, planet relationship to a given chart, etc… You can, forinstance, select charts having their Sun in major aspect to a givenchart’s Moon.
5. The View menu is used to handle Chart Folders. You can view thecharts of one or several folders, add new folders or edit existingones.
6. The Sort menu allows you to sort your DB charts by Name (Last,First or otherwise), Date-Time, Keyword, Planet positions, etc., ora combination of the above.
7. The Layout menu allows you to arrange your DB fields (columns)the way you want. Win*Star offers you a large choice ofpredefined layouts. But you can also design your own layout byadjusting column widths (click on the boundary between twoconsecutive columns, and drag it sideways), moving (select anddrag it to a new position) or deleting (reduce its width to zero)them at will.
8. You can also create a brand new custom layout by choosing theSelect Columns option.
9. Once a new layout is defined, you can save it for future use (selectthe Save Layout menu option and give your new layout a specificname).
Figure 8 - The Chart Database Grid

28
10. Once you have defined a set of such custom Layouts, you can justapply them (click on the Load Layout option, then select the layoutyou want, and finally click OK).
Occasional “Database housekeeping chores” you need to do
Certain maintenance operations are necessary for a good functioning ofyour program. We recommend you do them monthly or as needed. Theyare all commands of the File menu:
Here’s a look at the Database screen followed by some brief description:
Certain maintenance operations are necessary for a good functioning ofyour program. We recommend you do them monthly or as needed.
Regularly Updating the database:
1. Copy/Backup Database…: this menu option creates a 2nd copy ofyour DB.
Warning: This procedure will erase Folder and Attribute settings. Use astandard backup procedure (making backup copies) rather than thisfeature if you’ve made Folder and Attribute notations.
2. Compact Database: this option saves disk space used by deletedcharts.
3. Repair Database: to be used if you have problems with your DBor to prevent them.
Backing up essential files on diskettes
Unfortunately, computerized data can be accidentally lost, and theonly sure way to securely work with a computer is to regularly saveyour data on diskette (or other secondary medium) in order to be ableto restore them in case of a catastrophe.
By default your chart data is saved in the Charts20 directory insideyour WStar20 folder. These are labeled Curchts.mdb and Curchtsb.mdb.If you have created your own databases you will want to be certain toback those up as well. We suggest that you use your Windows’ Searchutility to look for all files of the C:\Wstar20 folder (and sub-folders),that were created or modified after Win*Star’s installation or your lastbackup date. If you have questions about backing up your files do nothesitate to call our Technical Support staff for assistance.

29
Notes:
• Configuration files (User folder) and Chart Form Sets (*.set) andFolders (*.fld) can be saved “once for all” after every alteration tothe program’s configuration. However, other files (especiallyChart DB files) should preferably be saved on a weekly basis.Unfortunately, these files quickly become so huge that it becomesinconvenient to save them on diskette. You can still use Win-dows’ Backup utility, or another high-capacity mass storagemedium, such as a “Zip-Drive”, “Jazz-Drive” or similar. You canalso get services from companies who offer Back-up services viaInternet.

30
Astrological Techniques
Secondary Charts to a Primary One
What is a Secondary Chart, and why is it useful?
A “secondary” chart is a chart somehow derived from a base one(usually called a “Primary” chart) by some sort of calculation. Youmay want to use secondary charts either for a purely astrologicalreason (a solar return, progressed or composite chart is naturallyderived from its natal chart), or for a logical one (it is natural to view aclient’s marriage chart as derived from is or her natal one).
What characterizes a Secondary Chart (in Win*Star) is the way it issaved in your Chart Database: When a chart has one or more second-ary charts, it appears on the Chart List (see Figure 1, section 2) with a“+” sign in front of it and the secondary charts are hidden. If youdouble-click on this “+” sign, the secondary charts appear
(with an increased indent) and the sign changes into a “-”. Anotherdouble-click will hide them again.
The remaining part of this section will describe the various kinds ofderived charts you can create with Win*Star and how to do so.
Transit (or Event) Charts
A transit chart is not essentially different from another natal or eventchart. To illustrate the difference, let’s take an example: A client of yoursis a businessman and asks you to study his natal chart, together with hispartner’s and his company’s. These last two charts are of course indepen-dent charts, but they are somehow related to your client’s. So why notput them together? Creating them as derived from your client’s natalchart is like considering the partner’s birth and Company creation as“events” or important “transits” for your client.
To create a transit chart, do the following:
1. Enter or select the Natal Chart
2. Display the Progress toolbar by pressing F4, using the Techniquesmenu, the ProgressProgressProgressProgressProgress button of the Home toolbar (or use the arrowson top of the Techniques toolbar to access the Progress toolbar).
3. Click on the TransitTransitTransitTransitTransit button.
4. The Enter Chart Data dialog box appears, and you can create thischart the same way as a new natal chart.
Progressed, Directed and Lunation Charts
A Progressed (Directed) Chart is a chart that represents the progressed(directed) planet and cusp positions at a certain date-time and for acertain location. A Lunation chart is a new/full Moon or eclipse chart.
When we talk about a progressed planet, we usually think of a SecondaryProgression in which we equate 1 day = 1 year, although there are otherprogression techniques.

31
But when it comes to progressed angles and house cusps, there aremany popular techniques. The most common ones are: Secondary MC,Solar Arc MC and Naibod MC.
How to cast a Progressed Chart?
1. Select the Natal (or Radix) chart you want to progress
2. Show the Progress toolbar
3. Click on the ProgressProgressProgressProgressProgress button (the Input Chart Data dialog boxappears)
4. Choose a date, time and place for this chart (you can also give it aname, as you would for a Natal or Transit Chart), and select theprogression technique you want to use for the planets and angles.For a detailed description of these techniques, press F1, scrollthrough the contextual help window until you see the list of them,and click on each technique that may interest you; a small windowpops up, containing an explanation. Usually, the default values arefine to start with.
5. Click OKOKOKOKOK to finish and calculate the chart.
Notes: - To choose the current time or place, click on HereHereHereHereHere or NowNowNowNowNow.
- Once you have chosen your favorite progression technique, youcan save it as default by clicking on the Save DefaultSave DefaultSave DefaultSave DefaultSave Default button.
How to cast a Directed Chart?
Follow the same method, except at step 3, click on Direct.
Among popular Direction Techniques, you have Solar Arc and Degree/Year (1° = 1 year).
How to cast a Lunation Chart?
Follow the same method, except at step 3, click on Lunation. Also,the time you enter is the one Win*Star will start searching for theNext (or Last) Lunation.
In this case, you will have to choose the Lunation Type (New or FullMoon; Solar or Lunar Eclipse), and if you want to save it as a Primary orSecondary Chart. Indeed, unlike Progressed and Directed Charts whichare necessarily Secondary charts (always derived from a radix chart),Lunation Charts can be both; choose the most convenient.
Return Charts
A Solar, Lunar or planetary Return Chart is the chart of the momentwhen a planet returns exactly to its natal position. In order to cast such achart, one must first determine the exact time when this return happens,and second cast the chart for this very moment and a chosen place.That’s what Win*Star automatically does for you!
Note that Win*Star also casts more sophisticated types of returncharts. We’ll quickly go over them later.
How to cast a Return Chart
1. Select the Natal (or Radix) from which you want the Return Chart.

32
2. Show the Returns toolbar
3. Click on the ReturnsReturnsReturnsReturnsReturns button (the Input Chart Data dialog boxappears)
4. Choose a date close to the moment the return will happen (don’tbother finding the exact date; Win*Star will do it for you!), and aplace (usually, the person’s residence).
5. Choose the return planet you want. The default is Lunar Return,but you can change it (clicking on the little triangle on the right ofthe combo box pulls down a list. You can, as usual, scroll throughthe list and click on your choice). You’ll notice that Win*Starallows you to cast returns for asteroids, Uranian planets, etc…
6. In general, you will keep the default “Geocentric,” but you canalso choose Heliocentric, Equatorial (same as Right Ascension), ordo Precessed returns (where you take the precession of theequinoxes into consideration).
7. Click on NextNextNextNextNext to find the next occurrence or LastLastLastLastLast for the previousone. In the Date and Time fields, you can see the exact moment ofthe return, and you can repeat this step until you find the exactreturn you are looking for. Note that the time is displayedaccording to the time zone associated with the chosen place. Youcan change it, but the time zone doesn’t affect the calculation, onlythe displayed time.
8. You can now request the casting of the chosen return by clicking onMoreMoreMoreMoreMore or OKOKOKOKOK. With MoreMoreMoreMoreMore, you leave the dialog box open so thatyou can add more returns for the same chart (or another one).With OKOKOKOKOK, you close it and see your return (in fact the last one ifyou added several) displayed on screen.
Important note: The Save DefaultsSave DefaultsSave DefaultsSave DefaultsSave Defaults button can be used (for instance)to make sure that a Solar Return will be your default value (since they aremore common than Lunar ones).
Phase-Angle Returns
This return will search occurrences when the angle (phase) between twoplanets repeats itself. To cast such a return, use the same method, exceptat step 3, click PhasAng, and at step 5, choose the two planets you wantthe phase to repeat.
Incremental Returns
This return will search occurrences when a planet has traveled a given arcsince its last return. To cast such a return, use the same method, except atstep 3, click Increm, and at step 5, choose the planet and the arc youwant; you can choose 180°, 90°, 40° or Increment (to enter your own arc).
Point Returns
This return will search occurrences when a planet reaches a zodiacalpoint. It is used for Sign Ingresses, but can be used for planets transitinga fixed star, a planet’s node, aphelion or perihelion, or another point ofimportance. To cast such a return, use the same method, except at step 3,click Point, and at step 5, choose the planet and the longitude of the
33
point you want it to reach. For example, to find Pluto’s ingress intoCapricorn, you will enter the point 00°CP00’00’’ or 270.
User Angle Returns
It is similar to the Phase-Angle Return, except that you choose yourown angle, rather than getting the phase from the radix chart. Notethat the radix chart is not used here (the same holds for a Point Return).
Important note
For returns that depend heavily on the radix chart (i.e. most of them),you should make sure you actually have the right one (mistakes oftensneak in at that level, especially when you cast several returns in a row)!You can check it by looking into the Return Chart For: field. If it’s not theright one, you can change it without closing the dialog box. Click on thetriangle on the right of that field to open your Database Grid and choosethe right radix chart.
Prediction techniques – Transit, progression & other searches
In predictive astrology, you want to know what will happen on a certainday at a certain time for a given person (country, institution, etc.). But isthis a realistic demand from Win*Star?
Well, to be frank with you, Win*Star itself will not fully answer thatquestion for you. But, what it can do for you is generate a chronologicallist of astrological events called “Hits” (transiting or progressed planetsaspecting natal, progressed or transiting ones, planets entering a newsign or house, void of course Moons, etc.), and leave you with theresponsibility of finishing the interpretational touch.
Your local Matrix distributor or dealer can also suggest someWin*Writer programs if you want to provide your clients with adetailed interpretation of their transits, progressions, eclipses, etc. Youcan also request a catalog, or check out the Matrix web site atwww.astrologysoftware.com.
More precisely, the Search module is there to automatically search forcontacts (or “Hits”) between transiting, progressed or directed planets (orpoints) and natal, progressed and transiting ones, and create a “Hit List”that you can then view, rearrange, save and/or print as you’d like.
The Search process consists of three main steps:
Step 1: Define the search parameters you want Win*Star to follow,
Step 2: Launch the search,
Step 3: View, rearrange and/or print the search results.
Let’s see how to accomplish those tasks step by step:
Step 1: Define the search parameters you want Win*Star to follow
First, let Win*Star know the various search jobs you want completed.Then define your search parameters: the starting and ending dates,aspecting planets or points, target planets or points, and other optionsyou might want to add.

34
For that, do the following:
1. Display the Srch toolbar by clicking on the Search button of theHome toolbar, or pressing F8, or choosing the Searches option of theTechniques menu, or using the arrows on top of each toolbar (yousee, there are often many different ways of doing the same thing!).This toolbar contains 7 buttons that all (except the very last one,LastSrch) open the Searches dialog box, allowing you to define yoursearch parameters.
2. Click on one of these buttons (LastSrch is special: it just recalls thelast search results Win*Star did for you). The Searches dialog boxappears (Figure 9) and offers you a set of default jobs depending onwhich button you choose; you can accept or change them.
Note that you can change the default jobs assigned to these buttons(details below).

35
The following paragraphs explain how to select the appropriate jobs and their options in a search. Theyrefer to the diagram (item #3). The following table describes the various job tasks Win*Star offers andhow they can be practically used:
For each job type you enable, you can define the planets involved and other options. To do this, click onthe button of the Options column directly to the right of the search type you just selected. The SearchOptions dialog box shows up (very similar to the Chart Form Options one, Figure 6), where you can define (atleast) four important parameters:
- Active (or transiting) planets or points (Search Planets)- Passive (or transited) planets or points (Target Planets)- Aspects to look for (choose an Aspect Set)- Events can be added to the search list, by checking the corresponding box (see table on the followingpage).
Job Type Description Practical Applications
Transit-Natal
Transit-Transit
Transit-Progress
Progress-Natal
Progress-Progress
Arc-Natal
Transiting planets apsecting natal(or radix) ones
Transiting planets apsectingthemselves
Transiting planets apsectingprogressed ones
Progressed planets aspectingnatal ones
Progressed planets aspectingthemselves
Directed planets apsectingnatal ones
Chronological list of transits, natal houseingress, etc.
New or full Moons, planets’ sign ingress,retrogradation cycles, etc.
Will search for exact moments whentransiting planets aspect progressed ones
Cycles of progressed planets relative to thenatal chart, sign & house ingress, stations
Progressed new and full Moons,progressed planet cycles
Solar arc or symbolic(1 degree = 1 year) directions

36
A few interesting Searches Options:• Save Defaults allows you to save your search parameters as
default values attached to the chosen button (Transit, Progress,Direct, etc…). You can thus configure any Search toolbar button(except the last one) so that they represent a job you commonlyuse.
• Save Job allows you to save your search parameters in a file. Youjust need to give it a name (8 characters or less), and you’ll beable to retrieve them by clicking on the Get JobGet JobGet JobGet JobGet Job button andchoosing this predefined job. You will normally use this option tosave jobs you occasionally use. Save as many jobs as you wish.
• The Coordinate Systems pull-down can be used to choose adifferent coordinate system than Geocentric. For instance, rightascension transits or progressions (Right Ascen.) are often usedfor rectifying a natal chart. Geo. Precessed can be used if youwant to take into consideration the precession of the equinoxes.
Step 2-3: Viewing or printing Search results
As soon as you click OKOKOKOKOK to close the Searches dialog box, Win*Starexecutes the requested search. After a few seconds (a few minutes if yourequested a long search and/or you have a slow computer), the resultswill display in a table format (like a database) with rows and columns.Figure 10 represents the upper part of what your screen should look like:
epyttnevE seodtitahW
ylnOstnevE.stcepsayratenalpTON,dehcraeseblliw)snoitposadenifed(stnevEylnO
.stcepsaongnivlovnihcraescificepsaroftneinevnoC
evaeL/retnEotgnidrocca,evitcaebotspotsrostratstcepsananehwstnemomsedulcnI
.testcepsAnesohcehtfosbroevaeL&retnE)tluafedrodeniferp(
slellaraP snoitanilceDfoslellaraPsedulcnI
).taL(slellaraP .snoitanilceDfoslellaraPsedulcnI
ssergnIngiS ngisa)gnidargorter,evaelro(retnestenalpnehwstnemomsedulcnI
snoitatS stenalpfosnoitats)edargorterrotcerid(sedulcnI
ssergnIesuoH esuohlatana)gnidargorter,evaelro(retnestenalpnehwstnemomsedulcnI
esruoCfodioV gnidnerognitratsedulcnI V sdoirepnooMesruoCfodio

37
Each row corresponds to a “hit,” and each column to informationabout this hit (date, time, aspect, etc…). You can now view or printthis table as it is, or adjust it in many ways according to your needs,without loosing any information. Following is a list of the essentialmanipulations you can do to it:
• Change column widths: place the mouse cursor on theboundary between two columns and drag the mouse sideways(note: dragging means moving the mouse while keeping theleft-mouse button pressed).
• Delete a column: reduce its width to zero, and it will disap-pear.
• Move a column: drag the column’s title (on the very 1st row ofthe column) sideways to its desired destination.
• Adjust the Date/Time format: the Date Format and TimeFormat options of the View menu allow you to display dates andtimes the way you want. Helpful to display seconds.
• Print the Hit List: click the PrintPrintPrintPrintPrint button. Note: You canchange the Printer Setup options (using Landscape or a differentpaper size) by clicking on the Printer Setup option of the FileMenu before you request the search. (After that, you can stillminimize Win*Star’s windows and use Window’s ConfigurationPanel.
• Scroll through the List: use the vertical scrollbar. You canalso scroll through time by clicking on >Dy>Dy>Dy>Dy>Dy (next day), <Dy<Dy<Dy<Dy<Dy(previous day), >Mn>Mn>Mn>Mn>Mn or <Mn<Mn<Mn<Mn<Mn (next or previous month).
• Cast the event’s chart: select the event (by clicking anywhereon its row) and click on QWhlQWhlQWhlQWhlQWhl (instant wheel on screen) or onChart (new chart that will be added to your database). Chartsare calculated for your default place (defined at configuration).

38
You can change it (together with the time zone) by clickingon the Time ZoneTime ZoneTime ZoneTime ZoneTime Zone button of the upper toolbar, or bychoosing the Set Time Zone option of the View menu (you canuse the Atlas to get the coordinates of your chosen location).
• View interpretation: by clicking on the InterpInterpInterpInterpInterp button, youopen a window with a short interpretation text of theselected hit. If you select another hit, the text changes. Youcan close the window by clicking on the same button, orresize it using the vertical arrow buttons on the top-right ofthe screen.
• Filter Hits: even if your hit list is very long, you can filter itto view only relevant parts of it at the same time. Using thisoption allows you to request a complete search once and forall, eventually save it to disk, and then filter relevant infor-mation out of it whenever you want it for any specificpurpose. For that, the simplest is to use the appropriatebutton. For instance, the button will select the Luna-tion aspects (and only those). You can also use the Filtersmenu. Explore its various options!
• Save a Search List for future use: click on the Save Search Asoption of the File menu and type a significant name toidentify your search; then click OKOKOKOKOK. To retrieve it later, theeasiest is to click on the LastSrchLastSrchLastSrchLastSrchLastSrch button; the last Searchyou requested will reappear. If it’s not the right one, justclick on the Load Search option of the File menu and selectthe search you want to display; then click OKOKOKOKOK. That’s it!
• Merge a new search to an existing one: this technique isoften used to refine a search so that it contains everythingyou want and nothing else. Let’s take a practical examplewhere you want annual transits from slow planets, new andfull Moons, Stations for all planets and finally, repetitiontransits of Mars (i.e. transiting aspects to natal planets thathave natal aspects to Mars . We assume that natal Mars isVenus-Square-Pluto). To achieve that, we must split the jobinto two searches and merge them together. For the 1st job,we’ll choose a Transit-Natal search of slow planets, com-bined with a Transit-Transit with Moon and Sun as planets,and Cnj and Opp as Aspect Set; now run it. Then (when theresults are displayed), we’ll click on the MergeMergeMergeMergeMerge button to addthe 2nd search to it. Here, we’ll select Transit-Natal fromMars to Venus, Mars & Pluto, combined with Transit-Transitof Mercury, Venus & Mars, with the options Events Only andStations. Once you click OKOKOKOKOK after this 2nd Search request, theresults of this 2nd search are automatically added to the 1st
list. This now gives a unique chronological hit list contain-ing the results of both searches.
Note: this technique allows you to combine Hits to several different charts,such as a natal chart and a Solar
• Adjust the Search Layout: besides changing the columnwidth and position, date & time formats, you can alsoconstruct a layout of your own (or several, one for eachSearch type) and save it on disk for future use. For that, it’sjust 4 easy steps:

39
1. Choose the layout (i.e. the option of the Layout menu) closestto what you wish;
2. Modify (if necessary) the column widths and positions as indicated earlier;
3. Save your Layout by choosing the Save Layout option of theLayout menu;
4. To retrieve it for another search list, run the search, then click onthe Load LayoutLoad LayoutLoad LayoutLoad LayoutLoad Layout option of the Layout menu. You then just haveto choose the desired Layout from the list of predefined layouts andclick OKOKOKOKOK.
Note that every chosen Layout remains active until you change it.
Here is a list of useful predefined Layouts:
Layout Name Practical Use
House Positions To view house positions and other related items
Multiple Search If you merged searches from different charts
Enter - Exact - Leave If you included Enter-Leave option
Eclipses To display if a lunation is new, full moon or an eclipse

40
Synastry Techniques“Synastry” means comparing several charts. Synastry is often used toevaluate a love or friendship relationship, but it can also be used tocompare a natal chart with a solar return, or with a country’s, aninstitution’s or a business partner’s chart to see if the person will behappy living or working there.
Three basic techniques are commonly used to compare several charts:• Multiple (Bi- Tri- & Quad-) Wheels• Synastry Grids• Composite Charts (of 2 charts or more)
For any of these techniques, Win*Star can save you time and efforts byautomating the process.
a) Constructing a multiple wheel
This technique allows you to compare several (2 to 4) charts by plottingthem as concentric circles of the same multiple wheel.
For example, you may want to group the two natal charts of a couple,together with their composite chart (see below) and the chart of theirmarriage or first encounter. You may also choose a natal chart, togetherwith a solar return, progressed and directed charts for a yearly predictionjob.
To construct a multiple wheel, you proceed in four steps:
Step 1: Cast the charts to be compared and select the 1st (center) one.
Step 2: Click on the Add Bi-Add Bi-Add Bi-Add Bi-Add Bi-TriwheelsTriwheelsTriwheelsTriwheelsTriwheels button (the last one right under thechart data window). The chart data window is changed into four smallwindows labeled Chart 1:, Chart 2:, etc… Each one can only contain thename of one chart; the 1st one already contains the selected chart name.The Biwhl toolbar also appears.
Step 3: Click on a number (1-4) on the very left of the window to indicate thenumber of charts you want to compare. Then select the other charts byclicking on Chart 2Chart 2Chart 2Chart 2Chart 2: (this label becomes red), and then on the name ofthe chart (in your chart list window). Do the same for the other charts toinclude onto your multiple wheel.
Step 4: Click on one of the buttons of the Biwhl toolbar. SynGridSynGridSynGridSynGridSynGrid will create asynastry grid (see next section), BiwheelBiwheelBiwheelBiwheelBiwheel a double wheel (whereas Two orTwo360° will draw two small wheels side by side on the same page),TriwheelTriwheelTriwheelTriwheelTriwheel and TriRingTriRingTriRingTriRingTriRing a triple wheel, and QuadwhlQuadwhlQuadwhlQuadwhlQuadwhl a quadruplewheel.
After this last click, the multiple wheel is displayed and added to theChart Forms list of chart 1. An alternative method is to manually add amultiple wheel Chart Form at step 4 above.
b) Plotting a Synastry Grid
A Synastry Grid is a two-dimensional table representing inter-aspects

41
between planets of two given charts, with orbs, declination parallelsand anti-parallels. It also contains planets’ house positions in their ownchart as well as in the others’.
To plot such a grid, you can follow the above instructions, and click onthe SynGrid button at Step 4. You can also use a method similar to theone explained in the next section.
c) Creating a Composite or Relationship Chart
A Composite Chart is a unique chart (generally) representing a couple or agroup of people (like business partners). This technique is often used toevaluate a love or friendship relationship. The principle can also beapplied for a business partnership. If more than two partners are in-volved, you will use a Group Composite Chart. (Note: composite chartsare stored in the database). Also, combining a politician’s chart with theone of his country can be useful in mundane astrology. Or, a combinationof a client’s chart with the one of the country or city where he or shewants to go to can be a good complement to the relocalization tech-niques explained in the next section.
There are several methods for combining two charts, the most commonones are based on the Midpoint principle.
To cast such a chart, you will proceed in a similar way to creating amultiple chart (explained above), except for the following differences:
Step 1: As above;
Step 2: Choose the Syns toolbar by pressing F6F6F6F6F6, using the Techniques menu orotherwise;
Step 3: As above;
Step 4: Click on the Compos2Compos2Compos2Compos2Compos2 button for a composite chart (using midpoints),on the GroupGroupGroupGroupGroup button for a composite of more than two charts, oranother one for a different type of relationship chart (use the online helpto get detailed explanations of these various techniques).
In the case of a Group Composite, a dialog box will appear to allow youto add or delete charts to your group, and to choose the place to be usedfor the calculation. You can also choose the natal chart this composite isto be stored under.
The chart is then calculated and displayed using the default Chart Formselected for this kind of job (at Configuration), and stored as a secondarychart of the first chosen one (Chart 1). It is therefore important toappropriately choose the radical chart under which this composite will besaved!

42
Locational Astrology - Maps TechniquesWith the Win*Star Maps module you can investigate a horoscope usingtwo popular mapping techniques: Local space and Mundane Maps.Choose from 19 maps covering major world areas as well as mapscovering smaller areas such as individual countries and states. Themapping technique consists of plotting on a geographical map (of theworld, or part of it) the lines where planets are particularly active at agiven moment. Usually, we look for angularity lines (places whereplanets are rising, culminating, etc.), but Win*Star allows the user toplot many more such lines, such as Local Space lines or eclipse paths (inparticular the prenatal eclipse), and a wide variety of Sky Maps, withfixed stars, constellations, galaxies, and more…
The screen includes the active charts list, so you can easily switch fromyour important charts, viewing their effect in various locations. Click theMundane Maps button and two sets of lines based upon the planetsrising/setting paths and projected midheavens will display on the map,based upon your birth. Click the Local Space button and planet-pathlines will generate from your birth place, radiating in their directionsunique to your birth.
Mundane Maps
This method is based upon the idea that when one changes location,event though the planets in the chart remain in the same degree andminute, the house cusps, including the horizon and meridian, changeposition. In a new location there is a new ascendant and midheaven andin specific places these may coincide with a planet, marking a particularlymeaningful location. Two selector buttons are offered in the MundaneMap mode: “Meridian Lines” and “Rising Lines.”
Meridian Lines - These show the points on the map where each planetwas directly on the Midheaven at the time of your birth. These points areshown as meridian lines creating a circle passing through both poles andare calculated from right ascension only, i.e. the north/south meridians’intersections with the equator. The Mundane Maps view shows twomeridian lines (since the Earth is a flattened projection) for each planet.In Win*Star, these are seen as the vertical lines marked with planetglyphs.
Rising/Set - The curved lines (they are easier to notice when viewingthe World map) mark the spots where the planet was rising (or setting)at the moment of your birth. Although you cannot change your birth-place, you can alter the house position of any planet by moving toward oraway from these rise/set lines. Thus, although the Moon may have beenon your Ascendant from birth, moving East or West would have theeffect of taking it off the Ascendant.
With the Measure button you can use the mouse to drag from point topoint anywhere on the displayed map to obtain a mileage readout for thearea spanned. Longitude and latitude for the areas in question are alsoincluded in the display.

43
Mundane Maps is activated by first selecting the Extra toolbar(Shift+F2) and clicking on the Maps button. By default, a world mapappears with Rising and Meridian lines for the current chart. Figure 12(next page) shows an example (with the prenatal Eclipse Path added).
Full vertical lines represent places where a planet is on the midheaven,whereas dashed ones represent planets on the nadir. These lines are called“Meridian Lines.” Curved lines, called “Rising Lines” represent placeswhere a planet is rising (q1) or setting (q2). When based upon one’snatal chart, these lines remain relevant throughout the lifetime.
In order to carefully analyze your Astro-Map, you can select twobasic geographical maps: a more global one (A) and a local one (B).You can then easily go back and forth between these maps byclicking on the AAAAA or BBBBB buttons. Change any of these maps using thepull-down list below the A & B buttons. You can also zoom into adetailed region by clicking on it.
The Map menu contains options to draw Sky Maps (rather than EarthMaps), add major cities or plot Space Lines & Spheres (ecliptic, equator,etc.), Eclipse Paths, and more... Finally, the Stars and Deepspace menusallow to add celestial bodies or entities to maps; and the Options menulets you (among other options) to change colors
Using Mundane Maps - One way to use this technique is when, forexample, you are going on summer vacation and want to know where togo. Create a solar chart for your current residence and then pop that upwith Mundane Maps. Check out these mundane map lines for planetemphasis in various possible locations. The same View pull-downfeatures provide a means of accurately pinpointing locations on themap and the Chart button places your relocated chart on screen.
Local Space
This technique, views the chart as a map of the 360 degrees of thehorizon surrounding an event such as birth, with the positions of thevarious planets plotted on it. It describes the horizon of a place, much asturning around on one spot we might look toward the East, South, West,and North. The planets are projected onto the horizon using the coordi-nates, azimuth and altitude (instead of the longitude and ecliptic lati-tude) of the zodiac.
Local space is mainly used to show a direction that would be empowering(according to specific planetary meaning) to the individual. Distance of achange is not as relevant as the directional change as regards the orienta-tion of the planets. Astrologers might use the technique to see wherethey could prefer to live; for example, they may wish to go to an areawith a more pronounced Mars activity level, according to their birthchart. Alternatively, the concept can be applied to changes in yourimmediate vicinity, such as where to plant a garden when using yourhome as the reference point. [Local Space was pioneered in the 1970s byMichael Erlewine, Founder of Matrix Software. For an interesting book describ-ing the Local Space concept, see Steve Cozzi’s Planets in Locality, published byLlewellyn Publ., St. Paul, MN.]
Using the Local Space feature - When you first open the Maps

44
module and click the Local Space button, the planet-path lines showingwill be generated from the birthplace of the highlighted active chart.To experiment with other locations, simply click the LS_Lines buttonand then click anywhere else on the map. A new set of planet-pathlines will generate from that location. To accurately choose alternatelocations, highlight Longitude & Latitude from the View pull-down menu.This pops up a small movable readout box that displays the longitudeand latitude of the cursor arrow as you move it across the screen. Clickthe Chart button and then click any point on the map. A sizableQWheel chart will pop up for the selected location. As you click otherlocations of the map, this chart will immediately recalculate, presenting achart wheel for that location. This way, you can “tour” any area of theworld and view your chart as cast from that location!
Another View pull-down feature adds the Ascendant and Midheavenpositions to the on-screen readout, linked to the mouse arrow. Roll themouse across the map to instantly see how the locational change affectsthese important points.
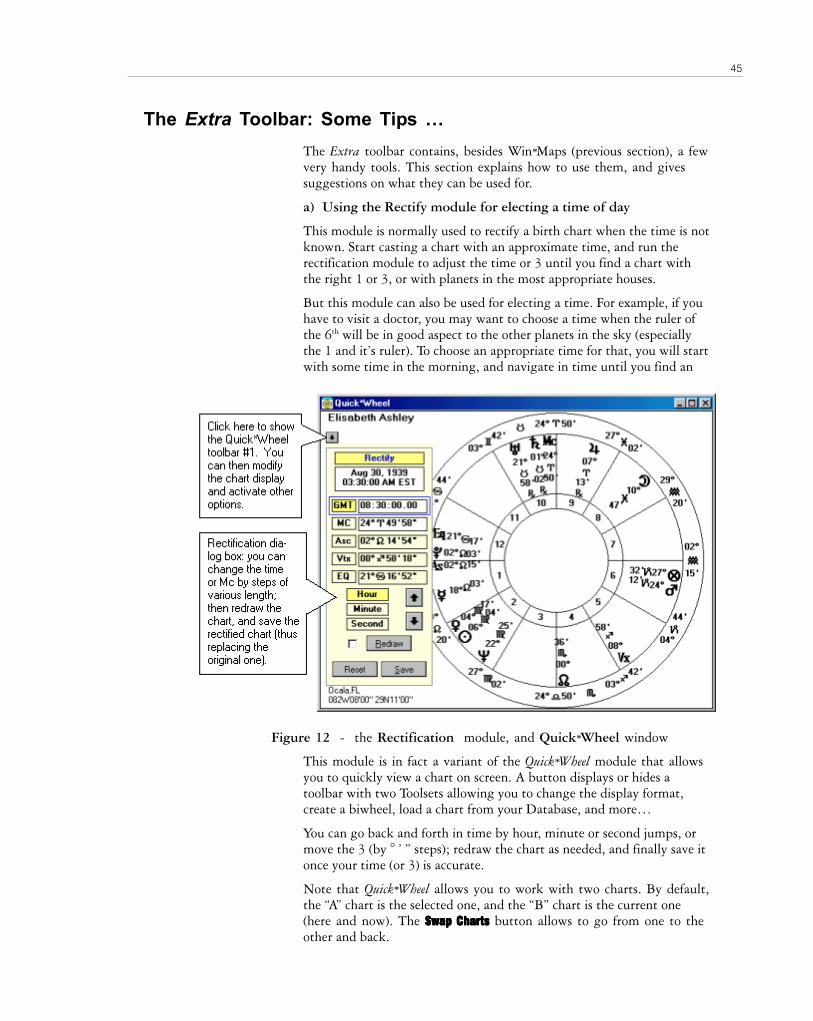
45
The Extra Toolbar: Some Tips …The Extra toolbar contains, besides Win*Maps (previous section), a fewvery handy tools. This section explains how to use them, and givessuggestions on what they can be used for.
a) Using the Rectify module for electing a time of day
This module is normally used to rectify a birth chart when the time is notknown. Start casting a chart with an approximate time, and run therectification module to adjust the time or 3 until you find a chart withthe right 1 or 3, or with planets in the most appropriate houses.
But this module can also be used for electing a time. For example, if youhave to visit a doctor, you may want to choose a time when the ruler ofthe 6th will be in good aspect to the other planets in the sky (especiallythe 1 and it’s ruler). To choose an appropriate time for that, you will startwith some time in the morning, and navigate in time until you find an
Figure 12 - the Rectification module, and Quick*Wheel window
This module is in fact a variant of the Quick*Wheel module that allowsyou to quickly view a chart on screen. A button displays or hides atoolbar with two Toolsets allowing you to change the display format,create a biwheel, load a chart from your Database, and more…
You can go back and forth in time by hour, minute or second jumps, ormove the 3 (by ° ’ ” steps); redraw the chart as needed, and finally save itonce your time (or 3) is accurate.
Note that Quick*Wheel allows you to work with two charts. By default,the “A” chart is the selected one, and the “B” chart is the current one(here and now). The Swap ChartsSwap ChartsSwap ChartsSwap ChartsSwap Charts button allows to go from one to theother and back.

46
b) Using the Astro*Clock for Horary Astrology consultations
This module (triggered by clicking the AClockAClockAClockAClockAClock button of the Extratoolbar ) is also a variant of Quick*Wheel. It displays a chart of the presentmoment (for the default place) and keeps it up to date by recalculating itregularly (by default every ten seconds, but you can change this). Thisvery handy tool can astrologically follow any event you see live (like asports game or a political debate on TV).
It is also handy to answer questions using Horary Astrology. As the clientasks the question, you just have to read the chart on screen. Note thatyou can always save the chart (you will be prompted to choose to save itas a primary chart or a secondary chart of some natal chart you select),and print it out using one of the Horary Chart Forms. These formscontain data most commonly used for Horary Astrology: dignities, lunaraspects and other techniques suggested by William Lilly.
c) Plan your day (weekend) using Day*Scan
Clicking on the DayScan button of the Extra Techniques Toolbar displaysa graphic representation of planetary positions within a three-dayperiod, like on figure 13 below:
Figure 13 - Matrix Day*Scan window
If you click the Time LineTime LineTime LineTime LineTime Line button, a red vertical line appears, indicatingexact times of displayed aspects or events (you can drag it sideways). Ahorizontal scrollbar (not represented in the figure) allows you to scanthough time within this 3-day period.
You can add other data using the Extra menu. To get detailed help aboutthese options, use the online help by pressing F1F1F1F1F1 or clicking on theContents option of the Help menu.

47
d) Time*Scan: Display a graphic overview of your transits andprogressions search
Every time you request a search (transit, progressions or directions) asexplained in section 9, Win*Star saves the results of this last search.You can always retrieve them (clicking on the Last button of the Srchtoolbar); but you can also view them graphically.
This can be done by clicking on the TimeScan button of the Extratoolbar. But keep in mind that you need to make a search before usingthis graphic-displaying module!
Figure 14 below show an example (only the upper part is shown):
Figure 14 - Matrix Time*Scan window
Here again, a Time Line can help to precisely time the various dis-played events.
You can also scroll vertically through the various jobs that wereincluded in the search, and horizontally to scan through time (withinthe previously defined search period). Note that the above figure isonly partial; only part of the vertical scrollbar actually show.
Other options are available (using the Options menu); use the onlinehelp to get detailed information on how to use them.

48
Time Tables Ephemeris GeneratorTime Tables is the ephemeris generator of your dreams! It can generateephemerides in almost any combination you can think of. You can choosefrom the many built-in ephemerides or create your own using anycombination of planets, houses, asteroids, Chiron, Uranian planets, et al.
Here’s a feature list:
- Choose the coordinate systems that you want: geocentric longitude,latitude and motion, right ascension, declination, distance value, azi-muth, altitude, heliocentric longitude, latitude and motion.
- Pick any time frame that interests you: a week, a month, a hundredyears and any interval you want, every 4 minutes, every 2 hours, everyten days.
- Set up an ephemeris for any location and watch the changing housecusps (in any one of 14 available house systems) or moving Part ofFortune.
- Naturally, you can create any set of aspects you want or use those builtinto Win*Star.
- Scroll down an ephemeris page while watching a chart wheel show themoving planets at the same time!
- Calculate planetary positions to a precision of one second of arc anddisplay them as such or to the nearest degree or minute of arc.
- View the results in three different font sizes and, of course, output toyour printer for a paper copy.
How to use TimeTables:
To Create a Predefined Ephemeris
1. Access the Time Tables module from the Plus pull-down/TimeTables.
2. Highlight one of the 9 predefined ephemerides listed on the TimeTables front tab, “Ephemeris Definitions.”
3. Click SelectSelectSelectSelectSelect.
4. Select the appropriate starting and ending dates and times for yourephemeris.
5. Use the other tabs (Options, Columns, Zone/Place & Aspects) tomake additional changes.
6. Click OKOKOKOKOK.
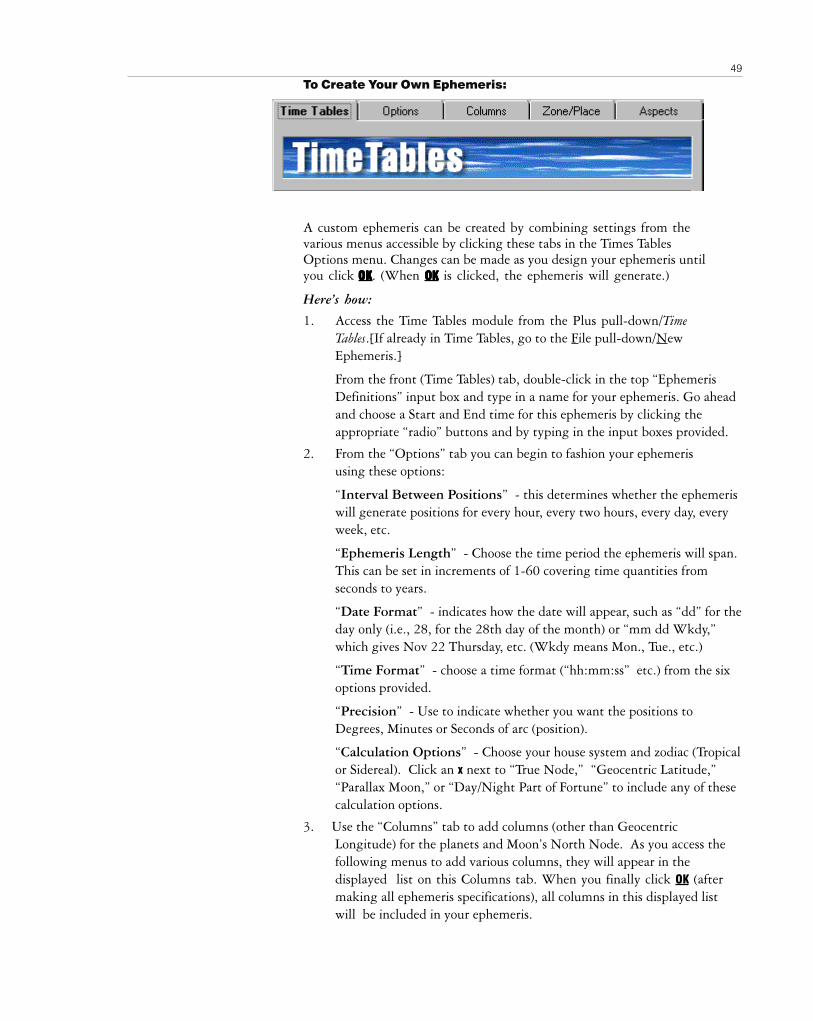
49
To Create Your Own Ephemeris:
A custom ephemeris can be created by combining settings from thevarious menus accessible by clicking these tabs in the Times TablesOptions menu. Changes can be made as you design your ephemeris untilyou click OKOKOKOKOK. (When OKOKOKOKOK is clicked, the ephemeris will generate.)
Here’s how:
1. Access the Time Tables module from the Plus pull-down/TimeTables.[If already in Time Tables, go to the File pull-down/NewEphemeris.]
From the front (Time Tables) tab, double-click in the top “EphemerisDefinitions” input box and type in a name for your ephemeris. Go aheadand choose a Start and End time for this ephemeris by clicking theappropriate “radio” buttons and by typing in the input boxes provided.
2. From the “Options” tab you can begin to fashion your ephemerisusing these options:
“Interval Between Positions” - this determines whether the ephemeriswill generate positions for every hour, every two hours, every day, everyweek, etc.
“Ephemeris Length” - Choose the time period the ephemeris will span.This can be set in increments of 1-60 covering time quantities fromseconds to years.
“Date Format” - indicates how the date will appear, such as “dd” for theday only (i.e., 28, for the 28th day of the month) or “mm dd Wkdy,”which gives Nov 22 Thursday, etc. (Wkdy means Mon., Tue., etc.)
“Time Format” - choose a time format (“hh:mm:ss” etc.) from the sixoptions provided.
“Precision” - Use to indicate whether you want the positions toDegrees, Minutes or Seconds of arc (position).
“Calculation Options” - Choose your house system and zodiac (Tropicalor Sidereal). Click an x next to “True Node,” “Geocentric Latitude,”“Parallax Moon,” or “Day/Night Part of Fortune” to include any of thesecalculation options.
3. Use the “Columns” tab to add columns (other than GeocentricLongitude) for the planets and Moon’s North Node. As you access thefollowing menus to add various columns, they will appear in thedisplayed list on this Columns tab. When you finally click OK (aftermaking all ephemeris specifications), all columns in this displayed listwill be included in your ephemeris.

50
Click Add PlanetsAdd PlanetsAdd PlanetsAdd PlanetsAdd Planets to reveal a menu which has:
“Planets Included” - here you can add planets and points to theephemeris being defined. The tall vertical bars at the left of the groups isprovided for easy group selection.
“Coordinate Columns:” - for adding other coordinates such asDeclination, Helio Longitude and so forth under the “CoordinateColumns:” heading.
“Special Columns:” - here you’ll find Transit and Natal house positionsand Transit information. (The Natal positions are from the highlightedactive chart); the aspect information is determined by settings made inthe menu presented by clicking the Aspect tab.)
Click Add MidpointsAdd MidpointsAdd MidpointsAdd MidpointsAdd Midpoints to reveal a menu for defining midpoints:
“Planet/Point Lists” - from the two scrollable lists (at the left) you cancreate midpoint pairs. As you choose them, click Add and they’ll appearin the “Selected Midpoints” area. Use the shortcut Range button to selectthe possible midpoint combinations occurring between the selected pair.The menu provides for saving and loading midpoint lists as files,preventing the need to reinvent them.
Click Add Planetary PicturesAdd Planetary PicturesAdd Planetary PicturesAdd Planetary PicturesAdd Planetary Pictures for a menu designed to create PlanetaryPictures for inclusion in the ephemeris. Here there are three scrollablePlanet/Point lists from which you can create Planetary Picturecombinations. Again, these can be loaded and saved as files.
The Add Misc. options allows you to add house cusps, the Moon’s phasesand other data, including a Notes column – all of which will appear inthe calculated ephemeris.
4. Use the “Zone/Place” tab to choose the time zone and location forthe ephemeris.
5. The “Aspects” tab lets you choose the Aspect Set, the AspectedNatal Chart, Aspect Searches, and the Aspecting and AspectedPlanets.
Note: “Aspecting Planets” are those moving in the selected time period (they’re called the“Search Planets” in the Search Options menu) and the “Aspected Planets” are the planets(and points) to which the Aspecting Planets are referring (the “Target Planets” in theSearch Options menu).
6. When all selections are made, click OK and the ephemeris willcalculate and display.
Now you are ready to learn how to use the ephemeris.

51
How to use this Ephemeris.
Your ephemeris will calculate and appear on screen looking somethinglike this:
Here are some of the things you can do:
View Aspect hits:
View allows you to change the font size on screen (but not the printerfonts) and the precision of the data. Use the vertical scrollbar or the twobig arrow buttons (on the right) to change your view of this area. Mostimportant, though, is that View allows you to see aspect data. The ShowAspect Data feature opens a yellow area on the ephemeris, where allaspect hits display. This gives you a chance to see aspects even if you havenot chosen columns in which to show them. The aspects shown are forwhichever date is highlighted in the ephemeris. To see aspects foranother date, simply click your mouse on that date or use the arrow keysto move up and down the ephemeris page. (Aspects from transitingmidpoints will not be displayed in the yellow box – they can only be seenby creating columns in the ephemeris itself.)
Interpretive Text:
Time Tables includes interpretations for Transiting conjunctions, sextiles,squares, trines and oppositions. To read these, click the Interp buttonon the upper right of your screen. Then click directly on the aspect listedin the yellow box (Transit-to-Transit or Transit-to-Natal) and an interpre-tation box will pop up. By default, the interpretation box will open “SunConjunct Moon,” but will quickly shift to the aspect you have chosen.You can print the ephemeris file by selecting the File pull-down menuand then choosing Print Ephemeris. You can also save the output to a fileby choosing Save Ephemeris from the File pull-down menu.
QuickWheel, too!
The Wheel button will bring up Win*Star’s Quick*Wheel. (Note: IfQuick*Wheel is already open you’ll need to close it for use with TimeTables.) As you use the arrow keys or mouse to select different dates in

52
the ephemeris, the Quick*Wheel will show the planets moving as well.It’s great to reduce the size of the Quick*Wheel so you can see it andthe ephemeris page at the same time. Move up and down the pagewith the arrow keys and watch the planets move in the wheel. This isa very useful way to visualize the motion of the planets over a givenperiod of time.
Move Columns:
You can change the order of columns by clicking on the header (placewith the planet’s name and coordinate system) then dragging anddropping it. You can change the size of a column by putting your cursoron the edge of the header until a double-headed arrow appears. You canthen drag and enlarge or shrink the column by left-clicking, holding themouse button and dragging it right or left. If you create a new Layoutyou can save it for future use by opening Layouts and selecting “Save as aNew Layout.”
Printing an Aspectarian
You can view aspects, both transit-natal and transit-transit (if you haveincluded them in your ephemeris selections), but they will not appear inthe ephemeris printout. To include aspects in a printout (called anAspectarian):
1. Select File/New Ephemeris and click the “Columns” tab.
2. Select Add Planets
3. Go to “Special Columns”
4. Select Aspects: Tran-Tran Geo (or Helio) and/or Tran-Natal Geo (orHelio) and click OK.
5. When your ephemeris is generated, go to File/Print Aspectarianand click on your choice of calculated aspects.
Note: These aspectarians work very well with a one-month ephemeris. You can have awhole month of transits (to transit or natal), that usually fit on one sheet of paper.
Now, here’s a closer look at the ephemeris pull-down menus:
File Pull-down
New Ephemeris - This opens the five-tabbed Time Tables Optionsmenu, provided so you can create or alter an ephemeris to suit yourneeds.
Load Ephemeris - Accesses a standard File-Open dialog where you canopen any previously saved ephemeris file. These files are saved as .mdbfiles and the default path is: \WSTAR20\tmtbl\filename.mdb
Save Ephemeris - Accesses a standard File-Save dialog for savingcalculated ephemerides to a chosen sub-directory. These files are saved as.mdb files and the default path is: \WSTAR20\tmtbl\ filename.mdb
These saved files can be loaded at any time via this menus Load Ephem-eris option.
Compact Ephemeris Database - This feature is provided to savehard-disk space. It can be useful if you have created and used anephemeris for a period of time during which you may have added or

53
deleted various charts from the database, actions which can take updisk space because databases necessarily retain portions of deletedcharts, etc. This feature will “clean up” the ephemeris file, economiz-ing disk space.
Repair Ephemeris Databases - A database can corrupt in variousways, resulting in obvious errors, miscalculated data, etc. The RepairEphemeris feature can correct minor problems and should be accessedbefore attempting to recreate the database. It is not likely that thisfeature will be needed, as the Time Tables database is extremely stable.
Print Ephemeris - This file-print option prints the current ephemeris.
Print Aspectarian - This File-Print option prints the calculatedaspectarian created with the current ephemeris.
Printer Setup... - This accesses a standard printer setup dialog forpossibly changing the designated printer and making standard printersetup adjustments.
Edit Pull-down
Use the Edit pull-down options to edit the current ephemeris. The firstfour features (Add planet..., Add midpoint..., Add Planet Picture…, andAdd Misc. … ) access the same menus previously described for theColumns tab. With them, you can continue to alter the ephemeris “onthe fly.”
Add natal chart... - This one presents the “Add Natal Chart”window. Click the Add button to open the WSTAR20 charts database.Select a chart, click OK, and the chart will be added to the list ofselected charts. Click OK again and the new ephemeris will be calcu-lated.
Delete Natal chart - With a natal chart (from the ephemeris)selected, this option will pop up a “Yes/No” prompt inquiring if youwish to delete the selected chart. A “Yes” response will immediatelydelete that chart.
Delete Column - Click in any of the hit fields in the ephemeriscolumns. That position will turn blue. Now click this Delete Columnoption, to delete that column.
View Pull-down
These options effect the way the ephemeris displays:
Show aspect data - This is how you expand the upper portion of theephemeris, revealing any aspect “hits” that have been calculated. Theyellow portion in the demographic is this aspect area. The aspect hitsare shown in blue, grouped in Transit-to-Transit and Transit-to-Natalhits.
Precision - Precision choices are Degree, Minute, and Second.
Date format - Choose from the extensive array of date formatoptions. Just mouse-click the format of your choice and it will beapplied in the ephemeris Date column.
Time format - Choose from the extensive array of time format

54
options. Just mouse-click the format of your choice and it will beapplied in the ephemeris Time column.
Font size - Choose from 8.25-point, 10-point, and 12-point fontssizes for displaying the data in the ephemeris.
Redraw - A standard redraw feature is included which can be used toredraw the screen presentation. (Sometimes the monitor can break up orbecome disturbed and this feature refreshes the screen, creating a newimage version.)
Layouts Pull-Down
Save Current Layout - This pops up a File/Save dialog, with which youcan save the existing layout with all settings currently selected. Just typein a Layout name and click OKOKOKOKOK.
Save As New Layout - This creates an entirely new layout with anew name.
Original - This presents the layout shipped with the program.
Last Layout - This presents the layout last calculated
55
Win*Search Database Tool
The Win*Search program provides the ability to search and examinethe records (charts) in the Win*Star chart database files. With it youcan create database files and copy charts between files. Extensiveastrological search parameters can be set and applied to any sizedatabase file, making research simple and swift. Charts can be dis-played in both graphs and chart wheels.
Win*Search Start-up
Start Win*Search from the Plus pull-down menu at the top of the mainWin*Star screen. You can also run the Win*Search program withoutusing Win*Star by going to the program group and clicking the iconfor Win*Search.
How do I make a database to use with Win*Search?
Databases are made in Win*Search from the Chart Database Filepull-down.
Here’s how:
1. From the Chart Database File Pull-down, select New Database.
2. Type in a new database file name in the wstar20\charts20\subdirectory and click OKOKOKOKOK.
3. Now open another database file [File pull-down/Open Database]to use as a chart source. Use the Charts pull-down/Select CurrentChart feature to select files from this database to be added toyour new database.
4. Now use the File pull-down/Copy/Backup Database... feature tocopy the selected charts to your new database. You don’t have tocreate the database in advance in order to save a set of charts thatare selected in your search.
?hcraeS*niWhtiwesuotesabatadaekamIodwoH 55
?snoitanibmoctenalpcificepsfohpargaekamIodwoH 65
?esabatadllufehtotesabatadehtfonoitroptcelesamorfnruterIodwoH 65
?atadtrahcweivIodwoH 65
?esabatadaforedlofelgnisahcraesIodwoH 75
?trahcanisrotcaftnereffideromro2rofhcraesIodwoH 75
?strahclatannistcepsarofhcraesIodwoH 85
?seergedcificepsnistenalprofhcraesIodwoH 85
?esabatadamorfatadtrahctropxeIodwoH 85

56
How do I create a graph for specific planet combinations?
1. Click the Graph button to open a graph of the displayed charts.
2. There are two pull-down menus at the top of the graph screen.The left menu describes the quality being displayed in the graph.For example, Signs, Houses, Aspects, etc.
The right-hand menu shows which planet or point is being graphed.Immediately to the right of that box is a check mark. Click it and abox will open which allows you to choose combinations of planets andpoints to put in the graph.
3. With the desired points selected (in the right pull-down) you canchoose any of the qualities from the left one to quickly displaygraphs of the data.
How do I return to the full database?
You can always return to the complete database by using the View pull-down/View All feature.
1. Click the View pull-down menu.
2. Click View AllView AllView AllView AllView All.
How do I view chart data?
There are two ways: you can click the Chart Data button and see thedata in list form, or you can click on QWheel and see the data in a chartwheel format.
Note: QWheel takes a moment to open with the first chart you choose,but if you keep it open and select other charts, it will give you theinformation very quickly.
1. Highlight any chart in the database.
2. Click the Chart Data button to pop up the chart calculations, or...
3. Click the QWheel button (shown at left) to open the wheel. Makesure QWheel is set to always stay on top.
How do I search from a single folder to a database?

57
You can add other folders to the single folder, “building up” thedatabase as you go.
Here’s how:
1. Open a database in Win*Search (File Pull-down, /Open(Change)Database).
2. Click the View pull-down and select any folder (Family, Friends,Workmates, etc.)
3. Click SeaSeaSeaSeaSearrrrrchchchchch to open the Win*Search Options screen. At thebottom of the screen is a box with “Search All” and “SearchShowing.” Select “Search Showing,” select your search criteria, andclick SSSSSearchearchearchearchearch. The search results will be from the folder (or folders– you can select several folders and they will build) you’ve selected.
How do I search for 2 or more different factors in a chart?
Win*Search allows searches with “And” or “Or.” “And” means that thechart must have both factors requested; “Or” means it has either.
For example, Mars in Capricorn in the 6th house: If you use And, theresulting charts must have Mars in Capricorn and in the 6th house. Ifyou use Or, the resulting charts must have either Mars in Capricorn orMars in the 6th house.
1. From the main Win*Search screen, click the Search button toopen the Win*Search Options menu. Here you can create the searchparameters. For example, to find charts with Mars in Capricorn andin the 6th house, select Mars in the planets list, Capricorn in thesigns and 06 in the houses.
2. In the upper-right corner of the screen select AndAndAndAndAnd, then AddAddAddAddAdd, thenS e a r c hS e a r c hS e a r c hS e a r c hS e a r c h .
3. To find charts with Mars in Capricorn or in the 6th house select OrOrOrOrOrin the upper right corner of the screen, then AddAddAddAddAdd, then SearchSearchSearchSearchSearch.
Note: You could also use this method to do a second search based uponthe results of the previous search. For example, you search an entiredatabase to find everyone with the Moon in Capricorn. You can thensearch from just this list (Moon in Capricorn) by selecting “SearchShowing” for your next search. Search Showing indicates that only thecharts that are currently available in the database grid will be searched.Note that “Search All” is the default setting and that all records in thecurrent database will be searched, even if all are not visible in thedatabase grid. To see all records, click View pull-down/View All.
How do I search for aspects in natal charts?
1. From the main Win*Search screen, click the Search button to openthe Win*Search Options menu.

58
2. Select one planet from the Planets list (at the left) and the otherplanet from the planets listed in the Aspects portion of the menu(at center). At least one planet must be selected in each planet listfor any aspects to be found.
3. Choose your aspect or aspects (you can ask for more than oneaspect at a time).
4. Set the orb value by clicking the Down Arrow in the Orb area ofthe Win*Search Options menu and choosing a value.
5. Click Search and you will get the search results.
How do I search for planets in specific degrees?
1. Click the Search button to open the Win*Search Options menu.
2. Click the Zodiac box so that it’s highlighted. Enter the range ofdegrees to search with the starting degree in the first box and theending degree in the second. You can type in the degrees by signusing the first two letters of the name as an abbreviation(4°AR=4°, etc.) or in 360° notation – where each sign adds 30° –Aries is 0°, Taurus 30°, etc. (For example, 22° Leo would be enteredas 142°). If you type 142° in the input box and then click anywhereoutside that box, the box automatically changes to 22°, etc.
3. Select the planet (or planets) that you want the program to searchfor. Clicking on the horizontal bar below the Planets and Aspectlists allows you to select groups of planets easily, rather thanclicking one at a time.
4. Click Search and you will get the search results.
How do I export chart data from a database?
This feature allows you to export data from the selected chart database(the one showing on the WSearch screen) a .txt file (text file) for spread-sheet analysis or use in another database program. It provides the meansto choose the specific fields (there are 43 fields) to be exported. You canalso choose that the selected field information be restricted to specificplanets. Planets’ positions will be exported in 360° notation, i.e. 15 Ariesas 15, 15 Taurus as 45, 15 Gemini as 75, etc.
How to use:
1. From the File menu of the main Win*Search screen, chooseExport Charts from Database…which opens the Export ChartData dialog.

59
2. The default file name for export is export.txt. Use the BBBBBrrrrrowseowseowseowseowsebutton to select the path/file to save to. (You can type in anyfilename.txt)
3. From the scrollable fields list at left select those fields you wouldlike included in the saved file. Click the AddAddAddAddAdd button to transferselected fields from the left list to the “Export File” list on theright-hand side. If you wish to restrict the data to particularplanets, click the PlanetsPlanetsPlanetsPlanetsPlanets button and choose those planets.
The check box labeled “Field Names” indicates whether the first row inthe file should contain the field names. Many database programs mayexpect this field to be present. If this box is not checked, the first rowwill contain the data for the first chart.
4. When you’ve completed selecting fields for this exportprocedure, click the BeginBeginBeginBeginBegin button to save the data to the selectedfile.

60
The Win*Search Menus
A look at the Win*Search menus:
The following pages describe the Win*Search screen and its menus.This same information is included in the online Help file. Eithersource serves as a reference to the various menu features and will helpuntil they become familiar.
File pull-down
Here is where you can work with the Win*Star database files.
New Database - This opens the “Create New Database” dialog withthe currently selected database file. Use your mouse to click in the filename (filename.mdb) and type in a new name for a database file.
Click OK and the new (empty) database will open, ready to receiveimported charts, etc..
Open (Change) Database - This opens a standard Windows File\Opendialog defaulted to your Win*Star\chartsdb subdirectory. This is whereyour Chart Database files are located. The default database file ismxcharts.mdb (a sample database file containing several notable charts).Win*Star Plus was shipped with one additional database file: circle.mdb(Circle Book of Charts). Select any database file and click OKOKOKOKOK to openthat database into Win*Search.
Export Charts… - This feature allows you to export data from theselected chart database (the one showing on the WSearch screen) as a .txtfile (text file) for spreadsheet analysis or use in another database program.The data is exported in 360° notation. It provides the means to choosethe specific fields (there are 43 fields) to be exported. You can also choosethat the selected field information be restricted to specific planets.
Copy/Backup Database - This feature will allow you to make a copyof the chart database for backup purposes. Use this feature often whenworking with large databases in order to avoid any loss of data.
Compact Database - This feature is provided to save hard-disk space.It can be useful if you have been working with the database for a periodof time during which you may have deleted various charts from thedatabase or performed other actions which can take up disk spacebecause databases necessarily retain portions of deleted charts, etc. Thisfeature will “clean up” the file, economizing disk space.
Repair Database - A database can corrupt in various ways (poweroutages, etc.) resulting in obvious errors, miscalculated data, etc. TheRepair Database feature can correct minor problems and should be usedbefore attempting to recreate the database.
Print - This features allows the user to select specific fields to print.You can select any or all the fields in the database and send the informa-tion to the printer. This will print all records in the database but onlythe fields you have chosen.

61
Charts pull-down
This menu will allow you to work the charts contained in the database.
Show Quick*Wheel - With a chart highlighted, select this option toopen the Quick*Wheel program with the current chart on the screen.
Show Chart Data - Highlight any chart, select this option and acolumnar listing of chart data will appear on your screen.
Select Current Chart (Ctrl+S) - This feature is used to select thecurrently highlight chart to mark for deletion or moving to a folder.
Select All Charts - This is a quick way to select all the charts in adatabase and mark them for deletion or moving to a folder.
Clear All Selections - This feature will “undo” or clear all chartspreviously selected using the options listed above.
Delete Chart(s) (Ctrl+D) - Use this feature to delete either thecurrently selected chart or all charts selected using the options listedabove.
Move Chart(s) to Folder… (Ctrl+M) - This feature will move thecurrently selected chart or all charts selected using the options listedabove.
Edit Chart’s Notes - Add/Delete/Change and Notes you want associ-ated with this chart.
Edit Chart’s Attributes - Allows the user to change the Attributes forthe current chart in order to assign it to a specific category/folder.
Find Chart by Name (Ctrl+F) - Use this feature to quickly findcharts in the database. By typing in a letter the database will search forthe first chart that matches that letter. Continue to type the name of thechart and the search feature will move throughout the database to findthe specific chart.
Edit pull-down
Here you can work with database records:
Edit Attribute List… Use this option to Add/Delete/Rename anAttribute to the current list. You will also be able to globally change anattribute for multiple charts.
Edit Folders… Using this option will all the user to Add/Delete/Rename a Folder to store charts in. You will also be able to moveselected charts from one folder to another with this feature.
Filter Attributes… Use this option to show only those charts with aspecific Attribute assigned. For example, to view only those charts thathave been assigned the Attribute of “Celebrity,” you would select thisfeature and then select the “Celebrity” Attribute. The database will thenshow only those charts with the selected Attribute.
Add New Client… Use this option to add Address information con-cerning your clients. You can also add any additional notes in thissection.
62
Edit Client Data… - This features allows you to edit client informa-tion added using the “Add New Client…” option listed above.
Delete Client… - Delete any client information previously addedusing the “Add New Client…” option listed above.
Write Changes Warning - When you edit any database field a “Yes/No” prompt requires that you confirm the change before it is written tothe database file. This serves to reduce the chance of accidental recordchanges.
Search pull-down
Filter by Name, Date Attributes, Client - Use any one of theseoptions to quickly change the database to show only those charts thatcontain data that the user selects. For example, to view only those chartsthat contain a birth date of 1 October 1950, select the Filter by Dateoption. - You will be able to enter a “Beginning” and “Ending” date,along with other options. Press OKOKOKOKOK and the database will change toshow only those charts that fall within the selected criteria.
Search to Chart… - Select this option to quickly search your chartsfor other charts that have specific aspects in the currently selected chart.
Search to Today… - Select this option to search your charts for othercharts that have specific aspects in “Today’s” chart.
Filter for Zodiac Positions, Aspects - Select either one of theseoptions to quickly search your charts specific Zodiac positions or aspectsthat you choose.
Filter by Astro*Query… (Ctrl+Q) - This selection brings up a dialogbox for advanced searches. Once selected, you may click the help buttonin the Astro*Query window for assistance on the syntax it uses. Thispowerful feature is meant for expert users and should only be attemptedby those who are very familiar with computers and basic programmingconcepts.
View pull-down
The View pull-down is an instant sorting tool built into the Win*Searchdatabase. The program ships with 13 folders and you can create manymore. The Create New Folder option opens an input box where a newfolder can be created (up to 16 characters). With the Edit Folders optionfolders can be deleted or renamed, so that all charts assigned one foldercan be changed to another folder name.
How to use:
Click in the “Folder” field (of the Folder column) of any record in thedatabase. A pull-down menu will appear from which you can select theappropriate folder for the record. When individual records (charts) areassigned a folder, you can then use the View pull-down to instantly sortthe database records to show all records in that folder. Select anotherfolder and charts from that folder combine with the first group. This wayyou can instantly reduce a very large list of charts from many folders tojust the ones you want to see.

63
Sort pull-down
You can sort by the following database fields: Last Name, First Name,Date, Birthday, Place, Longitude, Latitude, and Keyword, Planet and Ad-vanced Sort. Click a file and the database will rearrange on screen, newlysorted by that field. The Planet sort will allow you to select a specificplanet and the Advanced Sort will allow you to create a unique sort fromall the fields in the database.
Layout pull-down
Offered here are layout selections which present different combinations ofthe certain database fields. These layouts can be altered (columns can berearranged) and then saved as a new layout file (extension: .fmt). [Youcannot change the type of fields included in any of the layout selections,but you can change their order.]
Select one of the predefined layouts and make any changes you desireto get the layout you like best.
Menu Buttons
Now a quick look at the buttons spanning above the database records(from left to right):
Quick*Wheel - This presents the currently selected chart on screenin the Win*Star Quick*Wheel format.
Chart Data - This displays the calculated chart data in tabular form– similar to “Positions” button on the Win*Star Home technique bar.
Show Secondary Charts - Click this icon to display all secondarycharts.
Find Name - Same as the “Find by Chart Name (Ctrl+F)” optionexplained previously.
Repaint Grid - Used to repaint the screen if it becomes garbled.
Select Visible Folders - Used to quickly select any or all folders fordisplay.
Show all Folders - Resets the database to show all charts in all folders.
Clear Filters - Used to clear any previously defined filter as explainedin the “Search pull-down” section.
Sort on Column - Select a column and then click this icon to sort thedatabase.
Search - This accesses the Win*Search Options menu where databasesearch parameters are set. See: How Do I Search for 2 or more differentfactors in a chart?

64
Condit. button - This opens the Search Conditions window whichshows the elements of the search in process. As you add conditions to thesearch you can verify their inclusion by clicking this button and viewingthe Search Conditions window.
Graph button - Any chart (or all charts) can be graphed. Just high-light a chart and click the Graph button to display that chart in theWin*Search Graph format for analysis. If you highlight several charts,their data will combine into the results displayed in the graph; i.e. thegraph displays the combined planets, aspects, etc. of all selected charts.
Here’s a look at a Win*Search Graph. This graph drawn from 8 chartsuses “Aspects” as the quality and Mercury as the selected point. The tallcolumn above “Cnj” shows that the most frequent aspect (betweenMercury and another body) occurring in the combined 8 charts is theconjunction. Clicking the Data button reveals that there are 12 Mercuryconjunctions in this batch of 8 charts, and 5 squares, etc.
Here are the various graph features:
Data button
This displays the counts of the data “quality” being displayed. Forexample, if you have one chart in the graph and have selected Houses asthe graph quality and “All Points” as the points being considered, theData button displays the number of points in each house. If there are 5charts in the graph, the Data button adds and displays the combinednumber of points in each house (for all 5 charts), etc.
Graph qualities
Next to the Data button is a pull-down menu (showing “Aspects” in thesample, above) These are the various astrological components, or quali-ties, found in a chart. By selecting one of these qualities – for example,signs – a graph can be drawn displaying occurrences of a chosen point –the planet Jupiter, for example – in the selected chart (or charts). Select adifferent quality to redraw the graph, focused now upon that factor (withrespect to a chosen point).

65
Point Selector
The next pull-down lists the planets and points to be included in thegraph. The default is “All Points.” Make a point selection and the and theSelect Planets menu opens so you can pick additional planets or points,making combinations of them to be graphed.
# of charts
This shows the quantity of charts included in the graph, which are thosecharts currently displayed in the graph.
Win*Search Graph menus
With the two graph menus provided you can choose between a numberof graph styles, save graph data, copy and save graph images and printthe graph:
File pull-down menu
This menu offers choices of loading/saving the graph data and of captur-ing/saving the graph image, itself:
Load Graph Data...
This option opens a file dialog defaulted to the \wstar20 directory.Graphs have .grh extensions ( filename.grh). You select a graph file andclick OK to load and display that graph file.
Save Graph Data...
This option saves the calculated graph data to the \wstar20 directorywith a .grh extension (filename.grh). This file can then be opened via the“Load Graph Data...” option and displayed as a graph.
Graph to Clipboard (bmp or meta)
These features capture the displayed graph to your clipboard in either.bmp or .wmf graphic file format. Use the standard Paste command fromany graphics package to paste and display the captured image.
Save Graph as either a .bmp or .meta file
These features open a standard File Save dialog where you can save thedisplayed graph in either .bmp or .wmf file format to the \wstar20 direc-tory.
Print Graph
This outputs the current graph to your default printer. You can choosebetween Monochrome (Black and White) or Color printing formats.
Graphs pull-down menu
Here you can choose between seven graph styles. Simply make a selectionand the graph will redraw in the selected style. Here are three of thegraphs styles offered (there are 7).
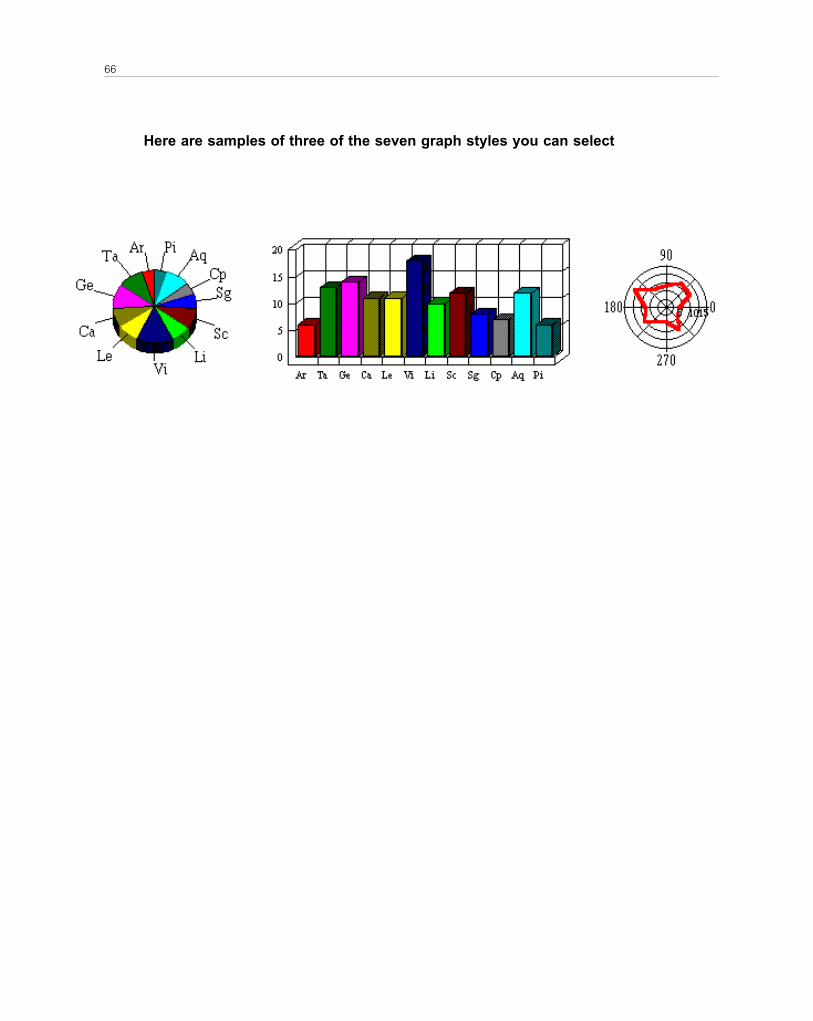
66
Here are samples of three of the seven graph styles you can select
67
Win*Star Graphic Ephemeris
The Graphic Ephemeris in Win*Star is both powerful and elegant. Youcan generate graphs in an incredible combination of coordinate sys-tems, harmonics, planet and point sets, and more. Then you explorethem on-screen or print them out for further reference and study.Here’s a list of features you’ll find in the Time Tables Graphic Ephem-eris:
Select from many graph styles. The program comes with 15 graphformats, but you can create others, name them, and save them to disk.
- Win*Star’s full array of planets, asteroids, midpoints, Lilith andUranian points are included.
- Select time periods and start dates for graphs. This information is alsosaved with your form.
- Display options. You can decide how the graph should look – with orwithout grid lines, color choices and more.
- Printing options; Choose a standard graph or bitmap files.
- Include a natal chart in the graph; select angles to include in the graph
- Select angles and cusps to include in the graph
- Select the zodiac and coordinate system
- Select the type of ephemeris – transit, solar arc, secondary progressed,Naibod or degree-for-a-year
- Time Lines: Click on the Time Line clock to get movable date anddegree line “cross-hairs” which, when moved to any position, tell youthe date and the degree of that astrological event.
How to:
Create a Pre-defined Ephemeris
1. Highlight one of the “Ephemeris Definitions” listed on the fromEphemeris Tab of the Graphic Ephemeris Options menu.
2. Click Select.
3. Select the appropriate starting and ending dates and times for yourephemeris. Realize that long time spans require more calculationtime. For the start date you can either type in any beginning dateor click one of the six radio buttons, using one of the suppliedstarting points. For the ending date, either type in a date or use thetwo selectors offered to create an ending date based on a numberof days, months, years, etc.
4. Use the other tabs (Planets, Style, Calc. Options & Natal) tomake additional changes.
5. Click OK. The ephemeris will calculate and display on screen.Refer to “How to Use the Ephemeris” for further tips.

68
Create Your Own Ephemeris
A custom graphic ephemeris can be created by combining settingsfrom the various menus accessible by clicking these tabs in theGraphic Ephemeris Options menu. Changes can be made as you designyour ephemeris until you click OKOKOKOKOK. (When OK is clicked, the ephemeriswill automatically generate.)
Here’s how:
1. (You’re going to “build” an ephemeris from scratch.) You can dothis by starting with an existing ephemeris definition (highlightone, and click Select) and editing it to your specification, or you canstart with the first “Ephemeris” tab, make your selections, andcontinue from tab to tab, until you have fashioned the ephemeris asyou want it.
Either way, you will be making all the decisions – the start and end times(from the “Ephemeris” tab); the planets & points included, the coordinatesystem and the Dial type (the “Planets” tab), and so forth.
2. You will want to type in a new name for your ephemeris definition.Just click in the ephemeris name box, delete the existing name, andtype a new one.
3. When you have made all selections, click the Save button and yournewly created ephemeris will appear added to the “EphemerisDefinitions” list.
4. Click OK to calculate your ephemeris and display it on screen.
How to use the Graphic Ephemeris:
After you have created an ephemeris, it will appear something like thegraphic shown on the next page. To examine the details of your graph onthe screen more easily there are two steps you can take:
1. Maximize the graph to fill the screen for greater visibility.
2. Click on the Time Line clock and then click within the graph areato obtain cross-hair lines. The vertical line identifies the date. Thehorizontal line has a button on the left, which shows degrees andminutes.
Using this set of lines, you can zero in on important intersection on yourgraph. Because it is not easy to track vertically with all the sloping linesin a graph, this set of red lines allows you to instantly identify the dateand degree of a contact without straining your eyes. You can click anddrag either of these Time Lines or you can click right in the graph andthey will align with that point.
(Note: In some long-term ephemerides there may be a slight deviationbetween the date scale on top of the graph and the date indicated by theTime Line. Rely on the Time Line for the most accurate reading.However, in a long-term ephemeris graph the width of one dot can cover

69
weeks of time. Pinpoint work is easier using graphs covering days,weeks or months, not decades.)
Here are some user tips:
1. You can make selections which would result in an unreadablegraph. Fortunately, many of these choices are automatically avoidedby the program. For example, if you call for Moon transits (whichcould generate a solid black graph) the program will not drawthose lines. If you find you have generated a graph on screen and ittakes many minutes to print, it may be that the printer isattempting to print such a line. You can cancel the graph, simplifyit, then run it again.
2. Use the “Natal” tab to select a natal chart to incorporate into yourgraph. You can also identify the natal planets and points you wishto see on the graph by select a natal chart to incorporate into yourgraph by clicking an “xxxxx” in the “Plot Natal Positions” box, and thenatal planets (and points) will appear at the far right of the graph,aligned with the horizontal dot/dash lines, making it easier to trackcontacts with the transit, progressed or solar arc lines.
The points of intersection between transits, progressions and directedplanets and these dotted lines will indicate conjunctions (in a 360 dial)or all hard aspects in 22.5, 45 and 90 degree dials.
3. Do not try to use fast-moving planets in long time ranges. Thelogic: In 90 years the Sun will cross from top to bottom (of thegraph) 90 times by transit, hence 90 lines will be presented onscreen. The same is true for Mercury and Venus, half so for Mars,and over 1000 lines for the Moon!
4. The program will only allow you to select up to 30 midpoints at atime. If you select more, the program will calculate up to its limit

70
and omit the rest. You have the flexibility to select midpointsone at a time or in groups, or ranges. If you want midpoints ofthe inner planets, use shorter time periods. For longer-termgraphs, (a year or more) use outer planet midpoints instead.
5. Experiment with the variables to obtain the kind of graph youwant. When you find a new arrangement that you like, rememberto name it and save it for use again later.
6. A graphic ephemeris makes serious demands on a printer. If you arehaving problems printing graphs, you can try several things. Seethe “Planets” tab for ways to reduce the amount of material in yourgraph by removing vertical or horizontal grid lines. Printing a bitmap (using Print Form rather than Print) will solve printerlimitation problems, but will produce an image with less detail. Ifyour printer is set up in Landscape format (preferable for wideforms like these graphs), and you can’t print the entire page, selectthe Portrait format in Print Setup, which should resolve thisproblem. This results in a smaller graph, but it will print moreeasily. You can also use Print Setup (Options pull-down) and selecta lower dpi (dots per inch) to give your printer more breathingroom. Each item in the graph is a separate object, so the program issending dozens of objects to the printer, not just one big picture.Because of this, you may need to apply some of these strategies ifyour printer is not printing the entire graph correctly.
7. When calculating many transiting points in a graph, the glyphs forthem along the left side of the graph may not line up with theiractual positions, due to crowding. They do match by color,however. The planet’s lines are the same color as the planet. Thisway, even if the glyphs are rather far from the lines, you can matchthem in order, starting with a planet line you recognize by color.This can be particularly useful with midpoints. You may notice thatthe Venus/Jupiter midpoint is listed just below Mars on the left.Therefore, the horizontal line below that of Mars will indicate theVenus/Jupiter position.
8. A daily graph with transiting house cusps can be used for timingevents. For people who watch daily cycles for purposes ofspeculation, electional charts, etc., this is a fantastic tool!
9. You know precisely when a planet changes house during the day.Try this with known events and several house systems to see whichone works best for you.
10. You probably want to set up the graphic ephemeris for your localityand time zone. The location portion of the Calc Options tab is verysimilar to the location-input area of the Enter Chart Data screenin Win*Star.
11. If you use life diagrams or if you would like to see yourprogressions unfold over long time periods, the GraphicEphemeris is your tool. Detailed directions for each piece of theprocess follow; generally you choose the “Dial” on the “Planets”

71
page for the kind of sort you want, choose the kind ofprogressions under the “Positions” option, and choose the graphdetails on the “Ephemeris” page. You can save the graph formfor future use.
12. Choosing “Print Form” under the File menu of your finishedgraph will produce a bitmapped image that may be less detailedthan one directly printed (“Print”), but that this can resolveproblems with printers that lack sufficient memory. (If you’vegot an inkjet printer this shouldn’t apply to you.)
13. Dots on the map indicate ingress points where planets arechanging signs.
14. Three special points are included as options in the GraphicEphemeris: the Solar Node, Solar Apex and Galactic Center. TheSolar Node’s symbol is that of the Sun (circle with the dot in themiddle) with a horizontal conjunction symbol below it. Thesymbol for the Solar Apex is the Sun followed by a vertical “v.” TheGalactic Center is symbolized by an oval with a cross through it.These three points are used in the graphs produced by theCosmobiology school of astrology.
15. Should you encounter a “STOP STATEMENT” message at anytime while creating your ephemeris, simply close the program(and Win*Star, if it’s open) and re-boot your computer.
A look at the pull-down menus:
File pull-down
New Ephemeris - Access the “Ephemeris” tab (to create a newephemeris ).
Load - For opening a saved ephemeris file.
Save As… - For saving the current ephemeris file toC:\WSTAR20\greph\filename.gre
Print - This prints ephemeris as shown on the screen. This is theclearest printing choice, but can cause memory problems in someprinters.
Print Form - Prints a bitmap (graphic) image of the form shown on thescreen. This feature works for desktop publishing and as a printingalternative when memory constraints cause printing problems.
Print Setup… - Change printers or make standard print setup choices.

72
Win*Star’s “Publisher’s Assistant”
Win*Star Publisher’s Assistant serves as a reliable tool to use whensaving individual Win*Star chart wheels in a variety of graphic fileformats. Wheels can be easily re-sized for cut & paste or file insertionusing your favorite word processor or graphics program. Publisher’sAssistant can be used alone (saving memory) or with Win*Star open.Either way, it accesses your active chart files, and their associated chartforms (those appearing in the Chart Forms list).
How to use:
1. To access the Publisher’s Assistant, click the Plus pull-downmenu (at the top of the main Win*Star menu) and highlight“Publisher’s Assistant.”
2. Highlight the chart form that you wish saved as a file. (This willbe one of your previously calculated charts, attached to any ofyour active charts.)
3. The highlighted wheel will appear in the view area in its originalsize – as designed to fit on an 8½” x 11" sheet of paper. It can besaved to file as is. The Publisher’s Assistant screen has three pushbuttons for quick and easy file saving. Each accesses a standardWindows File-Save dialog, presenting your hard drive directories:
- The Save Meta button does the same for quick saving as a meta filetype (filename.WMF).
- The Save BMP button will present this dialog with Bitmap Files(filename.BMP) already selected in the “Save file as type:” section of thedialog.
- The Save As button pops up the normal file-save dialog. Choosebetween a wide variety of graphic file formats (18 offered) for savingcharts.
Both the Save BMP and Save As features can also be accessed from theFile pull-down menu. The Clip pull-down menu is for copying the imageto the your clipboard. You can copy in either bitmap or metafile format.
To re-size:
1. The “Output Size in Inches:” portion of the menu shows the widthand height of the current wheel. You can type in your desiredmeasurements and the wheel will re-size to those dimensions (in theAuto Adjustment menu area; the “None” Auto Adjustment radiobutton will remain selected.)
2. With “Adjust to Width” selected, you can type in an width and thewheel will re-size using that width while creating the appropriatelength to maintain the original wheel proportions.
3. With “Adjust to Length” selected, you can type in any length andthe wheel will re-size using that length while creating theappropriate width to maintain the original wheel proportions.

73
You will find the wheels will generally remain more legible andproportionate when re-sized using an auto adjustment setting (eitherlength or width).
This manual represents “the tip of the iceberg” in fully using yourWinStar software. Additional information and detailedinstructions for using the full range of astrological tools in thisprogram will be found in your on-screen help files and in theDigital Manual you received with your software.
In addition to those helpful guides with your purchase cameMatrix free lifetime technical support and the full support ofMatrix Software’s excellent Technical Support Staff. They canguide you through any technique and answer any questions youmay have. Before calling, have your computer on and the programon-screen. We also suggest that you have a list of the questions youwant to ask and a pen and paper for any notes you might want totake. You can reach Technical Support at: 231-527-2602. Hoursare Monday through Friday 8:00 a.m. to 5:00 p.m. EST
You can also email your question to:[email protected]
Emails, as with any contact from a customer become the priorityof our entire staff.
Thank you for purchasing WinStar. Enjoy this wonderful program.
Sincerely,
All of us at Matrix

74
Appendix A - Atlas Information
State Abbreviations:
AL Alabama
AK Alaska
AZ Arizona
AR Arkansas
CA California
CO Colorado
CT Connecticut
DE Delaware
DC Dist. of Columbia
FL Florida
GA Georgia
HI Hawaii
ID Idaho
IL Illinois
IN Indiana
IA Iowa
KS Kansas
KY Kentucky
LA Louisiana
ME Maine
MA Massachusetts
MI Michigan
MN Minnesota
MO Missouri
MT Montana
NE Nebraska
NV Nevada
NH New Hampshire
NJ New Jersey
NM New Mexico
NY New York
NC North Carolina
ND North Dakota
OH Ohio
OK Oklahoma
OR Oregon
PA Pennsylvania
PR Puerto Rico
RI Rhode Island
SC South Carolina
SD South Dakota
TN Tennessee
TX Texas
UT Utah
VT Vermont
VA Virginia
WA Washington
WV West Virginia
WI Wisconsin
WY Wyoming

75
Country/State Abbreviations
AB Alberta CAM Cameroon
AFG Afghanistan CAMB Cambodia
ALB Albania CAR Central African Rep.
ALG Algeria CAYI Cayman Islands
ANG Angola CHAD Chad
AND Andorra CHILE Chile
ANGU Anguilla CHINA China
ARG Argentina CISK Ciskei
ASAM American Samoa CKIS Cook Islands
ATG Antigua COL Columbia
AUS Austria COMI Comoro Islands
AUSTL Australia CONGO Congo
BA Bahamas CR Costa Rica
BAHR Bahrain CUBA Cuba
BANG Bangladesh CV Cape Verde Islands
BARB Barbados CYP Cyprus
BC British Columbia CZEC Czechoslovakia
BDI Burundi DEN Denmark
BEL Belgium DOM Dominica
BENIN Benin DR Dominican Republic
BER Bermuda EC Ecuador
BHU Bhutan EGYPT Egypt
BKF Burkina Fasso ELS El Salvador
BLZ Belize ENG England
BOL Bolivia EQGU Equatorial Guinia
BOPH Bophuthatswana ETH Ethiopia
BOTS Botswana FIJI Fijii
BRU Brimeo FIN Finland
BRZ Brazil FLI Falkland Islands
BULG Bulgaria FR France
BURMA Burma FRGU French Guina
CAM Cameroon FRI Faero Islands
CAMB Cambodia FRPO French Polynesia
CAR Central African Rep. GABON Gabon

76
GAM Gambia KIRI Kiribati
GER Germany KOR_N Korea, North
GHANA Ghana KOR_S Korea, South
GIB Gibraltar KUW Kuwait
GRC Greece LAOS Laos
GREN Grenada LEB Lebanon
GRNL Greenland LESO Lesotho
GUAD Guadeloupe LIBR Liberia
GUAM Guam LIBYA Libya
GUAT Guatemala LICT Liechtenstein
GUBI Guinia-Bissau LUX Luxembourg
GUER Guernsey MACAU Macau
GUIN Guinea MADA Madagascar
GUY Guyana MALD Maldive Islands
HAITI Haiti MALI Mali
HK Hong Kong MALTA Malta
HON Honduras MALW Malawi
HUN Hungary MART Martinique
ICE Iceland MAUR Mauritania
IMAN Isle of Man MAUS Mauritius
INDIA India MAYT Mayotte
INDSA Indonesia MB Manitoba
IRAN Iran MEX Mexico
IRAQ Iraq MIDW Midway Islands
IRE Ireland MLYS Maylasia
IRE_N Ireland, North MNTS Montserrat
ISRL Israel MONACO Monaco
ITALY Italy MONG Mongolio
IVC Ivory Coast MOR Morocco
JAM Jamaica MOZ Mozambique
JAPAN Japan NAM Nambia
JER Jersey NANT Netherlands Antilles
JIB Djibouti NAURU Nauru
JOR Jordan NB New Brunswick
KENYA Kenya NCAL New Caledonia

77
NEPAL Nepal SEY Seychelles
NETH Netherlands SGEO South Georgia
NF Newfoundland SING Singapore
NIC Nicaragua SK Saskatchewan
NIG Nigeria SL Somalia
NIGER Niger SLAN Sri Lanka
NIUE Niue SMAR San Morino
NOR Norway SOLIS Solomon Islands
NORF Norfolk Island SOM Somalia
NS Nova Scotia SPAIN Spain
NT Northwest Territory STHEL St. Helena
NZ New Zealand STKN St. Kitts-Nevis
OMAN Oman STLU St. Lucia
ON Ontario STPM St. Pierre & Miquelon
PAK Pakistan STVI St. Vincent
PAN Panama SUDAN Sudan
PAPUA Papua SUR Surinam
PAR Paraguay SWAZ Swaziland
PE Prince Edward Island SWED Sweden
PERU Peru SWTZ Switzerland
PHIL Philippines SYRIA Syria
PIT Pitcairn TAIW Taiwan
PITT Pacific Islands Trust Territory TANZ Tanzania
POL Poland TCI Turks & Caicos Islands
PORT Portugal THAI Thailand
PR Puerto Rico TOGO Togo
QATAR Qatar TOK Tokelau Islands
QUEBEC Quebec TONGA Tonga
REU Reunion TRIN Trinidad & Tobago
ROM Romania TRNSK Transkei
RW Rwanda TUN Tunisia
SAFR South Africa TUR Turkey
SAOT Sao Tome & Principe TUV Tuvalu Islands
SAUDI Saudi Arabia UAE United Arab Emerites
SCOT Scotland UG Uganda
SEN Senegal UR Uruguay

78
VENDA Venda
VI Virgin Islands
VIET Vietnam
WAKE Wake Island
WALES Wales
WALF Wallis & Futuna
WSAM Western Samoa
YEM_N Yemen, North
YEM_S Yemen, South
YK Yukon Territory
YUG Yugoslavia
ZAIRE Zaire
ZAM Zambia
ZIM Zimbabwe

79
Index
A
aspect sets, changing .......................................... 14Astro*Clock ....................................................... 46Astro-cartography .............................................. 42atlas, using ........................................................ 18atlas abbreviations (US) ..................................... 74
B
backup ............................................................. 28bi/triwheel ........................................................ 40birth time ......................................................... 11
C
calculation options ........................................... 12chart forms, assigning to buttons ...................... 26, 31color options ..................................................... 7creating a natal chart .......................................... 9charts, viewing .................................................. 12Chart Database ................................................. 26chart forms ........................................................ 23Chart Form Options menu ................................ 24
D
Data View ......................................................... 12DayScan ........................................................... 46date entry ......................................................... 10,17data input options ............................................. 6database ............................................................ 26-28default wheels, changing .................................... 21delete charts ...................................................... 13directed charts, casting ....................................... 30
E
ephemeris, creating your own ............................. 49exporting chart data .......................................... 58
G
Graphic Ephemeris, Win*Star Plus ..................... 67
I
Importing chart files (from other programs) ........ 17Installation ........................................................ 1
L
logo, user options .............................................. 7locational astrology (maps techniques) ................ 42Local space technique ........................................ 43Lunation chart, casting ...................................... 31
M
mundane maps ................................................. 42
O
Options menu ................................................... 5
P
planets / points in the chart ................................ 15planets / points, setting defaults ......................... 16printing a chart ................................................. 12progressed charts ............................................... 30Publisher’s Assistant (Win*Star Plus) ................... 72
R
rectification ....................................................... 45repair job database ............................................. 28return charts ...................................................... 31
S
searches ............................................................. 33searching for aspects (Win*Search) ...................... 58Searches Menu .................................................. 34Search Show menu ............................................ 37search types ....................................................... 35secondary charts to primary ................................ 30Select Chart Forms menu, described ................... 23Synastry techniques ........................................... 40
T
technical support ............................................... 73TimeScan .......................................................... 47TimeTables Ephemeris Generator ...................... 48transit charts ...................................................... 30
U
user ad page, accessing ...................................... 18
H
house systems, changing .................................... 23How Do I’s ....................................................... 14